Zip Codes with the Highest Percentage of Population Employed in Life, Physical & Social Science in Lakeland, FL

RELATED REPORTS & OPTIONS

Life, Physical & Social Science
Population
Families and Households
Female Fertility
Female Fertility (Unmarried)
Race (Community Size)
Race (Percentage)
Ancestry (Community Size)
AfricanAmericanArabArmenianAustralianAustrianBahamianBangladeshiBarbadianBelgianBelizeanBhutaneseBlackfeetBolivianBrazilianBritishBritish West IndianBurmeseCanadianCape VerdeanCelticCentral AmericanCentral American IndianCherokeeChileanChippewaChoctawColombianCosta RicanCreekCroatianCubanCzechCzechoslovakianDanishDominicanDutchEastern EuropeanEcuadorianEnglishEuropeanFilipinoFinnishFrenchFrench CanadianGermanGreekGuamanian / ChamorroGuatemalanGuyaneseHaitianHonduranHungarianIcelanderIndian (Asian)IranianIrishItalianJamaicanJapaneseKoreanLaotianLebaneseLiberianLithuanianMalaysianMexicanMoroccanNative HawaiianNavajoNicaraguanNigerianNorthern EuropeanNorwegianPakistaniPalestinianPanamanianPennsylvania GermanPeruvianPolishPortuguesePuerto RicanRomanianRussianSalvadoranScandinavianScotch-IrishScottishSeminoleSerbianSlavicSlovakSloveneSouth AfricanSouth AmericanSouth American IndianSpaniardSpanishSri LankanSubsaharan AfricanSwedishSwissSyrianThaiTrinidadian and TobagonianU.S. Virgin IslanderUkrainianUruguayanVenezuelanWelshWest IndianYugoslavian
Ancestry (Percentage)
AfricanAmericanArabArmenianAustralianAustrianBahamianBangladeshiBarbadianBelgianBelizeanBhutaneseBlackfeetBolivianBrazilianBritishBritish West IndianBurmeseCanadianCape VerdeanCelticCentral AmericanCentral American IndianCherokeeChileanChippewaChoctawColombianCosta RicanCreekCroatianCubanCzechCzechoslovakianDanishDominicanDutchEastern EuropeanEcuadorianEnglishEuropeanFilipinoFinnishFrenchFrench CanadianGermanGreekGuamanian / ChamorroGuatemalanGuyaneseHaitianHonduranHungarianIcelanderIndian (Asian)IranianIrishItalianJamaicanJapaneseKoreanLaotianLebaneseLiberianLithuanianMalaysianMexicanMoroccanNative HawaiianNavajoNicaraguanNigerianNorthern EuropeanNorwegianPakistaniPalestinianPanamanianPennsylvania GermanPeruvianPolishPortuguesePuerto RicanRomanianRussianSalvadoranScandinavianScotch-IrishScottishSeminoleSerbianSlavicSlovakSloveneSouth AfricanSouth AmericanSouth American IndianSpaniardSpanishSri LankanSubsaharan AfricanSwedishSwissSyrianThaiTrinidadian and TobagonianU.S. Virgin IslanderUkrainianUruguayanVenezuelanWelshWest IndianYugoslavian
Immigrant Origin (Total)
Immigrant Origin (Percentage)
Income
Income (Families)
Income (Households)
Poverty
Poverty (Families)
Unemployment
Employment Occupations
Employment Industries
Employer Class
Commute Time
Commute Means
School Enrollment
Education by Degree Field
Occupancy
Finances
Physical Characteristics
Lakeland
States
Florida Cities
Altamonte SpringsApopkaBoca RatonBonita SpringsBoynton BeachBradentonBrandonBrooksvilleCape CoralCasselberryClearwaterClermontCocoaCoral SpringsCrestviewDade CityDavenportDaytona BeachDeerfield BeachDefuniak SpringsDelray BeachDeltonaDunnellonEnglewoodEustisFort LauderdaleFort MyersFort PierceFort Walton BeachGainesvilleGulf BreezeHialeahHolidayHollywoodHomesteadHudsonInvernessJacksonvilleJupiterKissimmeeLake CityLake WorthLakelandLand O LakesLargoLehigh AcresLongwoodLutzMelbourneMerritt IslandMiamiMiami BeachMiltonNaplesNew Port RicheyNew Smyrna BeachNorth PortOcalaOkeechobeeOrange ParkOrlandoOrmond BeachOviedoPalm BayPalm Beach GardensPalm CoastPalm HarborPanama CityPanama City BeachPensacolaPinellas ParkPlant CityPompano BeachPort CharlottePort OrangePort Saint LuciePunta GordaQuincyRiverviewSaint AugustineSaint CloudSaint PetersburgSanfordSarasotaSebastianSebringSeminoleSpring HillStuartTallahasseeTampaTarpon SpringsThe VillagesTitusvilleValricoVeniceVero BeachWesley ChapelWest Palm BeachWinter HavenWinter ParkZephyrhills
Compare Zip Codes
Comparison Subject

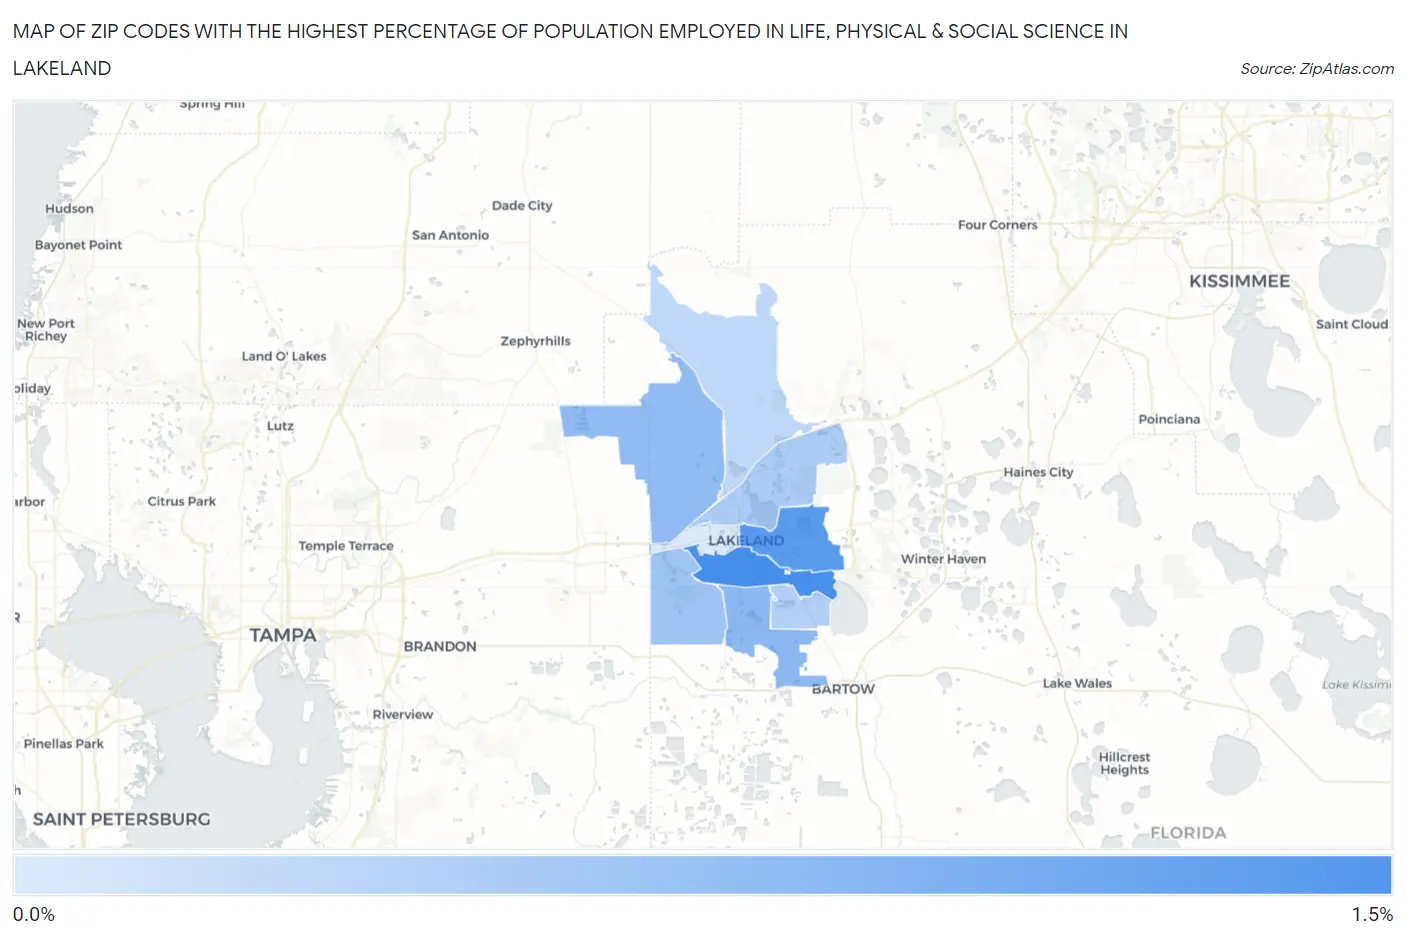
Map of Zip Codes with the Highest Percentage of Population Employed in Life, Physical & Social Science in Lakeland

0.0%
1.5%
Zip Codes with the Highest Percentage of Population Employed in Life, Physical & Social Science in Lakeland Map

Zip Codes with the Highest Percentage of Population Employed in Life, Physical & Social Science in Lakeland, FL

Zip Code % Employed vs State vs National
1.338031.3%0.67%(+0.665)#1261.1%(+0.243)#6,567
2.338011.2%0.67%(+0.536)#1481.1%(+0.114)#7,454
3.338130.77%0.67%(+0.103)#2741.1%(-0.319)#11,289
4.338100.75%0.67%(+0.077)#2871.1%(-0.345)#11,559
5.338110.62%0.67%(-0.050)#3781.1%(-0.472)#13,058
6.338050.52%0.67%(-0.149)#4271.1%(-0.571)#14,270
7.338120.46%0.67%(-0.208)#4661.1%(-0.630)#15,012
8.338090.37%0.67%(-0.296)#5421.1%(-0.718)#16,100
9.338150.13%0.67%(-0.540)#7121.1%(-0.962)#18,863

Common Questions

What are the Top 5 Zip Codes with the Highest Percentage of Population Employed in Life, Physical & Social Science in Lakeland, FL?
Top 5 Zip Codes with the Highest Percentage of Population Employed in Life, Physical & Social Science in Lakeland, FL are:
#1
1.3%
#2
1.2%
#3
0.77%
#4
0.75%
#5
0.62%
What zip code has the Highest Percentage of Population Employed in Life, Physical & Social Science in Lakeland, FL?
33803 has the Highest Percentage of Population Employed in Life, Physical & Social Science in Lakeland, FL with 1.3%.
What is the Percentage of Population Employed in Life, Physical & Social Science in Lakeland, FL?
Percentage of Population Employed in Life, Physical & Social Science in Lakeland is 0.89%.
What is the Percentage of Population Employed in Life, Physical & Social Science in Florida?
Percentage of Population Employed in Life, Physical & Social Science in Florida is 0.67%.
What is the Percentage of Population Employed in Life, Physical & Social Science in the United States?
Percentage of Population Employed in Life, Physical & Social Science in the United States is 1.1%.