Zip Codes with the Highest Percentage of Population with a Degree in Literature and Languages in Lakeland, FL

RELATED REPORTS & OPTIONS

Literature and Languages
Population
Families and Households
Female Fertility
Female Fertility (Unmarried)
Race (Community Size)
Race (Percentage)
Ancestry (Community Size)
AfricanAmericanArabArmenianAustralianAustrianBahamianBangladeshiBarbadianBelgianBelizeanBhutaneseBlackfeetBolivianBrazilianBritishBritish West IndianBurmeseCanadianCape VerdeanCelticCentral AmericanCentral American IndianCherokeeChileanChippewaChoctawColombianCosta RicanCreekCroatianCubanCzechCzechoslovakianDanishDominicanDutchEastern EuropeanEcuadorianEnglishEuropeanFilipinoFinnishFrenchFrench CanadianGermanGreekGuamanian / ChamorroGuatemalanGuyaneseHaitianHonduranHungarianIcelanderIndian (Asian)IranianIrishItalianJamaicanJapaneseKoreanLaotianLebaneseLiberianLithuanianMalaysianMexicanMoroccanNative HawaiianNavajoNicaraguanNigerianNorthern EuropeanNorwegianPakistaniPalestinianPanamanianPennsylvania GermanPeruvianPolishPortuguesePuerto RicanRomanianRussianSalvadoranScandinavianScotch-IrishScottishSeminoleSerbianSlavicSlovakSloveneSouth AfricanSouth AmericanSouth American IndianSpaniardSpanishSri LankanSubsaharan AfricanSwedishSwissSyrianThaiTrinidadian and TobagonianU.S. Virgin IslanderUkrainianUruguayanVenezuelanWelshWest IndianYugoslavian
Ancestry (Percentage)
AfricanAmericanArabArmenianAustralianAustrianBahamianBangladeshiBarbadianBelgianBelizeanBhutaneseBlackfeetBolivianBrazilianBritishBritish West IndianBurmeseCanadianCape VerdeanCelticCentral AmericanCentral American IndianCherokeeChileanChippewaChoctawColombianCosta RicanCreekCroatianCubanCzechCzechoslovakianDanishDominicanDutchEastern EuropeanEcuadorianEnglishEuropeanFilipinoFinnishFrenchFrench CanadianGermanGreekGuamanian / ChamorroGuatemalanGuyaneseHaitianHonduranHungarianIcelanderIndian (Asian)IranianIrishItalianJamaicanJapaneseKoreanLaotianLebaneseLiberianLithuanianMalaysianMexicanMoroccanNative HawaiianNavajoNicaraguanNigerianNorthern EuropeanNorwegianPakistaniPalestinianPanamanianPennsylvania GermanPeruvianPolishPortuguesePuerto RicanRomanianRussianSalvadoranScandinavianScotch-IrishScottishSeminoleSerbianSlavicSlovakSloveneSouth AfricanSouth AmericanSouth American IndianSpaniardSpanishSri LankanSubsaharan AfricanSwedishSwissSyrianThaiTrinidadian and TobagonianU.S. Virgin IslanderUkrainianUruguayanVenezuelanWelshWest IndianYugoslavian
Immigrant Origin (Total)
Immigrant Origin (Percentage)
Income
Income (Families)
Income (Households)
Poverty
Poverty (Families)
Unemployment
Employment Occupations
Employment Industries
Employer Class
Commute Time
Commute Means
School Enrollment
Education by Degree Field
Occupancy
Finances
Physical Characteristics
Lakeland
States
Florida Cities
AlachuaAltamonte SpringsApopkaArcadiaBoca RatonBonita SpringsBoynton BeachBradentonBrandonBrooksvilleCape CoralCasselberryClearwaterClermontCocoaCoral SpringsCrestviewCrystal RiverDade CityDavenportDaytona BeachDeerfield BeachDelandDelray BeachDeltonaDunnellonEdgewaterEnglewoodEustisFort LauderdaleFort MyersFort PierceFort Walton BeachGainesvilleGulf BreezeHialeahHolidayHollywoodHomesteadHomosassaHudsonInvernessJacksonvilleJupiterKissimmeeLake CityLake WalesLake WorthLakelandLand O LakesLargoLeesburgLehigh AcresLive OakLongwoodLutzMelbourneMerritt IslandMiamiMiami BeachMiltonNaplesNew Port RicheyNew Smyrna BeachNorth Fort MyersNorth PortOcalaOkeechobeeOpa LockaOrange ParkOrlandoOrmond BeachOviedoPalm BayPalm Beach GardensPalm CoastPalm HarborPanama CityPanama City BeachPensacolaPerryPinellas ParkPlant CityPompano BeachPort CharlottePort OrangePort Saint LuciePunta GordaRiverviewSaint AugustineSaint CloudSaint PetersburgSanfordSarasotaSebastianSebringSeminoleSpring HillStuartTallahasseeTampaTarpon SpringsThe VillagesTitusvilleValricoVeniceVero BeachWesley ChapelWest Palm BeachWinter HavenWinter ParkZephyrhills
Compare Zip Codes
Comparison Subject

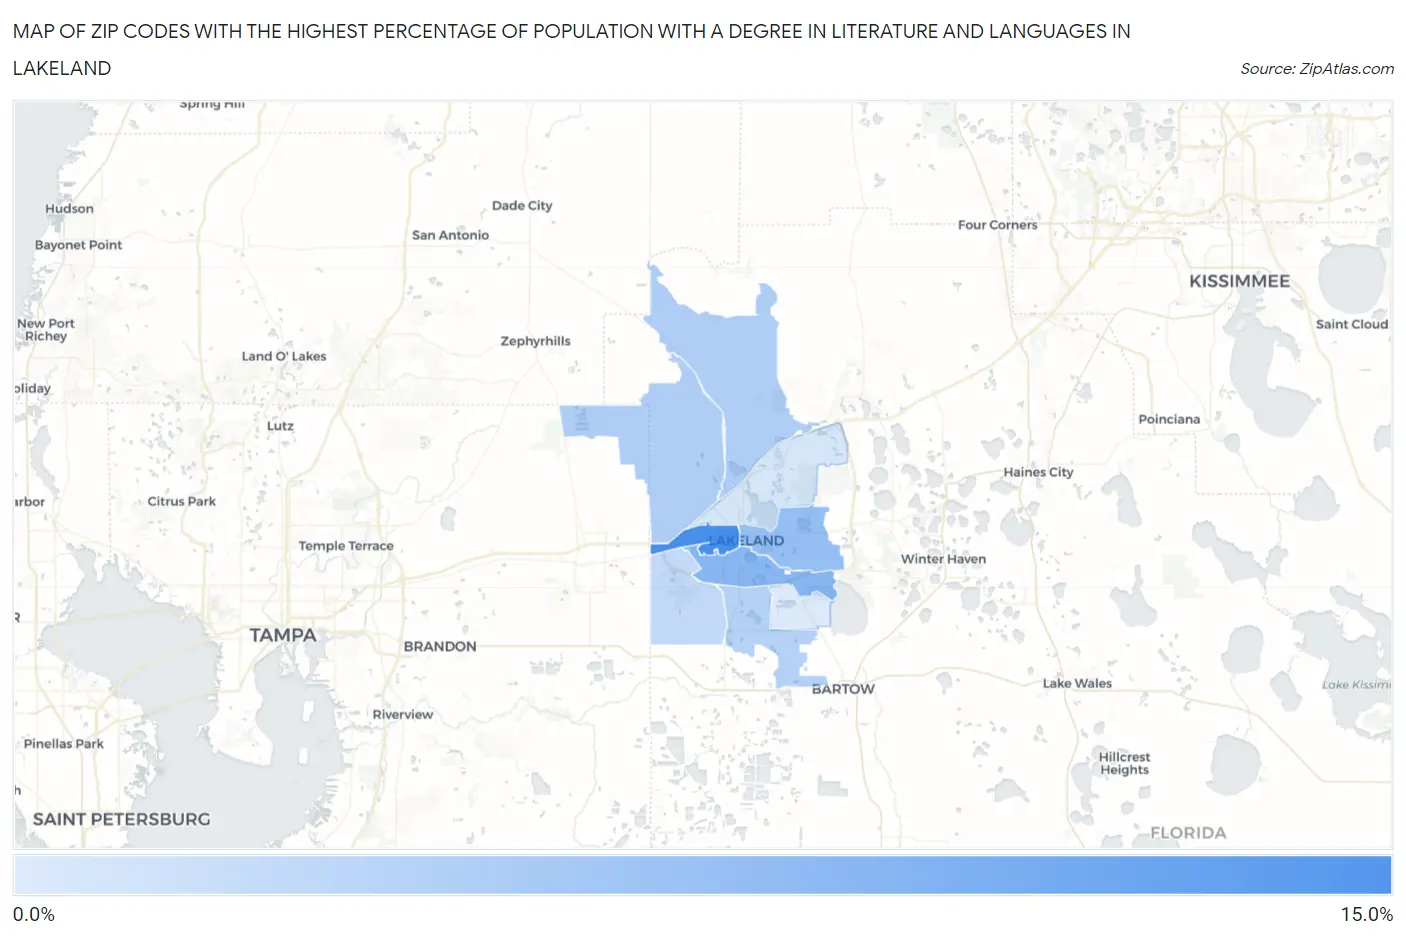
Map of Zip Codes with the Highest Percentage of Population with a Degree in Literature and Languages in Lakeland

0.0%
15.0%
Zip Codes with the Highest Percentage of Population with a Degree in Literature and Languages in Lakeland Map

Zip Codes with the Highest Percentage of Population with a Degree in Literature and Languages in Lakeland, FL

Zip Code % Graduates vs State vs National
1.3381511.3%3.4%(+7.86)#134.4%(+6.85)#1,393
2.338036.3%3.4%(+2.90)#714.4%(+1.89)#4,934
3.338015.4%3.4%(+2.00)#1194.4%(+0.995)#6,509
4.338093.5%3.4%(+0.148)#3794.4%(-0.860)#11,678
5.338103.5%3.4%(+0.132)#3814.4%(-0.876)#11,735
6.338132.9%3.4%(-0.464)#4904.4%(-1.47)#13,777
7.338112.2%3.4%(-1.25)#6214.4%(-2.25)#16,541
8.338050.69%3.4%(-2.71)#8144.4%(-3.72)#20,872
9.338120.22%3.4%(-3.18)#8354.4%(-4.19)#21,618

Common Questions

What are the Top 5 Zip Codes with the Highest Percentage of Population with a Degree in Literature and Languages in Lakeland, FL?
Top 5 Zip Codes with the Highest Percentage of Population with a Degree in Literature and Languages in Lakeland, FL are:
#1
11.3%
#2
6.3%
#3
5.4%
#4
3.5%
#5
3.5%
What zip code has the Highest Percentage of Population with a Degree in Literature and Languages in Lakeland, FL?
33815 has the Highest Percentage of Population with a Degree in Literature and Languages in Lakeland, FL with 11.3%.
What is the Percentage of Population with a Degree in Literature and Languages in Lakeland, FL?
Percentage of Population with a Degree in Literature and Languages in Lakeland is 4.6%.
What is the Percentage of Population with a Degree in Literature and Languages in Florida?
Percentage of Population with a Degree in Literature and Languages in Florida is 3.4%.
What is the Percentage of Population with a Degree in Literature and Languages in the United States?
Percentage of Population with a Degree in Literature and Languages in the United States is 4.4%.