Zip Codes with the Highest Percentage of Population Employed in Life, Physical & Social Science in Cape Coral, FL

RELATED REPORTS & OPTIONS

Life, Physical & Social Science
Population
Families and Households
Female Fertility
Female Fertility (Unmarried)
Race (Community Size)
Race (Percentage)
Ancestry (Community Size)
AfricanAmericanArabArgentineanArmenianAustrianBelgianBhutaneseBlackfeetBolivianBrazilianBritishBulgarianBurmeseCanadianCentral AmericanCentral American IndianCherokeeChileanChippewaColombianCosta RicanCroatianCubanCzechCzechoslovakianDanishDominicanDutchEastern EuropeanEcuadorianEnglishEuropeanFinnishFrenchFrench CanadianGermanGreekGuatemalanHaitianHonduranHungarianIcelanderIndian (Asian)IranianIraqiIrishIsraeliItalianJamaicanKoreanLatvianLebaneseLithuanianMexicanMoroccanNative HawaiianNicaraguanNorwegianPakistaniPanamanianPennsylvania GermanPeruvianPolishPortuguesePuerto RicanRomanianRussianSalvadoranScandinavianScotch-IrishScottishSerbianSlavicSlovakSloveneSouth AmericanSpaniardSpanishSri LankanSubsaharan AfricanSwedishSwissSyrianThaiTrinidadian and TobagonianTurkishUkrainianUruguayanVenezuelanWelshYugoslavian
Ancestry (Percentage)
AfricanAmericanArabArgentineanArmenianAustrianBelgianBhutaneseBlackfeetBolivianBrazilianBritishBulgarianBurmeseCanadianCentral AmericanCentral American IndianCherokeeChileanChippewaColombianCosta RicanCroatianCubanCzechCzechoslovakianDanishDominicanDutchEastern EuropeanEcuadorianEnglishEuropeanFinnishFrenchFrench CanadianGermanGreekGuatemalanHaitianHonduranHungarianIcelanderIndian (Asian)IranianIraqiIrishIsraeliItalianJamaicanKoreanLatvianLebaneseLithuanianMexicanMoroccanNative HawaiianNicaraguanNorwegianPakistaniPanamanianPennsylvania GermanPeruvianPolishPortuguesePuerto RicanRomanianRussianSalvadoranScandinavianScotch-IrishScottishSerbianSlavicSlovakSloveneSouth AmericanSpaniardSpanishSri LankanSubsaharan AfricanSwedishSwissSyrianThaiTrinidadian and TobagonianTurkishUkrainianUruguayanVenezuelanWelshYugoslavian
Immigrant Origin (Total)
Immigrant Origin (Percentage)
Income
Income (Families)
Income (Households)
Poverty
Poverty (Families)
Unemployment
Employment Occupations
Employment Industries
Employer Class
Commute Time
Commute Means
School Enrollment
Education by Degree Field
Occupancy
Finances
Physical Characteristics
Cape Coral
States
Florida Cities
Altamonte SpringsApopkaBoca RatonBonita SpringsBoynton BeachBradentonBrandonBrooksvilleCape CoralCasselberryClearwaterClermontCocoaCoral SpringsCrestviewDade CityDavenportDaytona BeachDeerfield BeachDefuniak SpringsDelray BeachDeltonaDunnellonEnglewoodEustisFort LauderdaleFort MyersFort PierceFort Walton BeachGainesvilleGulf BreezeHialeahHolidayHollywoodHomesteadHudsonInvernessJacksonvilleJupiterKissimmeeLake CityLake WorthLakelandLand O LakesLargoLehigh AcresLongwoodLutzMelbourneMerritt IslandMiamiMiami BeachMiltonNaplesNew Port RicheyNew Smyrna BeachNorth PortOcalaOkeechobeeOrange ParkOrlandoOrmond BeachOviedoPalm BayPalm Beach GardensPalm CoastPalm HarborPanama CityPanama City BeachPensacolaPinellas ParkPlant CityPompano BeachPort CharlottePort OrangePort Saint LuciePunta GordaQuincyRiverviewSaint AugustineSaint CloudSaint PetersburgSanfordSarasotaSebastianSebringSeminoleSpring HillStuartTallahasseeTampaTarpon SpringsThe VillagesTitusvilleValricoVeniceVero BeachWesley ChapelWest Palm BeachWinter HavenWinter ParkZephyrhills
Compare Zip Codes
Comparison Subject

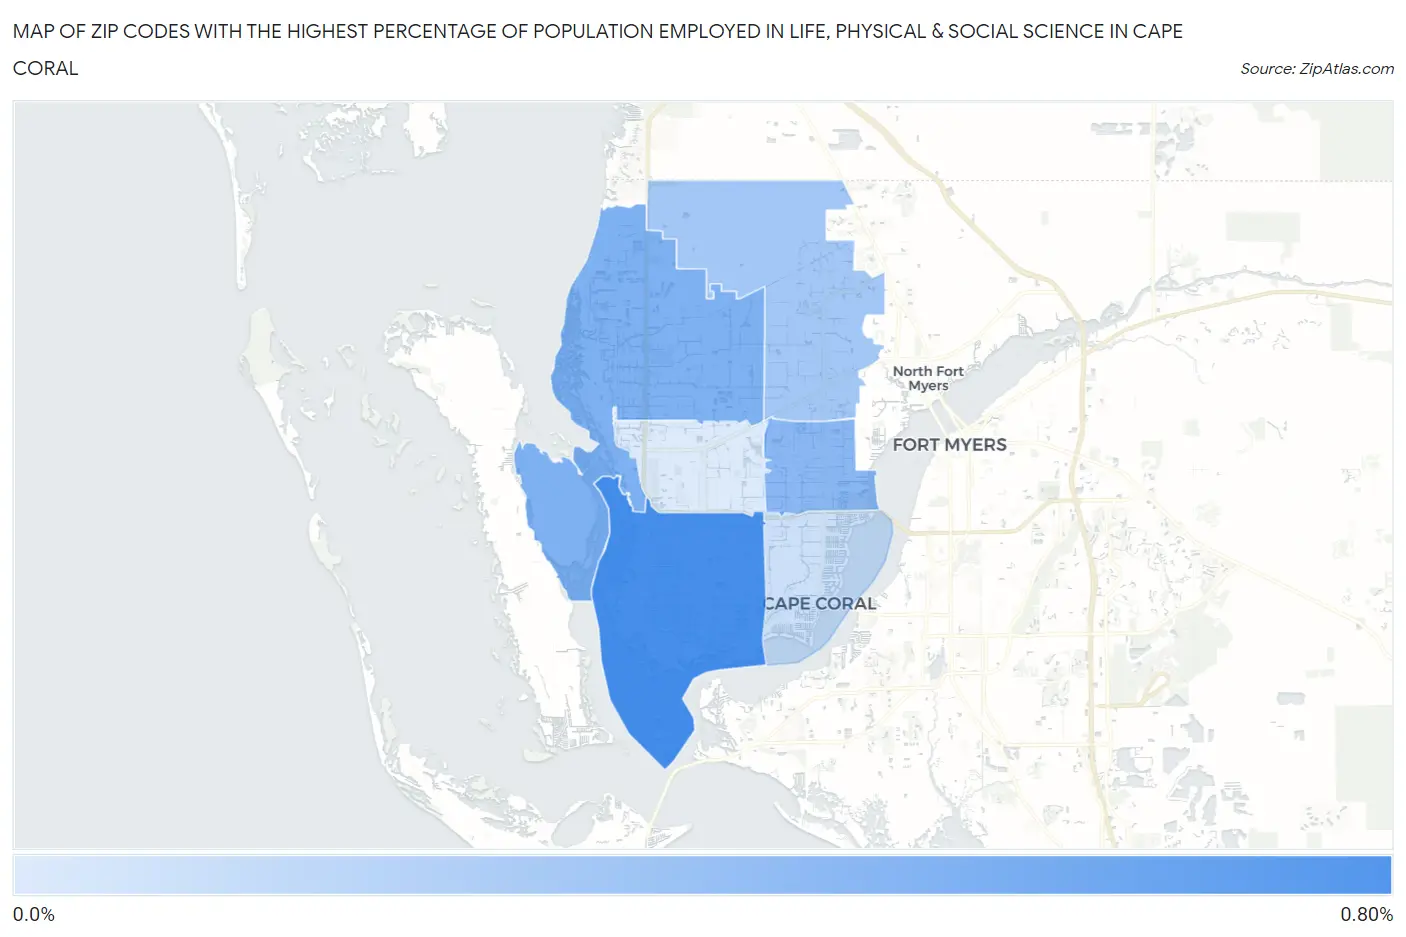
Map of Zip Codes with the Highest Percentage of Population Employed in Life, Physical & Social Science in Cape Coral

0.0%
0.80%
Zip Codes with the Highest Percentage of Population Employed in Life, Physical & Social Science in Cape Coral Map

Zip Codes with the Highest Percentage of Population Employed in Life, Physical & Social Science in Cape Coral, FL

Zip Code % Employed vs State vs National
1.339140.65%0.67%(-0.021)#3541.1%(-0.443)#12,673
2.339930.44%0.67%(-0.226)#4841.1%(-0.648)#15,222
3.339900.40%0.67%(-0.272)#5231.1%(-0.694)#15,792
4.339090.31%0.67%(-0.363)#5911.1%(-0.785)#16,984
5.339040.15%0.67%(-0.522)#7021.1%(-0.944)#18,707
6.339910.089%0.67%(-0.580)#7371.1%(-1.00)#19,142

Common Questions

What are the Top 5 Zip Codes with the Highest Percentage of Population Employed in Life, Physical & Social Science in Cape Coral, FL?
Top 5 Zip Codes with the Highest Percentage of Population Employed in Life, Physical & Social Science in Cape Coral, FL are:
#1
0.65%
#2
0.44%
#3
0.40%
#4
0.31%
#5
0.15%
What zip code has the Highest Percentage of Population Employed in Life, Physical & Social Science in Cape Coral, FL?
33914 has the Highest Percentage of Population Employed in Life, Physical & Social Science in Cape Coral, FL with 0.65%.
What is the Percentage of Population Employed in Life, Physical & Social Science in Cape Coral, FL?
Percentage of Population Employed in Life, Physical & Social Science in Cape Coral is 0.36%.
What is the Percentage of Population Employed in Life, Physical & Social Science in Florida?
Percentage of Population Employed in Life, Physical & Social Science in Florida is 0.67%.
What is the Percentage of Population Employed in Life, Physical & Social Science in the United States?
Percentage of Population Employed in Life, Physical & Social Science in the United States is 1.1%.