Crescent City, FL Map & Demographics
Crescent City Map
Crescent City Overview
$18,123
PER CAPITA INCOME
$45,046
AVG FAMILY INCOME
$36,625
AVG HOUSEHOLD INCOME
4.0%
WAGE / INCOME GAP [ % ]
96.0¢/ $1
WAGE / INCOME GAP [ $ ]
$9,437
FAMILY INCOME DEFICIT
0.53
INEQUALITY / GINI INDEX
2,040
TOTAL POPULATION
997
MALE POPULATION
1,043
FEMALE POPULATION
95.59
MALES / 100 FEMALES
104.61
FEMALES / 100 MALES
40.1
MEDIAN AGE
4.0
AVG FAMILY SIZE
2.7
AVG HOUSEHOLD SIZE
676
LABOR FORCE [ PEOPLE ]
38.7%
PERCENT IN LABOR FORCE
16.7%
UNEMPLOYMENT RATE
Crescent City Zip Codes
Income in Crescent City
Income Overview in Crescent City
Per Capita Income in Crescent City is $18,123, while median incomes of families and households are $45,046 and $36,625 respectively.
| Characteristic | Number | Measure |
| Per Capita Income | 2,040 | $18,123 |
| Median Family Income | 381 | $45,046 |
| Mean Family Income | 381 | $66,464 |
| Median Household Income | 712 | $36,625 |
| Mean Household Income | 712 | $48,852 |
| Income Deficit | 381 | $9,437 |
| Wage / Income Gap (%) | 2,040 | 3.96% |
| Wage / Income Gap ($) | 2,040 | 96.04¢ per $1 |
| Gini / Inequality Index | 2,040 | 0.53 |
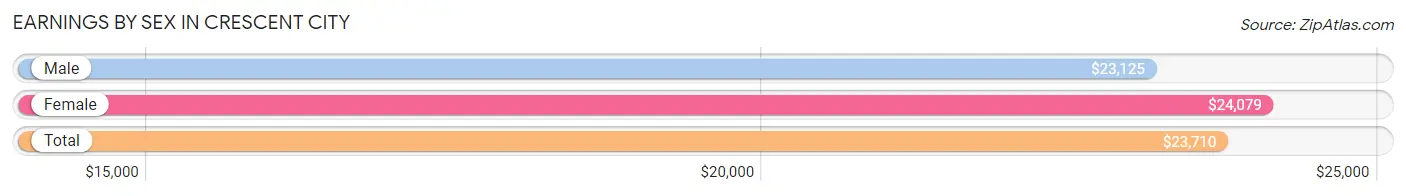
Earnings by Sex in Crescent City
Average Earnings in Crescent City are $23,710, $23,125 for men and $24,079 for women, a difference of 4.0%.
| Sex | Number | Average Earnings |
| Male | 292 (44.5%) | $23,125 |
| Female | 364 (55.5%) | $24,079 |
| Total | 656 (100.0%) | $23,710 |
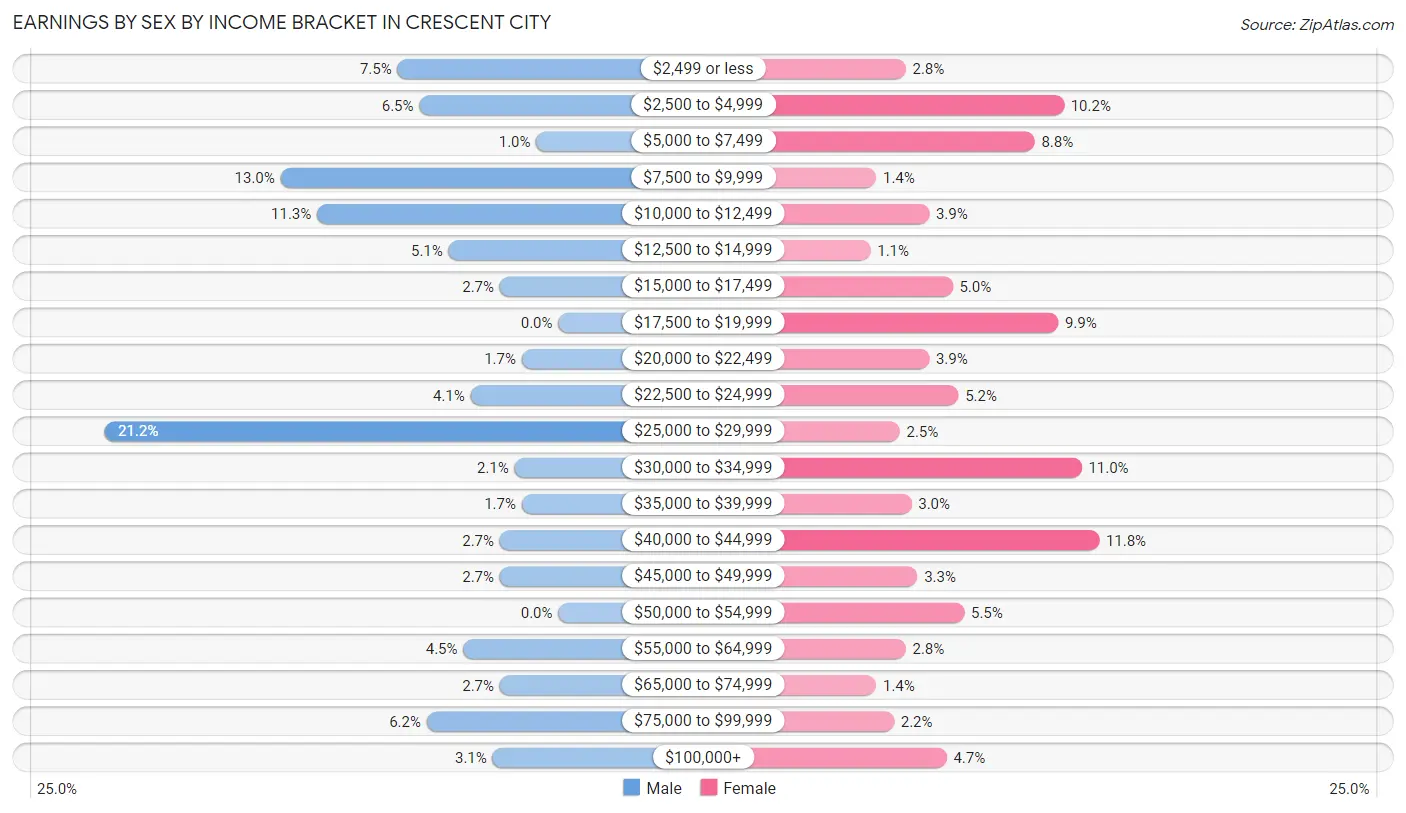
Earnings by Sex by Income Bracket in Crescent City
The most common earnings brackets in Crescent City are $25,000 to $29,999 for men (62 | 21.2%) and $40,000 to $44,999 for women (43 | 11.8%).
| Income | Male | Female |
| $2,499 or less | 22 (7.5%) | 10 (2.8%) |
| $2,500 to $4,999 | 19 (6.5%) | 37 (10.2%) |
| $5,000 to $7,499 | 3 (1.0%) | 32 (8.8%) |
| $7,500 to $9,999 | 38 (13.0%) | 5 (1.4%) |
| $10,000 to $12,499 | 33 (11.3%) | 14 (3.8%) |
| $12,500 to $14,999 | 15 (5.1%) | 4 (1.1%) |
| $15,000 to $17,499 | 8 (2.7%) | 18 (5.0%) |
| $17,500 to $19,999 | 0 (0.0%) | 36 (9.9%) |
| $20,000 to $22,499 | 5 (1.7%) | 14 (3.8%) |
| $22,500 to $24,999 | 12 (4.1%) | 19 (5.2%) |
| $25,000 to $29,999 | 62 (21.2%) | 9 (2.5%) |
| $30,000 to $34,999 | 6 (2.1%) | 40 (11.0%) |
| $35,000 to $39,999 | 5 (1.7%) | 11 (3.0%) |
| $40,000 to $44,999 | 8 (2.7%) | 43 (11.8%) |
| $45,000 to $49,999 | 8 (2.7%) | 12 (3.3%) |
| $50,000 to $54,999 | 0 (0.0%) | 20 (5.5%) |
| $55,000 to $64,999 | 13 (4.4%) | 10 (2.8%) |
| $65,000 to $74,999 | 8 (2.7%) | 5 (1.4%) |
| $75,000 to $99,999 | 18 (6.2%) | 8 (2.2%) |
| $100,000+ | 9 (3.1%) | 17 (4.7%) |
| Total | 292 (100.0%) | 364 (100.0%) |
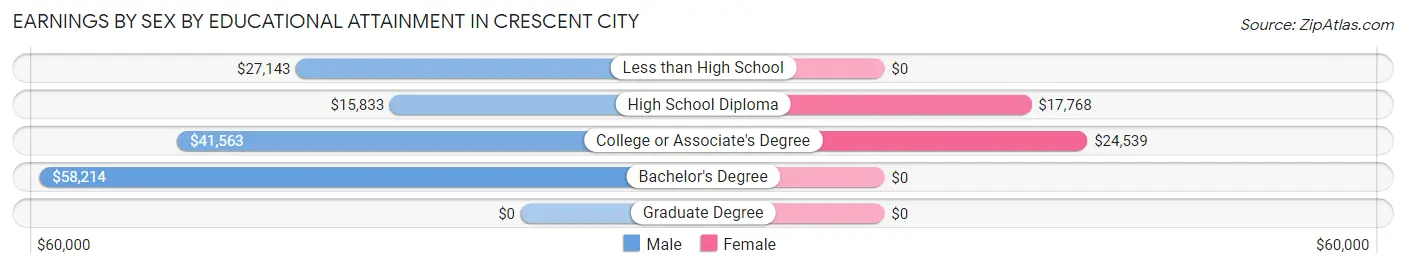
Earnings by Sex by Educational Attainment in Crescent City
Average earnings in Crescent City are $26,979 for men and $23,816 for women, a difference of 11.7%. Men with an educational attainment of bachelor's degree enjoy the highest average annual earnings of $58,214, while those with high school diploma education earn the least with $15,833. Women with an educational attainment of college or associate's degree earn the most with the average annual earnings of $24,539, while those with high school diploma education have the smallest earnings of $17,768.
| Educational Attainment | Male Income | Female Income |
| Less than High School | $27,143 | $0 |
| High School Diploma | $15,833 | $17,768 |
| College or Associate's Degree | $41,563 | $24,539 |
| Bachelor's Degree | $58,214 | $0 |
| Graduate Degree | - | - |
| Total | $26,979 | $23,816 |
Family Income in Crescent City
Family Income Brackets in Crescent City
According to the Crescent City family income data, there are 104 families falling into the $35,000 to $49,999 income range, which is the most common income bracket and makes up 27.3% of all families. Conversely, the $150,000 to $199,999 income bracket is the least frequent group with only 9 families (2.4%) belonging to this category.
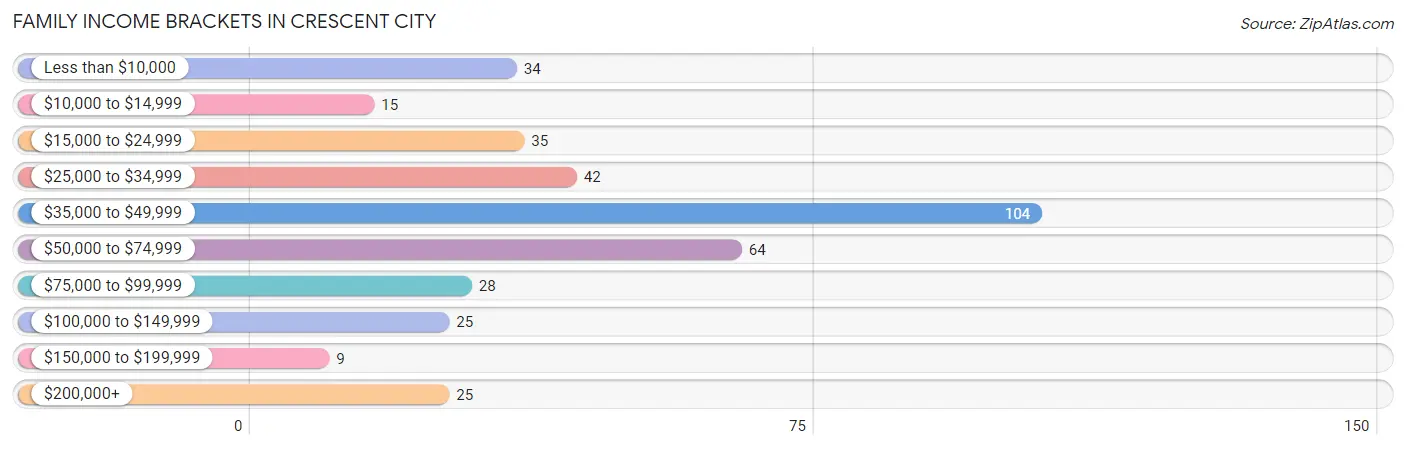
| Income Bracket | # Families | % Families |
| Less than $10,000 | 34 | 8.9% |
| $10,000 to $14,999 | 15 | 3.9% |
| $15,000 to $24,999 | 35 | 9.2% |
| $25,000 to $34,999 | 42 | 11.0% |
| $35,000 to $49,999 | 104 | 27.3% |
| $50,000 to $74,999 | 64 | 16.8% |
| $75,000 to $99,999 | 28 | 7.3% |
| $100,000 to $149,999 | 25 | 6.6% |
| $150,000 to $199,999 | 9 | 2.4% |
| $200,000+ | 25 | 6.6% |
Family Income by Famaliy Size in Crescent City
6-person families (35 | 9.2%) account for the highest median family income in Crescent City with $67,946 per family, while 2-person families (244 | 64.0%) have the highest median income of $20,139 per family member.
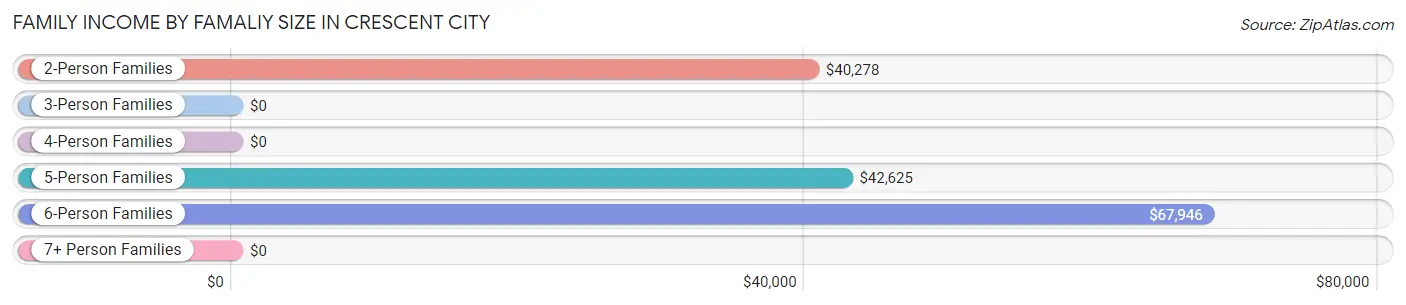
| Income Bracket | # Families | Median Income |
| 2-Person Families | 244 (64.0%) | $40,278 |
| 3-Person Families | 38 (10.0%) | $0 |
| 4-Person Families | 17 (4.5%) | $0 |
| 5-Person Families | 31 (8.1%) | $42,625 |
| 6-Person Families | 35 (9.2%) | $67,946 |
| 7+ Person Families | 16 (4.2%) | $0 |
| Total | 381 (100.0%) | $45,046 |
Family Income by Number of Earners in Crescent City
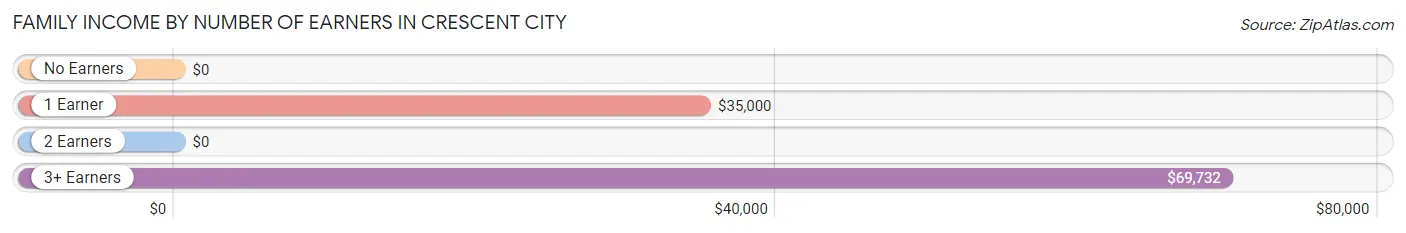
| Number of Earners | # Families | Median Income |
| No Earners | 94 (24.7%) | $0 |
| 1 Earner | 144 (37.8%) | $35,000 |
| 2 Earners | 110 (28.9%) | $0 |
| 3+ Earners | 33 (8.7%) | $69,732 |
| Total | 381 (100.0%) | $45,046 |
Household Income in Crescent City
Household Income Brackets in Crescent City
With 142 households falling in the category, the $35,000 to $49,999 income range is the most frequent in Crescent City, accounting for 19.9% of all households. In contrast, only 13 households (1.8%) fall into the $150,000 to $199,999 income bracket, making it the least populous group.
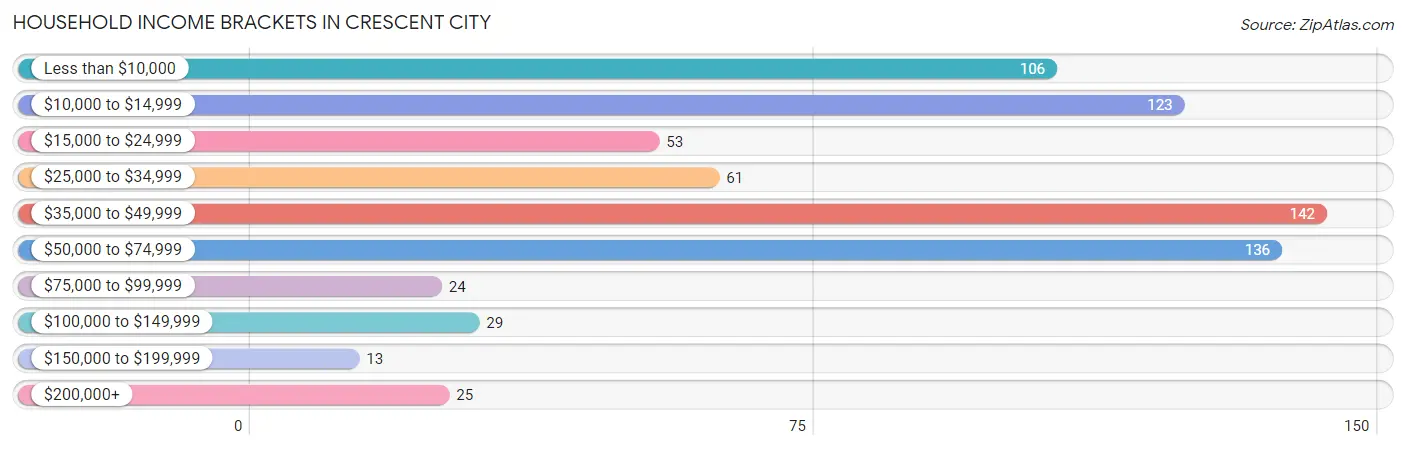
| Income Bracket | # Households | % Households |
| Less than $10,000 | 106 | 14.9% |
| $10,000 to $14,999 | 123 | 17.3% |
| $15,000 to $24,999 | 53 | 7.4% |
| $25,000 to $34,999 | 61 | 8.6% |
| $35,000 to $49,999 | 142 | 19.9% |
| $50,000 to $74,999 | 136 | 19.1% |
| $75,000 to $99,999 | 24 | 3.4% |
| $100,000 to $149,999 | 29 | 4.1% |
| $150,000 to $199,999 | 13 | 1.8% |
| $200,000+ | 25 | 3.5% |
Household Income by Householder Age in Crescent City
The median household income in Crescent City is $36,625, with the highest median household income of $42,875 found in the 25 to 44 years age bracket for the primary householder. A total of 129 households (18.1%) fall into this category. Meanwhile, the 15 to 24 years age bracket for the primary householder has the lowest median household income of $0, with 15 households (2.1%) in this group.
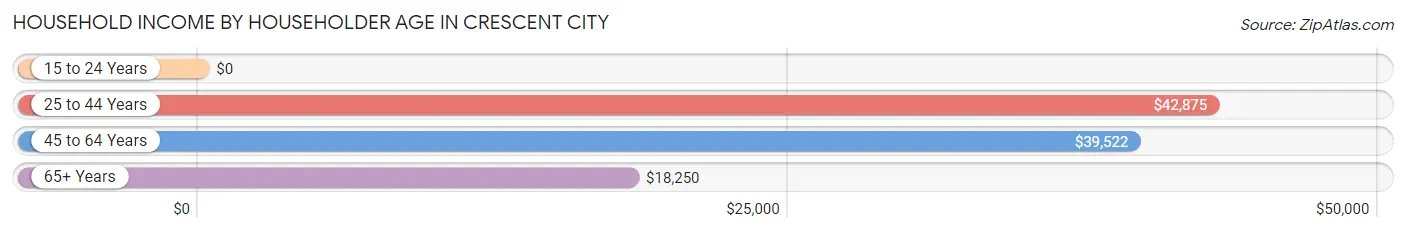
| Income Bracket | # Households | Median Income |
| 15 to 24 Years | 15 (2.1%) | $0 |
| 25 to 44 Years | 129 (18.1%) | $42,875 |
| 45 to 64 Years | 263 (36.9%) | $39,522 |
| 65+ Years | 305 (42.8%) | $18,250 |
| Total | 712 (100.0%) | $36,625 |
Poverty in Crescent City
Income Below Poverty by Sex and Age in Crescent City
With 30.4% poverty level for males and 28.1% for females among the residents of Crescent City, 15 year old males and 25 to 34 year old females are the most vulnerable to poverty, with 10 males (100.0%) and 70 females (48.6%) in their respective age groups living below the poverty level.
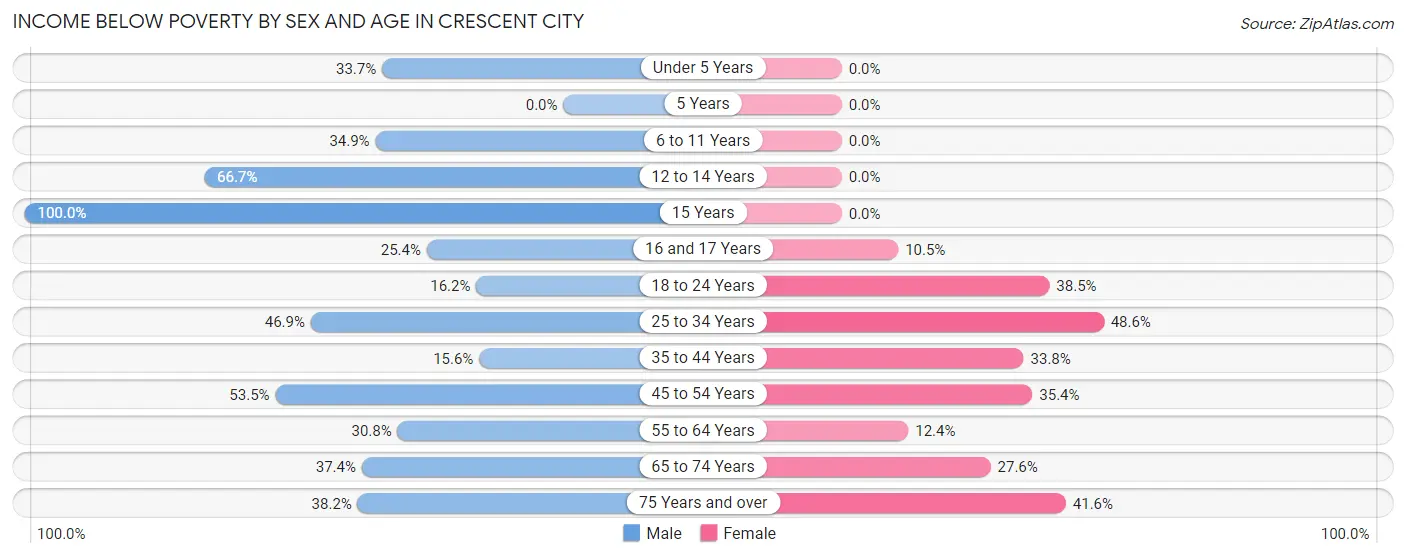
| Age Bracket | Male | Female |
| Under 5 Years | 35 (33.7%) | 0 (0.0%) |
| 5 Years | 0 (0.0%) | 0 (0.0%) |
| 6 to 11 Years | 15 (34.9%) | 0 (0.0%) |
| 12 to 14 Years | 16 (66.7%) | 0 (0.0%) |
| 15 Years | 10 (100.0%) | 0 (0.0%) |
| 16 and 17 Years | 18 (25.4%) | 9 (10.5%) |
| 18 to 24 Years | 32 (16.2%) | 37 (38.5%) |
| 25 to 34 Years | 15 (46.9%) | 70 (48.6%) |
| 35 to 44 Years | 15 (15.6%) | 27 (33.8%) |
| 45 to 54 Years | 31 (53.4%) | 29 (35.4%) |
| 55 to 64 Years | 32 (30.8%) | 21 (12.3%) |
| 65 to 74 Years | 58 (37.4%) | 29 (27.6%) |
| 75 Years and over | 21 (38.2%) | 47 (41.6%) |
| Total | 298 (30.4%) | 269 (28.1%) |
Income Above Poverty by Sex and Age in Crescent City
According to the poverty statistics in Crescent City, males aged 5 years and females aged under 5 years are the age groups that are most secure financially, with 100.0% of males and 100.0% of females in these age groups living above the poverty line.
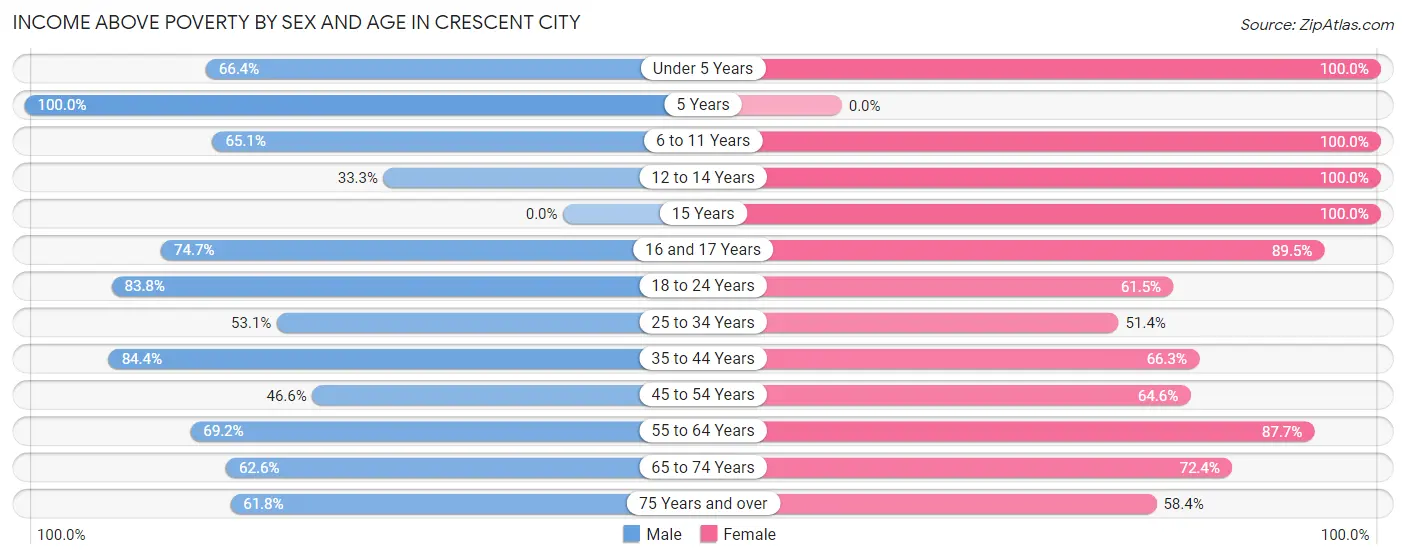
| Age Bracket | Male | Female |
| Under 5 Years | 69 (66.3%) | 38 (100.0%) |
| 5 Years | 29 (100.0%) | 0 (0.0%) |
| 6 to 11 Years | 28 (65.1%) | 25 (100.0%) |
| 12 to 14 Years | 8 (33.3%) | 14 (100.0%) |
| 15 Years | 0 (0.0%) | 5 (100.0%) |
| 16 and 17 Years | 53 (74.7%) | 77 (89.5%) |
| 18 to 24 Years | 166 (83.8%) | 59 (61.5%) |
| 25 to 34 Years | 17 (53.1%) | 74 (51.4%) |
| 35 to 44 Years | 81 (84.4%) | 53 (66.2%) |
| 45 to 54 Years | 27 (46.6%) | 53 (64.6%) |
| 55 to 64 Years | 72 (69.2%) | 149 (87.6%) |
| 65 to 74 Years | 97 (62.6%) | 76 (72.4%) |
| 75 Years and over | 34 (61.8%) | 66 (58.4%) |
| Total | 681 (69.6%) | 689 (71.9%) |
Income Below Poverty Among Married-Couple Families in Crescent City
The poverty statistics for married-couple families in Crescent City show that 14.1% or 36 of the total 256 families live below the poverty line. Families with 1 or 2 children have the highest poverty rate of 24.6%, comprising of 14 families. On the other hand, families with 3 or 4 children have the lowest poverty rate of 0.0%, which includes 0 families.
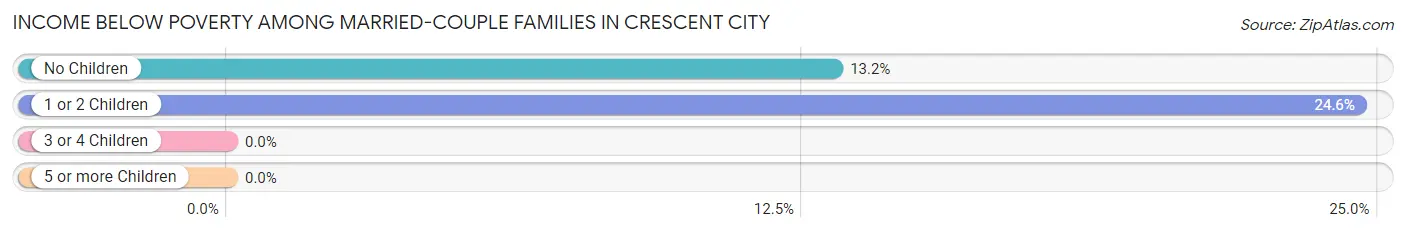
| Children | Above Poverty | Below Poverty |
| No Children | 145 (86.8%) | 22 (13.2%) |
| 1 or 2 Children | 43 (75.4%) | 14 (24.6%) |
| 3 or 4 Children | 28 (100.0%) | 0 (0.0%) |
| 5 or more Children | 4 (100.0%) | 0 (0.0%) |
| Total | 220 (85.9%) | 36 (14.1%) |
Income Below Poverty Among Single-Parent Households in Crescent City
According to the poverty data in Crescent City, 64.5% or 20 single-father households and 35.1% or 33 single-mother households are living below the poverty line. Among single-father households, those with 1 or 2 children have the highest poverty rate, with 12 households (100.0%) experiencing poverty. Likewise, among single-mother households, those with 1 or 2 children have the highest poverty rate, with 18 households (78.3%) falling below the poverty line.
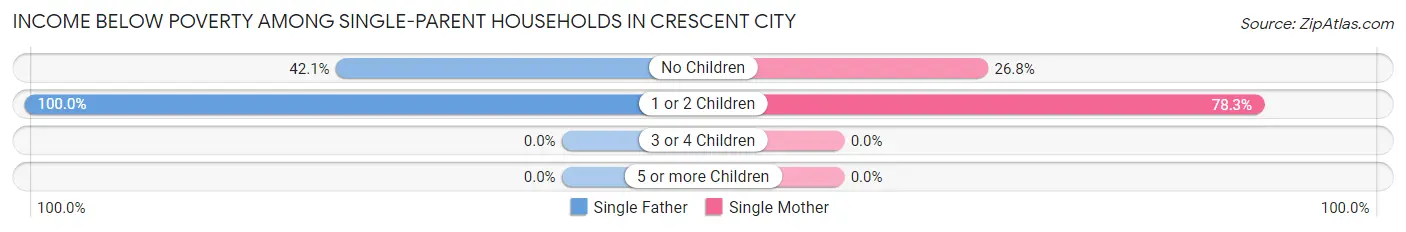
| Children | Single Father | Single Mother |
| No Children | 8 (42.1%) | 15 (26.8%) |
| 1 or 2 Children | 12 (100.0%) | 18 (78.3%) |
| 3 or 4 Children | 0 (0.0%) | 0 (0.0%) |
| 5 or more Children | 0 (0.0%) | 0 (0.0%) |
| Total | 20 (64.5%) | 33 (35.1%) |
Income Below Poverty Among Married-Couple vs Single-Parent Households in Crescent City
The poverty data for Crescent City shows that 36 of the married-couple family households (14.1%) and 53 of the single-parent households (42.4%) are living below the poverty level. Within the married-couple family households, those with 1 or 2 children have the highest poverty rate, with 14 households (24.6%) falling below the poverty line. Among the single-parent households, those with 1 or 2 children have the highest poverty rate, with 30 household (85.7%) living below poverty.
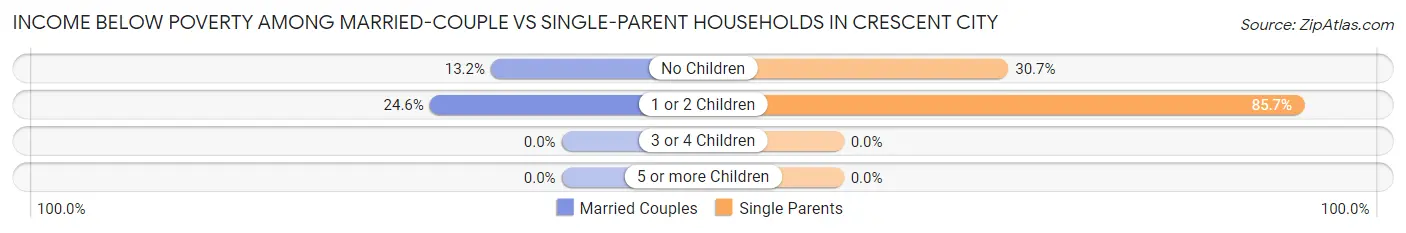
| Children | Married-Couple Families | Single-Parent Households |
| No Children | 22 (13.2%) | 23 (30.7%) |
| 1 or 2 Children | 14 (24.6%) | 30 (85.7%) |
| 3 or 4 Children | 0 (0.0%) | 0 (0.0%) |
| 5 or more Children | 0 (0.0%) | 0 (0.0%) |
| Total | 36 (14.1%) | 53 (42.4%) |
Race in Crescent City
The most populous races in Crescent City are White / Caucasian (1,308 | 64.1%), Black / African American (523 | 25.6%), and Hispanic or Latino (428 | 21.0%).
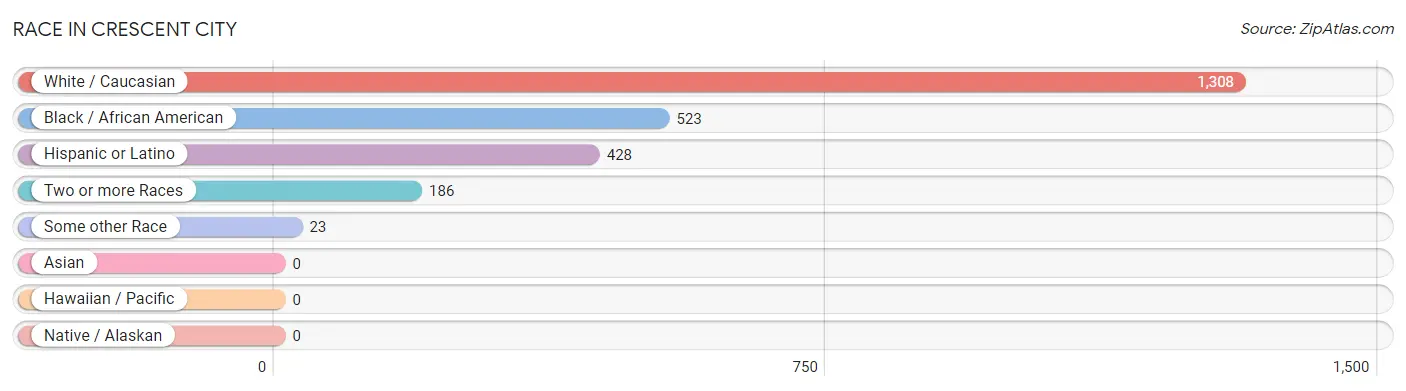
| Race | # Population | % Population |
| Asian | 0 | 0.0% |
| Black / African American | 523 | 25.6% |
| Hawaiian / Pacific | 0 | 0.0% |
| Hispanic or Latino | 428 | 21.0% |
| Native / Alaskan | 0 | 0.0% |
| White / Caucasian | 1,308 | 64.1% |
| Two or more Races | 186 | 9.1% |
| Some other Race | 23 | 1.1% |
| Total | 2,040 | 100.0% |
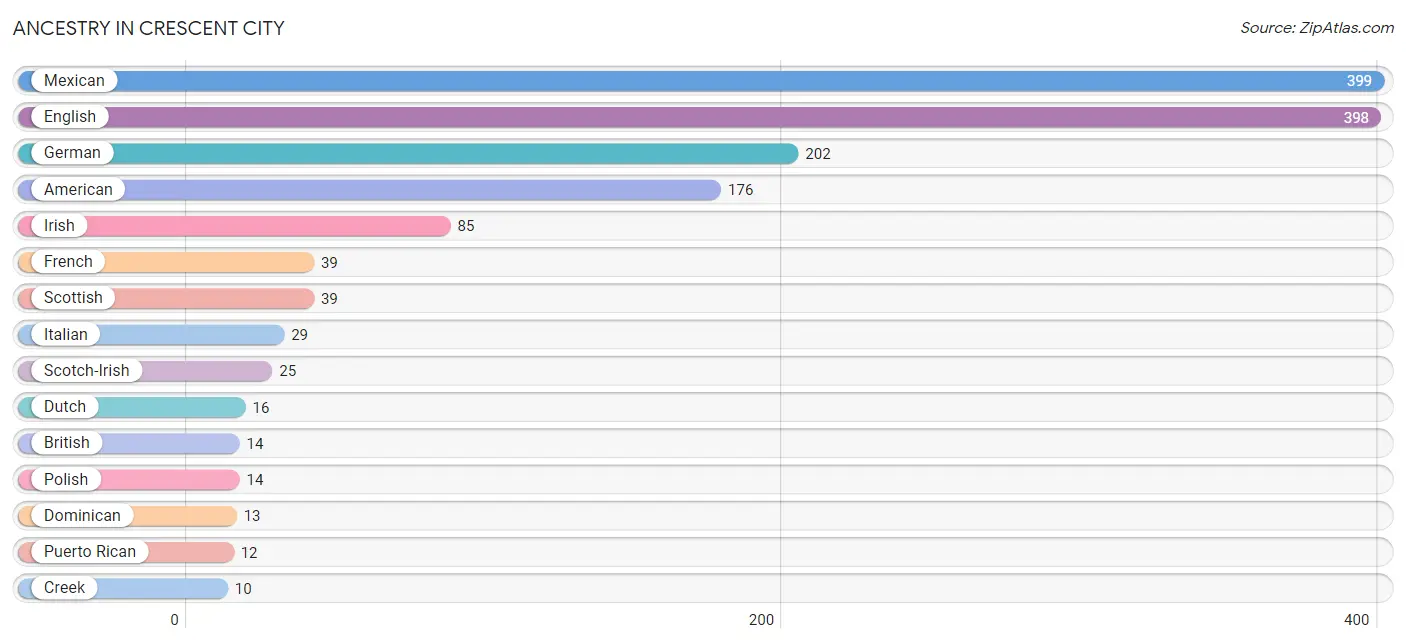
Ancestry in Crescent City
The most populous ancestries reported in Crescent City are Mexican (399 | 19.6%), English (398 | 19.5%), German (202 | 9.9%), American (176 | 8.6%), and Irish (85 | 4.2%), together accounting for 61.8% of all Crescent City residents.
| Ancestry | # Population | % Population |
| African | 2 | 0.1% |
| American | 176 | 8.6% |
| Belgian | 1 | 0.1% |
| Blackfeet | 4 | 0.2% |
| British | 14 | 0.7% |
| Cherokee | 9 | 0.4% |
| Colombian | 4 | 0.2% |
| Creek | 10 | 0.5% |
| Danish | 4 | 0.2% |
| Dominican | 13 | 0.6% |
| Dutch | 16 | 0.8% |
| English | 398 | 19.5% |
| European | 9 | 0.4% |
| French | 39 | 1.9% |
| French Canadian | 8 | 0.4% |
| German | 202 | 9.9% |
| German Russian | 5 | 0.3% |
| Greek | 2 | 0.1% |
| Indian (Asian) | 2 | 0.1% |
| Irish | 85 | 4.2% |
| Italian | 29 | 1.4% |
| Jamaican | 4 | 0.2% |
| Mexican | 399 | 19.6% |
| Norwegian | 4 | 0.2% |
| Polish | 14 | 0.7% |
| Puerto Rican | 12 | 0.6% |
| Scotch-Irish | 25 | 1.2% |
| Scottish | 39 | 1.9% |
| South American | 4 | 0.2% |
| Subsaharan African | 2 | 0.1% |
| Welsh | 7 | 0.3% | View All 31 Rows |
Immigrants in Crescent City
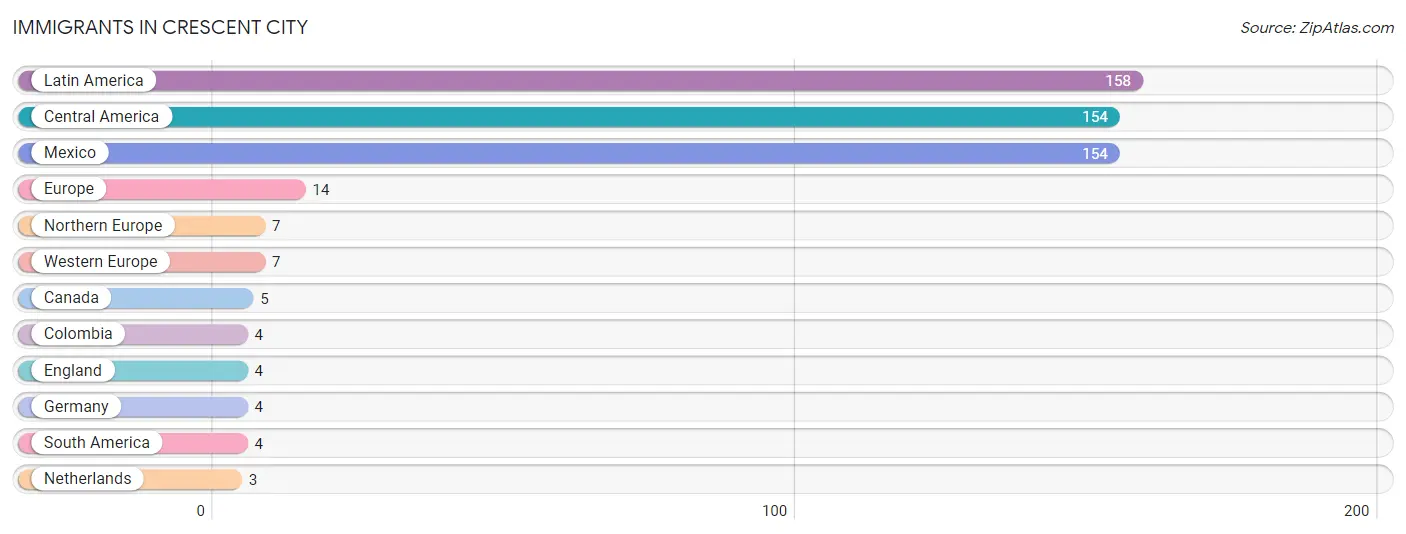
The most numerous immigrant groups reported in Crescent City came from Latin America (158 | 7.7%), Central America (154 | 7.5%), Mexico (154 | 7.5%), Europe (14 | 0.7%), and Northern Europe (7 | 0.3%), together accounting for 23.9% of all Crescent City residents.
| Immigration Origin | # Population | % Population |
| Canada | 5 | 0.3% |
| Central America | 154 | 7.5% |
| Colombia | 4 | 0.2% |
| England | 4 | 0.2% |
| Europe | 14 | 0.7% |
| Germany | 4 | 0.2% |
| Latin America | 158 | 7.7% |
| Mexico | 154 | 7.5% |
| Netherlands | 3 | 0.2% |
| Northern Europe | 7 | 0.3% |
| South America | 4 | 0.2% |
| Western Europe | 7 | 0.3% | View All 12 Rows |
Sex and Age in Crescent City
Sex and Age in Crescent City
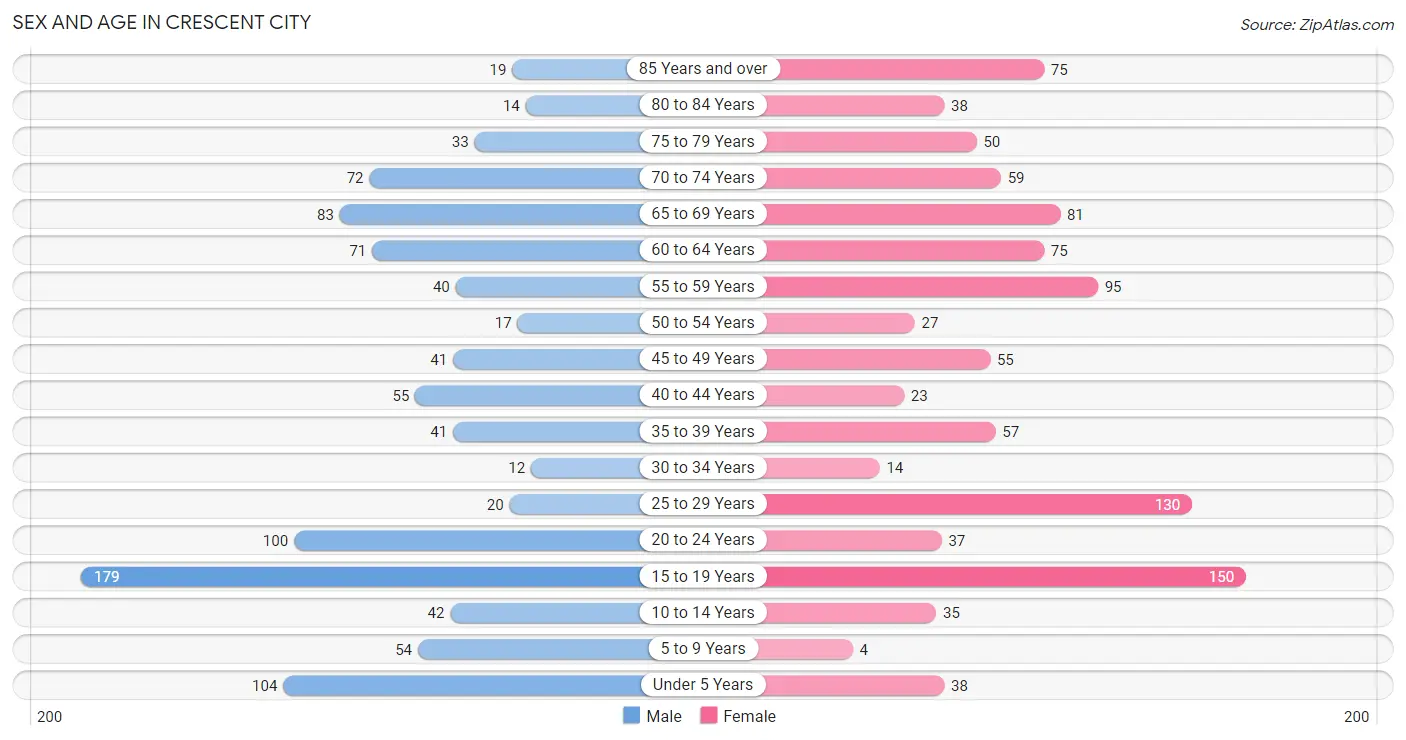
The most populous age groups in Crescent City are 15 to 19 Years (179 | 17.9%) for men and 15 to 19 Years (150 | 14.4%) for women.
| Age Bracket | Male | Female |
| Under 5 Years | 104 (10.4%) | 38 (3.6%) |
| 5 to 9 Years | 54 (5.4%) | 4 (0.4%) |
| 10 to 14 Years | 42 (4.2%) | 35 (3.4%) |
| 15 to 19 Years | 179 (17.9%) | 150 (14.4%) |
| 20 to 24 Years | 100 (10.0%) | 37 (3.5%) |
| 25 to 29 Years | 20 (2.0%) | 130 (12.5%) |
| 30 to 34 Years | 12 (1.2%) | 14 (1.3%) |
| 35 to 39 Years | 41 (4.1%) | 57 (5.5%) |
| 40 to 44 Years | 55 (5.5%) | 23 (2.2%) |
| 45 to 49 Years | 41 (4.1%) | 55 (5.3%) |
| 50 to 54 Years | 17 (1.7%) | 27 (2.6%) |
| 55 to 59 Years | 40 (4.0%) | 95 (9.1%) |
| 60 to 64 Years | 71 (7.1%) | 75 (7.2%) |
| 65 to 69 Years | 83 (8.3%) | 81 (7.8%) |
| 70 to 74 Years | 72 (7.2%) | 59 (5.7%) |
| 75 to 79 Years | 33 (3.3%) | 50 (4.8%) |
| 80 to 84 Years | 14 (1.4%) | 38 (3.6%) |
| 85 Years and over | 19 (1.9%) | 75 (7.2%) |
| Total | 997 (100.0%) | 1,043 (100.0%) |
Families and Households in Crescent City
Median Family Size in Crescent City
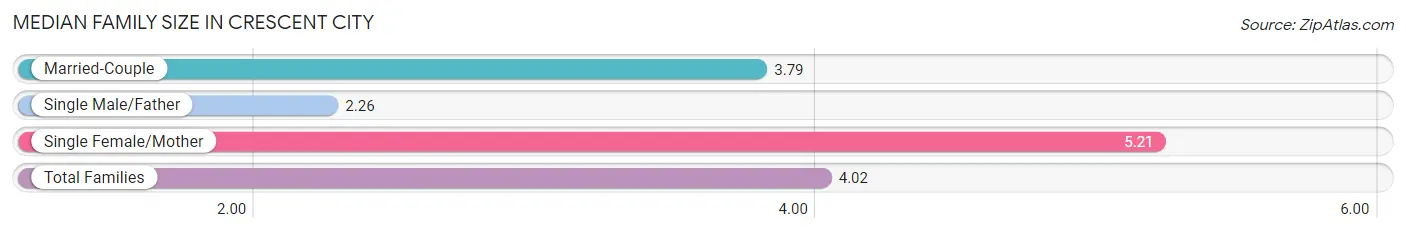
The median family size in Crescent City is 4.02 persons per family, with single female/mother families (94 | 24.7%) accounting for the largest median family size of 5.21 persons per family. On the other hand, single male/father families (31 | 8.1%) represent the smallest median family size with 2.26 persons per family.
| Family Type | # Families | Family Size |
| Married-Couple | 256 (67.2%) | 3.79 |
| Single Male/Father | 31 (8.1%) | 2.26 |
| Single Female/Mother | 94 (24.7%) | 5.21 |
| Total Families | 381 (100.0%) | 4.02 |
Median Household Size in Crescent City
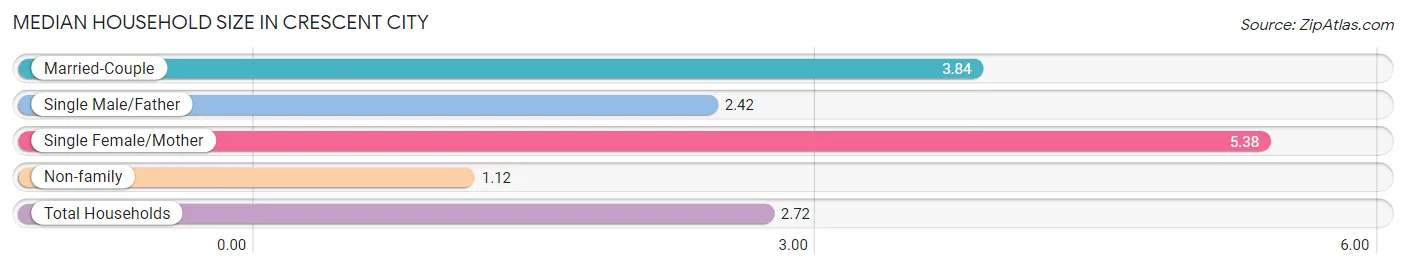
The median household size in Crescent City is 2.72 persons per household, with single female/mother households (94 | 13.2%) accounting for the largest median household size of 5.38 persons per household. non-family households (331 | 46.5%) represent the smallest median household size with 1.12 persons per household.
| Household Type | # Households | Household Size |
| Married-Couple | 256 (36.0%) | 3.84 |
| Single Male/Father | 31 (4.3%) | 2.42 |
| Single Female/Mother | 94 (13.2%) | 5.38 |
| Non-family | 331 (46.5%) | 1.12 |
| Total Households | 712 (100.0%) | 2.72 |
Household Size by Marriage Status in Crescent City
Out of a total of 712 households in Crescent City, 381 (53.5%) are family households, while 331 (46.5%) are nonfamily households. The most numerous type of family households are 2-person households, comprising 221, and the most common type of nonfamily households are 1-person households, comprising 292.
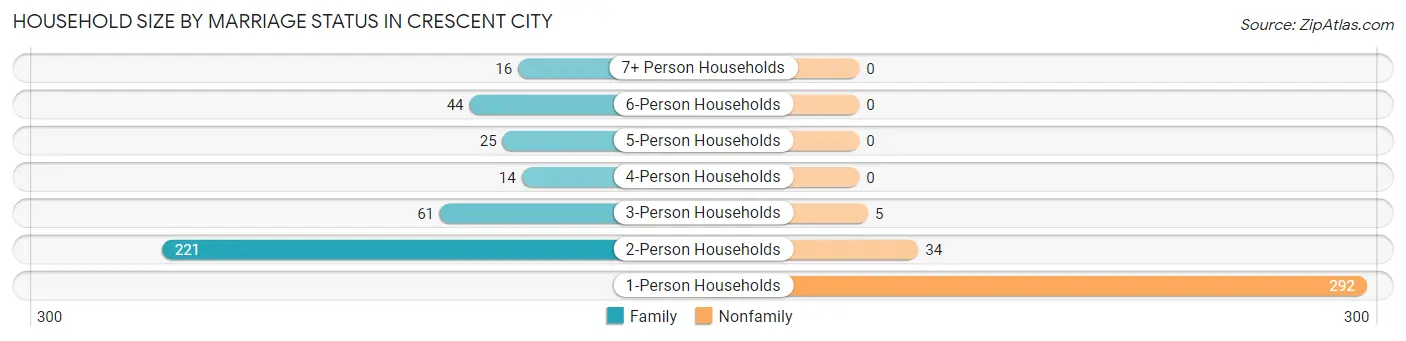
| Household Size | Family Households | Nonfamily Households |
| 1-Person Households | - | 292 (41.0%) |
| 2-Person Households | 221 (31.0%) | 34 (4.8%) |
| 3-Person Households | 61 (8.6%) | 5 (0.7%) |
| 4-Person Households | 14 (2.0%) | 0 (0.0%) |
| 5-Person Households | 25 (3.5%) | 0 (0.0%) |
| 6-Person Households | 44 (6.2%) | 0 (0.0%) |
| 7+ Person Households | 16 (2.2%) | 0 (0.0%) |
| Total | 381 (53.5%) | 331 (46.5%) |
Female Fertility in Crescent City
Fertility by Age in Crescent City
Average fertility rate in Crescent City is 9.0 births per 1,000 women. Women in the age bracket of 20 to 34 years have the highest fertility rate with 22.0 births per 1,000 women. Women in the age bracket of 20 to 34 years acount for 100.0% of all women with births.
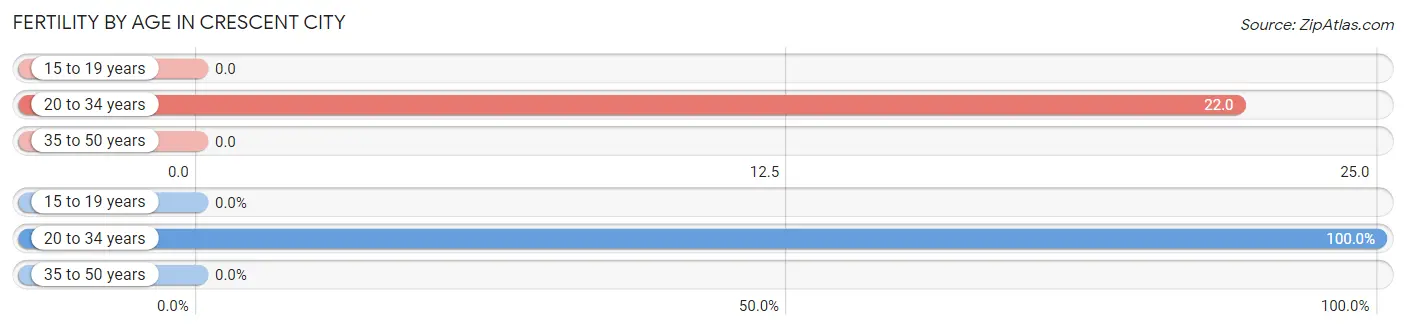
| Age Bracket | Women with Births | Births / 1,000 Women |
| 15 to 19 years | 0 (0.0%) | 0.0 |
| 20 to 34 years | 4 (100.0%) | 22.0 |
| 35 to 50 years | 0 (0.0%) | 0.0 |
| Total | 4 (100.0%) | 9.0 |
Fertility by Age by Marriage Status in Crescent City
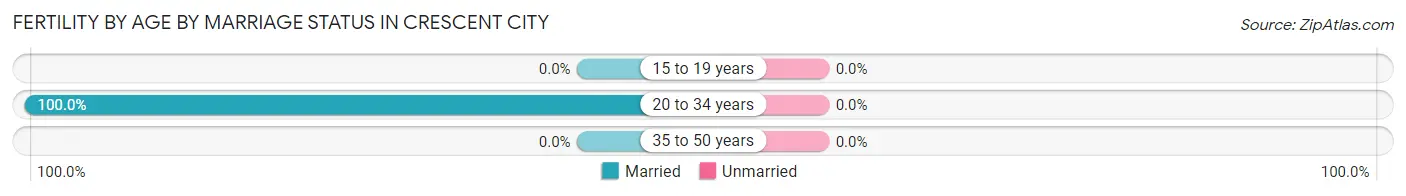
| Age Bracket | Married | Unmarried |
| 15 to 19 years | 0 (0.0%) | 0 (0.0%) |
| 20 to 34 years | 4 (100.0%) | 0 (0.0%) |
| 35 to 50 years | 0 (0.0%) | 0 (0.0%) |
| Total | 4 (100.0%) | 0 (0.0%) |
Fertility by Education in Crescent City
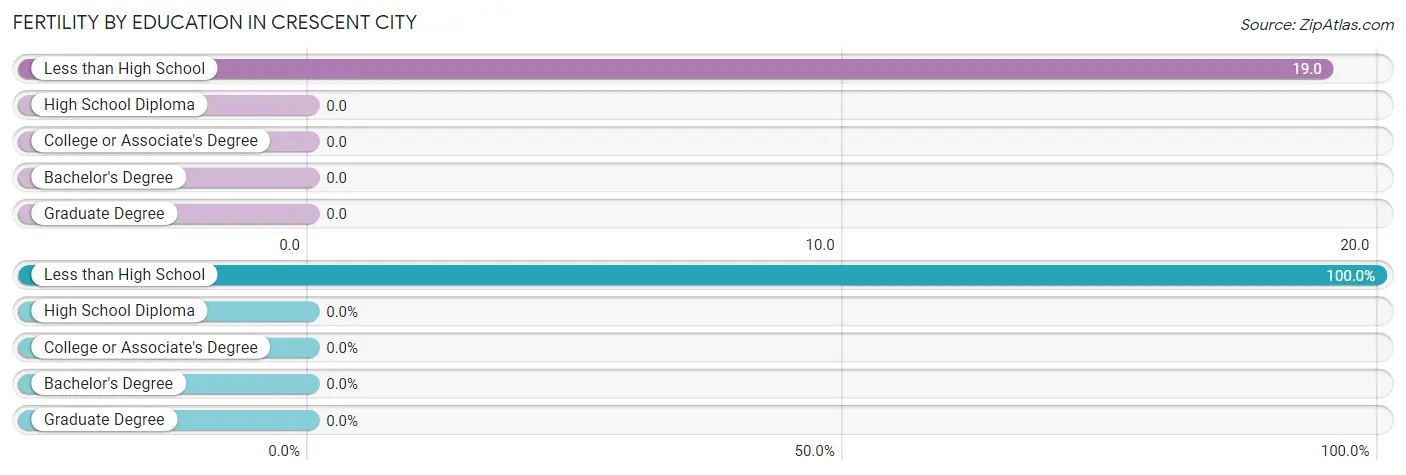
| Educational Attainment | Women with Births | Births / 1,000 Women |
| Less than High School | 4 (100.0%) | 19.0 |
| High School Diploma | 0 (0.0%) | 0.0 |
| College or Associate's Degree | 0 (0.0%) | 0.0 |
| Bachelor's Degree | 0 (0.0%) | 0.0 |
| Graduate Degree | 0 (0.0%) | 0.0 |
| Total | 4 (100.0%) | 9.0 |
Fertility by Education by Marriage Status in Crescent City
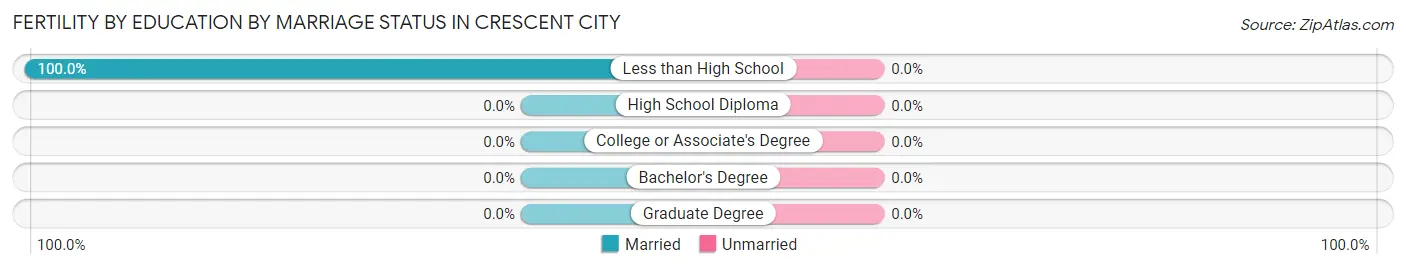
| Educational Attainment | Married | Unmarried |
| Less than High School | 4 (100.0%) | 0 (0.0%) |
| High School Diploma | 0 (0.0%) | 0 (0.0%) |
| College or Associate's Degree | 0 (0.0%) | 0 (0.0%) |
| Bachelor's Degree | 0 (0.0%) | 0 (0.0%) |
| Graduate Degree | 0 (0.0%) | 0 (0.0%) |
| Total | 4 (100.0%) | 0 (0.0%) |
Employment Characteristics in Crescent City
Employment by Class of Employer in Crescent City
Among the 544 employed individuals in Crescent City, private company employees (349 | 64.1%), local government employees (74 | 13.6%), and self-employed (not incorporated) (42 | 7.7%) make up the most common classes of employment.
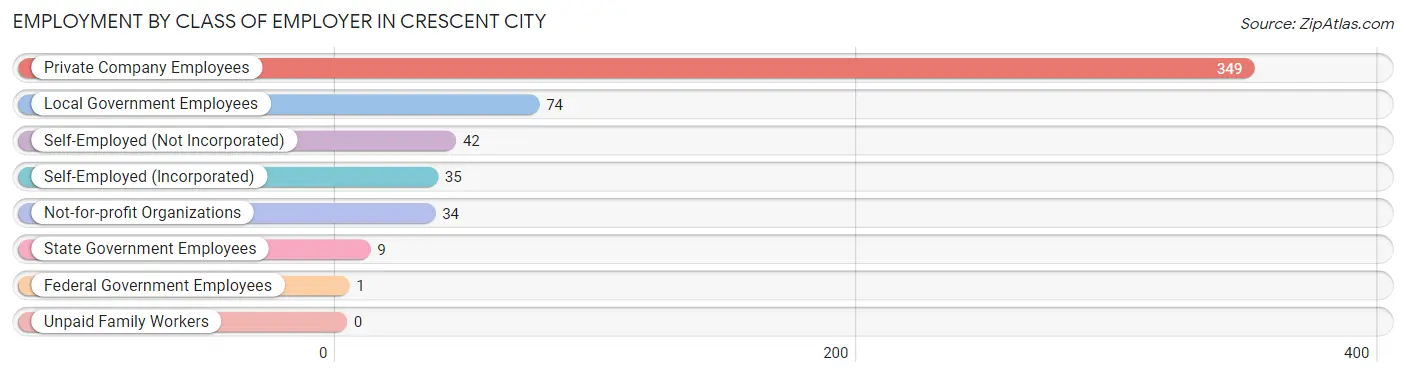
| Employer Class | # Employees | % Employees |
| Private Company Employees | 349 | 64.1% |
| Self-Employed (Incorporated) | 35 | 6.4% |
| Self-Employed (Not Incorporated) | 42 | 7.7% |
| Not-for-profit Organizations | 34 | 6.2% |
| Local Government Employees | 74 | 13.6% |
| State Government Employees | 9 | 1.7% |
| Federal Government Employees | 1 | 0.2% |
| Unpaid Family Workers | 0 | 0.0% |
| Total | 544 | 100.0% |
Employment Status by Age in Crescent City
According to the labor force statistics for Crescent City, out of the total population over 16 years of age (1,748), 38.7% or 676 individuals are in the labor force, with 16.7% or 113 of them unemployed. The age group with the highest labor force participation rate is 25 to 29 years, with 100.0% or 150 individuals in the labor force. Within the labor force, the 16 to 19 years age range has the highest percentage of unemployed individuals, with 50.0% or 9 of them being unemployed.
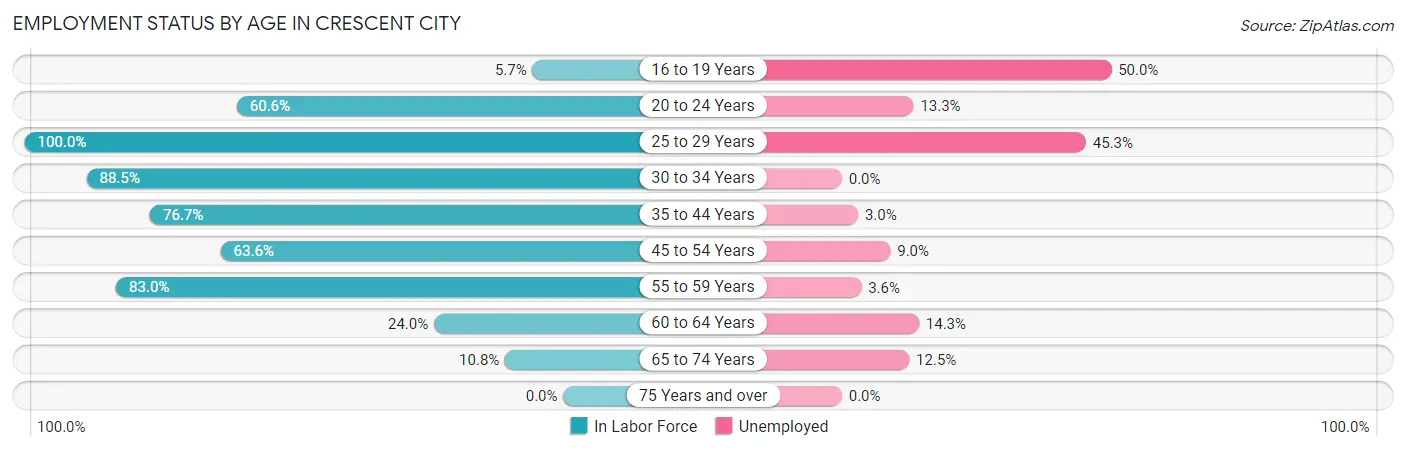
| Age Bracket | In Labor Force | Unemployed |
| 16 to 19 Years | 18 (5.7%) | 9 (50.0%) |
| 20 to 24 Years | 83 (60.6%) | 11 (13.3%) |
| 25 to 29 Years | 150 (100.0%) | 68 (45.3%) |
| 30 to 34 Years | 23 (88.5%) | 0 (0.0%) |
| 35 to 44 Years | 135 (76.7%) | 4 (3.0%) |
| 45 to 54 Years | 89 (63.6%) | 8 (9.0%) |
| 55 to 59 Years | 112 (83.0%) | 4 (3.6%) |
| 60 to 64 Years | 35 (24.0%) | 5 (14.3%) |
| 65 to 74 Years | 32 (10.8%) | 4 (12.5%) |
| 75 Years and over | 0 (0.0%) | 0 (0.0%) |
| Total | 676 (38.7%) | 113 (16.7%) |
Employment Status by Educational Attainment in Crescent City
According to labor force statistics for Crescent City, 70.4% of individuals (544) out of the total population between 25 and 64 years of age (773) are in the labor force, with 16.4% or 89 of them being unemployed. The group with the highest labor force participation rate are those with the educational attainment of less than high school, with 82.0% or 137 individuals in the labor force. Within the labor force, individuals with less than high school education have the highest percentage of unemployment, with 40.1% or 55 of them being unemployed.
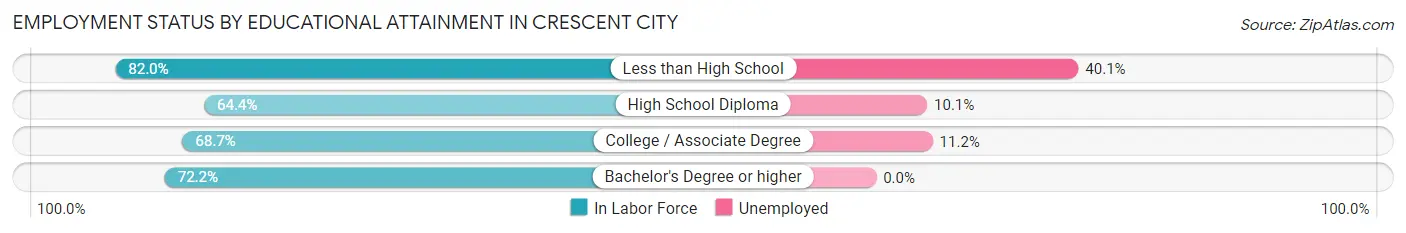
| Educational Attainment | In Labor Force | Unemployed |
| Less than High School | 137 (82.0%) | 67 (40.1%) |
| High School Diploma | 199 (64.4%) | 31 (10.1%) |
| College / Associate Degree | 125 (68.7%) | 20 (11.2%) |
| Bachelor's Degree or higher | 83 (72.2%) | 0 (0.0%) |
| Total | 544 (70.4%) | 127 (16.4%) |
Employment Occupations by Sex in Crescent City
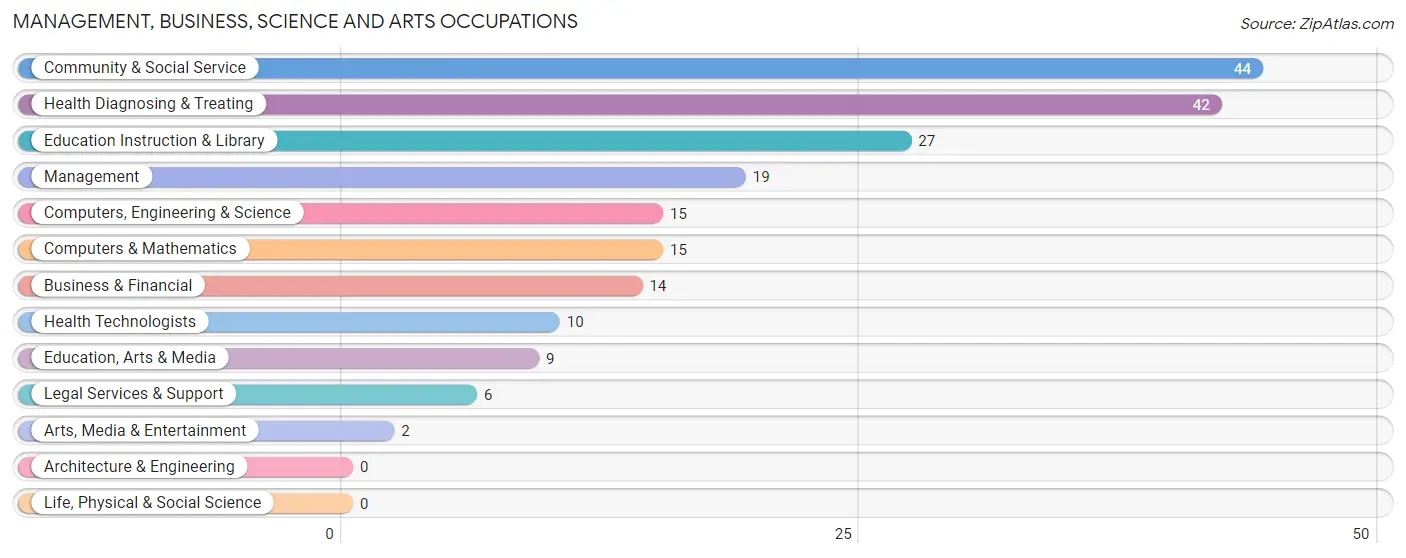
Management, Business, Science and Arts Occupations
The most common Management, Business, Science and Arts occupations in Crescent City are Community & Social Service (44 | 7.8%), Health Diagnosing & Treating (42 | 7.4%), Education Instruction & Library (27 | 4.8%), Management (19 | 3.4%), and Computers, Engineering & Science (15 | 2.7%).
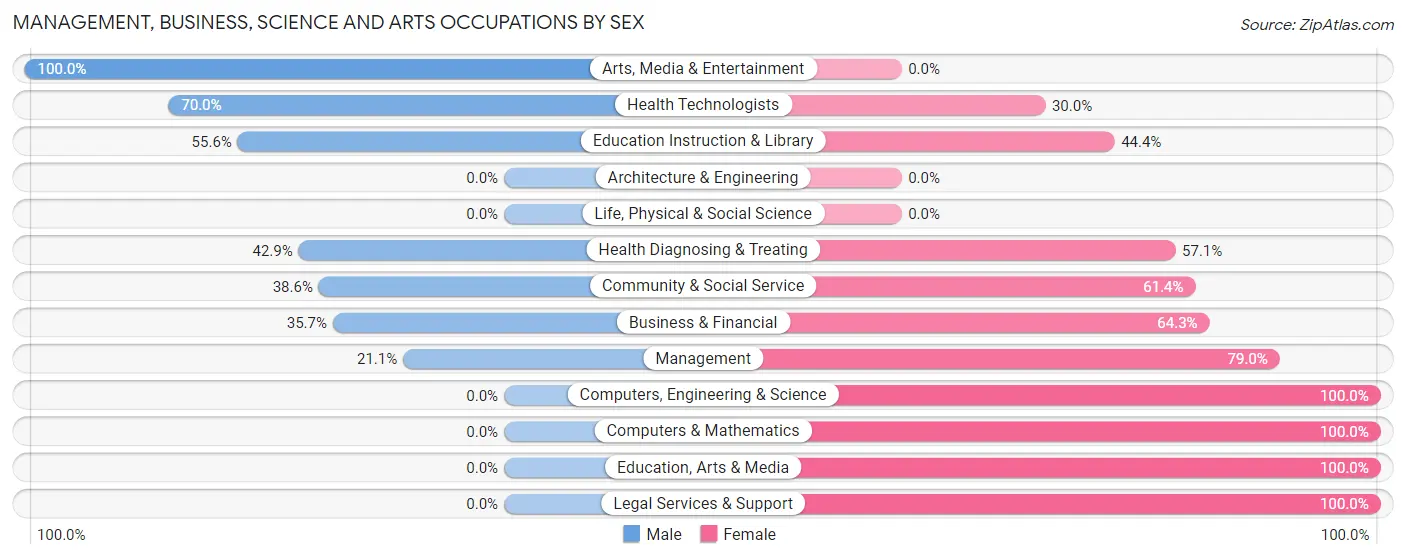
Management, Business, Science and Arts Occupations by Sex
Within the Management, Business, Science and Arts occupations in Crescent City, the most male-oriented occupations are Arts, Media & Entertainment (100.0%), Health Technologists (70.0%), and Education Instruction & Library (55.6%), while the most female-oriented occupations are Computers, Engineering & Science (100.0%), Computers & Mathematics (100.0%), and Education, Arts & Media (100.0%).
| Occupation | Male | Female |
| Management | 4 (21.0%) | 15 (78.9%) |
| Business & Financial | 5 (35.7%) | 9 (64.3%) |
| Computers, Engineering & Science | 0 (0.0%) | 15 (100.0%) |
| Computers & Mathematics | 0 (0.0%) | 15 (100.0%) |
| Architecture & Engineering | 0 (0.0%) | 0 (0.0%) |
| Life, Physical & Social Science | 0 (0.0%) | 0 (0.0%) |
| Community & Social Service | 17 (38.6%) | 27 (61.4%) |
| Education, Arts & Media | 0 (0.0%) | 9 (100.0%) |
| Legal Services & Support | 0 (0.0%) | 6 (100.0%) |
| Education Instruction & Library | 15 (55.6%) | 12 (44.4%) |
| Arts, Media & Entertainment | 2 (100.0%) | 0 (0.0%) |
| Health Diagnosing & Treating | 18 (42.9%) | 24 (57.1%) |
| Health Technologists | 7 (70.0%) | 3 (30.0%) |
| Total (Category) | 44 (32.8%) | 90 (67.2%) |
| Total (Overall) | 227 (40.3%) | 337 (59.8%) |
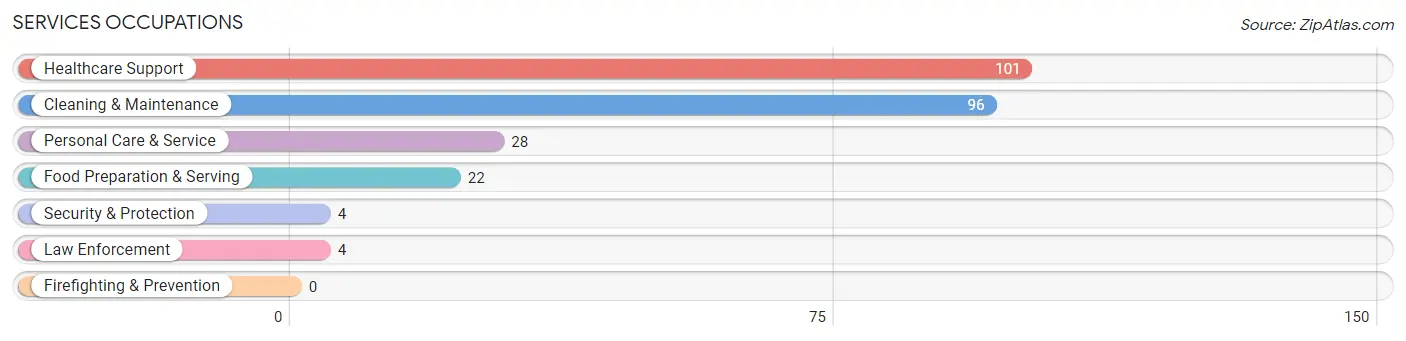
Services Occupations
The most common Services occupations in Crescent City are Healthcare Support (101 | 17.9%), Cleaning & Maintenance (96 | 17.0%), Personal Care & Service (28 | 5.0%), Food Preparation & Serving (22 | 3.9%), and Security & Protection (4 | 0.7%).
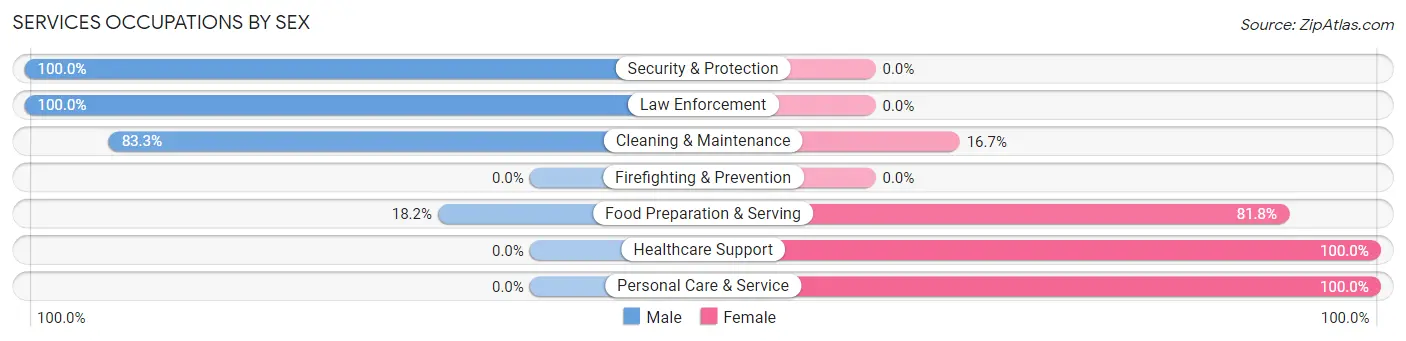
Services Occupations by Sex
Within the Services occupations in Crescent City, the most male-oriented occupations are Security & Protection (100.0%), Law Enforcement (100.0%), and Cleaning & Maintenance (83.3%), while the most female-oriented occupations are Healthcare Support (100.0%), Personal Care & Service (100.0%), and Food Preparation & Serving (81.8%).
| Occupation | Male | Female |
| Healthcare Support | 0 (0.0%) | 101 (100.0%) |
| Security & Protection | 4 (100.0%) | 0 (0.0%) |
| Firefighting & Prevention | 0 (0.0%) | 0 (0.0%) |
| Law Enforcement | 4 (100.0%) | 0 (0.0%) |
| Food Preparation & Serving | 4 (18.2%) | 18 (81.8%) |
| Cleaning & Maintenance | 80 (83.3%) | 16 (16.7%) |
| Personal Care & Service | 0 (0.0%) | 28 (100.0%) |
| Total (Category) | 88 (35.1%) | 163 (64.9%) |
| Total (Overall) | 227 (40.3%) | 337 (59.8%) |
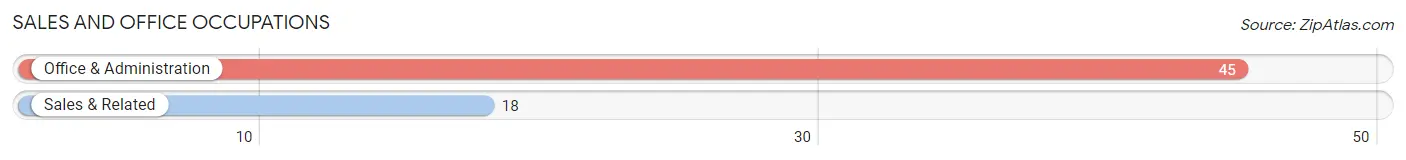
Sales and Office Occupations
The most common Sales and Office occupations in Crescent City are Office & Administration (45 | 8.0%), and Sales & Related (18 | 3.2%).
Sales and Office Occupations by Sex
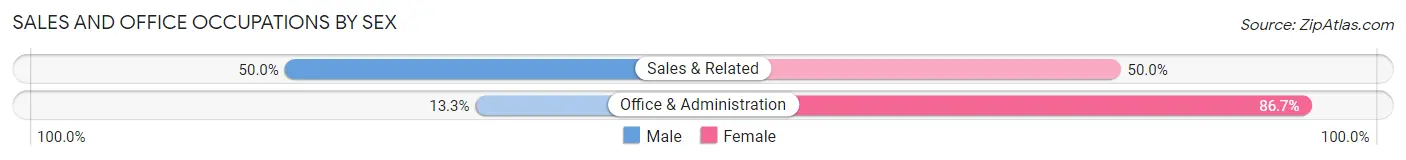
| Occupation | Male | Female |
| Sales & Related | 9 (50.0%) | 9 (50.0%) |
| Office & Administration | 6 (13.3%) | 39 (86.7%) |
| Total (Category) | 15 (23.8%) | 48 (76.2%) |
| Total (Overall) | 227 (40.3%) | 337 (59.8%) |
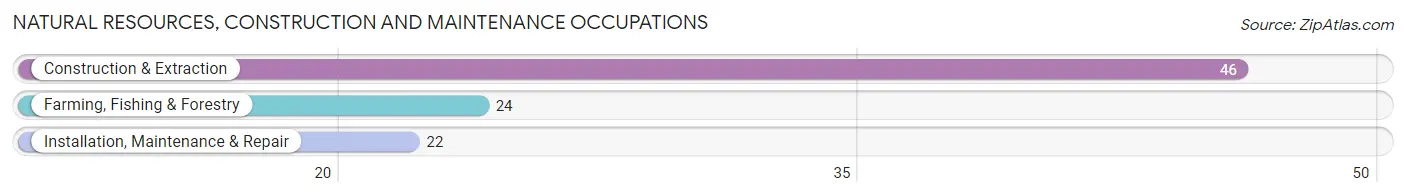
Natural Resources, Construction and Maintenance Occupations
The most common Natural Resources, Construction and Maintenance occupations in Crescent City are Construction & Extraction (46 | 8.2%), Farming, Fishing & Forestry (24 | 4.3%), and Installation, Maintenance & Repair (22 | 3.9%).
Natural Resources, Construction and Maintenance Occupations by Sex
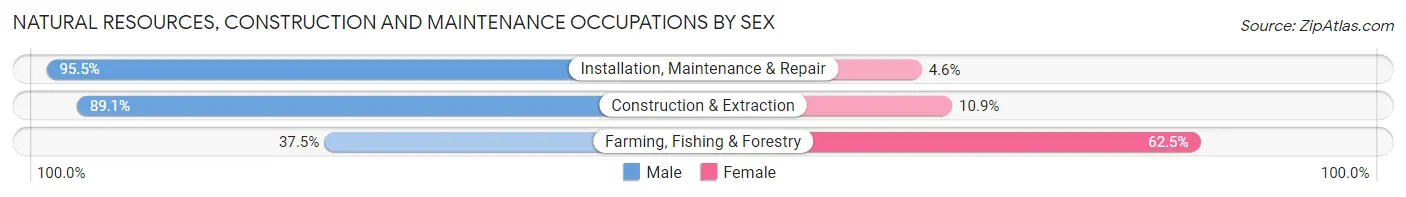
| Occupation | Male | Female |
| Farming, Fishing & Forestry | 9 (37.5%) | 15 (62.5%) |
| Construction & Extraction | 41 (89.1%) | 5 (10.9%) |
| Installation, Maintenance & Repair | 21 (95.5%) | 1 (4.5%) |
| Total (Category) | 71 (77.2%) | 21 (22.8%) |
| Total (Overall) | 227 (40.3%) | 337 (59.8%) |
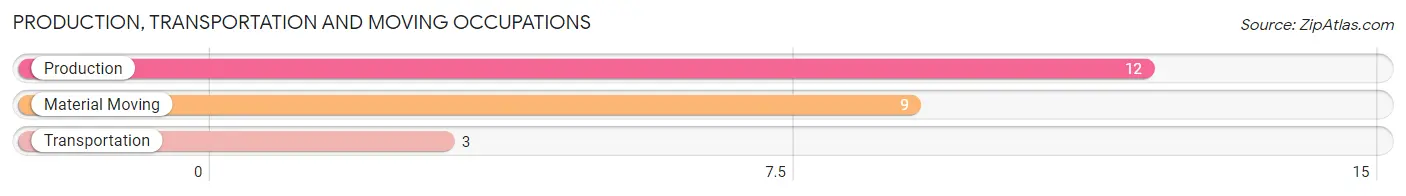
Production, Transportation and Moving Occupations
The most common Production, Transportation and Moving occupations in Crescent City are Production (12 | 2.1%), Material Moving (9 | 1.6%), and Transportation (3 | 0.5%).
Production, Transportation and Moving Occupations by Sex
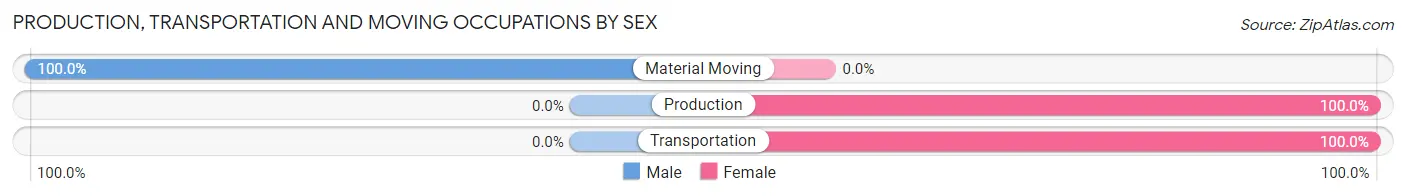
| Occupation | Male | Female |
| Production | 0 (0.0%) | 12 (100.0%) |
| Transportation | 0 (0.0%) | 3 (100.0%) |
| Material Moving | 9 (100.0%) | 0 (0.0%) |
| Total (Category) | 9 (37.5%) | 15 (62.5%) |
| Total (Overall) | 227 (40.3%) | 337 (59.8%) |
Employment Industries by Sex in Crescent City
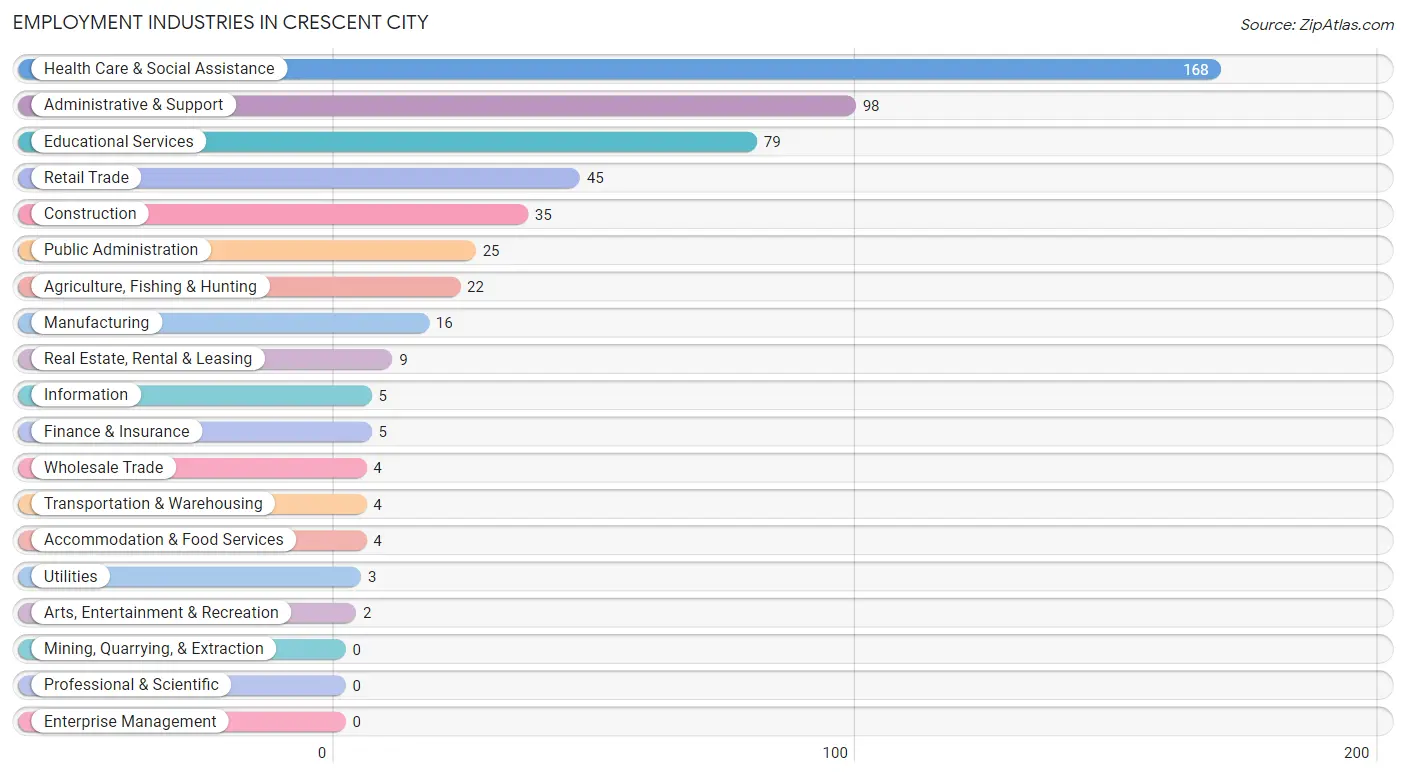
Employment Industries in Crescent City
The major employment industries in Crescent City include Health Care & Social Assistance (168 | 29.8%), Administrative & Support (98 | 17.4%), Educational Services (79 | 14.0%), Retail Trade (45 | 8.0%), and Construction (35 | 6.2%).
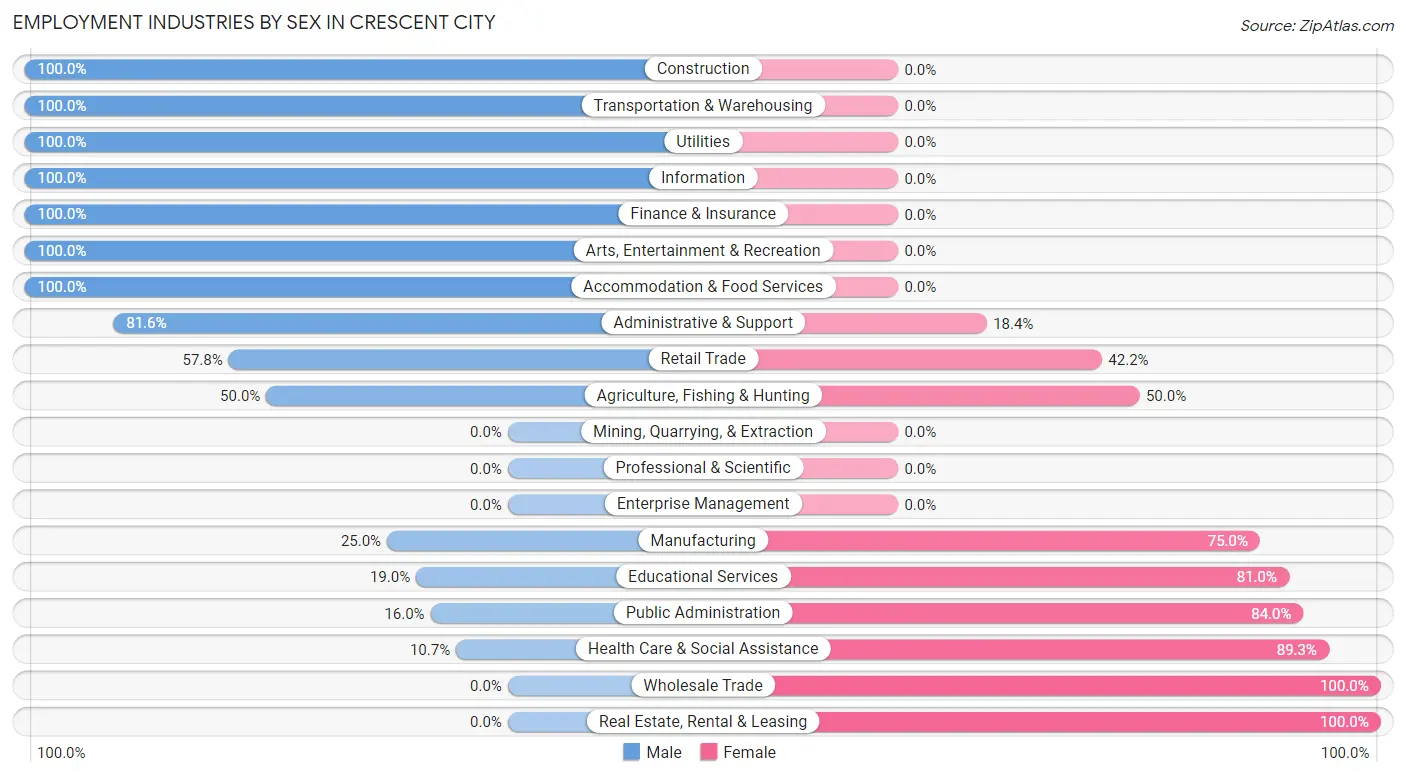
Employment Industries by Sex in Crescent City
The Crescent City industries that see more men than women are Construction (100.0%), Transportation & Warehousing (100.0%), and Utilities (100.0%), whereas the industries that tend to have a higher number of women are Wholesale Trade (100.0%), Real Estate, Rental & Leasing (100.0%), and Health Care & Social Assistance (89.3%).
| Industry | Male | Female |
| Agriculture, Fishing & Hunting | 11 (50.0%) | 11 (50.0%) |
| Mining, Quarrying, & Extraction | 0 (0.0%) | 0 (0.0%) |
| Construction | 35 (100.0%) | 0 (0.0%) |
| Manufacturing | 4 (25.0%) | 12 (75.0%) |
| Wholesale Trade | 0 (0.0%) | 4 (100.0%) |
| Retail Trade | 26 (57.8%) | 19 (42.2%) |
| Transportation & Warehousing | 4 (100.0%) | 0 (0.0%) |
| Utilities | 3 (100.0%) | 0 (0.0%) |
| Information | 5 (100.0%) | 0 (0.0%) |
| Finance & Insurance | 5 (100.0%) | 0 (0.0%) |
| Real Estate, Rental & Leasing | 0 (0.0%) | 9 (100.0%) |
| Professional & Scientific | 0 (0.0%) | 0 (0.0%) |
| Enterprise Management | 0 (0.0%) | 0 (0.0%) |
| Administrative & Support | 80 (81.6%) | 18 (18.4%) |
| Educational Services | 15 (19.0%) | 64 (81.0%) |
| Health Care & Social Assistance | 18 (10.7%) | 150 (89.3%) |
| Arts, Entertainment & Recreation | 2 (100.0%) | 0 (0.0%) |
| Accommodation & Food Services | 4 (100.0%) | 0 (0.0%) |
| Public Administration | 4 (16.0%) | 21 (84.0%) |
| Total | 227 (40.3%) | 337 (59.8%) |
Education in Crescent City
School Enrollment in Crescent City
The most common levels of schooling among the 370 students in Crescent City are high school (195 | 52.7%), middle school (51 | 13.8%), and college / undergraduate (47 | 12.7%).
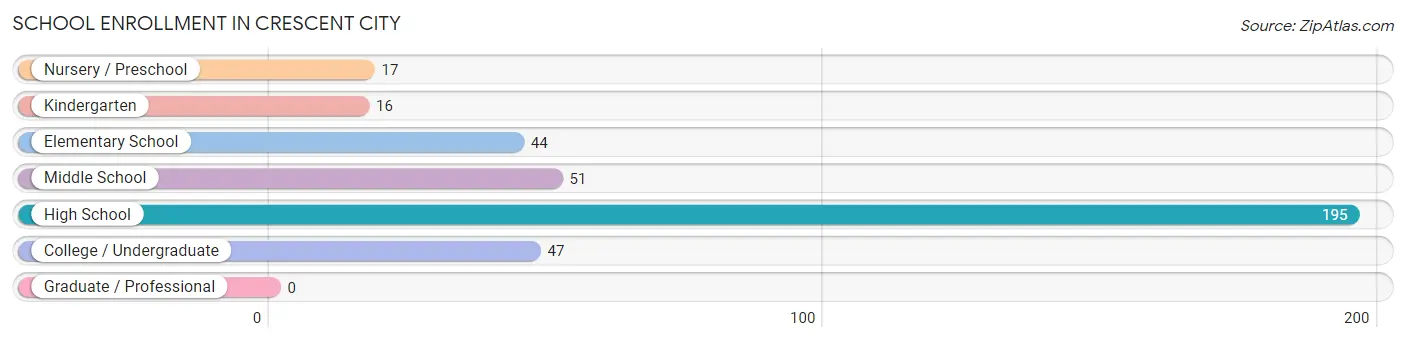
| School Level | # Students | % Students |
| Nursery / Preschool | 17 | 4.6% |
| Kindergarten | 16 | 4.3% |
| Elementary School | 44 | 11.9% |
| Middle School | 51 | 13.8% |
| High School | 195 | 52.7% |
| College / Undergraduate | 47 | 12.7% |
| Graduate / Professional | 0 | 0.0% |
| Total | 370 | 100.0% |
School Enrollment by Age by Funding Source in Crescent City
Out of a total of 370 students who are enrolled in schools in Crescent City, 87 (23.5%) attend a private institution, while the remaining 283 (76.5%) are enrolled in public schools. The age group of 20 to 24 year olds has the highest likelihood of being enrolled in private schools, with 23 (100.0% in the age bracket) enrolled. Conversely, the age group of 15 to 17 year olds has the lowest likelihood of being enrolled in a private school, with 146 (100.0% in the age bracket) attending a public institution.
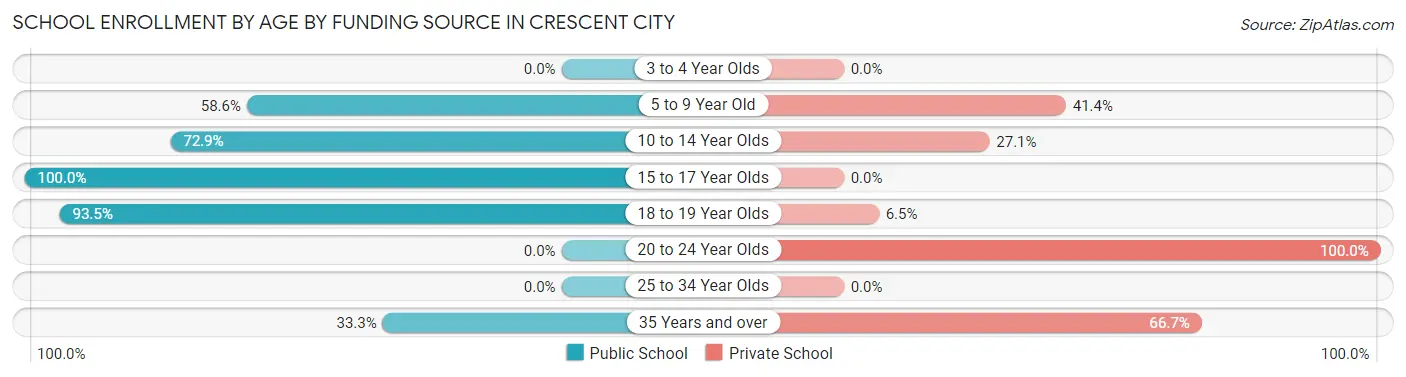
| Age Bracket | Public School | Private School |
| 3 to 4 Year Olds | 0 (0.0%) | 0 (0.0%) |
| 5 to 9 Year Old | 34 (58.6%) | 24 (41.4%) |
| 10 to 14 Year Olds | 51 (72.9%) | 19 (27.1%) |
| 15 to 17 Year Olds | 146 (100.0%) | 0 (0.0%) |
| 18 to 19 Year Olds | 43 (93.5%) | 3 (6.5%) |
| 20 to 24 Year Olds | 0 (0.0%) | 23 (100.0%) |
| 25 to 34 Year Olds | 0 (0.0%) | 0 (0.0%) |
| 35 Years and over | 9 (33.3%) | 18 (66.7%) |
| Total | 283 (76.5%) | 87 (23.5%) |
Educational Attainment by Field of Study in Crescent City
Business (38 | 17.7%), education (38 | 17.7%), social sciences (27 | 12.6%), liberal arts & history (15 | 7.0%), and psychology (13 | 6.0%) are the most common fields of study among 215 individuals in Crescent City who have obtained a bachelor's degree or higher.
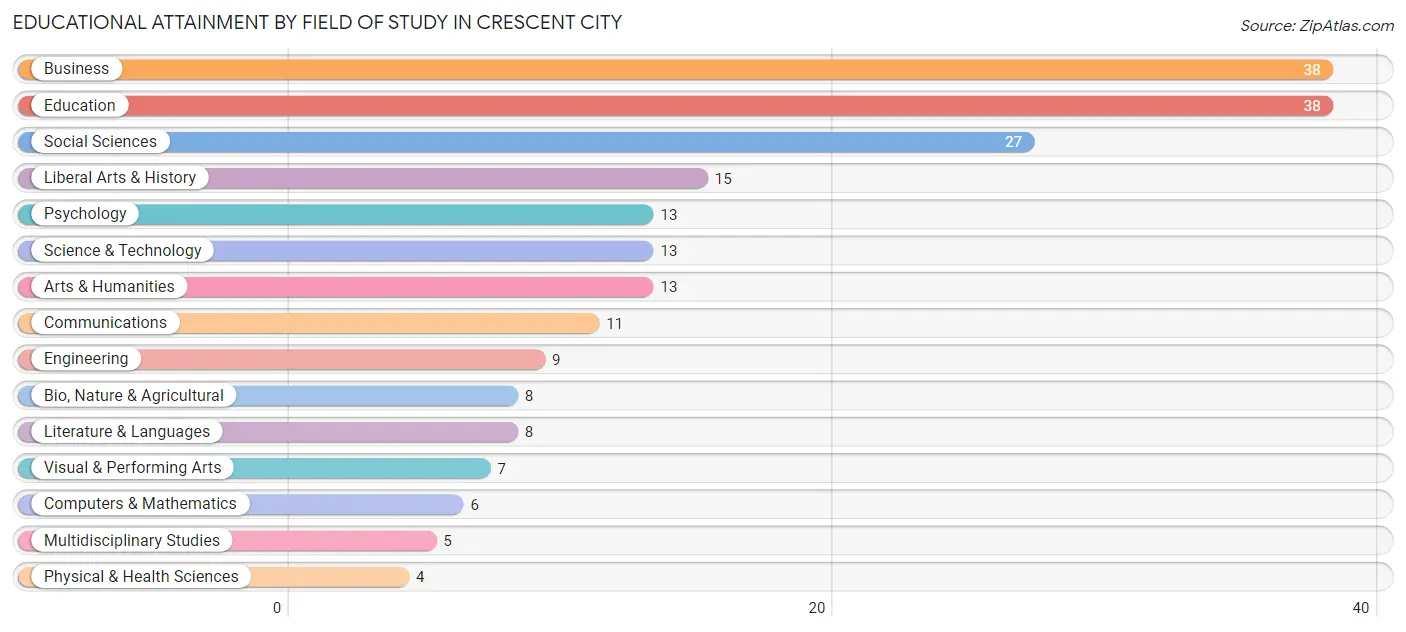
| Field of Study | # Graduates | % Graduates |
| Computers & Mathematics | 6 | 2.8% |
| Bio, Nature & Agricultural | 8 | 3.7% |
| Physical & Health Sciences | 4 | 1.9% |
| Psychology | 13 | 6.0% |
| Social Sciences | 27 | 12.6% |
| Engineering | 9 | 4.2% |
| Multidisciplinary Studies | 5 | 2.3% |
| Science & Technology | 13 | 6.0% |
| Business | 38 | 17.7% |
| Education | 38 | 17.7% |
| Literature & Languages | 8 | 3.7% |
| Liberal Arts & History | 15 | 7.0% |
| Visual & Performing Arts | 7 | 3.3% |
| Communications | 11 | 5.1% |
| Arts & Humanities | 13 | 6.0% |
| Total | 215 | 100.0% |
Transportation & Commute in Crescent City
Vehicle Availability by Sex in Crescent City
The most prevalent vehicle ownership categories in Crescent City are males with 3 vehicles (74, accounting for 33.5%) and females with 3 vehicles (37, making up 22.9%).
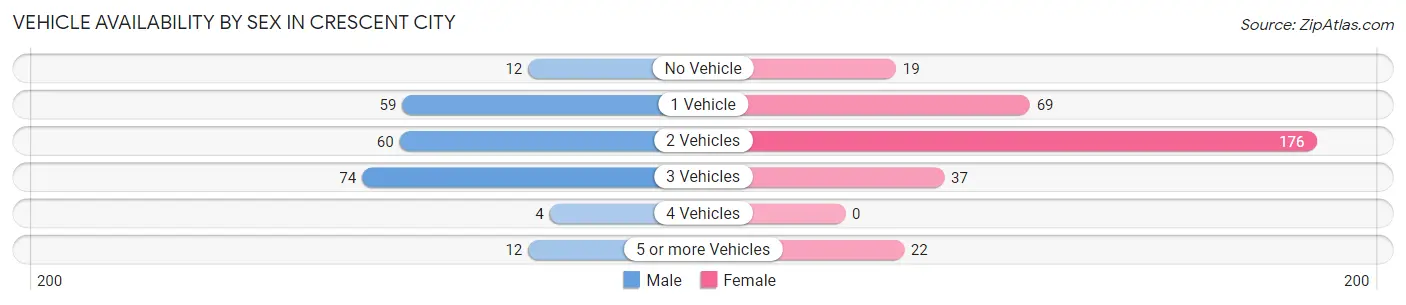
| Vehicles Available | Male | Female |
| No Vehicle | 12 (5.4%) | 19 (5.9%) |
| 1 Vehicle | 59 (26.7%) | 69 (21.4%) |
| 2 Vehicles | 60 (27.2%) | 176 (54.5%) |
| 3 Vehicles | 74 (33.5%) | 37 (11.5%) |
| 4 Vehicles | 4 (1.8%) | 0 (0.0%) |
| 5 or more Vehicles | 12 (5.4%) | 22 (6.8%) |
| Total | 221 (100.0%) | 323 (100.0%) |
Commute Time in Crescent City
The most frequently occuring commute durations in Crescent City are 5 to 9 minutes (163 commuters, 34.4%), 60 to 89 minutes (125 commuters, 26.4%), and 30 to 34 minutes (36 commuters, 7.6%).
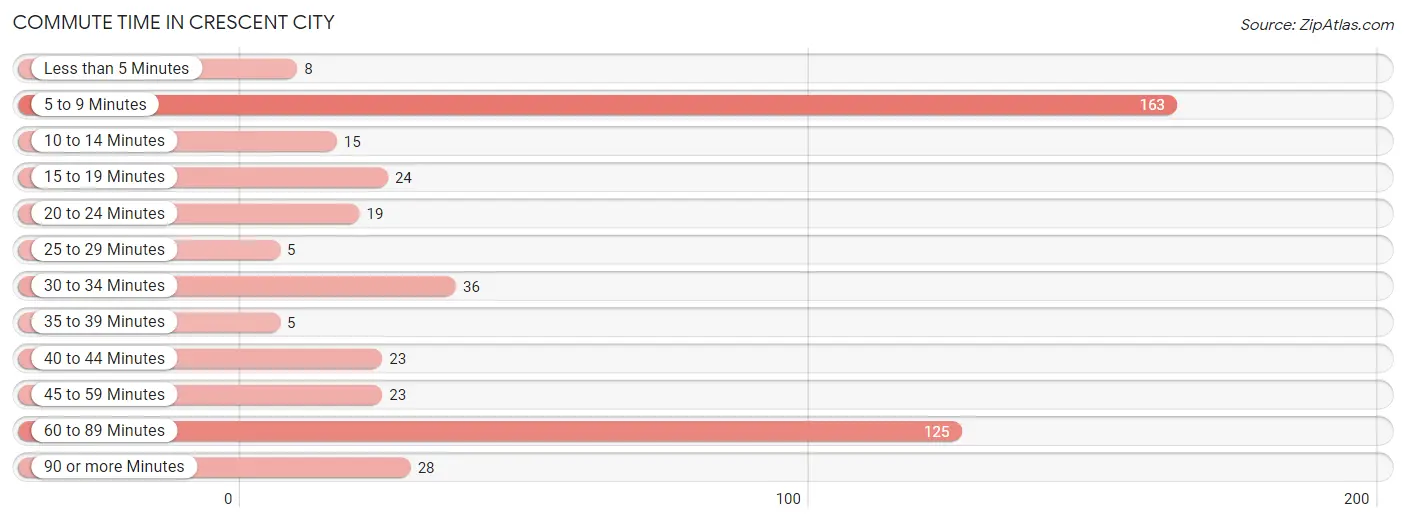
| Commute Time | # Commuters | % Commuters |
| Less than 5 Minutes | 8 | 1.7% |
| 5 to 9 Minutes | 163 | 34.4% |
| 10 to 14 Minutes | 15 | 3.2% |
| 15 to 19 Minutes | 24 | 5.1% |
| 20 to 24 Minutes | 19 | 4.0% |
| 25 to 29 Minutes | 5 | 1.1% |
| 30 to 34 Minutes | 36 | 7.6% |
| 35 to 39 Minutes | 5 | 1.1% |
| 40 to 44 Minutes | 23 | 4.9% |
| 45 to 59 Minutes | 23 | 4.9% |
| 60 to 89 Minutes | 125 | 26.4% |
| 90 or more Minutes | 28 | 5.9% |
Commute Time by Sex in Crescent City
The most common commute times in Crescent City are 60 to 89 minutes (83 commuters, 43.2%) for males and 5 to 9 minutes (136 commuters, 48.2%) for females.
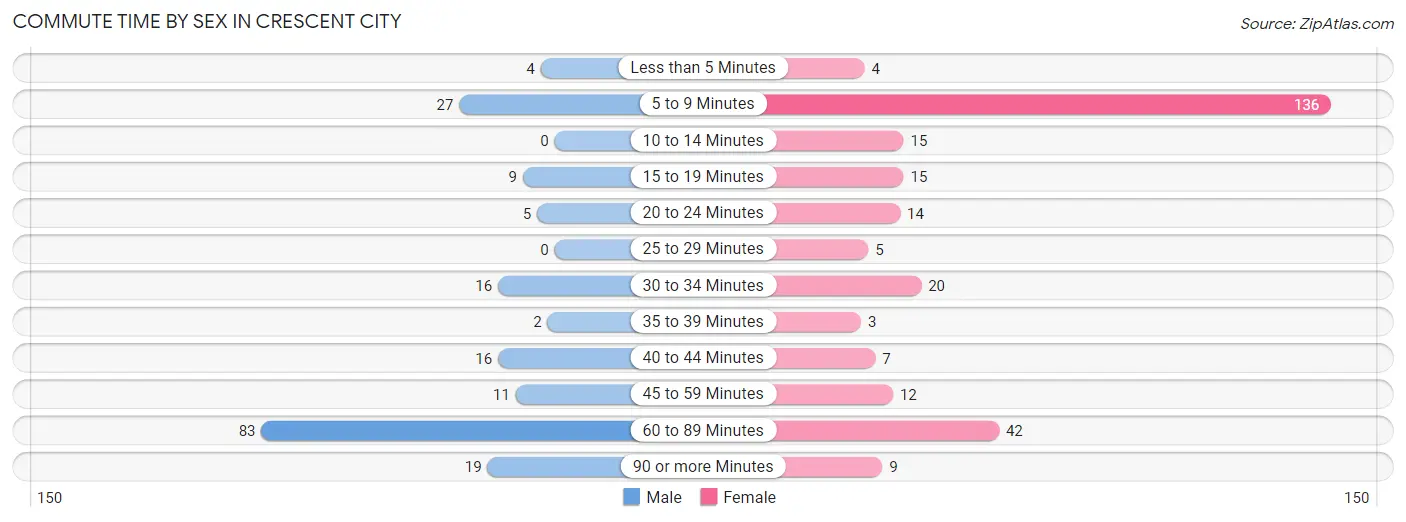
| Commute Time | Male | Female |
| Less than 5 Minutes | 4 (2.1%) | 4 (1.4%) |
| 5 to 9 Minutes | 27 (14.1%) | 136 (48.2%) |
| 10 to 14 Minutes | 0 (0.0%) | 15 (5.3%) |
| 15 to 19 Minutes | 9 (4.7%) | 15 (5.3%) |
| 20 to 24 Minutes | 5 (2.6%) | 14 (5.0%) |
| 25 to 29 Minutes | 0 (0.0%) | 5 (1.8%) |
| 30 to 34 Minutes | 16 (8.3%) | 20 (7.1%) |
| 35 to 39 Minutes | 2 (1.0%) | 3 (1.1%) |
| 40 to 44 Minutes | 16 (8.3%) | 7 (2.5%) |
| 45 to 59 Minutes | 11 (5.7%) | 12 (4.3%) |
| 60 to 89 Minutes | 83 (43.2%) | 42 (14.9%) |
| 90 or more Minutes | 19 (9.9%) | 9 (3.2%) |
Time of Departure to Work by Sex in Crescent City
The most frequent times of departure to work in Crescent City are 6:00 AM to 6:29 AM (71, 37.0%) for males and 6:00 AM to 6:29 AM (60, 21.3%) for females.
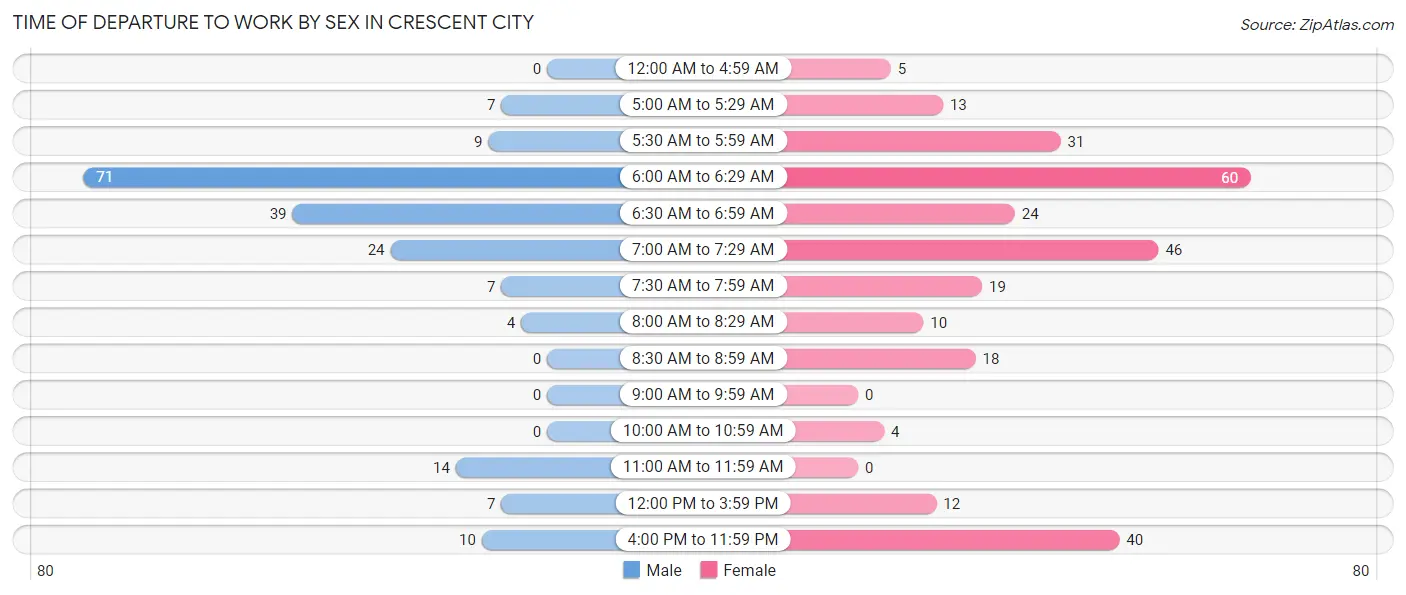
| Time of Departure | Male | Female |
| 12:00 AM to 4:59 AM | 0 (0.0%) | 5 (1.8%) |
| 5:00 AM to 5:29 AM | 7 (3.6%) | 13 (4.6%) |
| 5:30 AM to 5:59 AM | 9 (4.7%) | 31 (11.0%) |
| 6:00 AM to 6:29 AM | 71 (37.0%) | 60 (21.3%) |
| 6:30 AM to 6:59 AM | 39 (20.3%) | 24 (8.5%) |
| 7:00 AM to 7:29 AM | 24 (12.5%) | 46 (16.3%) |
| 7:30 AM to 7:59 AM | 7 (3.6%) | 19 (6.7%) |
| 8:00 AM to 8:29 AM | 4 (2.1%) | 10 (3.5%) |
| 8:30 AM to 8:59 AM | 0 (0.0%) | 18 (6.4%) |
| 9:00 AM to 9:59 AM | 0 (0.0%) | 0 (0.0%) |
| 10:00 AM to 10:59 AM | 0 (0.0%) | 4 (1.4%) |
| 11:00 AM to 11:59 AM | 14 (7.3%) | 0 (0.0%) |
| 12:00 PM to 3:59 PM | 7 (3.6%) | 12 (4.3%) |
| 4:00 PM to 11:59 PM | 10 (5.2%) | 40 (14.2%) |
| Total | 192 (100.0%) | 282 (100.0%) |
Housing Occupancy in Crescent City
Occupancy by Ownership in Crescent City
Of the total 712 dwellings in Crescent City, owner-occupied units account for 432 (60.7%), while renter-occupied units make up 280 (39.3%).
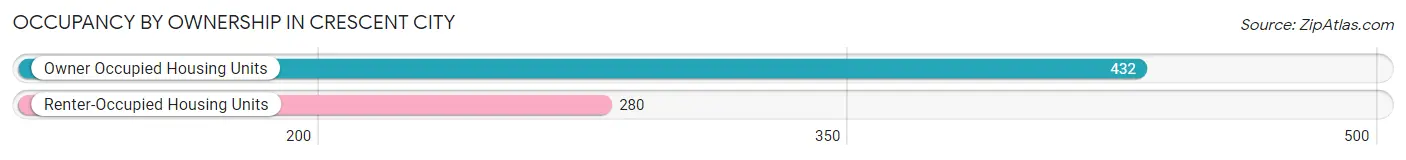
| Occupancy | # Housing Units | % Housing Units |
| Owner Occupied Housing Units | 432 | 60.7% |
| Renter-Occupied Housing Units | 280 | 39.3% |
| Total Occupied Housing Units | 712 | 100.0% |
Occupancy by Household Size in Crescent City
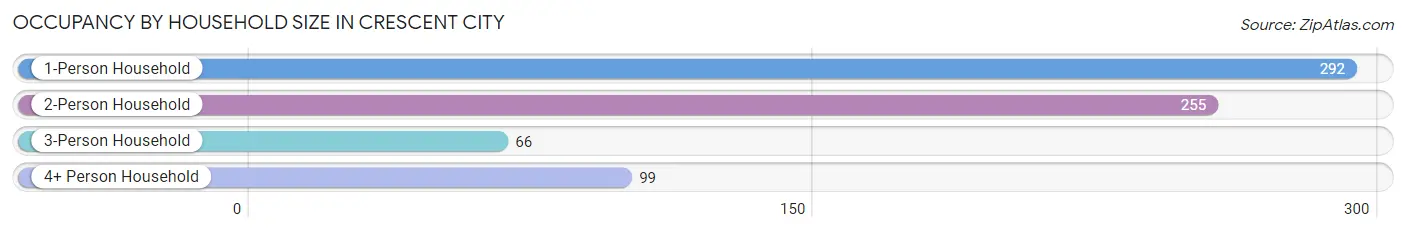
| Household Size | # Housing Units | % Housing Units |
| 1-Person Household | 292 | 41.0% |
| 2-Person Household | 255 | 35.8% |
| 3-Person Household | 66 | 9.3% |
| 4+ Person Household | 99 | 13.9% |
| Total Housing Units | 712 | 100.0% |
Occupancy by Ownership by Household Size in Crescent City
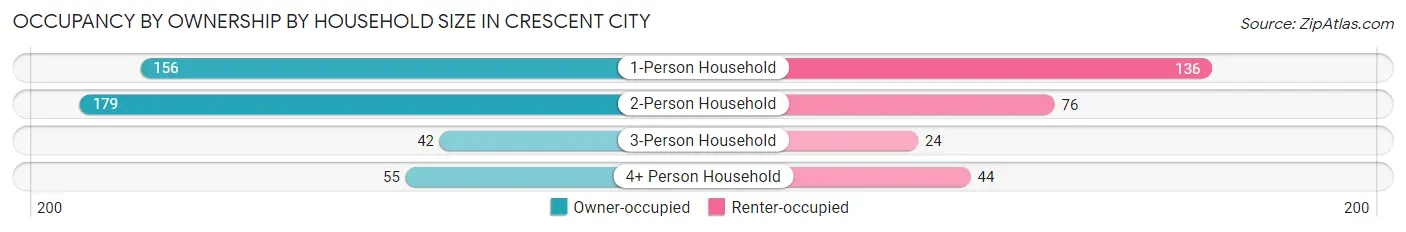
| Household Size | Owner-occupied | Renter-occupied |
| 1-Person Household | 156 (53.4%) | 136 (46.6%) |
| 2-Person Household | 179 (70.2%) | 76 (29.8%) |
| 3-Person Household | 42 (63.6%) | 24 (36.4%) |
| 4+ Person Household | 55 (55.6%) | 44 (44.4%) |
| Total Housing Units | 432 (60.7%) | 280 (39.3%) |
Occupancy by Educational Attainment in Crescent City
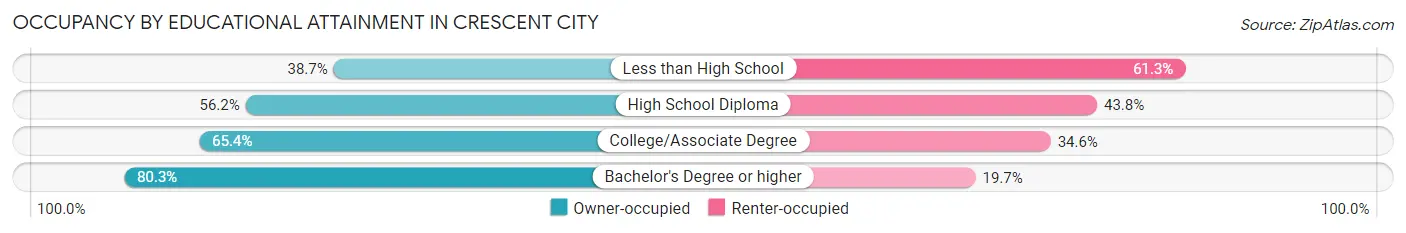
| Household Size | Owner-occupied | Renter-occupied |
| Less than High School | 43 (38.7%) | 68 (61.3%) |
| High School Diploma | 145 (56.2%) | 113 (43.8%) |
| College/Associate Degree | 138 (65.4%) | 73 (34.6%) |
| Bachelor's Degree or higher | 106 (80.3%) | 26 (19.7%) |
Occupancy by Age of Householder in Crescent City
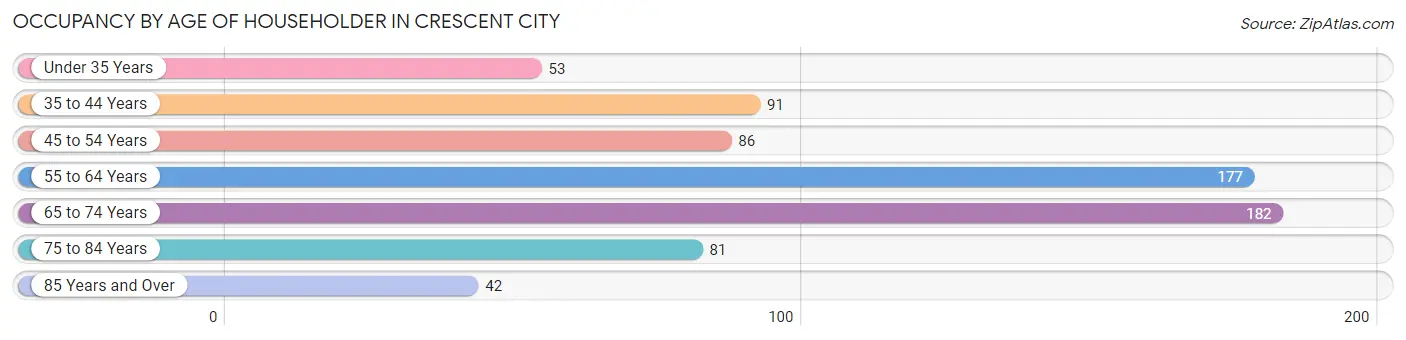
| Age Bracket | # Households | % Households |
| Under 35 Years | 53 | 7.4% |
| 35 to 44 Years | 91 | 12.8% |
| 45 to 54 Years | 86 | 12.1% |
| 55 to 64 Years | 177 | 24.9% |
| 65 to 74 Years | 182 | 25.6% |
| 75 to 84 Years | 81 | 11.4% |
| 85 Years and Over | 42 | 5.9% |
| Total | 712 | 100.0% |
Housing Finances in Crescent City
Median Income by Occupancy in Crescent City
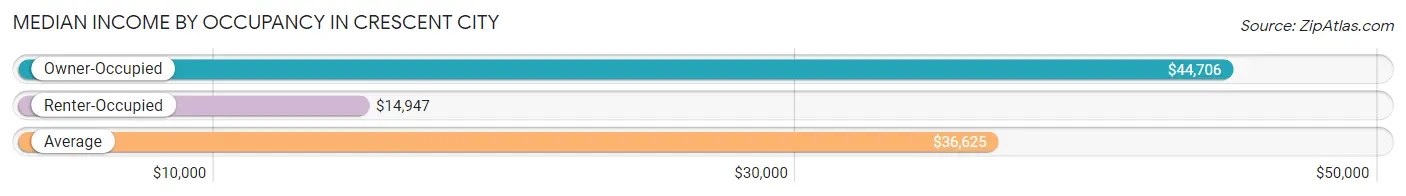
| Occupancy Type | # Households | Median Income |
| Owner-Occupied | 432 (60.7%) | $44,706 |
| Renter-Occupied | 280 (39.3%) | $14,947 |
| Average | 712 (100.0%) | $36,625 |
Occupancy by Householder Income Bracket in Crescent City
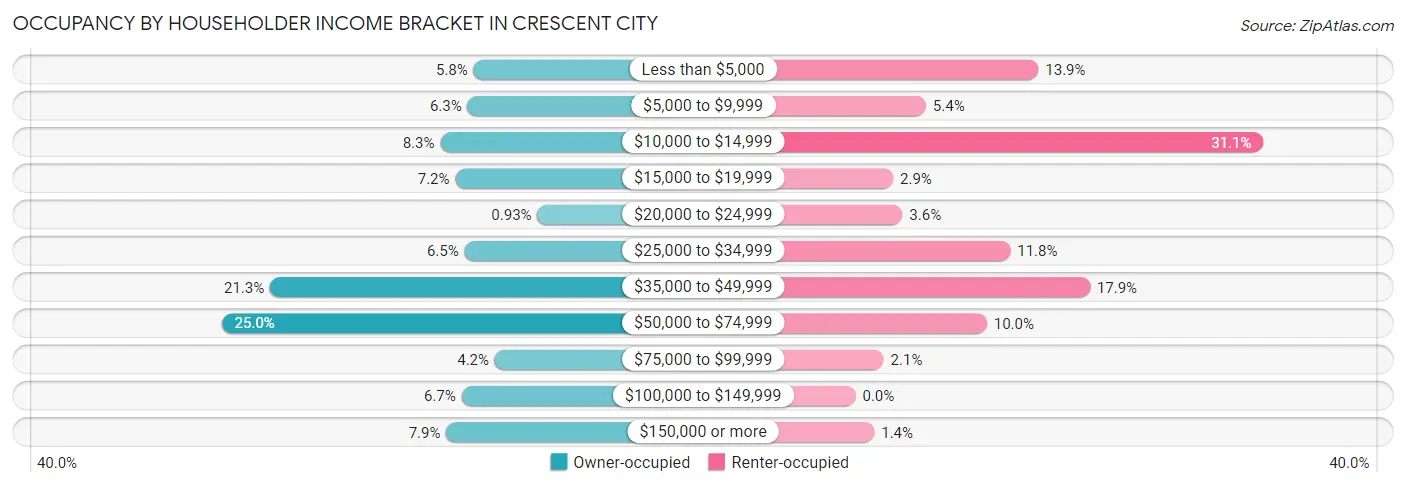
| Income Bracket | Owner-occupied | Renter-occupied |
| Less than $5,000 | 25 (5.8%) | 39 (13.9%) |
| $5,000 to $9,999 | 27 (6.2%) | 15 (5.4%) |
| $10,000 to $14,999 | 36 (8.3%) | 87 (31.1%) |
| $15,000 to $19,999 | 31 (7.2%) | 8 (2.9%) |
| $20,000 to $24,999 | 4 (0.9%) | 10 (3.6%) |
| $25,000 to $34,999 | 28 (6.5%) | 33 (11.8%) |
| $35,000 to $49,999 | 92 (21.3%) | 50 (17.9%) |
| $50,000 to $74,999 | 108 (25.0%) | 28 (10.0%) |
| $75,000 to $99,999 | 18 (4.2%) | 6 (2.1%) |
| $100,000 to $149,999 | 29 (6.7%) | 0 (0.0%) |
| $150,000 or more | 34 (7.9%) | 4 (1.4%) |
| Total | 432 (100.0%) | 280 (100.0%) |
Monthly Housing Cost Tiers in Crescent City
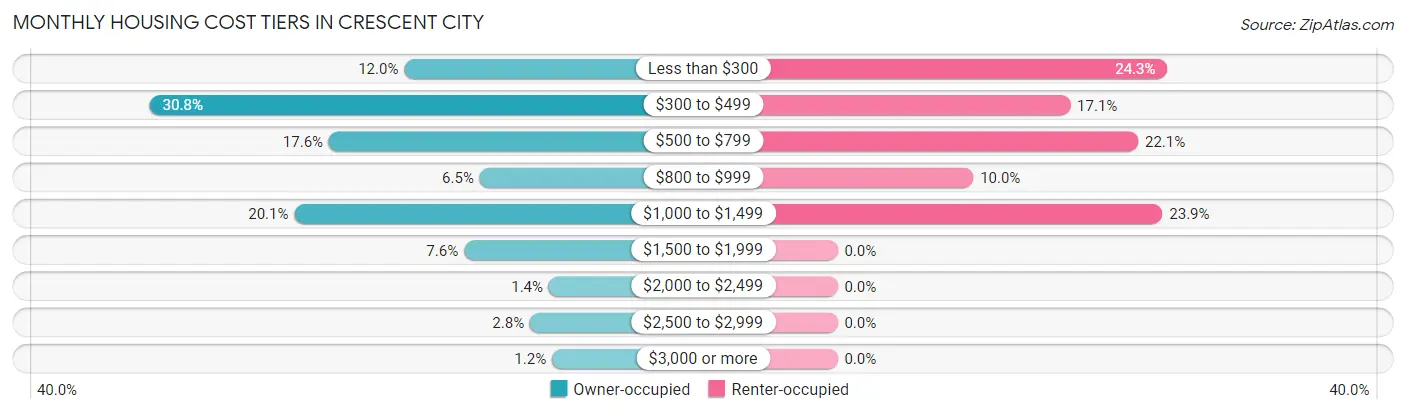
| Monthly Cost | Owner-occupied | Renter-occupied |
| Less than $300 | 52 (12.0%) | 68 (24.3%) |
| $300 to $499 | 133 (30.8%) | 48 (17.1%) |
| $500 to $799 | 76 (17.6%) | 62 (22.1%) |
| $800 to $999 | 28 (6.5%) | 28 (10.0%) |
| $1,000 to $1,499 | 87 (20.1%) | 67 (23.9%) |
| $1,500 to $1,999 | 33 (7.6%) | 0 (0.0%) |
| $2,000 to $2,499 | 6 (1.4%) | 0 (0.0%) |
| $2,500 to $2,999 | 12 (2.8%) | 0 (0.0%) |
| $3,000 or more | 5 (1.2%) | 0 (0.0%) |
| Total | 432 (100.0%) | 280 (100.0%) |
Physical Housing Characteristics in Crescent City
Housing Structures in Crescent City
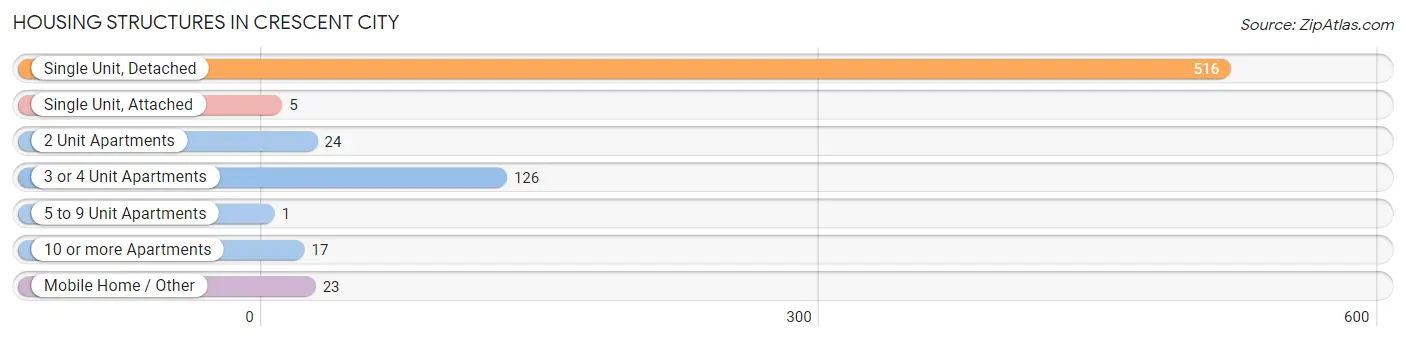
| Structure Type | # Housing Units | % Housing Units |
| Single Unit, Detached | 516 | 72.5% |
| Single Unit, Attached | 5 | 0.7% |
| 2 Unit Apartments | 24 | 3.4% |
| 3 or 4 Unit Apartments | 126 | 17.7% |
| 5 to 9 Unit Apartments | 1 | 0.1% |
| 10 or more Apartments | 17 | 2.4% |
| Mobile Home / Other | 23 | 3.2% |
| Total | 712 | 100.0% |
Housing Structures by Occupancy in Crescent City
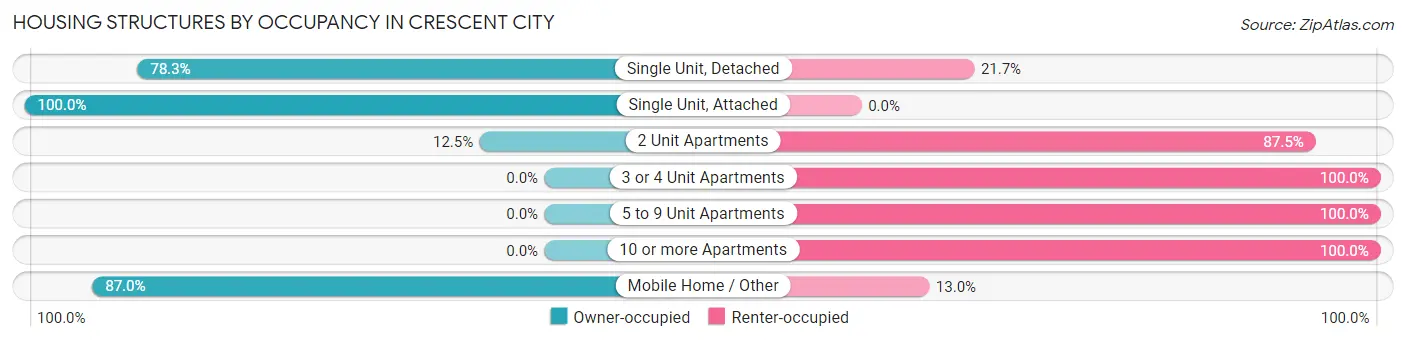
| Structure Type | Owner-occupied | Renter-occupied |
| Single Unit, Detached | 404 (78.3%) | 112 (21.7%) |
| Single Unit, Attached | 5 (100.0%) | 0 (0.0%) |
| 2 Unit Apartments | 3 (12.5%) | 21 (87.5%) |
| 3 or 4 Unit Apartments | 0 (0.0%) | 126 (100.0%) |
| 5 to 9 Unit Apartments | 0 (0.0%) | 1 (100.0%) |
| 10 or more Apartments | 0 (0.0%) | 17 (100.0%) |
| Mobile Home / Other | 20 (87.0%) | 3 (13.0%) |
| Total | 432 (60.7%) | 280 (39.3%) |
Housing Structures by Number of Rooms in Crescent City
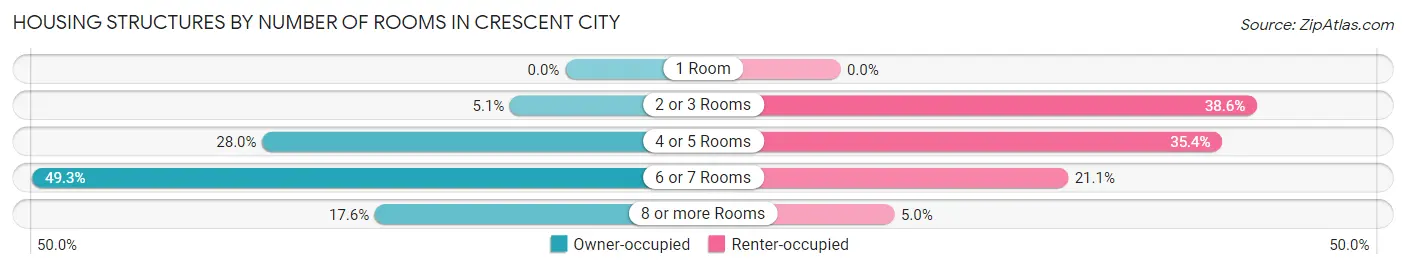
| Number of Rooms | Owner-occupied | Renter-occupied |
| 1 Room | 0 (0.0%) | 0 (0.0%) |
| 2 or 3 Rooms | 22 (5.1%) | 108 (38.6%) |
| 4 or 5 Rooms | 121 (28.0%) | 99 (35.4%) |
| 6 or 7 Rooms | 213 (49.3%) | 59 (21.1%) |
| 8 or more Rooms | 76 (17.6%) | 14 (5.0%) |
| Total | 432 (100.0%) | 280 (100.0%) |
Housing Structure by Heating Type in Crescent City
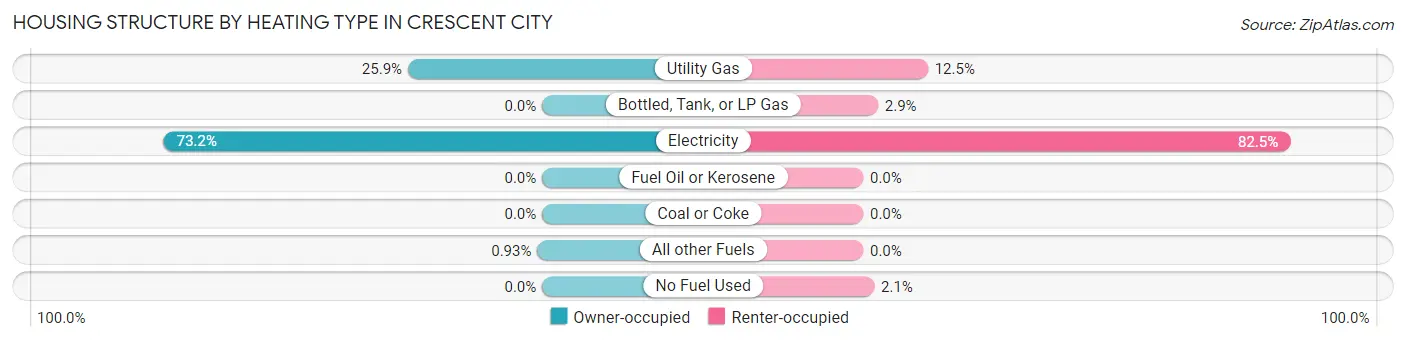
| Heating Type | Owner-occupied | Renter-occupied |
| Utility Gas | 112 (25.9%) | 35 (12.5%) |
| Bottled, Tank, or LP Gas | 0 (0.0%) | 8 (2.9%) |
| Electricity | 316 (73.2%) | 231 (82.5%) |
| Fuel Oil or Kerosene | 0 (0.0%) | 0 (0.0%) |
| Coal or Coke | 0 (0.0%) | 0 (0.0%) |
| All other Fuels | 4 (0.9%) | 0 (0.0%) |
| No Fuel Used | 0 (0.0%) | 6 (2.1%) |
| Total | 432 (100.0%) | 280 (100.0%) |
Household Vehicle Usage in Crescent City
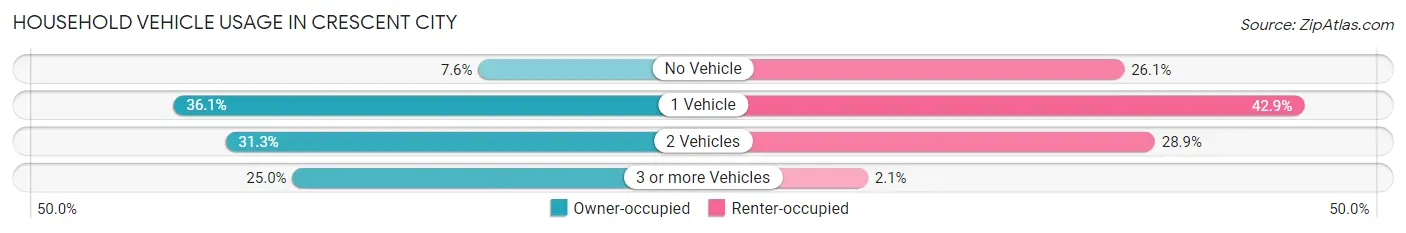
| Vehicles per Household | Owner-occupied | Renter-occupied |
| No Vehicle | 33 (7.6%) | 73 (26.1%) |
| 1 Vehicle | 156 (36.1%) | 120 (42.9%) |
| 2 Vehicles | 135 (31.2%) | 81 (28.9%) |
| 3 or more Vehicles | 108 (25.0%) | 6 (2.1%) |
| Total | 432 (100.0%) | 280 (100.0%) |
Real Estate & Mortgages in Crescent City
Real Estate and Mortgage Overview in Crescent City
| Characteristic | Without Mortgage | With Mortgage |
| Housing Units | 278 | 154 |
| Median Property Value | $150,000 | $210,900 |
| Median Household Income | $40,476 | $22 |
| Monthly Housing Costs | $427 | $0 |
| Real Estate Taxes | $1,335 | $0 |
Property Value by Mortgage Status in Crescent City
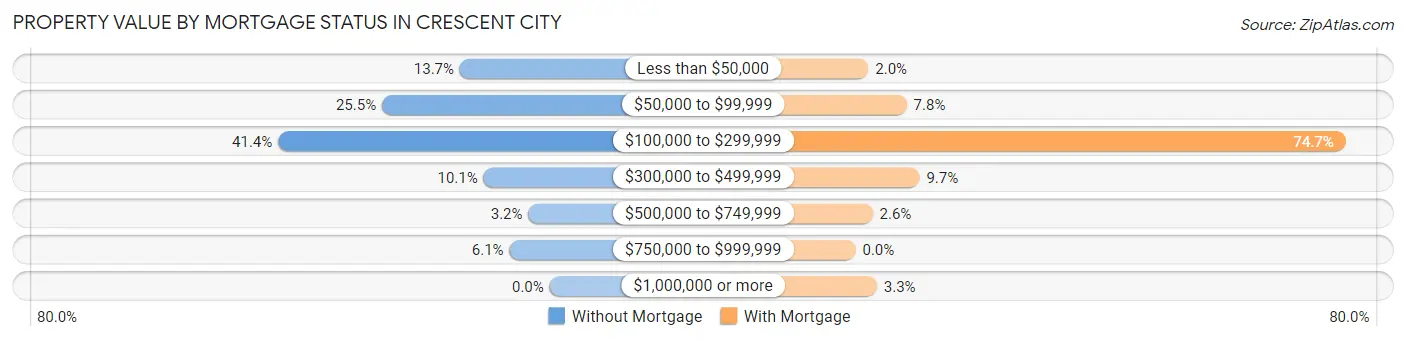
| Property Value | Without Mortgage | With Mortgage |
| Less than $50,000 | 38 (13.7%) | 3 (1.9%) |
| $50,000 to $99,999 | 71 (25.5%) | 12 (7.8%) |
| $100,000 to $299,999 | 115 (41.4%) | 115 (74.7%) |
| $300,000 to $499,999 | 28 (10.1%) | 15 (9.7%) |
| $500,000 to $749,999 | 9 (3.2%) | 4 (2.6%) |
| $750,000 to $999,999 | 17 (6.1%) | 0 (0.0%) |
| $1,000,000 or more | 0 (0.0%) | 5 (3.3%) |
| Total | 278 (100.0%) | 154 (100.0%) |
Household Income by Mortgage Status in Crescent City
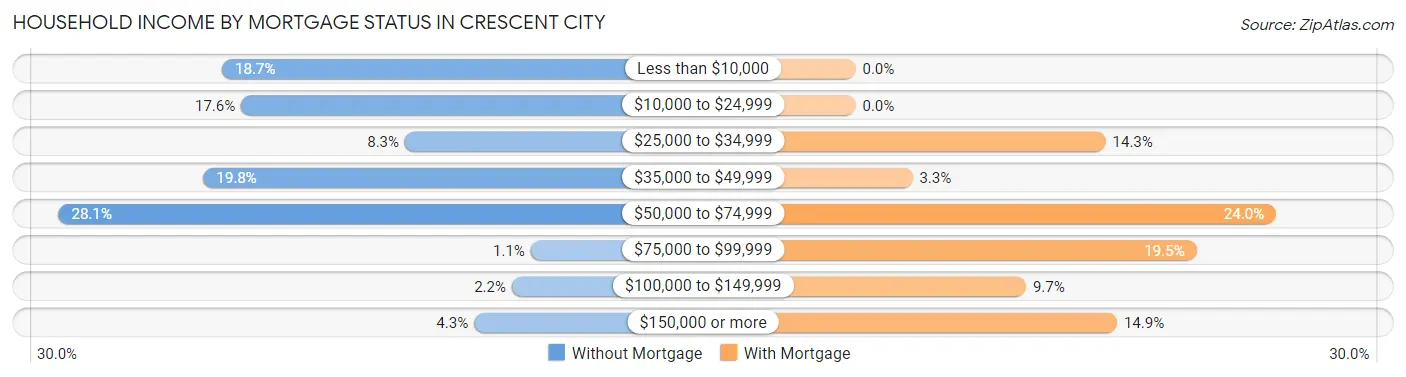
| Household Income | Without Mortgage | With Mortgage |
| Less than $10,000 | 52 (18.7%) | 0 (0.0%) |
| $10,000 to $24,999 | 49 (17.6%) | 0 (0.0%) |
| $25,000 to $34,999 | 23 (8.3%) | 22 (14.3%) |
| $35,000 to $49,999 | 55 (19.8%) | 5 (3.3%) |
| $50,000 to $74,999 | 78 (28.1%) | 37 (24.0%) |
| $75,000 to $99,999 | 3 (1.1%) | 30 (19.5%) |
| $100,000 to $149,999 | 6 (2.2%) | 15 (9.7%) |
| $150,000 or more | 12 (4.3%) | 23 (14.9%) |
| Total | 278 (100.0%) | 154 (100.0%) |
Property Value to Household Income Ratio in Crescent City
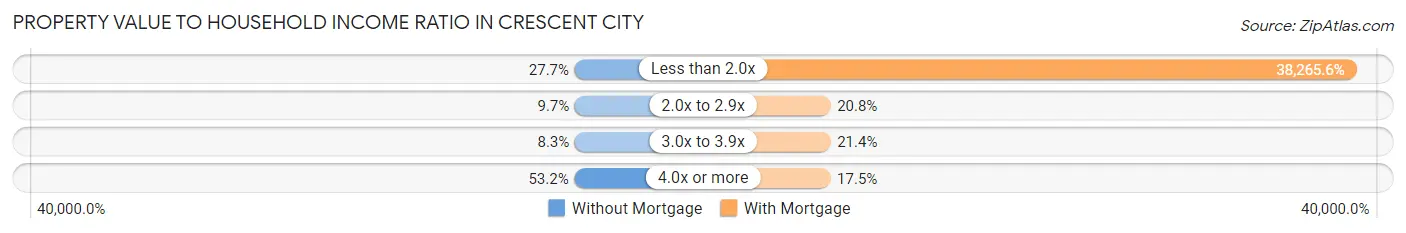
| Value-to-Income Ratio | Without Mortgage | With Mortgage |
| Less than 2.0x | 77 (27.7%) | 58,929 (38,265.6%) |
| 2.0x to 2.9x | 27 (9.7%) | 32 (20.8%) |
| 3.0x to 3.9x | 23 (8.3%) | 33 (21.4%) |
| 4.0x or more | 148 (53.2%) | 27 (17.5%) |
| Total | 278 (100.0%) | 154 (100.0%) |
Real Estate Taxes by Mortgage Status in Crescent City
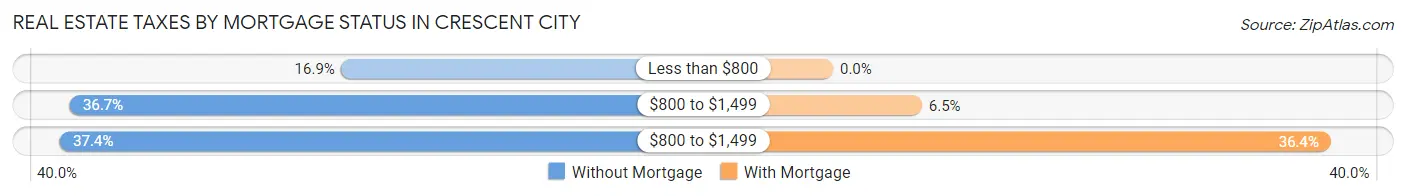
| Property Taxes | Without Mortgage | With Mortgage |
| Less than $800 | 47 (16.9%) | 0 (0.0%) |
| $800 to $1,499 | 102 (36.7%) | 10 (6.5%) |
| $800 to $1,499 | 104 (37.4%) | 56 (36.4%) |
| Total | 278 (100.0%) | 154 (100.0%) |
Health & Disability in Crescent City
Health Insurance Coverage by Age in Crescent City
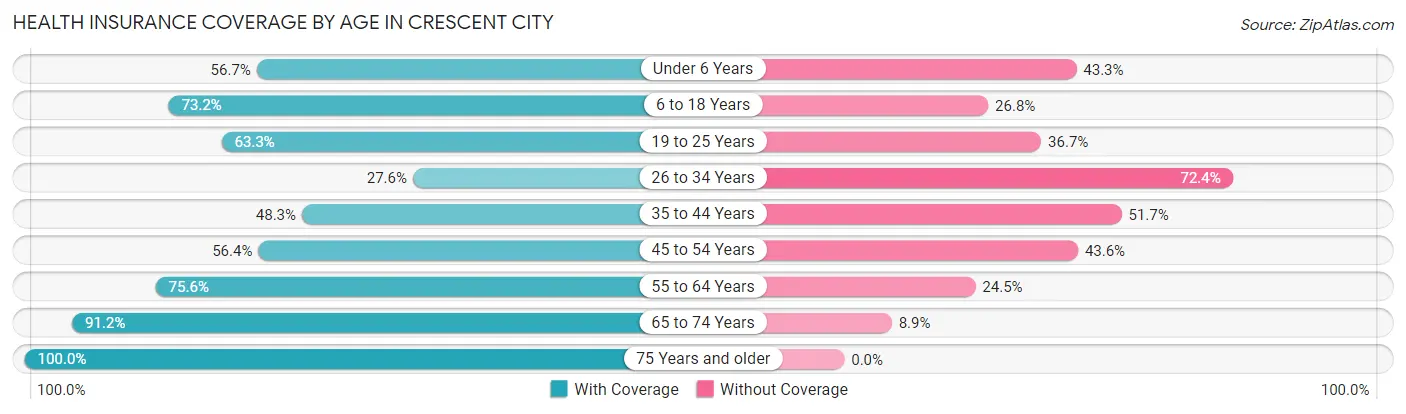
| Age Bracket | With Coverage | Without Coverage |
| Under 6 Years | 97 (56.7%) | 74 (43.3%) |
| 6 to 18 Years | 240 (73.2%) | 88 (26.8%) |
| 19 to 25 Years | 181 (63.3%) | 105 (36.7%) |
| 26 to 34 Years | 37 (27.6%) | 97 (72.4%) |
| 35 to 44 Years | 85 (48.3%) | 91 (51.7%) |
| 45 to 54 Years | 79 (56.4%) | 61 (43.6%) |
| 55 to 64 Years | 207 (75.5%) | 67 (24.4%) |
| 65 to 74 Years | 237 (91.1%) | 23 (8.8%) |
| 75 Years and older | 168 (100.0%) | 0 (0.0%) |
| Total | 1,331 (68.7%) | 606 (31.3%) |
Health Insurance Coverage by Citizenship Status in Crescent City
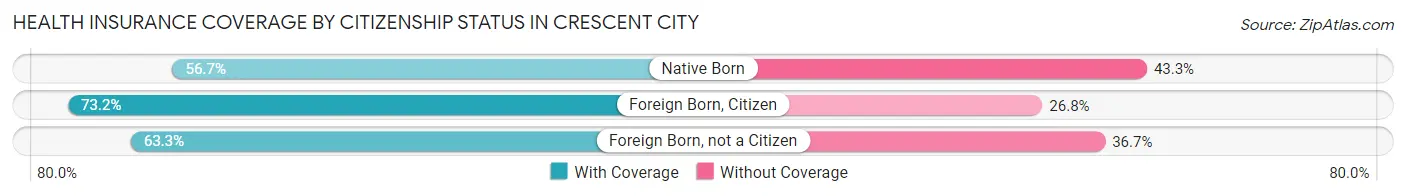
| Citizenship Status | With Coverage | Without Coverage |
| Native Born | 97 (56.7%) | 74 (43.3%) |
| Foreign Born, Citizen | 240 (73.2%) | 88 (26.8%) |
| Foreign Born, not a Citizen | 181 (63.3%) | 105 (36.7%) |
Health Insurance Coverage by Household Income in Crescent City
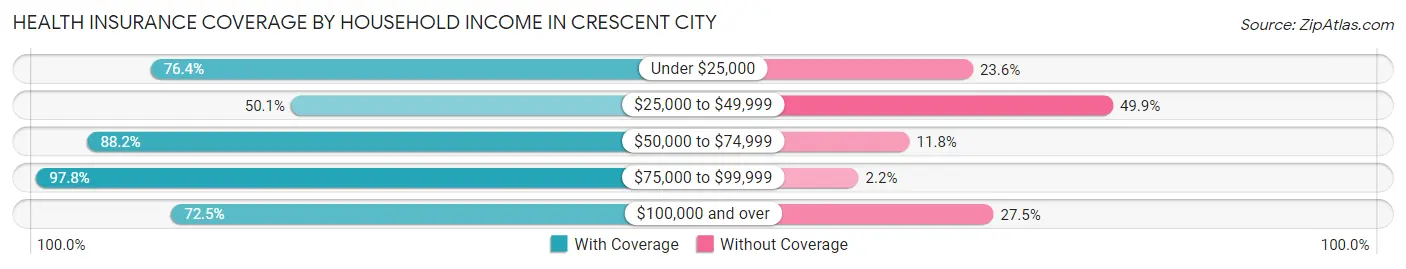
| Household Income | With Coverage | Without Coverage |
| Under $25,000 | 394 (76.4%) | 122 (23.6%) |
| $25,000 to $49,999 | 390 (50.1%) | 388 (49.9%) |
| $50,000 to $74,999 | 262 (88.2%) | 35 (11.8%) |
| $75,000 to $99,999 | 132 (97.8%) | 3 (2.2%) |
| $100,000 and over | 153 (72.5%) | 58 (27.5%) |
Public vs Private Health Insurance Coverage by Age in Crescent City
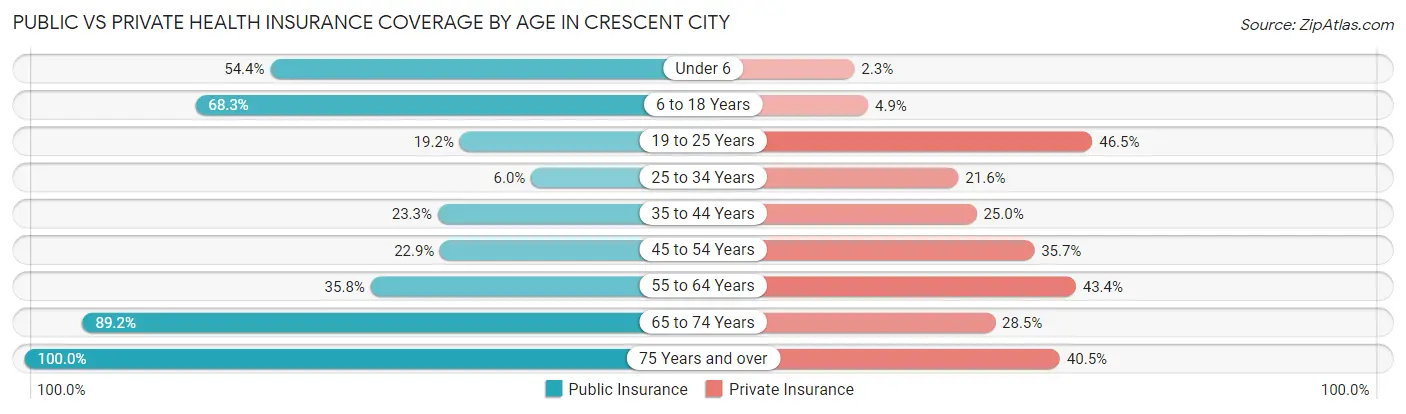
| Age Bracket | Public Insurance | Private Insurance |
| Under 6 | 93 (54.4%) | 4 (2.3%) |
| 6 to 18 Years | 224 (68.3%) | 16 (4.9%) |
| 19 to 25 Years | 55 (19.2%) | 133 (46.5%) |
| 25 to 34 Years | 8 (6.0%) | 29 (21.6%) |
| 35 to 44 Years | 41 (23.3%) | 44 (25.0%) |
| 45 to 54 Years | 32 (22.9%) | 50 (35.7%) |
| 55 to 64 Years | 98 (35.8%) | 119 (43.4%) |
| 65 to 74 Years | 232 (89.2%) | 74 (28.5%) |
| 75 Years and over | 168 (100.0%) | 68 (40.5%) |
| Total | 951 (49.1%) | 537 (27.7%) |
Disability Status by Sex by Age in Crescent City
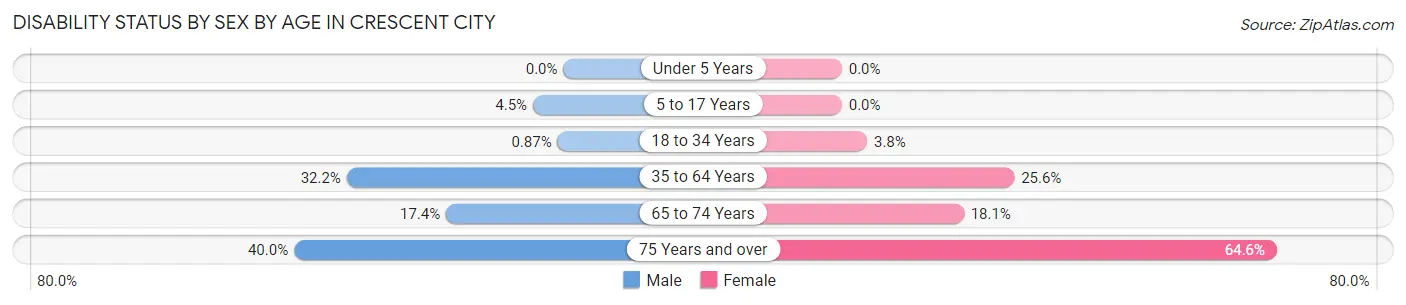
| Age Bracket | Male | Female |
| Under 5 Years | 0 (0.0%) | 0 (0.0%) |
| 5 to 17 Years | 8 (4.5%) | 0 (0.0%) |
| 18 to 34 Years | 2 (0.9%) | 9 (3.7%) |
| 35 to 64 Years | 83 (32.2%) | 85 (25.6%) |
| 65 to 74 Years | 27 (17.4%) | 19 (18.1%) |
| 75 Years and over | 22 (40.0%) | 73 (64.6%) |
Disability Class by Sex by Age in Crescent City
Disability Class: Hearing Difficulty
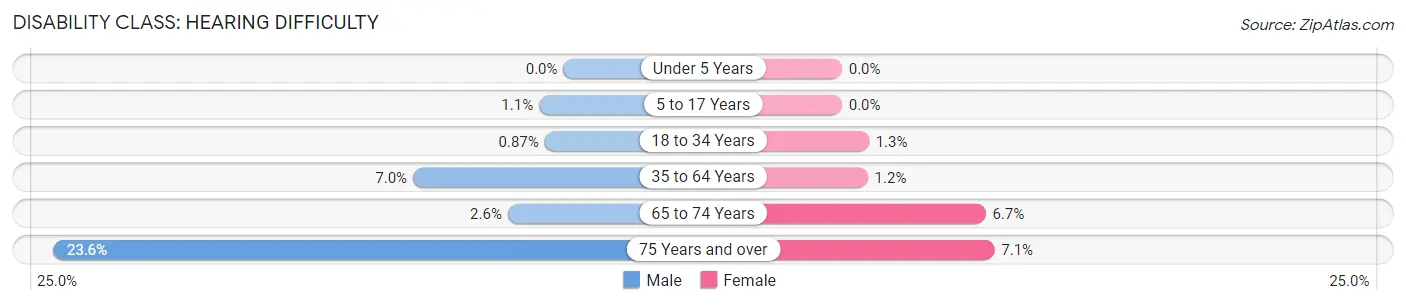
| Age Bracket | Male | Female |
| Under 5 Years | 0 (0.0%) | 0 (0.0%) |
| 5 to 17 Years | 2 (1.1%) | 0 (0.0%) |
| 18 to 34 Years | 2 (0.9%) | 3 (1.3%) |
| 35 to 64 Years | 18 (7.0%) | 4 (1.2%) |
| 65 to 74 Years | 4 (2.6%) | 7 (6.7%) |
| 75 Years and over | 13 (23.6%) | 8 (7.1%) |
Disability Class: Vision Difficulty
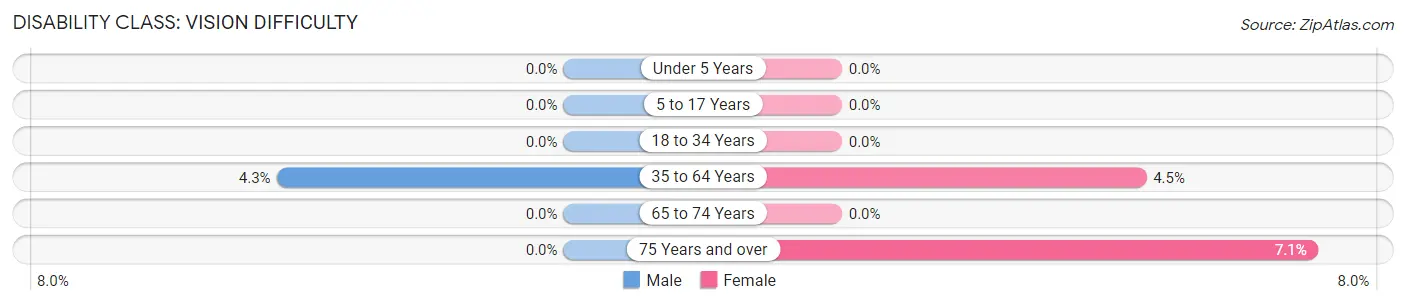
| Age Bracket | Male | Female |
| Under 5 Years | 0 (0.0%) | 0 (0.0%) |
| 5 to 17 Years | 0 (0.0%) | 0 (0.0%) |
| 18 to 34 Years | 0 (0.0%) | 0 (0.0%) |
| 35 to 64 Years | 11 (4.3%) | 15 (4.5%) |
| 65 to 74 Years | 0 (0.0%) | 0 (0.0%) |
| 75 Years and over | 0 (0.0%) | 8 (7.1%) |
Disability Class: Cognitive Difficulty
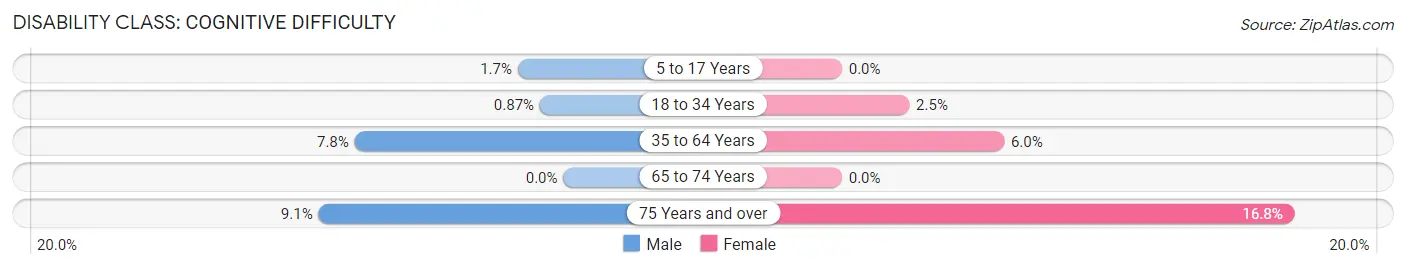
| Age Bracket | Male | Female |
| 5 to 17 Years | 3 (1.7%) | 0 (0.0%) |
| 18 to 34 Years | 2 (0.9%) | 6 (2.5%) |
| 35 to 64 Years | 20 (7.7%) | 20 (6.0%) |
| 65 to 74 Years | 0 (0.0%) | 0 (0.0%) |
| 75 Years and over | 5 (9.1%) | 19 (16.8%) |
Disability Class: Ambulatory Difficulty
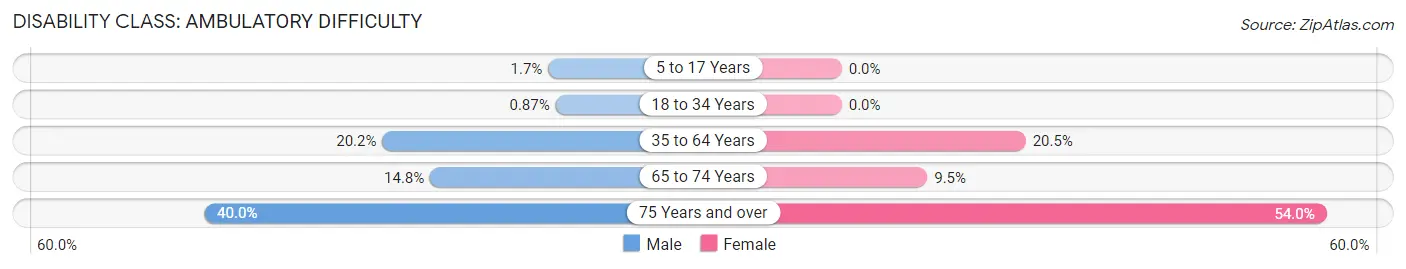
| Age Bracket | Male | Female |
| 5 to 17 Years | 3 (1.7%) | 0 (0.0%) |
| 18 to 34 Years | 2 (0.9%) | 0 (0.0%) |
| 35 to 64 Years | 52 (20.2%) | 68 (20.5%) |
| 65 to 74 Years | 23 (14.8%) | 10 (9.5%) |
| 75 Years and over | 22 (40.0%) | 61 (54.0%) |
Disability Class: Self-Care Difficulty
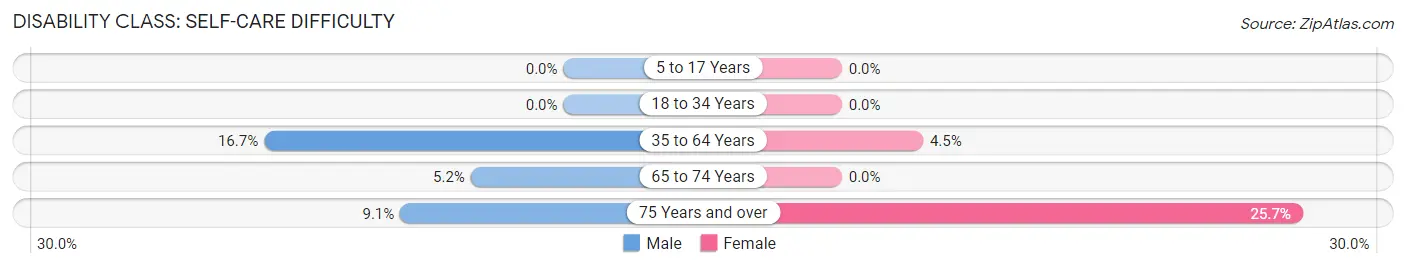
| Age Bracket | Male | Female |
| 5 to 17 Years | 0 (0.0%) | 0 (0.0%) |
| 18 to 34 Years | 0 (0.0%) | 0 (0.0%) |
| 35 to 64 Years | 43 (16.7%) | 15 (4.5%) |
| 65 to 74 Years | 8 (5.2%) | 0 (0.0%) |
| 75 Years and over | 5 (9.1%) | 29 (25.7%) |
Technology Access in Crescent City
Computing Device Access in Crescent City
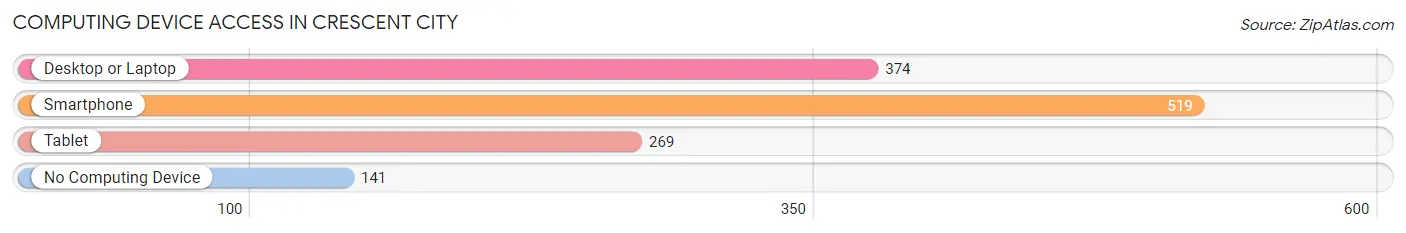
| Device Type | # Households | % Households |
| Desktop or Laptop | 374 | 52.5% |
| Smartphone | 519 | 72.9% |
| Tablet | 269 | 37.8% |
| No Computing Device | 141 | 19.8% |
| Total | 712 | 100.0% |
Internet Access in Crescent City
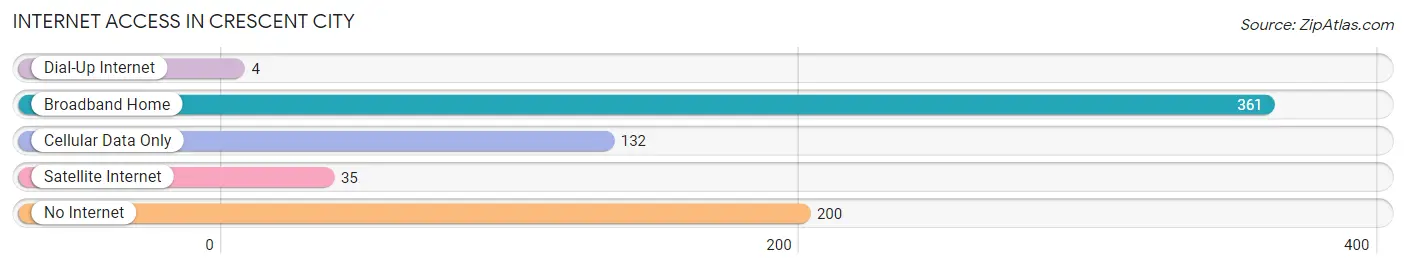
| Internet Type | # Households | % Households |
| Dial-Up Internet | 4 | 0.6% |
| Broadband Home | 361 | 50.7% |
| Cellular Data Only | 132 | 18.5% |
| Satellite Internet | 35 | 4.9% |
| No Internet | 200 | 28.1% |
| Total | 712 | 100.0% |
Crescent City Summary
Crescent City is a small town located in Putnam County, Florida, United States. It is situated on the St. Johns River, about 25 miles south of Palatka and about 50 miles south of Jacksonville. The town was founded in 1881 and incorporated in 1887. As of the 2010 census, the population was 1,898.
History
Crescent City was founded in 1881 by a group of settlers from Georgia and South Carolina. The town was named after the crescent-shaped bend in the St. Johns River. The settlers were attracted to the area by the abundance of timber and the potential for a thriving port. The town was incorporated in 1887 and quickly became a center for the lumber industry. The town also became a popular tourist destination, with many visitors coming to enjoy the natural beauty of the area.
In the early 1900s, the town was home to a thriving citrus industry. The citrus industry was so successful that the town was known as the “Citrus Capital of the World.” The town also had a thriving fishing industry, with many of the local fishermen catching mullet, bass, and other fish from the St. Johns River.
In the 1950s, the town began to decline as the lumber and citrus industries moved away. The town was also affected by the construction of the Cross Florida Barge Canal, which diverted much of the river traffic away from the town. In the 1970s, the town began to experience a resurgence as a tourist destination. The town is now home to several bed and breakfasts, restaurants, and other tourist attractions.
Geography
Crescent City is located in Putnam County, Florida, at the intersection of State Road 17 and State Road 20. The town is situated on the St. Johns River, about 25 miles south of Palatka and about 50 miles south of Jacksonville. The town is surrounded by the Ocala National Forest and is located near the Ocklawaha River.
The town has a total area of 1.3 square miles, all of which is land. The town has a humid subtropical climate, with hot, humid summers and mild winters. The average temperature in the summer is around 90 degrees Fahrenheit, and the average temperature in the winter is around 60 degrees Fahrenheit.
Economy
Crescent City’s economy is largely based on tourism. The town is home to several bed and breakfasts, restaurants, and other tourist attractions. The town is also home to several marinas, which provide access to the St. Johns River and the Ocklawaha River. The town is also home to several antique stores, which attract visitors from all over the state.
The town is also home to several manufacturing companies, including a paper mill and a wood products plant. The town is also home to several farms, which produce a variety of crops, including citrus, vegetables, and hay.
Demographics
As of the 2010 census, the population of Crescent City was 1,898. The population is largely white, with about 85% of the population being white and about 15% being African American. The median household income is $31,250, and the median home value is $90,000. The town has a poverty rate of about 20%, and the unemployment rate is about 8%.
Conclusion
Crescent City is a small town located in Putnam County, Florida. The town was founded in 1881 and incorporated in 1887. The town was once a thriving center for the lumber and citrus industries, but has since become a popular tourist destination. The town is home to several bed and breakfasts, restaurants, and other tourist attractions. The town has a population of 1,898, and the median household income is $31,250. The town has a poverty rate of about 20%, and the unemployment rate is about 8%.
Common Questions
What is Per Capita Income in Crescent City?
Per Capita income in Crescent City is $18,123.
What is the Median Family Income in Crescent City?
Median Family Income in Crescent City is $45,046.
What is the Median Household income in Crescent City?
Median Household Income in Crescent City is $36,625.
What is Income or Wage Gap in Crescent City?
Income or Wage Gap in Crescent City is 4.0%.
Women in Crescent City earn 96.0 cents for every dollar earned by a man.
What is Family Income Deficit in Crescent City?
Family Income Deficit in Crescent City is $9,437.
Families that are below poverty line in Crescent City earn $9,437 less on average than the poverty threshold level.
What is Inequality or Gini Index in Crescent City?
Inequality or Gini Index in Crescent City is 0.53.
What is the Total Population of Crescent City?
Total Population of Crescent City is 2,040.
What is the Total Male Population of Crescent City?
Total Male Population of Crescent City is 997.
What is the Total Female Population of Crescent City?
Total Female Population of Crescent City is 1,043.
What is the Ratio of Males per 100 Females in Crescent City?
There are 95.59 Males per 100 Females in Crescent City.
What is the Ratio of Females per 100 Males in Crescent City?
There are 104.61 Females per 100 Males in Crescent City.
What is the Median Population Age in Crescent City?
Median Population Age in Crescent City is 40.1 Years.
What is the Average Family Size in Crescent City
Average Family Size in Crescent City is 4.0 People.
What is the Average Household Size in Crescent City
Average Household Size in Crescent City is 2.7 People.
How Large is the Labor Force in Crescent City?
There are 676 People in the Labor Forcein in Crescent City.
What is the Percentage of People in the Labor Force in Crescent City?
38.7% of People are in the Labor Force in Crescent City.
What is the Unemployment Rate in Crescent City?
Unemployment Rate in Crescent City is 16.7%.