Zip Codes with the Highest Percentage of Native / Alaskan Population in Delaware
RELATED REPORTS & OPTIONS
Native / Alaskan
Delaware
Compare Zip Codes
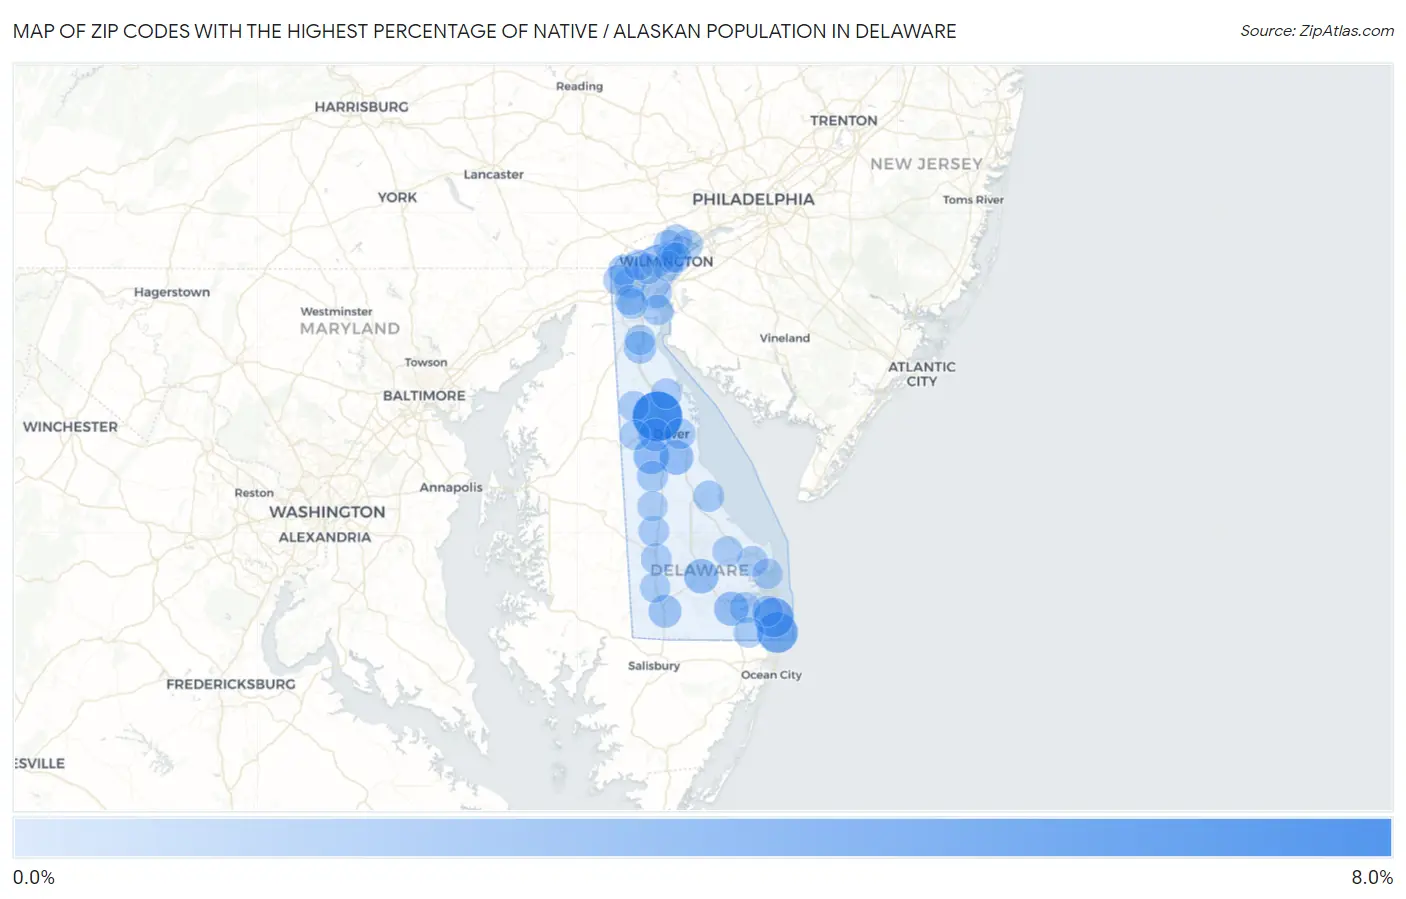
Map of Zip Codes with the Highest Percentage of Native / Alaskan Population in Delaware
0.0%
8.0%
Zip Codes with the Highest Percentage of Native / Alaskan Population in Delaware
| Zip Code | Native / Alaskan | vs State | vs National | |
| 1. | 19936 | 7.2% | 0.33%(+6.87)#1 | 0.84%(+6.37)#1,190 |
| 2. | 19944 | 3.8% | 0.33%(+3.45)#2 | 0.84%(+2.94)#1,833 |
| 3. | 19930 | 3.5% | 0.33%(+3.14)#3 | 0.84%(+2.63)#1,953 |
| 4. | 19934 | 1.9% | 0.33%(+1.61)#4 | 0.84%(+1.10)#3,049 |
| 5. | 19962 | 1.5% | 0.33%(+1.21)#5 | 0.84%(+0.698)#3,663 |
| 6. | 19947 | 1.5% | 0.33%(+1.17)#6 | 0.84%(+0.660)#3,738 |
| 7. | 19966 | 1.4% | 0.33%(+1.07)#7 | 0.84%(+0.564)#3,945 |
| 8. | 19904 | 0.95% | 0.33%(+0.622)#8 | 0.84%(+0.113)#5,384 |
| 9. | 19956 | 0.93% | 0.33%(+0.596)#9 | 0.84%(+0.088)#5,495 |
| 10. | 19805 | 0.80% | 0.33%(+0.462)#10 | 0.84%(-0.046)#6,172 |
| 11. | 19730 | 0.72% | 0.33%(+0.384)#11 | 0.84%(-0.125)#6,644 |
| 12. | 19713 | 0.45% | 0.33%(+0.121)#12 | 0.84%(-0.388)#8,799 |
| 13. | 19720 | 0.37% | 0.33%(+0.037)#13 | 0.84%(-0.471)#9,801 |
| 14. | 19939 | 0.29% | 0.33%(-0.046)#14 | 0.84%(-0.555)#11,126 |
| 15. | 19963 | 0.27% | 0.33%(-0.062)#15 | 0.84%(-0.570)#11,391 |
| 16. | 19943 | 0.27% | 0.33%(-0.063)#16 | 0.84%(-0.572)#11,408 |
| 17. | 19901 | 0.24% | 0.33%(-0.093)#17 | 0.84%(-0.601)#11,981 |
| 18. | 19810 | 0.23% | 0.33%(-0.098)#18 | 0.84%(-0.607)#12,082 |
| 19. | 19711 | 0.23% | 0.33%(-0.104)#19 | 0.84%(-0.612)#12,185 |
| 20. | 19970 | 0.21% | 0.33%(-0.124)#20 | 0.84%(-0.632)#12,609 |
| 21. | 19933 | 0.21% | 0.33%(-0.126)#21 | 0.84%(-0.634)#12,648 |
| 22. | 19717 | 0.18% | 0.33%(-0.154)#22 | 0.84%(-0.662)#13,210 |
| 23. | 19804 | 0.18% | 0.33%(-0.155)#23 | 0.84%(-0.664)#13,244 |
| 24. | 19703 | 0.13% | 0.33%(-0.199)#24 | 0.84%(-0.707)#14,300 |
| 25. | 19950 | 0.11% | 0.33%(-0.227)#25 | 0.84%(-0.735)#15,029 |
| 26. | 19706 | 0.10% | 0.33%(-0.232)#26 | 0.84%(-0.741)#15,187 |
| 27. | 19802 | 0.100% | 0.33%(-0.233)#27 | 0.84%(-0.742)#15,230 |
| 28. | 19958 | 0.094% | 0.33%(-0.239)#28 | 0.84%(-0.748)#15,417 |
| 29. | 19808 | 0.092% | 0.33%(-0.241)#29 | 0.84%(-0.750)#15,469 |
| 30. | 19977 | 0.092% | 0.33%(-0.241)#30 | 0.84%(-0.750)#15,484 |
| 31. | 19938 | 0.087% | 0.33%(-0.246)#31 | 0.84%(-0.755)#15,634 |
| 32. | 19701 | 0.081% | 0.33%(-0.252)#32 | 0.84%(-0.761)#15,811 |
| 33. | 19709 | 0.067% | 0.33%(-0.266)#33 | 0.84%(-0.774)#16,249 |
| 34. | 19702 | 0.065% | 0.33%(-0.268)#34 | 0.84%(-0.776)#16,320 |
| 35. | 19975 | 0.062% | 0.33%(-0.271)#35 | 0.84%(-0.780)#16,441 |
| 36. | 19803 | 0.056% | 0.33%(-0.277)#36 | 0.84%(-0.786)#16,638 |
| 37. | 19801 | 0.042% | 0.33%(-0.291)#37 | 0.84%(-0.799)#17,060 |
| 38. | 19973 | 0.042% | 0.33%(-0.291)#38 | 0.84%(-0.799)#17,064 |
| 39. | 19952 | 0.038% | 0.33%(-0.295)#39 | 0.84%(-0.804)#17,199 |
| 40. | 19953 | 0.020% | 0.33%(-0.313)#40 | 0.84%(-0.821)#17,720 |
| 41. | 19971 | 0.013% | 0.33%(-0.320)#41 | 0.84%(-0.828)#17,883 |
| 42. | 19968 | 0.0066% | 0.33%(-0.326)#42 | 0.84%(-0.835)#17,989 |
| 43. | 19809 | 0.0064% | 0.33%(-0.327)#43 | 0.84%(-0.835)#17,992 |
1
Common Questions
What are the Top 10 Zip Codes with the Highest Percentage of Native / Alaskan Population in Delaware?
Top 10 Zip Codes with the Highest Percentage of Native / Alaskan Population in Delaware are:
What zip code has the Highest Percentage of Native / Alaskan Population in Delaware?
19936 has the Highest Percentage of Native / Alaskan Population in Delaware with 7.2%.
What is the Percentage of Native / Alaskan Population in the State of Delaware?
Percentage of Native / Alaskan Population in Delaware is 0.33%.
What is the Percentage of Native / Alaskan Population in the United States?
Percentage of Native / Alaskan Population in the United States is 0.84%.