Zip Codes with the Highest Percentage of Population Employed in Farming, Fishing & Forestry in Norwalk, CT
RELATED REPORTS & OPTIONS
Farming, Fishing & Forestry
Norwalk
Compare Zip Codes
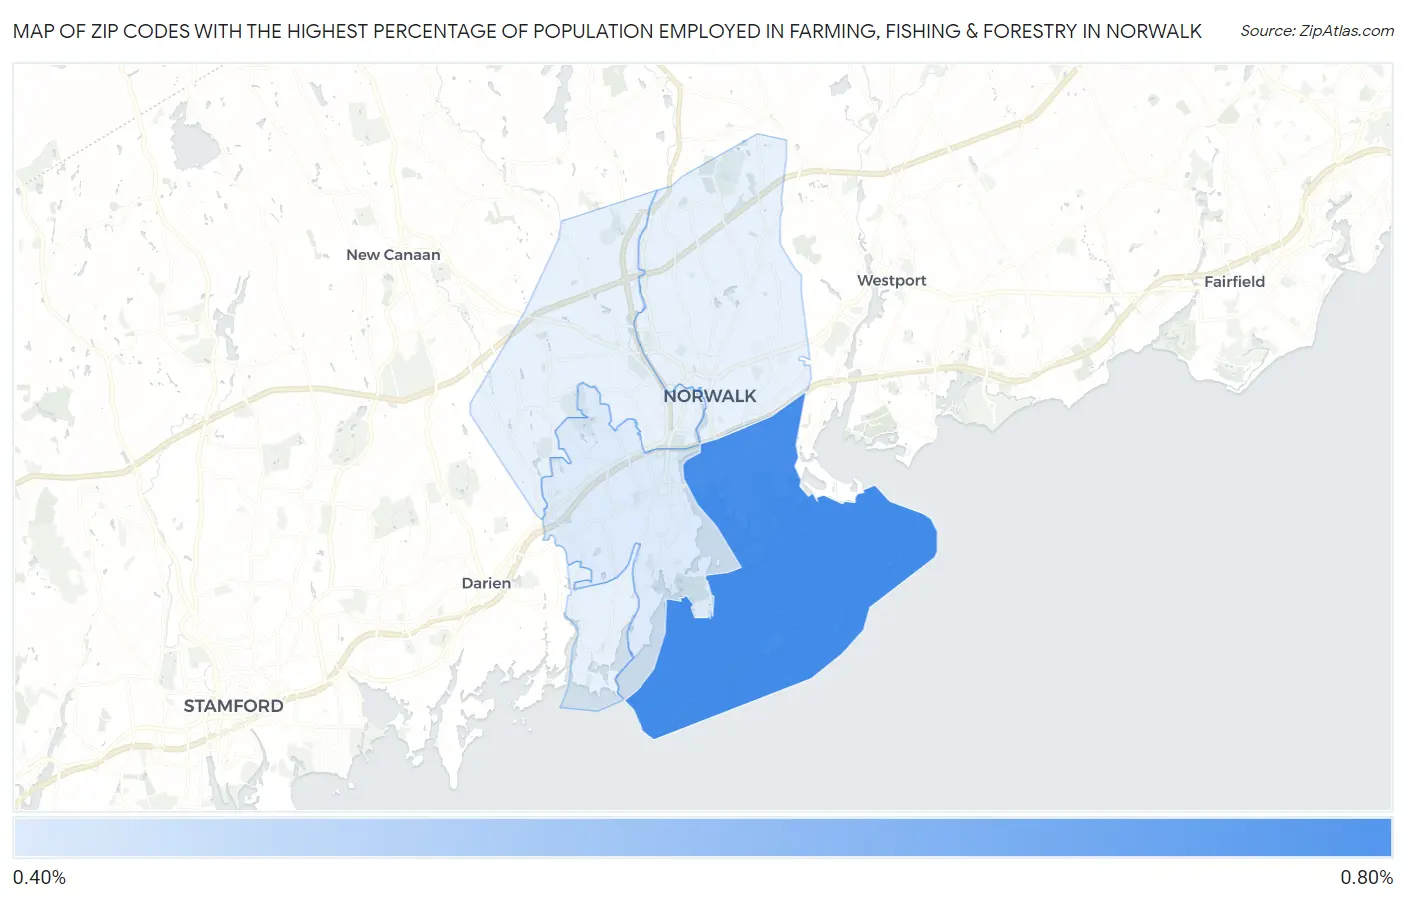
Map of Zip Codes with the Highest Percentage of Population Employed in Farming, Fishing & Forestry in Norwalk
0.0%
0.80%
Zip Codes with the Highest Percentage of Population Employed in Farming, Fishing & Forestry in Norwalk, CT
| Zip Code | % Employed | vs State | vs National | |
| 1. | 06855 | 0.72% | 0.18%(+0.538)#25 | 0.61%(+0.110)#11,278 |
| 2. | 06854 | 0.49% | 0.18%(+0.312)#34 | 0.61%(-0.116)#12,940 |
1
Common Questions
What are the Top 3 Zip Codes with the Highest Percentage of Population Employed in Farming, Fishing & Forestry in Norwalk, CT?
Top 3 Zip Codes with the Highest Percentage of Population Employed in Farming, Fishing & Forestry in Norwalk, CT are:
What zip code has the Highest Percentage of Population Employed in Farming, Fishing & Forestry in Norwalk, CT?
06855 has the Highest Percentage of Population Employed in Farming, Fishing & Forestry in Norwalk, CT with 0.72%.
What is the Percentage of Population Employed in Farming, Fishing & Forestry in Norwalk, CT?
Percentage of Population Employed in Farming, Fishing & Forestry in Norwalk is 0.24%.
What is the Percentage of Population Employed in Farming, Fishing & Forestry in Connecticut?
Percentage of Population Employed in Farming, Fishing & Forestry in Connecticut is 0.18%.
What is the Percentage of Population Employed in Farming, Fishing & Forestry in the United States?
Percentage of Population Employed in Farming, Fishing & Forestry in the United States is 0.61%.