Zip Codes with the Highest Percentage of Population Employed in Transportation & Warehousing in Colorado
RELATED REPORTS & OPTIONS
Transportation & Warehousing
Colorado
Compare Zip Codes
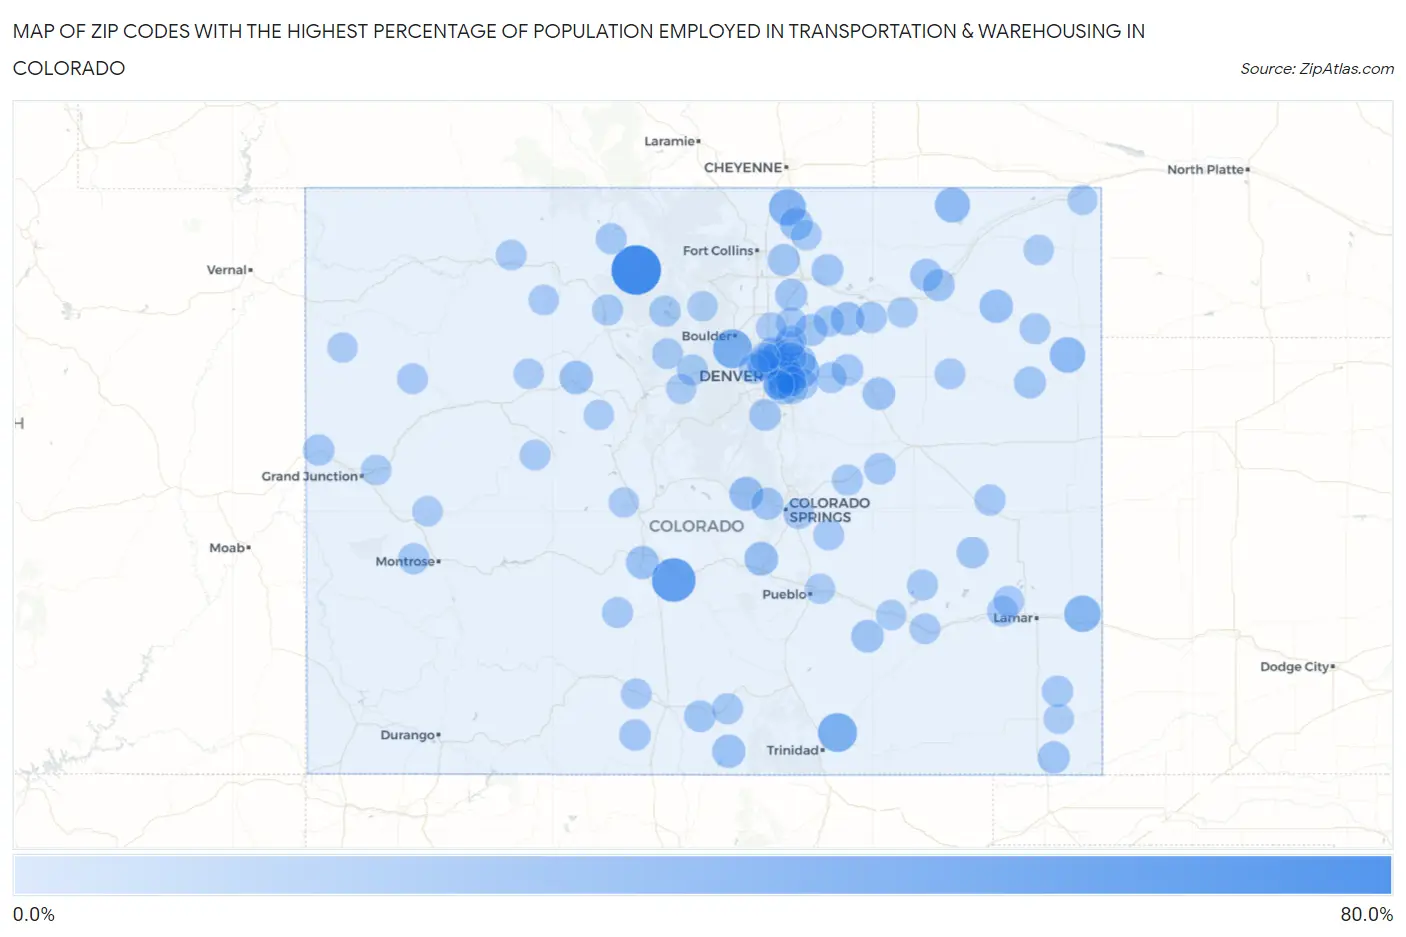
Map of Zip Codes with the Highest Percentage of Population Employed in Transportation & Warehousing in Colorado
0.0%
80.0%
Zip Codes with the Highest Percentage of Population Employed in Transportation & Warehousing in Colorado
| Zip Code | % Employed | vs State | vs National | |
| 1. | 80473 | 66.7% | 4.2%(+62.5)#1 | 4.9%(+61.7)#39 |
| 2. | 81222 | 47.9% | 4.2%(+43.7)#2 | 4.9%(+42.9)#87 |
| 3. | 80025 | 33.3% | 4.2%(+29.1)#3 | 4.9%(+28.4)#183 |
| 4. | 81046 | 33.3% | 4.2%(+29.1)#4 | 4.9%(+28.4)#187 |
| 5. | 80612 | 26.2% | 4.2%(+22.0)#5 | 4.9%(+21.2)#306 |
| 6. | 81043 | 25.0% | 4.2%(+20.8)#6 | 4.9%(+20.1)#337 |
| 7. | 80019 | 23.4% | 4.2%(+19.2)#7 | 4.9%(+18.4)#383 |
| 8. | 80755 | 22.2% | 4.2%(+18.0)#8 | 4.9%(+17.3)#423 |
| 9. | 80745 | 21.2% | 4.2%(+17.0)#9 | 4.9%(+16.3)#466 |
| 10. | 80814 | 17.1% | 4.2%(+12.9)#10 | 4.9%(+12.2)#762 |
| 11. | 81240 | 16.5% | 4.2%(+12.3)#11 | 4.9%(+11.6)#844 |
| 12. | 80652 | 15.9% | 4.2%(+11.7)#12 | 4.9%(+11.0)#921 |
| 13. | 81655 | 15.8% | 4.2%(+11.6)#13 | 4.9%(+10.9)#935 |
| 14. | 80743 | 15.7% | 4.2%(+11.5)#14 | 4.9%(+10.8)#947 |
| 15. | 81126 | 15.1% | 4.2%(+10.9)#15 | 4.9%(+10.2)#1,033 |
| 16. | 80045 | 15.1% | 4.2%(+10.9)#16 | 4.9%(+10.1)#1,048 |
| 17. | 81242 | 14.5% | 4.2%(+10.3)#17 | 4.9%(+9.56)#1,167 |
| 18. | 80648 | 14.0% | 4.2%(+9.80)#18 | 4.9%(+9.06)#1,284 |
| 19. | 81039 | 13.3% | 4.2%(+9.05)#19 | 4.9%(+8.31)#1,463 |
| 20. | 80105 | 13.1% | 4.2%(+8.91)#20 | 4.9%(+8.16)#1,504 |
| 21. | 80750 | 12.5% | 4.2%(+8.30)#21 | 4.9%(+7.55)#1,680 |
| 22. | 81029 | 12.3% | 4.2%(+8.08)#22 | 4.9%(+7.33)#1,754 |
| 23. | 80546 | 11.9% | 4.2%(+7.72)#23 | 4.9%(+6.97)#1,899 |
| 24. | 80623 | 11.8% | 4.2%(+7.62)#24 | 4.9%(+6.88)#1,932 |
| 25. | 80809 | 11.7% | 4.2%(+7.47)#25 | 4.9%(+6.72)#1,999 |
| 26. | 80642 | 11.5% | 4.2%(+7.33)#26 | 4.9%(+6.58)#2,064 |
| 27. | 80733 | 11.3% | 4.2%(+7.08)#27 | 4.9%(+6.34)#2,186 |
| 28. | 80249 | 11.0% | 4.2%(+6.84)#28 | 4.9%(+6.10)#2,303 |
| 29. | 80624 | 11.0% | 4.2%(+6.78)#29 | 4.9%(+6.03)#2,335 |
| 30. | 80822 | 10.9% | 4.2%(+6.75)#30 | 4.9%(+6.00)#2,346 |
| 31. | 80131 | 10.9% | 4.2%(+6.67)#31 | 4.9%(+5.92)#2,383 |
| 32. | 81045 | 10.5% | 4.2%(+6.32)#32 | 4.9%(+5.58)#2,577 |
| 33. | 81123 | 10.5% | 4.2%(+6.26)#33 | 4.9%(+5.52)#2,607 |
| 34. | 81140 | 10.2% | 4.2%(+6.00)#34 | 4.9%(+5.26)#2,759 |
| 35. | 80239 | 10.2% | 4.2%(+5.96)#35 | 4.9%(+5.21)#2,784 |
| 36. | 80832 | 9.9% | 4.2%(+5.72)#36 | 4.9%(+4.98)#2,937 |
| 37. | 80012 | 9.7% | 4.2%(+5.47)#37 | 4.9%(+4.72)#3,101 |
| 38. | 80136 | 9.6% | 4.2%(+5.44)#38 | 4.9%(+4.70)#3,122 |
| 39. | 80654 | 9.6% | 4.2%(+5.41)#39 | 4.9%(+4.66)#3,157 |
| 40. | 81525 | 9.6% | 4.2%(+5.40)#40 | 4.9%(+4.66)#3,163 |
| 41. | 80030 | 9.5% | 4.2%(+5.31)#41 | 4.9%(+4.57)#3,225 |
| 42. | 80011 | 9.5% | 4.2%(+5.27)#42 | 4.9%(+4.52)#3,261 |
| 43. | 80446 | 9.3% | 4.2%(+5.10)#43 | 4.9%(+4.35)#3,398 |
| 44. | 81084 | 9.1% | 4.2%(+4.89)#44 | 4.9%(+4.14)#3,613 |
| 45. | 80862 | 9.1% | 4.2%(+4.89)#45 | 4.9%(+4.14)#3,615 |
| 46. | 80014 | 8.9% | 4.2%(+4.69)#46 | 4.9%(+3.94)#3,819 |
| 47. | 80640 | 8.8% | 4.2%(+4.56)#47 | 4.9%(+3.82)#3,976 |
| 48. | 81425 | 8.8% | 4.2%(+4.55)#48 | 4.9%(+3.81)#3,984 |
| 49. | 81133 | 8.7% | 4.2%(+4.49)#49 | 4.9%(+3.75)#4,045 |
| 50. | 80808 | 8.6% | 4.2%(+4.39)#50 | 4.9%(+3.65)#4,156 |
| 51. | 80480 | 8.6% | 4.2%(+4.39)#51 | 4.9%(+3.65)#4,164 |
| 52. | 80436 | 8.4% | 4.2%(+4.17)#52 | 4.9%(+3.43)#4,418 |
| 53. | 80459 | 8.3% | 4.2%(+4.14)#53 | 4.9%(+3.39)#4,454 |
| 54. | 80247 | 8.2% | 4.2%(+4.04)#54 | 4.9%(+3.30)#4,584 |
| 55. | 80643 | 8.2% | 4.2%(+4.02)#55 | 4.9%(+3.28)#4,610 |
| 56. | 81149 | 8.2% | 4.2%(+4.01)#56 | 4.9%(+3.27)#4,617 |
| 57. | 80102 | 8.2% | 4.2%(+3.99)#57 | 4.9%(+3.25)#4,642 |
| 58. | 80229 | 8.1% | 4.2%(+3.90)#58 | 4.9%(+3.15)#4,761 |
| 59. | 80233 | 8.1% | 4.2%(+3.87)#59 | 4.9%(+3.13)#4,801 |
| 60. | 81076 | 8.1% | 4.2%(+3.87)#60 | 4.9%(+3.12)#4,809 |
| 61. | 80759 | 7.9% | 4.2%(+3.71)#61 | 4.9%(+2.97)#5,006 |
| 62. | 80928 | 7.9% | 4.2%(+3.67)#62 | 4.9%(+2.93)#5,070 |
| 63. | 80018 | 7.9% | 4.2%(+3.67)#63 | 4.9%(+2.93)#5,075 |
| 64. | 81650 | 7.9% | 4.2%(+3.67)#64 | 4.9%(+2.93)#5,078 |
| 65. | 80603 | 7.8% | 4.2%(+3.62)#65 | 4.9%(+2.87)#5,154 |
| 66. | 81057 | 7.8% | 4.2%(+3.61)#66 | 4.9%(+2.87)#5,162 |
| 67. | 80601 | 7.7% | 4.2%(+3.53)#67 | 4.9%(+2.79)#5,275 |
| 68. | 81092 | 7.7% | 4.2%(+3.52)#68 | 4.9%(+2.78)#5,282 |
| 69. | 81654 | 7.7% | 4.2%(+3.50)#69 | 4.9%(+2.75)#5,317 |
| 70. | 80740 | 7.7% | 4.2%(+3.49)#70 | 4.9%(+2.75)#5,348 |
| 71. | 80022 | 7.6% | 4.2%(+3.42)#71 | 4.9%(+2.67)#5,465 |
| 72. | 80442 | 7.6% | 4.2%(+3.41)#72 | 4.9%(+2.67)#5,471 |
| 73. | 81077 | 7.5% | 4.2%(+3.26)#73 | 4.9%(+2.51)#5,726 |
| 74. | 81144 | 7.5% | 4.2%(+3.25)#74 | 4.9%(+2.51)#5,733 |
| 75. | 81639 | 7.3% | 4.2%(+3.07)#75 | 4.9%(+2.33)#6,037 |
| 76. | 80013 | 7.1% | 4.2%(+2.90)#76 | 4.9%(+2.16)#6,350 |
| 77. | 80467 | 7.1% | 4.2%(+2.88)#77 | 4.9%(+2.14)#6,373 |
| 78. | 80621 | 7.1% | 4.2%(+2.87)#78 | 4.9%(+2.13)#6,393 |
| 79. | 80017 | 7.0% | 4.2%(+2.75)#79 | 4.9%(+2.01)#6,648 |
| 80. | 80916 | 6.9% | 4.2%(+2.70)#80 | 4.9%(+1.96)#6,742 |
| 81. | 80221 | 6.8% | 4.2%(+2.59)#81 | 4.9%(+1.85)#6,989 |
| 82. | 80701 | 6.8% | 4.2%(+2.55)#82 | 4.9%(+1.81)#7,050 |
| 83. | 81520 | 6.7% | 4.2%(+2.50)#83 | 4.9%(+1.75)#7,150 |
| 84. | 81410 | 6.7% | 4.2%(+2.46)#84 | 4.9%(+1.72)#7,228 |
| 85. | 80610 | 6.7% | 4.2%(+2.46)#85 | 4.9%(+1.72)#7,254 |
| 86. | 80514 | 6.7% | 4.2%(+2.45)#86 | 4.9%(+1.71)#7,272 |
| 87. | 81058 | 6.6% | 4.2%(+2.43)#87 | 4.9%(+1.68)#7,313 |
| 88. | 81637 | 6.5% | 4.2%(+2.28)#88 | 4.9%(+1.53)#7,616 |
| 89. | 80231 | 6.3% | 4.2%(+2.14)#89 | 4.9%(+1.40)#7,941 |
| 90. | 80510 | 6.3% | 4.2%(+2.12)#90 | 4.9%(+1.38)#7,988 |
| 91. | 80002 | 6.3% | 4.2%(+2.09)#91 | 4.9%(+1.35)#8,061 |
| 92. | 81087 | 6.2% | 4.2%(+2.05)#92 | 4.9%(+1.30)#8,177 |
| 93. | 81001 | 6.2% | 4.2%(+2.03)#93 | 4.9%(+1.28)#8,228 |
| 94. | 80731 | 6.2% | 4.2%(+1.99)#94 | 4.9%(+1.25)#8,308 |
| 95. | 81211 | 6.2% | 4.2%(+1.98)#95 | 4.9%(+1.23)#8,340 |
| 96. | 81648 | 6.2% | 4.2%(+1.95)#96 | 4.9%(+1.21)#8,395 |
| 97. | 80737 | 6.1% | 4.2%(+1.94)#97 | 4.9%(+1.19)#8,435 |
| 98. | 80444 | 6.1% | 4.2%(+1.93)#98 | 4.9%(+1.19)#8,447 |
| 99. | 80260 | 6.1% | 4.2%(+1.92)#99 | 4.9%(+1.18)#8,464 |
| 100. | 81645 | 6.1% | 4.2%(+1.89)#100 | 4.9%(+1.15)#8,547 |
Common Questions
What are the Top 10 Zip Codes with the Highest Percentage of Population Employed in Transportation & Warehousing in Colorado?
Top 10 Zip Codes with the Highest Percentage of Population Employed in Transportation & Warehousing in Colorado are:
What zip code has the Highest Percentage of Population Employed in Transportation & Warehousing in Colorado?
80473 has the Highest Percentage of Population Employed in Transportation & Warehousing in Colorado with 66.7%.
What is the Percentage of Population Employed in Transportation & Warehousing in the State of Colorado?
Percentage of Population Employed in Transportation & Warehousing in Colorado is 4.2%.
What is the Percentage of Population Employed in Transportation & Warehousing in the United States?
Percentage of Population Employed in Transportation & Warehousing in the United States is 4.9%.