Zip Codes with the Highest Percentage of Population Employed in Agriculture, Fishing & Hunting in Boulder, CO
RELATED REPORTS & OPTIONS
Agriculture, Fishing & Hunting
Boulder
Compare Zip Codes
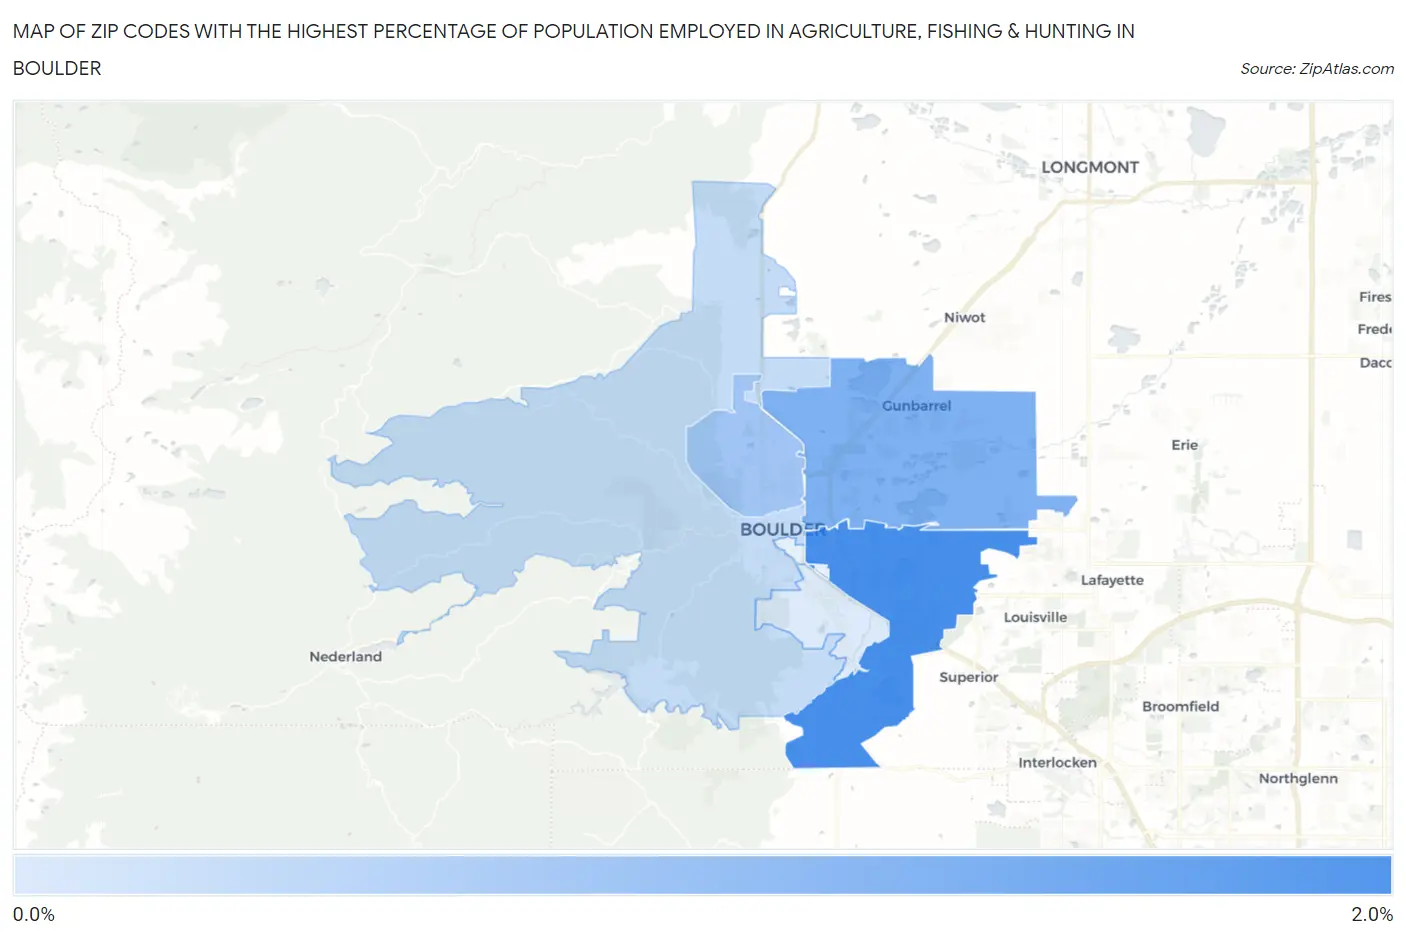
Map of Zip Codes with the Highest Percentage of Population Employed in Agriculture, Fishing & Hunting in Boulder
0.0%
2.0%
Zip Codes with the Highest Percentage of Population Employed in Agriculture, Fishing & Hunting in Boulder, CO
| Zip Code | % Employed | vs State | vs National | |
| 1. | 80303 | 1.5% | 1.1%(+0.362)#251 | 1.2%(+0.310)#14,262 |
| 2. | 80301 | 1.00% | 1.1%(-0.149)#282 | 1.2%(-0.201)#16,227 |
| 3. | 80304 | 0.69% | 1.1%(-0.463)#309 | 1.2%(-0.514)#17,926 |
| 4. | 80302 | 0.35% | 1.1%(-0.802)#366 | 1.2%(-0.854)#20,694 |
| 5. | 80305 | 0.14% | 1.1%(-1.01)#408 | 1.2%(-1.06)#23,189 |
1
Common Questions
What are the Top 5 Zip Codes with the Highest Percentage of Population Employed in Agriculture, Fishing & Hunting in Boulder, CO?
Top 5 Zip Codes with the Highest Percentage of Population Employed in Agriculture, Fishing & Hunting in Boulder, CO are:
What zip code has the Highest Percentage of Population Employed in Agriculture, Fishing & Hunting in Boulder, CO?
80303 has the Highest Percentage of Population Employed in Agriculture, Fishing & Hunting in Boulder, CO with 1.5%.
What is the Percentage of Population Employed in Agriculture, Fishing & Hunting in Boulder, CO?
Percentage of Population Employed in Agriculture, Fishing & Hunting in Boulder is 0.64%.
What is the Percentage of Population Employed in Agriculture, Fishing & Hunting in Colorado?
Percentage of Population Employed in Agriculture, Fishing & Hunting in Colorado is 1.1%.
What is the Percentage of Population Employed in Agriculture, Fishing & Hunting in the United States?
Percentage of Population Employed in Agriculture, Fishing & Hunting in the United States is 1.2%.