Zip Codes with the Highest Percentage of Population Employed in Agriculture, Fishing & Hunting in Arvada, CO
RELATED REPORTS & OPTIONS
Agriculture, Fishing & Hunting
Arvada
Compare Zip Codes
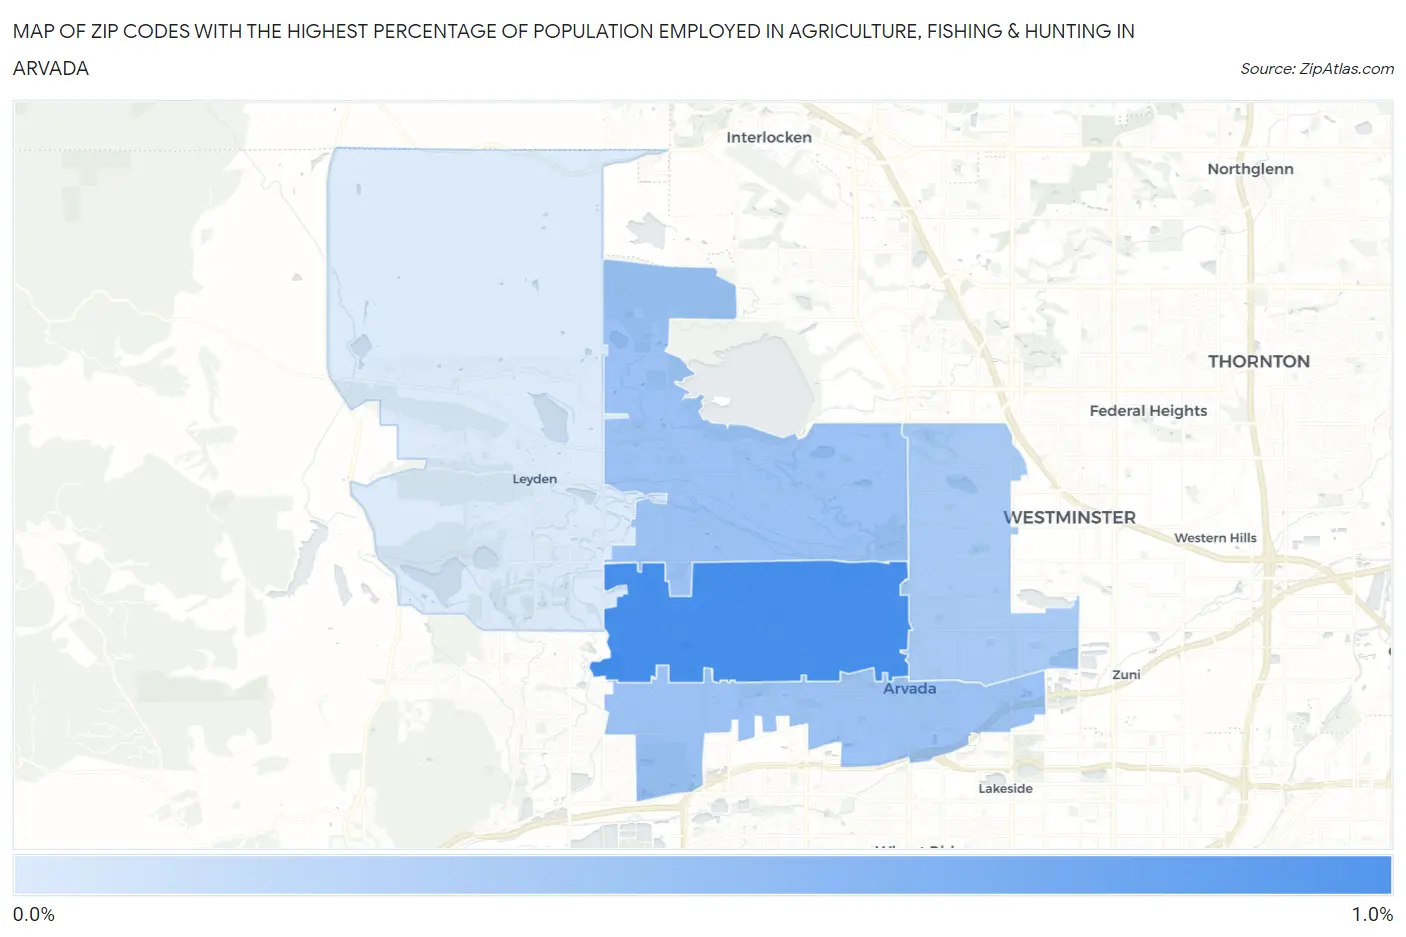
Map of Zip Codes with the Highest Percentage of Population Employed in Agriculture, Fishing & Hunting in Arvada
0.0%
1.0%
Zip Codes with the Highest Percentage of Population Employed in Agriculture, Fishing & Hunting in Arvada, CO
| Zip Code | % Employed | vs State | vs National | |
| 1. | 80004 | 0.85% | 1.1%(-0.303)#294 | 1.2%(-0.354)#16,993 |
| 2. | 80005 | 0.43% | 1.1%(-0.713)#346 | 1.2%(-0.765)#19,848 |
| 3. | 80002 | 0.42% | 1.1%(-0.724)#351 | 1.2%(-0.775)#19,948 |
| 4. | 80003 | 0.36% | 1.1%(-0.787)#361 | 1.2%(-0.839)#20,539 |
| 5. | 80007 | 0.11% | 1.1%(-1.04)#415 | 1.2%(-1.09)#23,598 |
1
Common Questions
What are the Top 3 Zip Codes with the Highest Percentage of Population Employed in Agriculture, Fishing & Hunting in Arvada, CO?
Top 3 Zip Codes with the Highest Percentage of Population Employed in Agriculture, Fishing & Hunting in Arvada, CO are:
What zip code has the Highest Percentage of Population Employed in Agriculture, Fishing & Hunting in Arvada, CO?
80004 has the Highest Percentage of Population Employed in Agriculture, Fishing & Hunting in Arvada, CO with 0.85%.
What is the Percentage of Population Employed in Agriculture, Fishing & Hunting in Arvada, CO?
Percentage of Population Employed in Agriculture, Fishing & Hunting in Arvada is 0.47%.
What is the Percentage of Population Employed in Agriculture, Fishing & Hunting in Colorado?
Percentage of Population Employed in Agriculture, Fishing & Hunting in Colorado is 1.1%.
What is the Percentage of Population Employed in Agriculture, Fishing & Hunting in the United States?
Percentage of Population Employed in Agriculture, Fishing & Hunting in the United States is 1.2%.