Zip Codes with the Highest Percentage of Population Employed in Professional & Scientific Services in Woodland, CA
RELATED REPORTS & OPTIONS
Professional & Scientific Services
Woodland
Compare Zip Codes
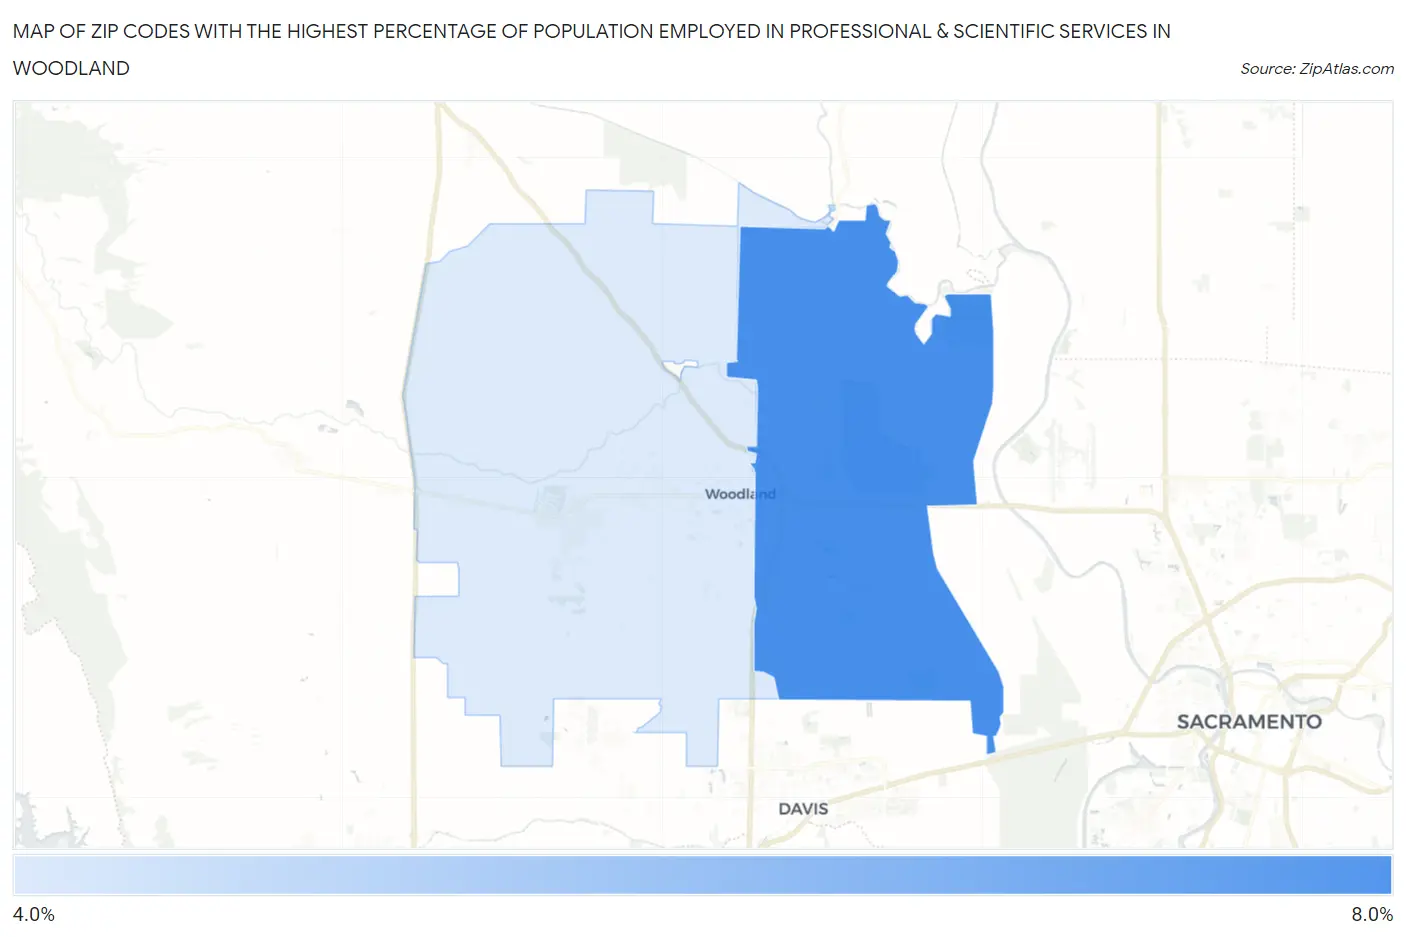
Map of Zip Codes with the Highest Percentage of Population Employed in Professional & Scientific Services in Woodland
0.0%
8.0%
Zip Codes with the Highest Percentage of Population Employed in Professional & Scientific Services in Woodland, CA
| Zip Code | % Employed | vs State | vs National | |
| 1. | 95776 | 6.1% | 9.4%(-3.30)#880 | 7.8%(-1.71)#9,706 |
| 2. | 95695 | 4.4% | 9.4%(-5.02)#1,095 | 7.8%(-3.43)#13,904 |
1
Common Questions
What are the Top Zip Codes with the Highest Percentage of Population Employed in Professional & Scientific Services in Woodland, CA?
Top Zip Codes with the Highest Percentage of Population Employed in Professional & Scientific Services in Woodland, CA are:
What zip code has the Highest Percentage of Population Employed in Professional & Scientific Services in Woodland, CA?
95776 has the Highest Percentage of Population Employed in Professional & Scientific Services in Woodland, CA with 6.1%.
What is the Percentage of Population Employed in Professional & Scientific Services in Woodland, CA?
Percentage of Population Employed in Professional & Scientific Services in Woodland is 4.9%.
What is the Percentage of Population Employed in Professional & Scientific Services in California?
Percentage of Population Employed in Professional & Scientific Services in California is 9.4%.
What is the Percentage of Population Employed in Professional & Scientific Services in the United States?
Percentage of Population Employed in Professional & Scientific Services in the United States is 7.8%.