Zip Codes with the Highest Percentage of Population Employed in Farming, Fishing & Forestry in Rialto, CA
RELATED REPORTS & OPTIONS
Farming, Fishing & Forestry
Rialto
Compare Zip Codes
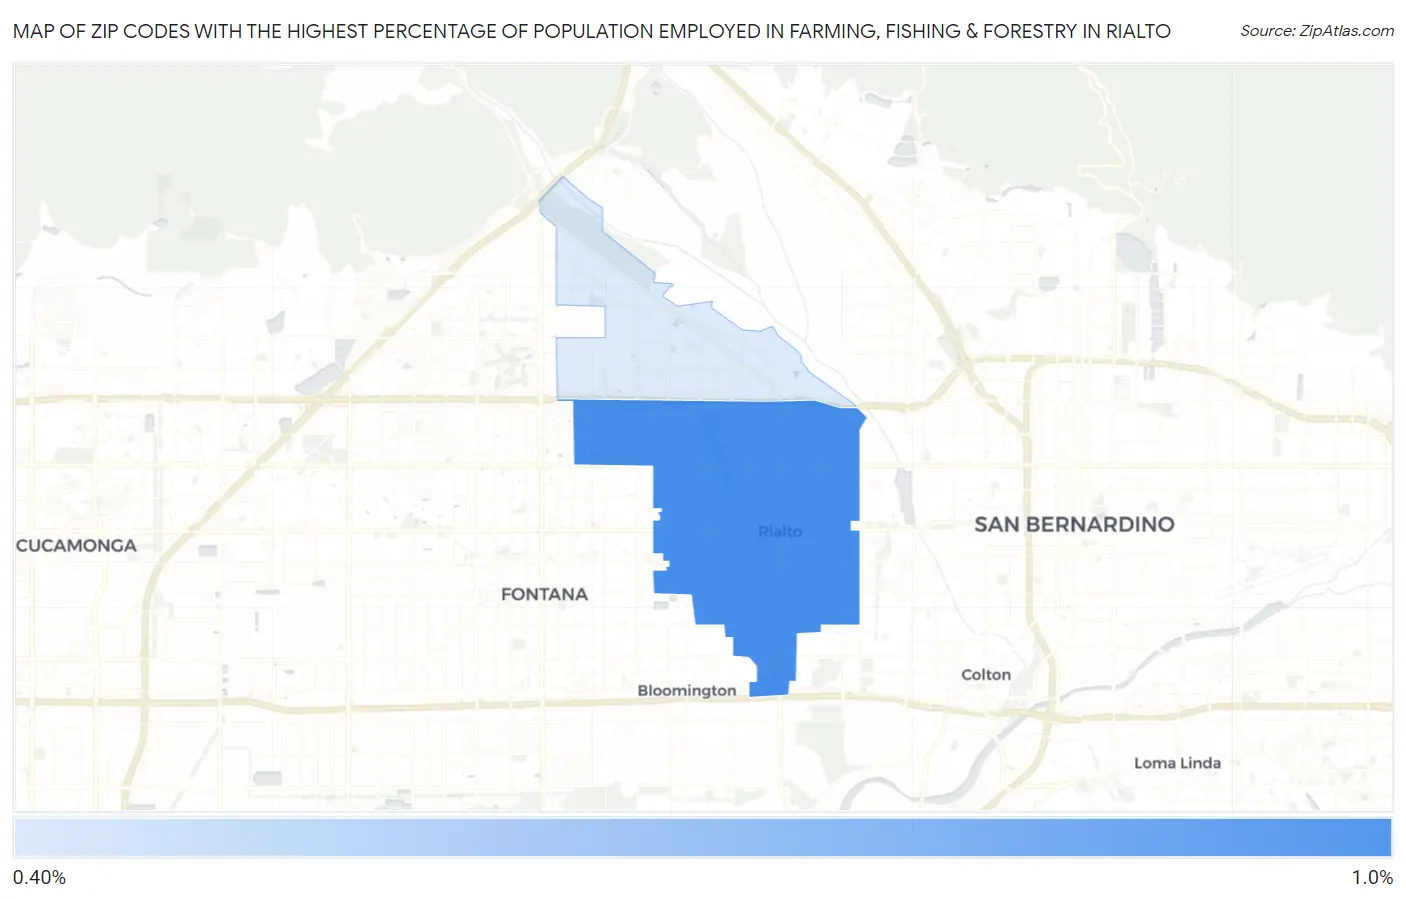
Map of Zip Codes with the Highest Percentage of Population Employed in Farming, Fishing & Forestry in Rialto
0.0%
1.0%
Zip Codes with the Highest Percentage of Population Employed in Farming, Fishing & Forestry in Rialto, CA
| Zip Code | % Employed | vs State | vs National | |
| 1. | 92376 | 0.80% | 1.4%(-0.610)#561 | 0.61%(+0.195)#10,780 |
| 2. | 92377 | 0.48% | 1.4%(-0.935)#700 | 0.61%(-0.130)#13,070 |
1
Common Questions
What are the Top Zip Codes with the Highest Percentage of Population Employed in Farming, Fishing & Forestry in Rialto, CA?
Top Zip Codes with the Highest Percentage of Population Employed in Farming, Fishing & Forestry in Rialto, CA are:
What zip code has the Highest Percentage of Population Employed in Farming, Fishing & Forestry in Rialto, CA?
92376 has the Highest Percentage of Population Employed in Farming, Fishing & Forestry in Rialto, CA with 0.80%.
What is the Percentage of Population Employed in Farming, Fishing & Forestry in Rialto, CA?
Percentage of Population Employed in Farming, Fishing & Forestry in Rialto is 0.76%.
What is the Percentage of Population Employed in Farming, Fishing & Forestry in California?
Percentage of Population Employed in Farming, Fishing & Forestry in California is 1.4%.
What is the Percentage of Population Employed in Farming, Fishing & Forestry in the United States?
Percentage of Population Employed in Farming, Fishing & Forestry in the United States is 0.61%.