Zip Codes with the Highest Percentage of Population Employed in Farming, Fishing & Forestry in Manteca, CA
RELATED REPORTS & OPTIONS
Farming, Fishing & Forestry
Manteca
Compare Zip Codes
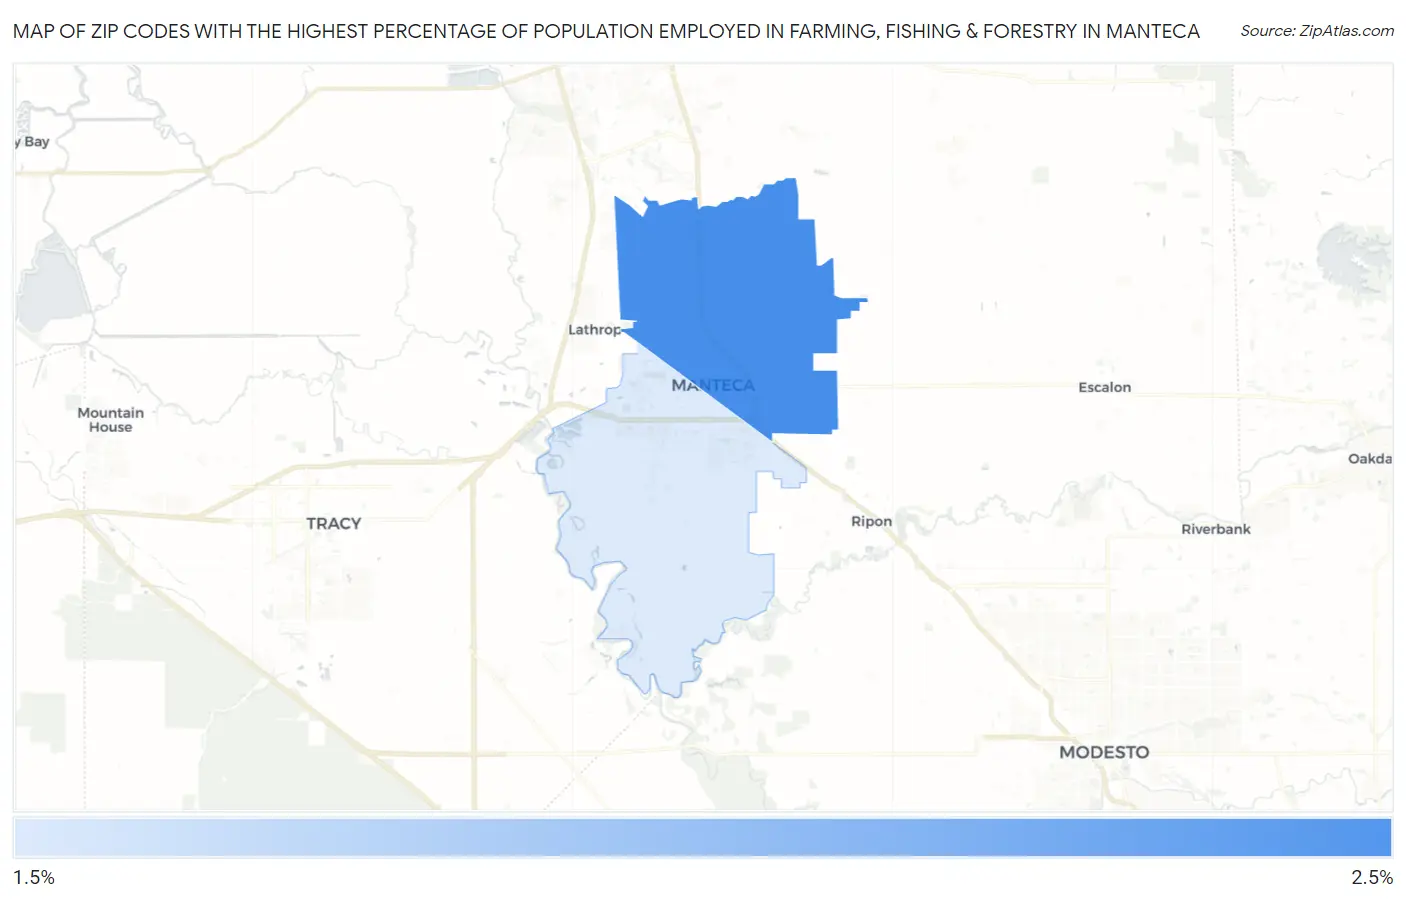
Map of Zip Codes with the Highest Percentage of Population Employed in Farming, Fishing & Forestry in Manteca
1.5%
2.2%
Zip Codes with the Highest Percentage of Population Employed in Farming, Fishing & Forestry in Manteca, CA
| Zip Code | % Employed | vs State | vs National | |
| 1. | 95336 | 2.2% | 1.4%(+0.802)#360 | 0.61%(+1.61)#6,106 |
| 2. | 95337 | 1.5% | 1.4%(+0.122)#419 | 0.61%(+0.926)#7,798 |
1
Common Questions
What are the Top Zip Codes with the Highest Percentage of Population Employed in Farming, Fishing & Forestry in Manteca, CA?
Top Zip Codes with the Highest Percentage of Population Employed in Farming, Fishing & Forestry in Manteca, CA are:
What zip code has the Highest Percentage of Population Employed in Farming, Fishing & Forestry in Manteca, CA?
95336 has the Highest Percentage of Population Employed in Farming, Fishing & Forestry in Manteca, CA with 2.2%.
What is the Percentage of Population Employed in Farming, Fishing & Forestry in Manteca, CA?
Percentage of Population Employed in Farming, Fishing & Forestry in Manteca is 0.87%.
What is the Percentage of Population Employed in Farming, Fishing & Forestry in California?
Percentage of Population Employed in Farming, Fishing & Forestry in California is 1.4%.
What is the Percentage of Population Employed in Farming, Fishing & Forestry in the United States?
Percentage of Population Employed in Farming, Fishing & Forestry in the United States is 0.61%.