Zip Codes with the Highest Percentage of Population Employed in Arts, Entertainment & Recreation in Compton, CA
RELATED REPORTS & OPTIONS
Arts, Entertainment & Recreation
Compton
Compare Zip Codes
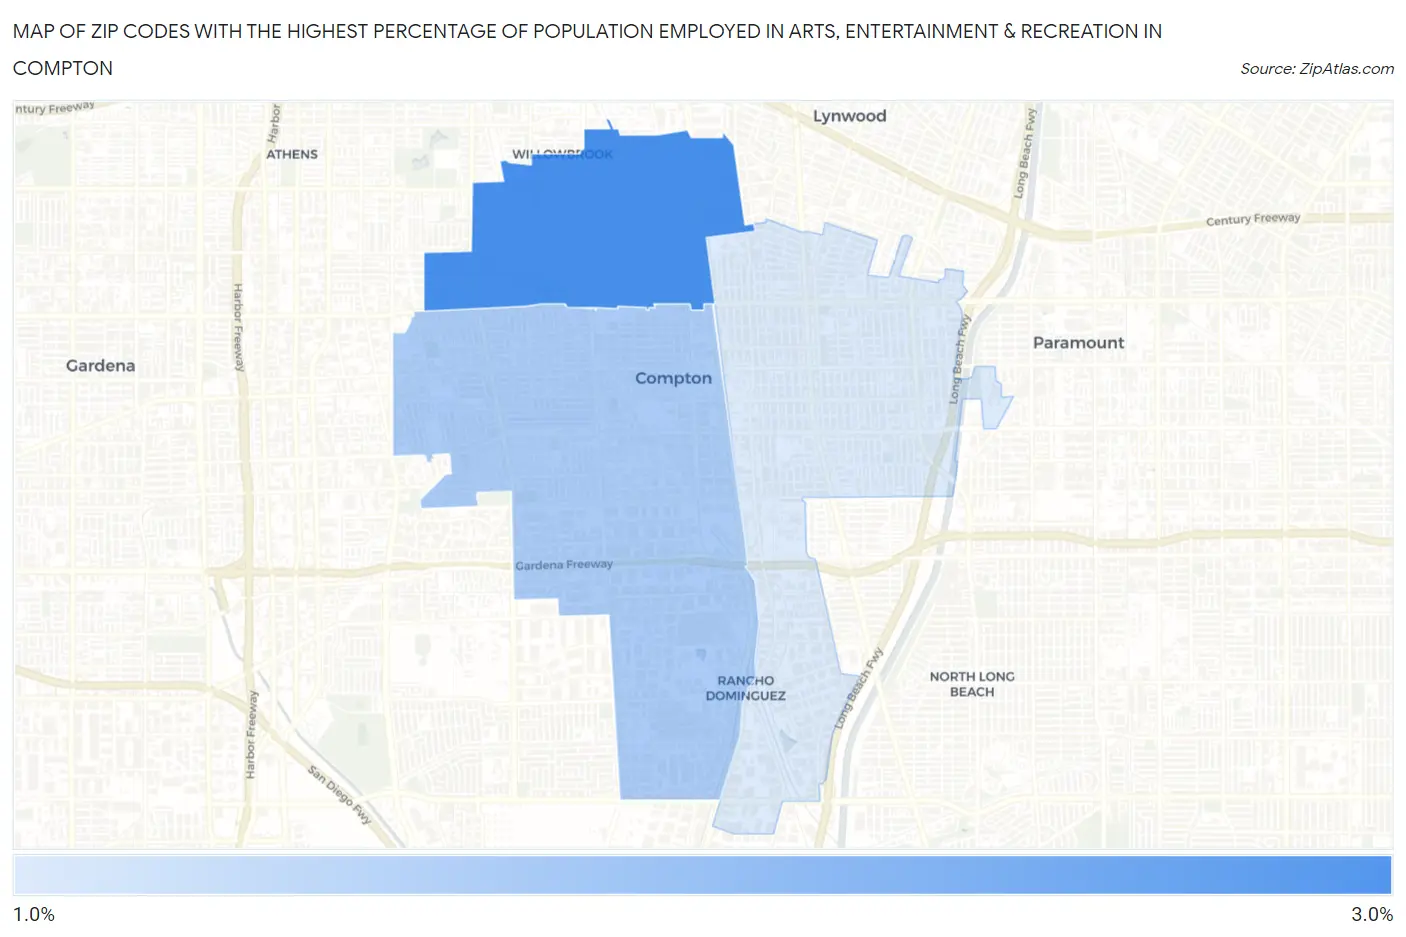
Map of Zip Codes with the Highest Percentage of Population Employed in Arts, Entertainment & Recreation in Compton
0.0%
3.0%
Zip Codes with the Highest Percentage of Population Employed in Arts, Entertainment & Recreation in Compton, CA
| Zip Code | % Employed | vs State | vs National | |
| 1. | 90222 | 2.5% | 2.6%(-0.034)#677 | 2.1%(+0.437)#7,088 |
| 2. | 90220 | 2.0% | 2.6%(-0.550)#917 | 2.1%(-0.078)#9,754 |
| 3. | 90221 | 1.7% | 2.6%(-0.814)#1,024 | 2.1%(-0.343)#11,442 |
1
Common Questions
What are the Top Zip Codes with the Highest Percentage of Population Employed in Arts, Entertainment & Recreation in Compton, CA?
Top Zip Codes with the Highest Percentage of Population Employed in Arts, Entertainment & Recreation in Compton, CA are:
What zip code has the Highest Percentage of Population Employed in Arts, Entertainment & Recreation in Compton, CA?
90222 has the Highest Percentage of Population Employed in Arts, Entertainment & Recreation in Compton, CA with 2.5%.
What is the Percentage of Population Employed in Arts, Entertainment & Recreation in Compton, CA?
Percentage of Population Employed in Arts, Entertainment & Recreation in Compton is 1.7%.
What is the Percentage of Population Employed in Arts, Entertainment & Recreation in California?
Percentage of Population Employed in Arts, Entertainment & Recreation in California is 2.6%.
What is the Percentage of Population Employed in Arts, Entertainment & Recreation in the United States?
Percentage of Population Employed in Arts, Entertainment & Recreation in the United States is 2.1%.