Zip Codes with the Highest Percentage of Population Employed in Professional & Scientific Services in Chula Vista, CA
RELATED REPORTS & OPTIONS
Professional & Scientific Services
Chula Vista
Compare Zip Codes
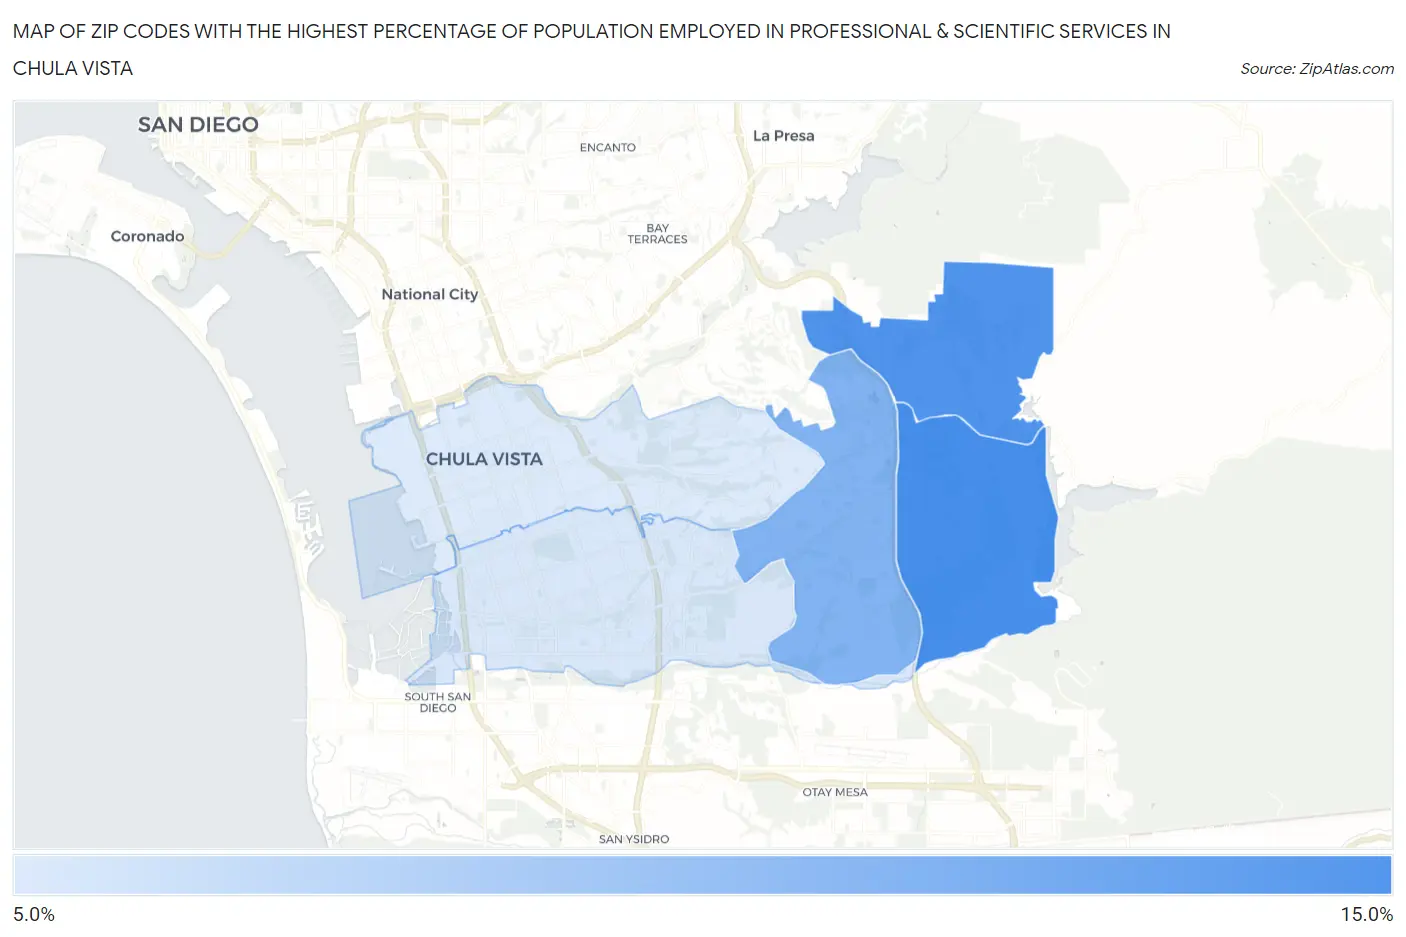
Map of Zip Codes with the Highest Percentage of Population Employed in Professional & Scientific Services in Chula Vista
0.0%
15.0%
Zip Codes with the Highest Percentage of Population Employed in Professional & Scientific Services in Chula Vista, CA
| Zip Code | % Employed | vs State | vs National | |
| 1. | 91915 | 10.4% | 9.4%(+0.932)#514 | 7.8%(+2.52)#4,306 |
| 2. | 91914 | 10.1% | 9.4%(+0.709)#532 | 7.8%(+2.30)#4,469 |
| 3. | 91913 | 8.8% | 9.4%(-0.668)#624 | 7.8%(+0.920)#5,737 |
| 4. | 91911 | 6.3% | 9.4%(-3.13)#861 | 7.8%(-1.55)#9,385 |
| 5. | 91910 | 6.2% | 9.4%(-3.26)#874 | 7.8%(-1.67)#9,639 |
1
Common Questions
What are the Top 3 Zip Codes with the Highest Percentage of Population Employed in Professional & Scientific Services in Chula Vista, CA?
Top 3 Zip Codes with the Highest Percentage of Population Employed in Professional & Scientific Services in Chula Vista, CA are:
What zip code has the Highest Percentage of Population Employed in Professional & Scientific Services in Chula Vista, CA?
91915 has the Highest Percentage of Population Employed in Professional & Scientific Services in Chula Vista, CA with 10.4%.
What is the Percentage of Population Employed in Professional & Scientific Services in Chula Vista, CA?
Percentage of Population Employed in Professional & Scientific Services in Chula Vista is 7.6%.
What is the Percentage of Population Employed in Professional & Scientific Services in California?
Percentage of Population Employed in Professional & Scientific Services in California is 9.4%.
What is the Percentage of Population Employed in Professional & Scientific Services in the United States?
Percentage of Population Employed in Professional & Scientific Services in the United States is 7.8%.