Zip Codes with the Highest Percentage of Population Employed in Health Care & Social Assistance in Santa Clarita, CA
RELATED REPORTS & OPTIONS
Health Care & Social Assistance
Santa Clarita
Compare Zip Codes
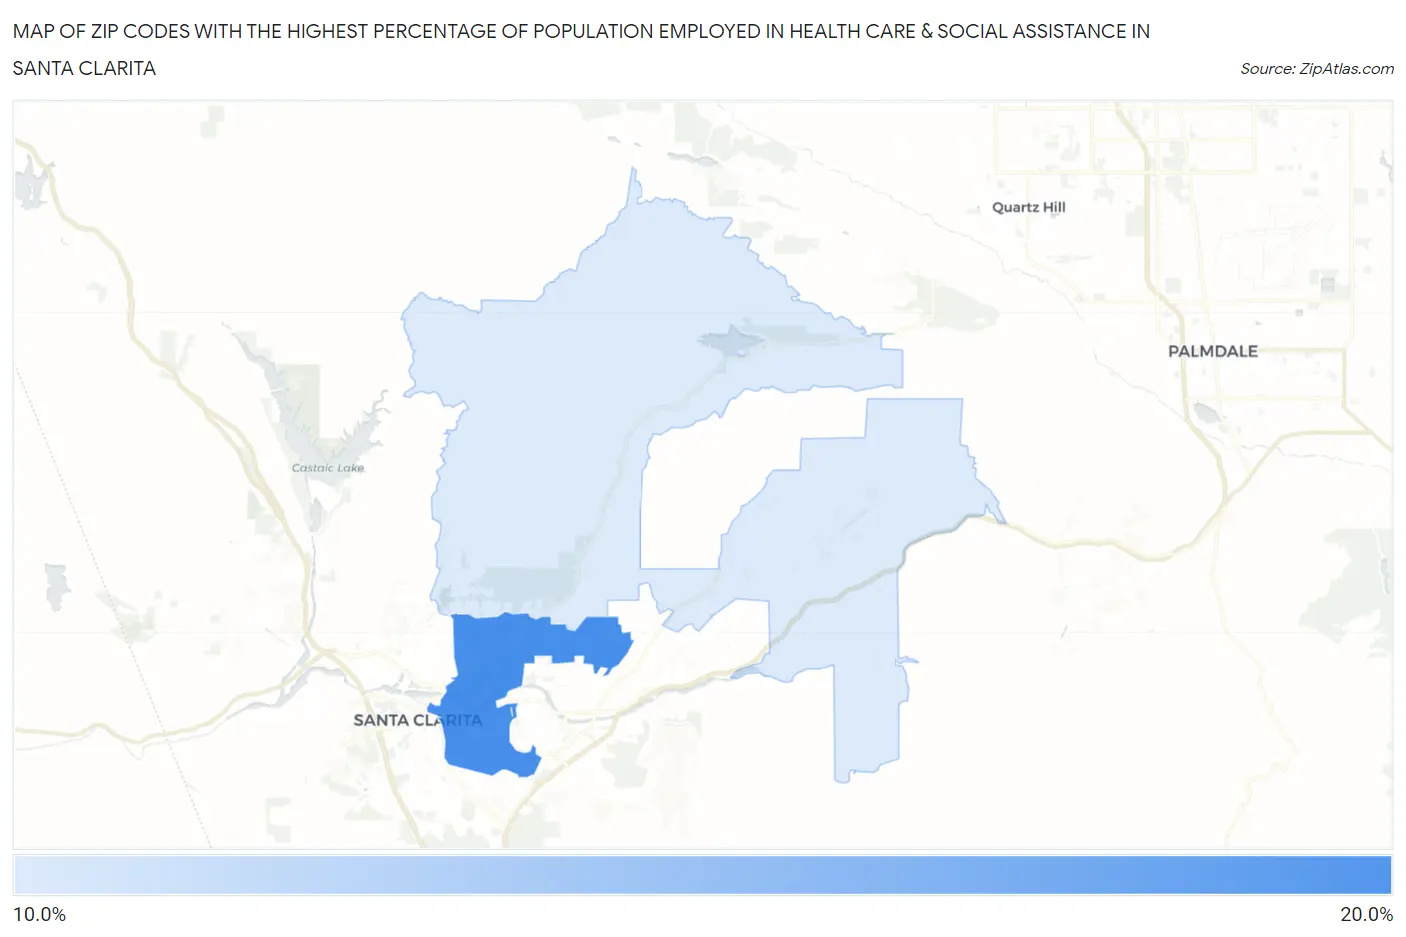
Map of Zip Codes with the Highest Percentage of Population Employed in Health Care & Social Assistance in Santa Clarita
13.8%
15.4%
Zip Codes with the Highest Percentage of Population Employed in Health Care & Social Assistance in Santa Clarita, CA
| Zip Code | % Employed | vs State | vs National | |
| 1. | 91350 | 15.4% | 12.7%(+2.63)#337 | 13.9%(+1.43)#10,845 |
| 2. | 91390 | 13.8% | 12.7%(+1.06)#532 | 13.9%(-0.138)#14,572 |
1
Common Questions
What are the Top Zip Codes with the Highest Percentage of Population Employed in Health Care & Social Assistance in Santa Clarita, CA?
Top Zip Codes with the Highest Percentage of Population Employed in Health Care & Social Assistance in Santa Clarita, CA are:
What zip code has the Highest Percentage of Population Employed in Health Care & Social Assistance in Santa Clarita, CA?
91350 has the Highest Percentage of Population Employed in Health Care & Social Assistance in Santa Clarita, CA with 15.4%.
What is the Percentage of Population Employed in Health Care & Social Assistance in Santa Clarita, CA?
Percentage of Population Employed in Health Care & Social Assistance in Santa Clarita is 13.5%.
What is the Percentage of Population Employed in Health Care & Social Assistance in California?
Percentage of Population Employed in Health Care & Social Assistance in California is 12.7%.
What is the Percentage of Population Employed in Health Care & Social Assistance in the United States?
Percentage of Population Employed in Health Care & Social Assistance in the United States is 13.9%.