Zip Codes with the Highest Percentage of Population Employed in Agriculture, Fishing & Hunting in Yuma, AZ

RELATED REPORTS & OPTIONS

Agriculture, Fishing & Hunting
Population
Families and Households
Female Fertility
Female Fertility (Unmarried)
Race (Community Size)
Race (Percentage)
Ancestry (Community Size)
AfricanAmericanApacheArabAustralianAustrianBasqueBelgianBhutaneseBlackfeetBrazilianBritishBulgarianBurmeseCanadianCentral AmericanCherokeeChickasawChoctawColombianCroatianCubanCzechCzechoslovakianDanishDominicanDutchEastern EuropeanEcuadorianEnglishEuropeanFinnishFrenchFrench American IndianFrench CanadianGermanGreekGuatemalanHonduranHungarianIndian (Asian)IranianIrishIroquoisItalianJamaicanJapaneseKoreanLebaneseLithuanianLuxembourgerMexicanMexican American IndianNative HawaiianNavajoNorthern EuropeanNorwegianPakistaniPennsylvania GermanPeruvianPimaPolishPortuguesePuerto RicanRomanianRussianSalvadoranSamoanScandinavianScotch-IrishScottishSlavicSlovakSouth AmericanSouth American IndianSpaniardSpanishSri LankanSubsaharan AfricanSwedishSwissThaiTohono O'OdhamTrinidadian and TobagonianUkrainianWelshWest IndianYaquiYugoslavianYuman
Ancestry (Percentage)
AfricanAmericanApacheArabAustralianAustrianBasqueBelgianBhutaneseBlackfeetBrazilianBritishBulgarianBurmeseCanadianCentral AmericanCherokeeChickasawChoctawColombianCroatianCubanCzechCzechoslovakianDanishDominicanDutchEastern EuropeanEcuadorianEnglishEuropeanFinnishFrenchFrench American IndianFrench CanadianGermanGreekGuatemalanHonduranHungarianIndian (Asian)IranianIrishIroquoisItalianJamaicanJapaneseKoreanLebaneseLithuanianLuxembourgerMexicanMexican American IndianNative HawaiianNavajoNorthern EuropeanNorwegianPakistaniPennsylvania GermanPeruvianPimaPolishPortuguesePuerto RicanRomanianRussianSalvadoranSamoanScandinavianScotch-IrishScottishSlavicSlovakSouth AmericanSouth American IndianSpaniardSpanishSri LankanSubsaharan AfricanSwedishSwissThaiTohono O'OdhamTrinidadian and TobagonianUkrainianWelshWest IndianYaquiYugoslavianYuman
Immigrant Origin (Total)
Immigrant Origin (Percentage)
Income
Income (Families)
Income (Households)
Poverty
Poverty (Families)
Unemployment
Employment Occupations
Employment Industries
Employer Class
Commute Time
Commute Means
School Enrollment
Education by Degree Field
Occupancy
Finances
Physical Characteristics
Yuma
Compare Zip Codes
Comparison Subject

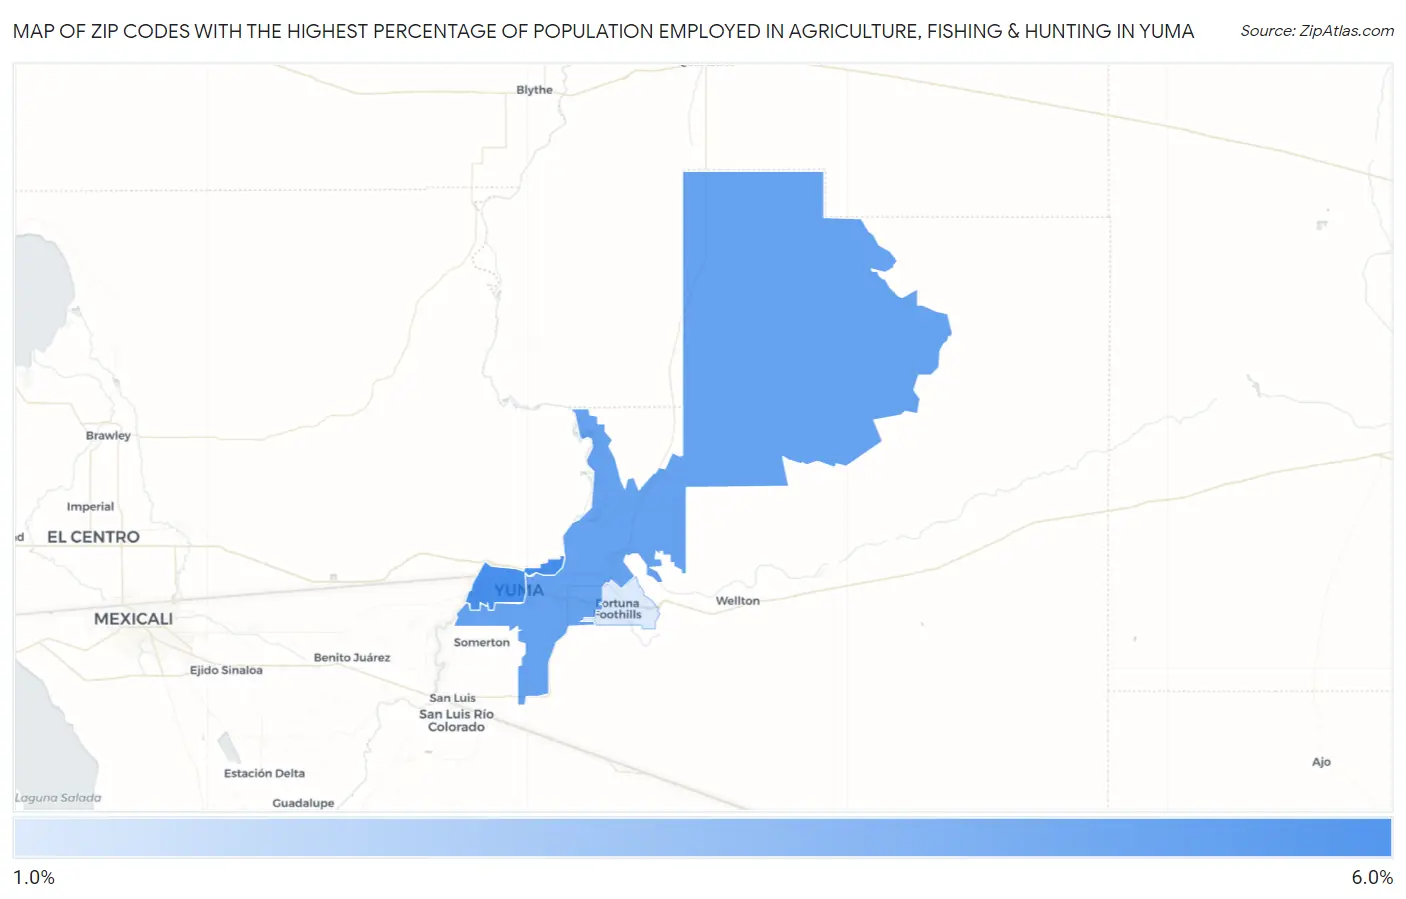
Map of Zip Codes with the Highest Percentage of Population Employed in Agriculture, Fishing & Hunting in Yuma

0.0%
6.0%
Zip Codes with the Highest Percentage of Population Employed in Agriculture, Fishing & Hunting in Yuma Map

Zip Codes with the Highest Percentage of Population Employed in Agriculture, Fishing & Hunting in Yuma, AZ

Zip Code % Employed vs State vs National
1.853645.9%0.80%(+5.07)#461.2%(+4.67)#7,035
2.853655.0%0.80%(+4.19)#491.2%(+3.79)#7,856
3.853671.6%0.80%(+0.759)#941.2%(+0.363)#14,084

Common Questions

What are the Top Zip Codes with the Highest Percentage of Population Employed in Agriculture, Fishing & Hunting in Yuma, AZ?
Top Zip Codes with the Highest Percentage of Population Employed in Agriculture, Fishing & Hunting in Yuma, AZ are:
#1
5.9%
#2
5.0%
#3
1.6%
What zip code has the Highest Percentage of Population Employed in Agriculture, Fishing & Hunting in Yuma, AZ?
85364 has the Highest Percentage of Population Employed in Agriculture, Fishing & Hunting in Yuma, AZ with 5.9%.
What is the Percentage of Population Employed in Agriculture, Fishing & Hunting in Yuma, AZ?
Percentage of Population Employed in Agriculture, Fishing & Hunting in Yuma is 4.7%.
What is the Percentage of Population Employed in Agriculture, Fishing & Hunting in Arizona?
Percentage of Population Employed in Agriculture, Fishing & Hunting in Arizona is 0.80%.
What is the Percentage of Population Employed in Agriculture, Fishing & Hunting in the United States?
Percentage of Population Employed in Agriculture, Fishing & Hunting in the United States is 1.2%.