Zip Codes with the Highest Percentage of Population Employed in Agriculture, Fishing & Hunting in Phoenix, AZ
RELATED REPORTS & OPTIONS
Agriculture, Fishing & Hunting
Phoenix
Compare Zip Codes
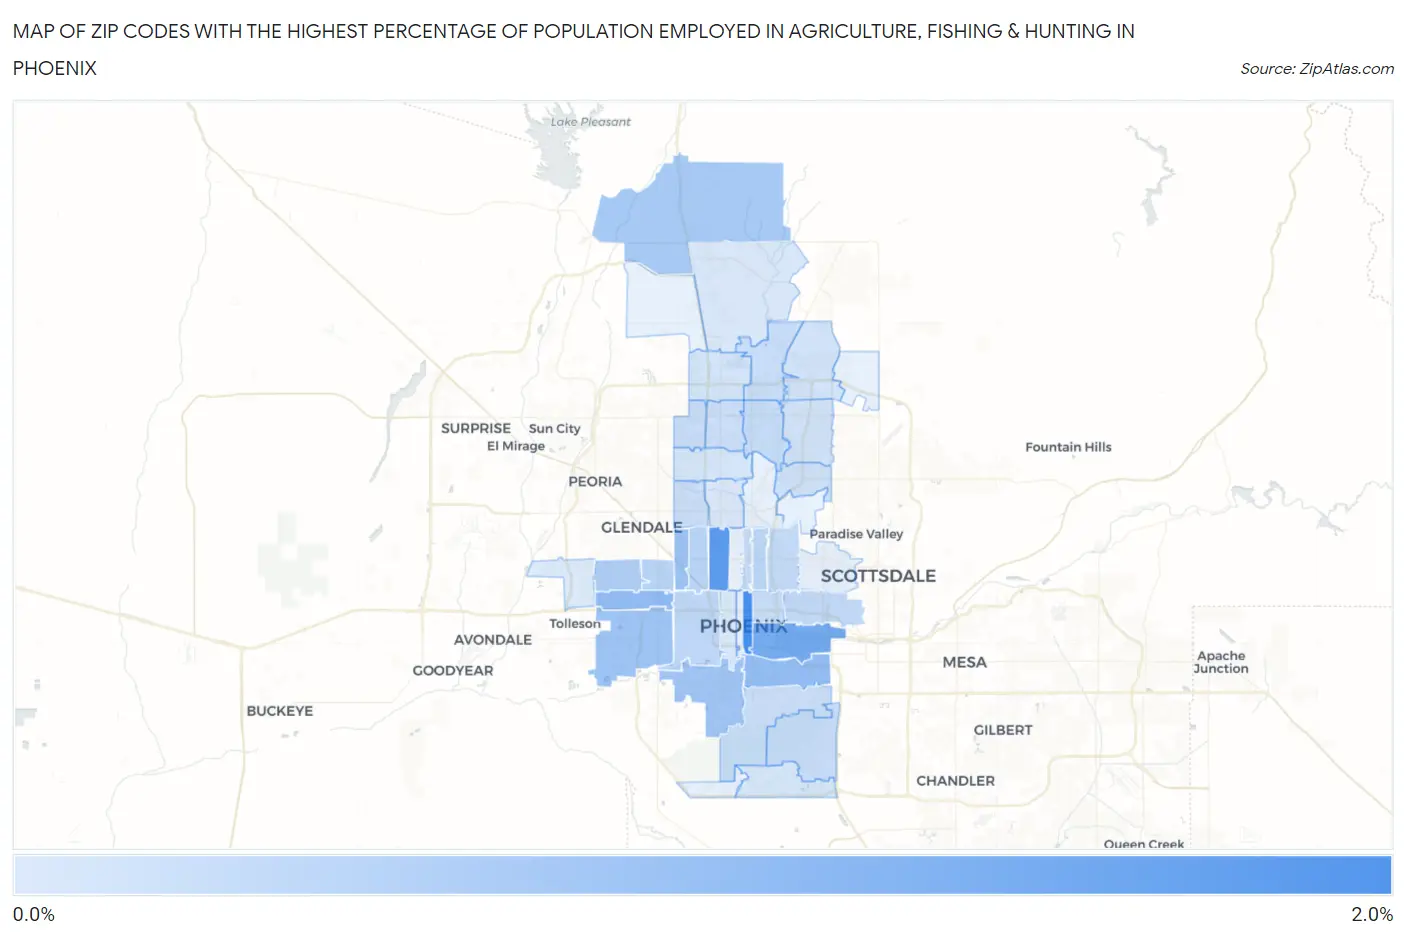
Map of Zip Codes with the Highest Percentage of Population Employed in Agriculture, Fishing & Hunting in Phoenix
0.0%
2.0%
Zip Codes with the Highest Percentage of Population Employed in Agriculture, Fishing & Hunting in Phoenix, AZ
| Zip Code | % Employed | vs State | vs National | |
| 1. | 85004 | 1.6% | 0.80%(+0.792)#92 | 1.2%(+0.396)#13,986 |
| 2. | 85015 | 1.4% | 0.80%(+0.583)#98 | 1.2%(+0.186)#14,699 |
| 3. | 85034 | 1.1% | 0.80%(+0.299)#114 | 1.2%(-0.098)#15,787 |
| 4. | 85035 | 0.82% | 0.80%(+0.022)#129 | 1.2%(-0.375)#17,110 |
| 5. | 85040 | 0.78% | 0.80%(-0.020)#131 | 1.2%(-0.417)#17,353 |
| 6. | 85019 | 0.72% | 0.80%(-0.084)#137 | 1.2%(-0.481)#17,740 |
| 7. | 85043 | 0.67% | 0.80%(-0.132)#139 | 1.2%(-0.529)#18,023 |
| 8. | 85041 | 0.65% | 0.80%(-0.150)#143 | 1.2%(-0.546)#18,118 |
| 9. | 85086 | 0.58% | 0.80%(-0.219)#155 | 1.2%(-0.616)#18,597 |
| 10. | 85033 | 0.51% | 0.80%(-0.292)#164 | 1.2%(-0.688)#19,177 |
| 11. | 85017 | 0.38% | 0.80%(-0.426)#193 | 1.2%(-0.823)#20,369 |
| 12. | 85031 | 0.37% | 0.80%(-0.433)#196 | 1.2%(-0.830)#20,439 |
| 13. | 85014 | 0.36% | 0.80%(-0.445)#201 | 1.2%(-0.841)#20,568 |
| 14. | 85009 | 0.34% | 0.80%(-0.467)#210 | 1.2%(-0.864)#20,801 |
| 15. | 85008 | 0.31% | 0.80%(-0.495)#211 | 1.2%(-0.892)#21,085 |
| 16. | 85016 | 0.29% | 0.80%(-0.513)#215 | 1.2%(-0.909)#21,283 |
| 17. | 85012 | 0.28% | 0.80%(-0.521)#217 | 1.2%(-0.917)#21,387 |
| 18. | 85022 | 0.25% | 0.80%(-0.550)#226 | 1.2%(-0.946)#21,725 |
| 19. | 85053 | 0.25% | 0.80%(-0.555)#227 | 1.2%(-0.951)#21,783 |
| 20. | 85024 | 0.24% | 0.80%(-0.562)#228 | 1.2%(-0.958)#21,863 |
| 21. | 85006 | 0.24% | 0.80%(-0.568)#229 | 1.2%(-0.964)#21,930 |
| 22. | 85044 | 0.22% | 0.80%(-0.578)#231 | 1.2%(-0.975)#22,048 |
| 23. | 85051 | 0.22% | 0.80%(-0.580)#232 | 1.2%(-0.977)#22,069 |
| 24. | 85023 | 0.21% | 0.80%(-0.594)#234 | 1.2%(-0.990)#22,248 |
| 25. | 85042 | 0.20% | 0.80%(-0.598)#235 | 1.2%(-0.994)#22,301 |
| 26. | 85028 | 0.16% | 0.80%(-0.641)#243 | 1.2%(-1.04)#22,846 |
| 27. | 85032 | 0.15% | 0.80%(-0.654)#246 | 1.2%(-1.05)#23,028 |
| 28. | 85050 | 0.14% | 0.80%(-0.661)#250 | 1.2%(-1.06)#23,129 |
| 29. | 85027 | 0.11% | 0.80%(-0.694)#261 | 1.2%(-1.09)#23,545 |
| 30. | 85048 | 0.100% | 0.80%(-0.703)#263 | 1.2%(-1.10)#23,688 |
| 31. | 85029 | 0.091% | 0.80%(-0.712)#267 | 1.2%(-1.11)#23,807 |
| 32. | 85007 | 0.079% | 0.80%(-0.724)#269 | 1.2%(-1.12)#23,977 |
| 33. | 85085 | 0.060% | 0.80%(-0.743)#274 | 1.2%(-1.14)#24,222 |
| 34. | 85021 | 0.042% | 0.80%(-0.761)#278 | 1.2%(-1.16)#24,426 |
| 35. | 85037 | 0.020% | 0.80%(-0.783)#281 | 1.2%(-1.18)#24,581 |
1
Common Questions
What are the Top 10 Zip Codes with the Highest Percentage of Population Employed in Agriculture, Fishing & Hunting in Phoenix, AZ?
Top 10 Zip Codes with the Highest Percentage of Population Employed in Agriculture, Fishing & Hunting in Phoenix, AZ are:
What zip code has the Highest Percentage of Population Employed in Agriculture, Fishing & Hunting in Phoenix, AZ?
85004 has the Highest Percentage of Population Employed in Agriculture, Fishing & Hunting in Phoenix, AZ with 1.6%.
What is the Percentage of Population Employed in Agriculture, Fishing & Hunting in Phoenix, AZ?
Percentage of Population Employed in Agriculture, Fishing & Hunting in Phoenix is 0.30%.
What is the Percentage of Population Employed in Agriculture, Fishing & Hunting in Arizona?
Percentage of Population Employed in Agriculture, Fishing & Hunting in Arizona is 0.80%.
What is the Percentage of Population Employed in Agriculture, Fishing & Hunting in the United States?
Percentage of Population Employed in Agriculture, Fishing & Hunting in the United States is 1.2%.