Zip Codes with the Highest Percentage of Population with a Degree in Computers and Mathematics in Mesa, AZ

RELATED REPORTS & OPTIONS

Computers and Mathematics
Population
Families and Households
Female Fertility
Female Fertility (Unmarried)
Race (Community Size)
Race (Percentage)
Ancestry (Community Size)
AfghanAfricanAlaskan AthabascanAlbanianAleutAlsatianAmericanApacheArabArapahoArgentineanArmenianAssyrian / Chaldean / SyriacAustralianAustrianBahamianBasqueBelgianBelizeanBhutaneseBlackfeetBrazilianBritishBulgarianBurmeseCajunCanadianCelticCentral AmericanCentral American IndianCherokeeCheyenneChickasawChileanChineseChippewaChoctawColombianComancheCosta RicanCreeCreekCroatianCubanCzechCzechoslovakianDanishDominicanDutchEastern EuropeanEcuadorianEgyptianEnglishEstonianEthiopianEuropeanFilipinoFinnishFrenchFrench American IndianFrench CanadianGermanGerman RussianGreekGuamanian / ChamorroGuatemalanGuyaneseHaitianHonduranHopiHungarianIcelanderIndian (Asian)IndonesianInupiatIranianIraqiIrishIroquoisIsraeliItalianJamaicanJapaneseJordanianKenyanKiowaKoreanLaotianLatvianLebaneseLithuanianLuxembourgerMacedonianMalaysianMalteseMexicanMexican American IndianMoroccanNative HawaiianNavajoNicaraguanNigerianNorthern EuropeanNorwegianPakistaniPalestinianPanamanianPennsylvania GermanPeruvianPimaPolishPortuguesePotawatomiPuebloPuerto RicanPuget Sound SalishRomanianRussianSalvadoranSamoanScandinavianScotch-IrishScottishSeminoleSerbianSierra LeoneanSiouxSlavicSlovakSloveneSouth AfricanSouth AmericanSouth American IndianSpaniardSpanishSpanish AmericanSri LankanSubsaharan AfricanSwedishSwissSyrianThaiTlingit-HaidaTohono O'OdhamTonganTrinidadian and TobagonianTurkishUkrainianUteVenezuelanVietnameseWelshWest IndianYaquiYugoslavianYuman
Ancestry (Percentage)
AfghanAfricanAlaskan AthabascanAlbanianAleutAlsatianAmericanApacheArabArapahoArgentineanArmenianAssyrian / Chaldean / SyriacAustralianAustrianBahamianBasqueBelgianBelizeanBhutaneseBlackfeetBrazilianBritishBulgarianBurmeseCajunCanadianCelticCentral AmericanCentral American IndianCherokeeCheyenneChickasawChileanChineseChippewaChoctawColombianComancheCosta RicanCreeCreekCroatianCubanCzechCzechoslovakianDanishDominicanDutchEastern EuropeanEcuadorianEgyptianEnglishEstonianEthiopianEuropeanFilipinoFinnishFrenchFrench American IndianFrench CanadianGermanGerman RussianGreekGuamanian / ChamorroGuatemalanGuyaneseHaitianHonduranHopiHungarianIcelanderIndian (Asian)IndonesianInupiatIranianIraqiIrishIroquoisIsraeliItalianJamaicanJapaneseJordanianKenyanKiowaKoreanLaotianLatvianLebaneseLithuanianLuxembourgerMacedonianMalaysianMalteseMexicanMexican American IndianMoroccanNative HawaiianNavajoNicaraguanNigerianNorthern EuropeanNorwegianPakistaniPalestinianPanamanianPennsylvania GermanPeruvianPimaPolishPortuguesePotawatomiPuebloPuerto RicanPuget Sound SalishRomanianRussianSalvadoranSamoanScandinavianScotch-IrishScottishSeminoleSerbianSierra LeoneanSiouxSlavicSlovakSloveneSouth AfricanSouth AmericanSouth American IndianSpaniardSpanishSpanish AmericanSri LankanSubsaharan AfricanSwedishSwissSyrianThaiTlingit-HaidaTohono O'OdhamTonganTrinidadian and TobagonianTurkishUkrainianUteVenezuelanVietnameseWelshWest IndianYaquiYugoslavianYuman
Immigrant Origin (Total)
AfghanistanAfricaArgentinaAsiaAustraliaAustriaBangladeshBarbadosBelgiumBelizeBosnia and HerzegovinaBrazilCambodiaCameroonCanadaCaribbeanCentral AmericaChileChinaColombiaCongoCosta RicaCroatiaCubaCzechoslovakiaDenmarkDominican RepublicEastern AfricaEastern AsiaEastern EuropeEcuadorEgyptEl SalvadorEnglandEthiopiaEuropeFijiFranceGermanyGhanaGreeceGuatemalaGuyanaHaitiHondurasHong KongHungaryIndiaIndonesiaIranIraqIrelandIsraelItalyJamaicaJapanJordanKenyaKoreaLaosLatin AmericaLebanonMexicoMiddle AfricaMoroccoNetherlandsNicaraguaNigeriaNorth MacedoniaNorthern AfricaNorthern EuropeNorwayOceaniaPakistanPanamaPeruPhilippinesPolandRomaniaRussiaSaudi ArabiaScotlandSerbiaSierra LeoneSingaporeSouth AfricaSouth AmericaSouth Central AsiaSouth Eastern AsiaSouthern EuropeSwedenSwitzerlandTaiwanThailandTrinidad and TobagoTurkeyUkraineVenezuelaVietnamWestern AfricaWestern AsiaWestern Europe
Immigrant Origin (Percentage)
AfghanistanAfricaArgentinaAsiaAustraliaAustriaBangladeshBarbadosBelgiumBelizeBosnia and HerzegovinaBrazilCambodiaCameroonCanadaCaribbeanCentral AmericaChileChinaColombiaCongoCosta RicaCroatiaCubaCzechoslovakiaDenmarkDominican RepublicEastern AfricaEastern AsiaEastern EuropeEcuadorEgyptEl SalvadorEnglandEthiopiaEuropeFijiFranceGermanyGhanaGreeceGuatemalaGuyanaHaitiHondurasHong KongHungaryIndiaIndonesiaIranIraqIrelandIsraelItalyJamaicaJapanJordanKenyaKoreaLaosLatin AmericaLebanonMexicoMiddle AfricaMoroccoNetherlandsNicaraguaNigeriaNorth MacedoniaNorthern AfricaNorthern EuropeNorwayOceaniaPakistanPanamaPeruPhilippinesPolandRomaniaRussiaSaudi ArabiaScotlandSerbiaSierra LeoneSingaporeSouth AfricaSouth AmericaSouth Central AsiaSouth Eastern AsiaSouthern EuropeSwedenSwitzerlandTaiwanThailandTrinidad and TobagoTurkeyUkraineVenezuelaVietnamWestern AfricaWestern AsiaWestern Europe
Income
Income (Families)
Income (Households)
Poverty
Poverty (Families)
Unemployment
Employment Occupations
Employment Industries
Employer Class
Commute Time
Commute Means
School Enrollment
Education by Degree Field
Occupancy
Finances
Physical Characteristics
Mesa
Compare Zip Codes
Comparison Subject

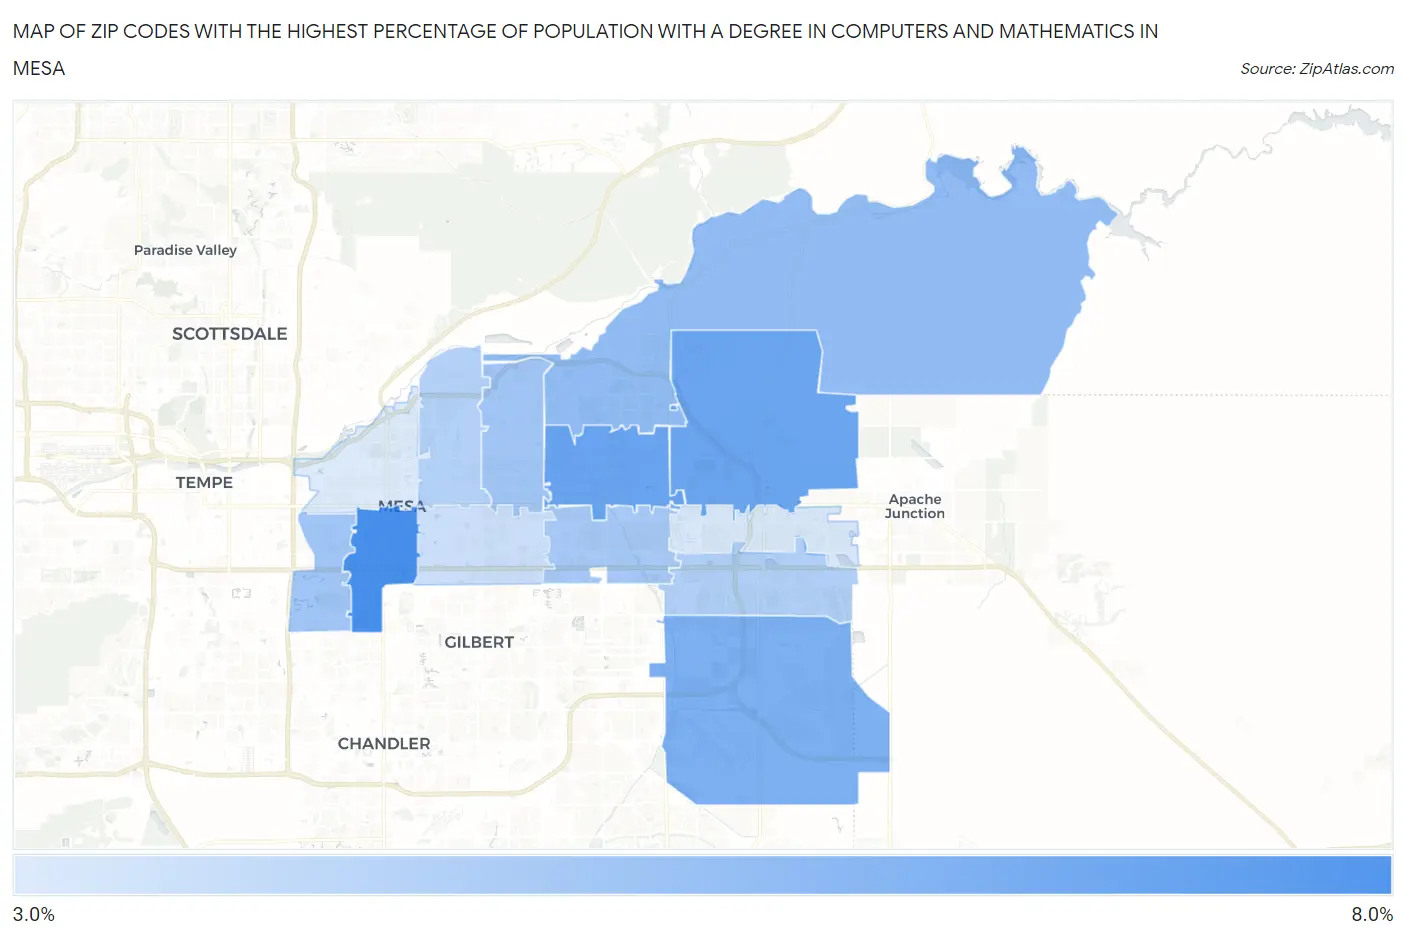
Map of Zip Codes with the Highest Percentage of Population with a Degree in Computers and Mathematics in Mesa

0.0%
8.0%
Zip Codes with the Highest Percentage of Population with a Degree in Computers and Mathematics in Mesa Map

Zip Codes with the Highest Percentage of Population with a Degree in Computers and Mathematics in Mesa, AZ

Zip Code % Graduates vs State vs National
1.852106.3%4.5%(+1.82)#604.9%(+1.41)#4,774
2.852055.6%4.5%(+1.08)#814.9%(+0.663)#6,169
3.852075.5%4.5%(+1.01)#824.9%(+0.595)#6,320
4.852125.2%4.5%(+0.677)#954.9%(+0.258)#7,080
5.852154.7%4.5%(+0.223)#1144.9%(-0.197)#8,282
6.852024.3%4.5%(-0.143)#1264.9%(-0.562)#9,423
7.852134.3%4.5%(-0.167)#1274.9%(-0.586)#9,518
8.852064.2%4.5%(-0.263)#1354.9%(-0.682)#9,794
9.852094.0%4.5%(-0.516)#1554.9%(-0.935)#10,590
10.852033.9%4.5%(-0.563)#1584.9%(-0.982)#10,767
11.852043.4%4.5%(-1.03)#1924.9%(-1.45)#12,497
12.852083.1%4.5%(-1.33)#2084.9%(-1.75)#13,575
13.852013.0%4.5%(-1.44)#2124.9%(-1.86)#13,966

Common Questions

What are the Top 10 Zip Codes with the Highest Percentage of Population with a Degree in Computers and Mathematics in Mesa, AZ?
Top 10 Zip Codes with the Highest Percentage of Population with a Degree in Computers and Mathematics in Mesa, AZ are:
#1
6.3%
#2
5.6%
#3
5.5%
#4
5.2%
#5
4.7%
#6
4.3%
#7
4.3%
#8
4.2%
#9
4.0%
#10
3.9%
What zip code has the Highest Percentage of Population with a Degree in Computers and Mathematics in Mesa, AZ?
85210 has the Highest Percentage of Population with a Degree in Computers and Mathematics in Mesa, AZ with 6.3%.
What is the Percentage of Population with a Degree in Computers and Mathematics in Mesa, AZ?
Percentage of Population with a Degree in Computers and Mathematics in Mesa is 4.5%.
What is the Percentage of Population with a Degree in Computers and Mathematics in Arizona?
Percentage of Population with a Degree in Computers and Mathematics in Arizona is 4.5%.
What is the Percentage of Population with a Degree in Computers and Mathematics in the United States?
Percentage of Population with a Degree in Computers and Mathematics in the United States is 4.9%.