Zip Codes with the Highest Percentage of Households Heated by Electricity in Green Valley, AZ
RELATED REPORTS & OPTIONS
Electrical Heating
Green Valley
Compare Zip Codes
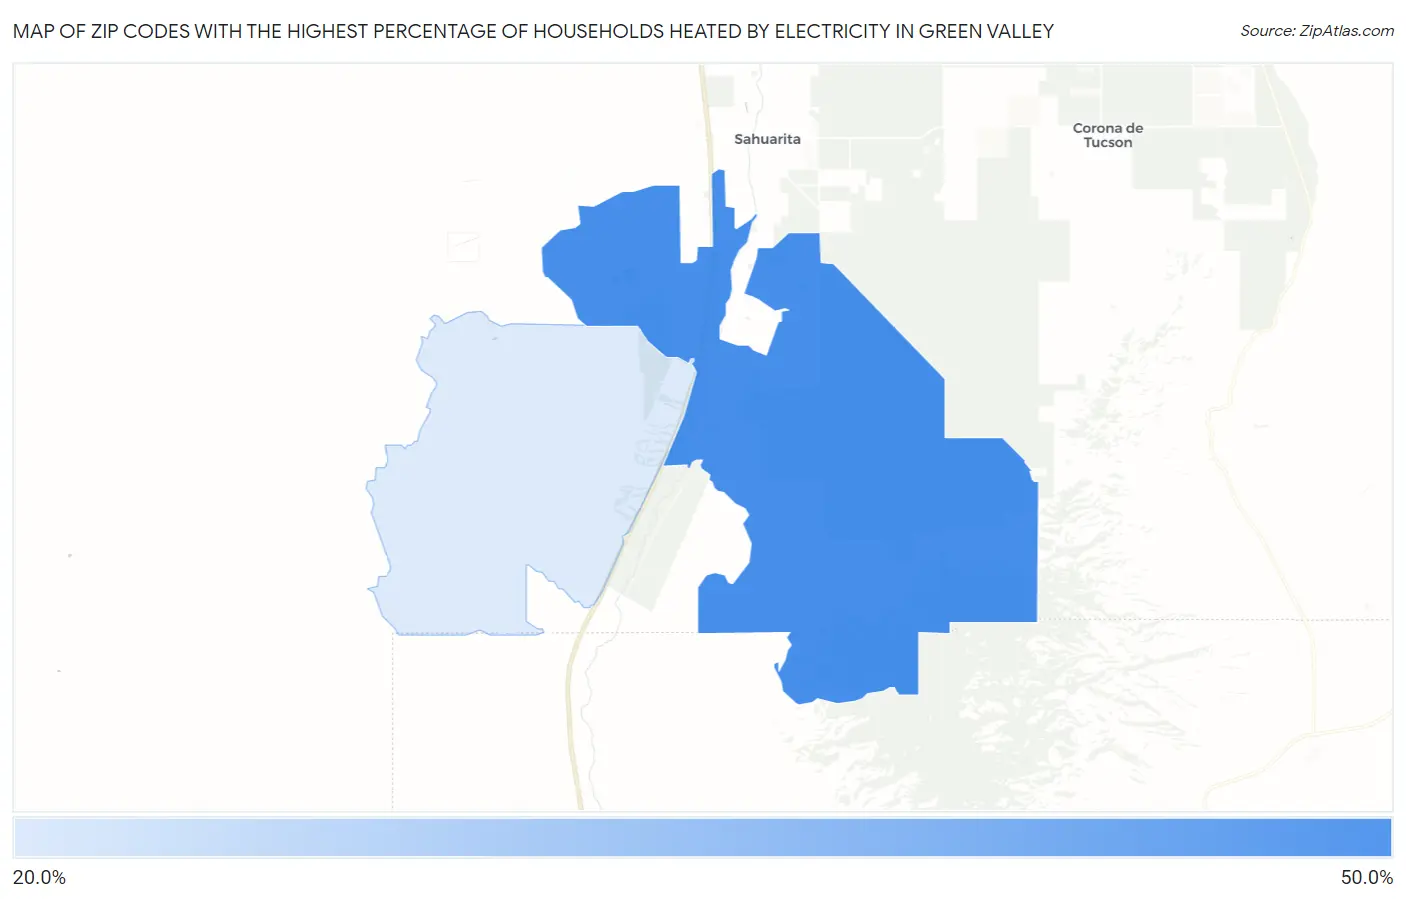
Map of Zip Codes with the Highest Percentage of Households Heated by Electricity in Green Valley
29.3%
41.0%
Zip Codes with the Highest Percentage of Households Heated by Electricity in Green Valley, AZ
| Zip Code | Electrical Heating | vs State | vs National | |
| 1. | 85614 | 41.0% | 60.0%(-19.0)#237 | 40.2%(+0.800)#12,395 |
| 2. | 85622 | 29.3% | 60.0%(-30.7)#296 | 40.2%(-10.9)#16,274 |
1
Common Questions
What are the Top Zip Codes with the Highest Percentage of Households Heated by Electricity in Green Valley, AZ?
Top Zip Codes with the Highest Percentage of Households Heated by Electricity in Green Valley, AZ are:
What zip code has the Highest Percentage of Households Heated by Electricity in Green Valley, AZ?
85614 has the Highest Percentage of Households Heated by Electricity in Green Valley, AZ with 41.0%.
What is the Percentage of Households Heated by Electricity in Green Valley, AZ?
Percentage of Households Heated by Electricity in Green Valley is 40.0%.
What is the Percentage of Households Heated by Electricity in Arizona?
Percentage of Households Heated by Electricity in Arizona is 60.0%.
What is the Percentage of Households Heated by Electricity in the United States?
Percentage of Households Heated by Electricity in the United States is 40.2%.