Zip Codes with the Highest Percentage of Population with a Degree in Visual and Performing Arts in Fort Smith, AR
RELATED REPORTS & OPTIONS
Visual and Performing Arts
Fort Smith
Compare Zip Codes
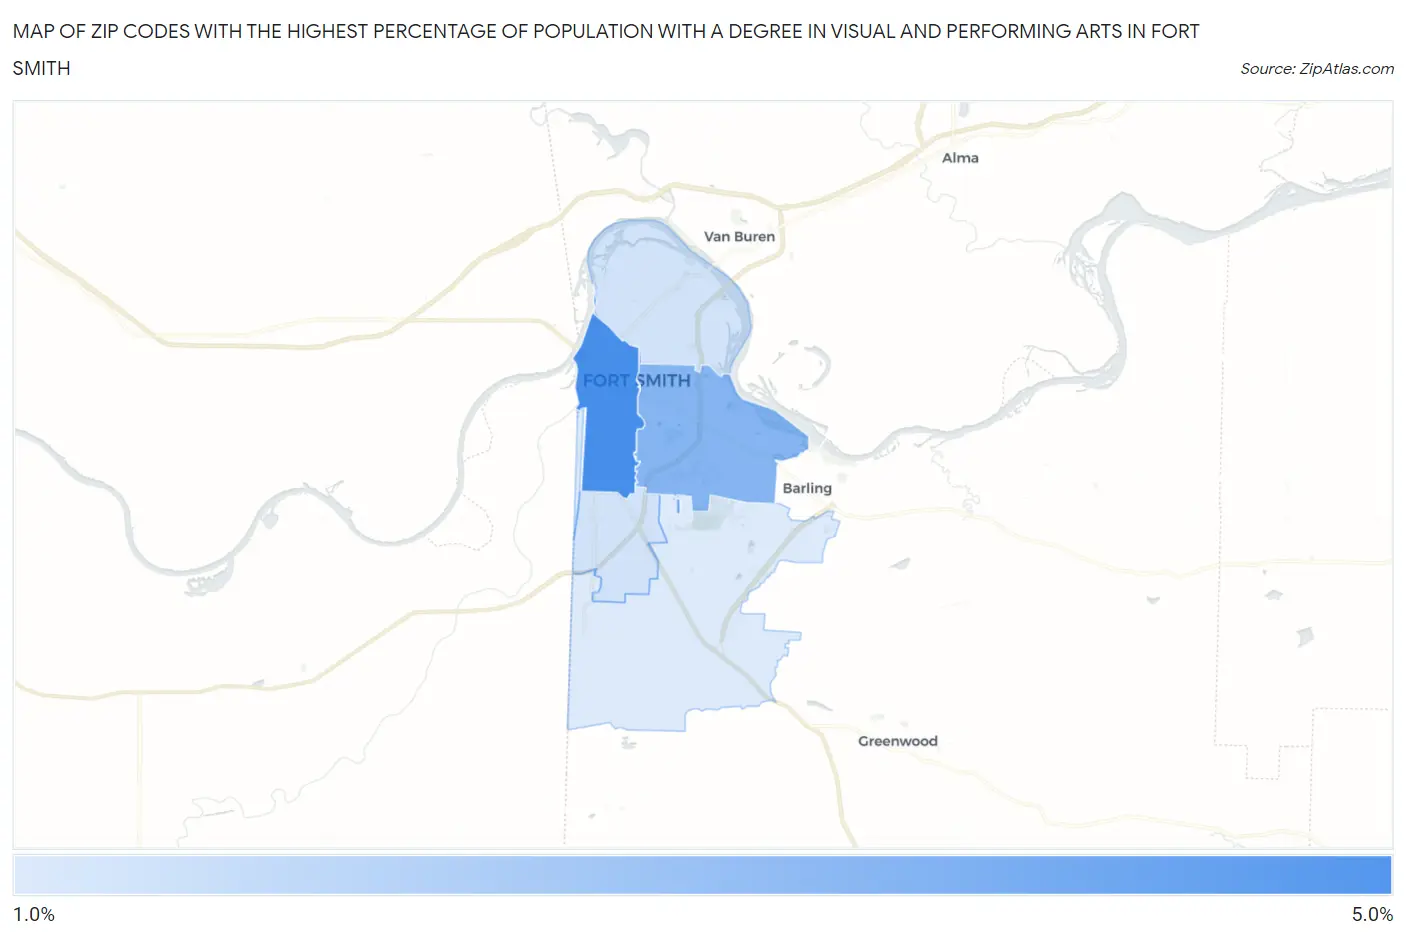
Map of Zip Codes with the Highest Percentage of Population with a Degree in Visual and Performing Arts in Fort Smith
1.5%
5.0%
Zip Codes with the Highest Percentage of Population with a Degree in Visual and Performing Arts in Fort Smith, AR
| Zip Code | % Graduates | vs State | vs National | |
| 1. | 72901 | 5.0% | 3.1%(+1.92)#68 | 4.3%(+0.743)#6,660 |
| 2. | 72903 | 3.5% | 3.1%(+0.440)#114 | 4.3%(-0.739)#10,837 |
| 3. | 72908 | 1.7% | 3.1%(-1.35)#182 | 4.3%(-2.53)#17,421 |
| 4. | 72904 | 1.7% | 3.1%(-1.37)#184 | 4.3%(-2.55)#17,482 |
| 5. | 72916 | 1.5% | 3.1%(-1.61)#193 | 4.3%(-2.79)#18,298 |
1
Common Questions
What are the Top 3 Zip Codes with the Highest Percentage of Population with a Degree in Visual and Performing Arts in Fort Smith, AR?
Top 3 Zip Codes with the Highest Percentage of Population with a Degree in Visual and Performing Arts in Fort Smith, AR are:
What zip code has the Highest Percentage of Population with a Degree in Visual and Performing Arts in Fort Smith, AR?
72901 has the Highest Percentage of Population with a Degree in Visual and Performing Arts in Fort Smith, AR with 5.0%.
What is the Percentage of Population with a Degree in Visual and Performing Arts in Fort Smith, AR?
Percentage of Population with a Degree in Visual and Performing Arts in Fort Smith is 3.1%.
What is the Percentage of Population with a Degree in Visual and Performing Arts in Arkansas?
Percentage of Population with a Degree in Visual and Performing Arts in Arkansas is 3.1%.
What is the Percentage of Population with a Degree in Visual and Performing Arts in the United States?
Percentage of Population with a Degree in Visual and Performing Arts in the United States is 4.3%.