Scottsboro, AL Map & Demographics
Scottsboro Map
Scottsboro Overview
$31,876
PER CAPITA INCOME
$61,605
AVG FAMILY INCOME
$49,287
AVG HOUSEHOLD INCOME
28.6%
WAGE / INCOME GAP [ % ]
71.4¢/ $1
WAGE / INCOME GAP [ $ ]
$7,515
FAMILY INCOME DEFICIT
0.48
INEQUALITY / GINI INDEX
15,543
TOTAL POPULATION
7,541
MALE POPULATION
8,002
FEMALE POPULATION
94.24
MALES / 100 FEMALES
106.11
FEMALES / 100 MALES
41.7
MEDIAN AGE
3.0
AVG FAMILY SIZE
2.5
AVG HOUSEHOLD SIZE
6,514
LABOR FORCE [ PEOPLE ]
51.9%
PERCENT IN LABOR FORCE
3.8%
UNEMPLOYMENT RATE
Scottsboro Area Codes
Income in Scottsboro
Income Overview in Scottsboro
Per Capita Income in Scottsboro is $31,876, while median incomes of families and households are $61,605 and $49,287 respectively.
| Characteristic | Number | Measure |
| Per Capita Income | 15,543 | $31,876 |
| Median Family Income | 4,065 | $61,605 |
| Mean Family Income | 4,065 | $88,927 |
| Median Household Income | 6,133 | $49,287 |
| Mean Household Income | 6,133 | $74,964 |
| Income Deficit | 4,065 | $7,515 |
| Wage / Income Gap (%) | 15,543 | 28.62% |
| Wage / Income Gap ($) | 15,543 | 71.38¢ per $1 |
| Gini / Inequality Index | 15,543 | 0.48 |
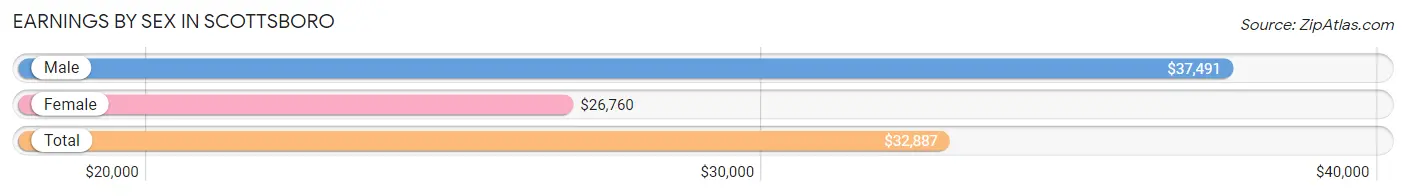
Earnings by Sex in Scottsboro
Average Earnings in Scottsboro are $32,887, $37,491 for men and $26,760 for women, a difference of 28.6%.
| Sex | Number | Average Earnings |
| Male | 3,611 (51.4%) | $37,491 |
| Female | 3,414 (48.6%) | $26,760 |
| Total | 7,025 (100.0%) | $32,887 |
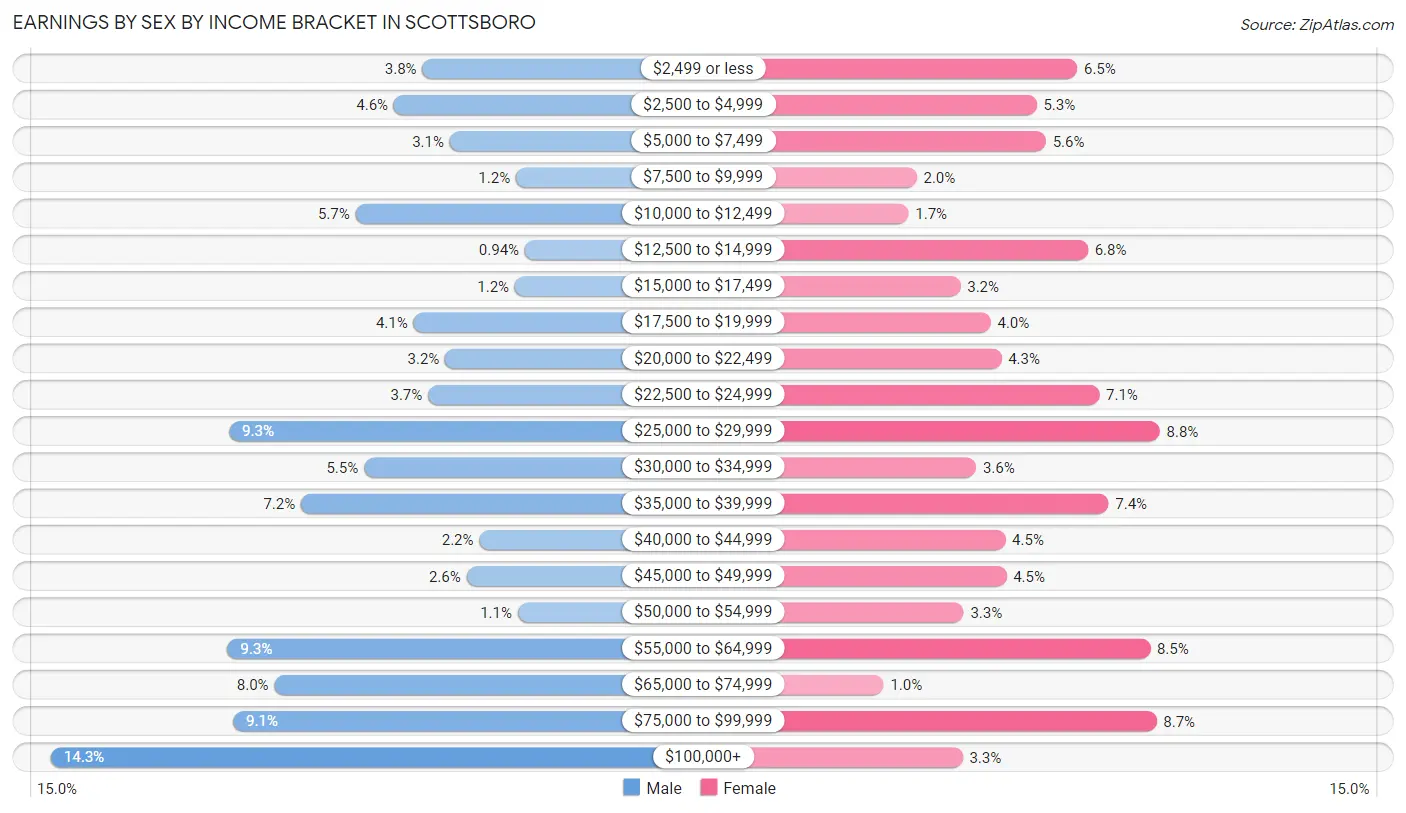
Earnings by Sex by Income Bracket in Scottsboro
The most common earnings brackets in Scottsboro are $100,000+ for men (515 | 14.3%) and $25,000 to $29,999 for women (300 | 8.8%).
| Income | Male | Female |
| $2,499 or less | 138 (3.8%) | 221 (6.5%) |
| $2,500 to $4,999 | 167 (4.6%) | 182 (5.3%) |
| $5,000 to $7,499 | 110 (3.0%) | 191 (5.6%) |
| $7,500 to $9,999 | 43 (1.2%) | 67 (2.0%) |
| $10,000 to $12,499 | 206 (5.7%) | 59 (1.7%) |
| $12,500 to $14,999 | 34 (0.9%) | 231 (6.8%) |
| $15,000 to $17,499 | 44 (1.2%) | 109 (3.2%) |
| $17,500 to $19,999 | 147 (4.1%) | 138 (4.0%) |
| $20,000 to $22,499 | 115 (3.2%) | 148 (4.3%) |
| $22,500 to $24,999 | 132 (3.7%) | 242 (7.1%) |
| $25,000 to $29,999 | 334 (9.2%) | 300 (8.8%) |
| $30,000 to $34,999 | 197 (5.5%) | 124 (3.6%) |
| $35,000 to $39,999 | 261 (7.2%) | 251 (7.3%) |
| $40,000 to $44,999 | 80 (2.2%) | 152 (4.4%) |
| $45,000 to $49,999 | 93 (2.6%) | 153 (4.5%) |
| $50,000 to $54,999 | 41 (1.1%) | 112 (3.3%) |
| $55,000 to $64,999 | 336 (9.3%) | 291 (8.5%) |
| $65,000 to $74,999 | 288 (8.0%) | 35 (1.0%) |
| $75,000 to $99,999 | 330 (9.1%) | 297 (8.7%) |
| $100,000+ | 515 (14.3%) | 111 (3.3%) |
| Total | 3,611 (100.0%) | 3,414 (100.0%) |
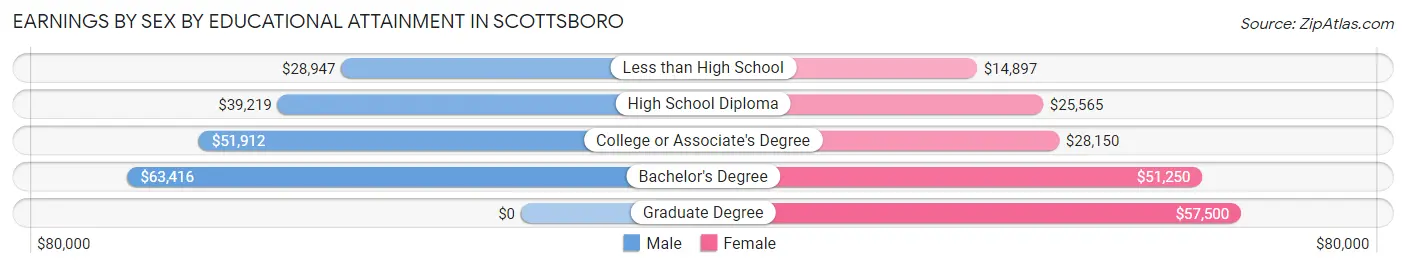
Earnings by Sex by Educational Attainment in Scottsboro
Average earnings in Scottsboro are $44,243 for men and $31,364 for women, a difference of 29.1%. Men with an educational attainment of bachelor's degree enjoy the highest average annual earnings of $63,416, while those with less than high school education earn the least with $28,947. Women with an educational attainment of graduate degree earn the most with the average annual earnings of $57,500, while those with less than high school education have the smallest earnings of $14,897.
| Educational Attainment | Male Income | Female Income |
| Less than High School | $28,947 | $14,897 |
| High School Diploma | $39,219 | $25,565 |
| College or Associate's Degree | $51,912 | $28,150 |
| Bachelor's Degree | $63,416 | $51,250 |
| Graduate Degree | - | - |
| Total | $44,243 | $31,364 |
Family Income in Scottsboro
Family Income Brackets in Scottsboro
According to the Scottsboro family income data, there are 740 families falling into the $100,000 to $149,999 income range, which is the most common income bracket and makes up 18.2% of all families. Conversely, the less than $10,000 income bracket is the least frequent group with only 142 families (3.5%) belonging to this category.
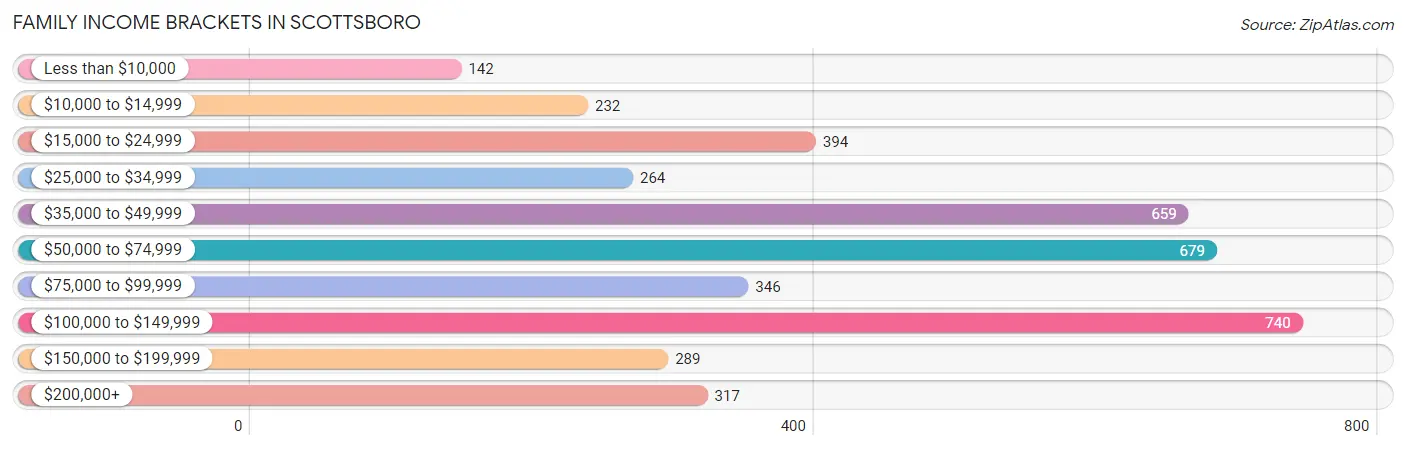
| Income Bracket | # Families | % Families |
| Less than $10,000 | 142 | 3.5% |
| $10,000 to $14,999 | 232 | 5.7% |
| $15,000 to $24,999 | 394 | 9.7% |
| $25,000 to $34,999 | 264 | 6.5% |
| $35,000 to $49,999 | 659 | 16.2% |
| $50,000 to $74,999 | 679 | 16.7% |
| $75,000 to $99,999 | 346 | 8.5% |
| $100,000 to $149,999 | 740 | 18.2% |
| $150,000 to $199,999 | 289 | 7.1% |
| $200,000+ | 317 | 7.8% |
Family Income by Famaliy Size in Scottsboro
6-person families (40 | 1.0%) account for the highest median family income in Scottsboro with $108,816 per family, while 2-person families (2,048 | 50.4%) have the highest median income of $33,375 per family member.
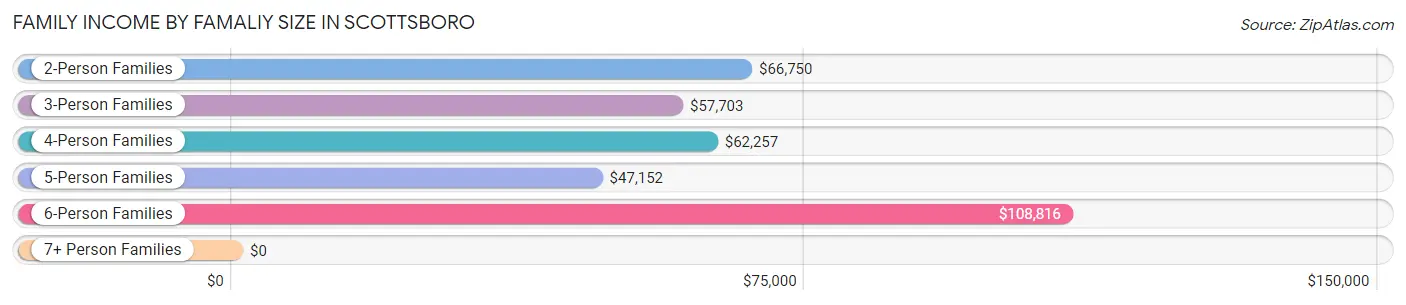
| Income Bracket | # Families | Median Income |
| 2-Person Families | 2,048 (50.4%) | $66,750 |
| 3-Person Families | 1,165 (28.7%) | $57,703 |
| 4-Person Families | 603 (14.8%) | $62,257 |
| 5-Person Families | 209 (5.1%) | $47,152 |
| 6-Person Families | 40 (1.0%) | $108,816 |
| 7+ Person Families | 0 (0.0%) | $0 |
| Total | 4,065 (100.0%) | $61,605 |
Family Income by Number of Earners in Scottsboro
The median family income in Scottsboro is $61,605, with families comprising 2 earners (1,457) having the highest median family income of $109,028, while families with 1 earner (1,559) have the lowest median family income of $44,726, accounting for 35.8% and 38.4% of families, respectively.
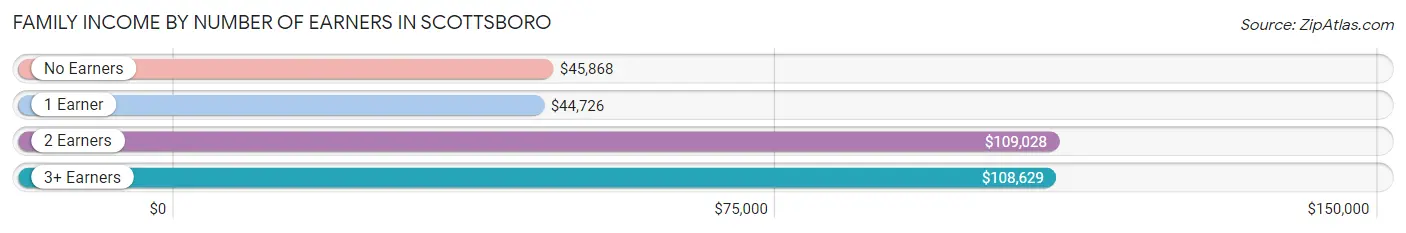
| Number of Earners | # Families | Median Income |
| No Earners | 847 (20.8%) | $45,868 |
| 1 Earner | 1,559 (38.4%) | $44,726 |
| 2 Earners | 1,457 (35.8%) | $109,028 |
| 3+ Earners | 202 (5.0%) | $108,629 |
| Total | 4,065 (100.0%) | $61,605 |
Household Income in Scottsboro
Household Income Brackets in Scottsboro
With 1,055 households falling in the category, the $35,000 to $49,999 income range is the most frequent in Scottsboro, accounting for 17.2% of all households. In contrast, only 264 households (4.3%) fall into the less than $10,000 income bracket, making it the least populous group.
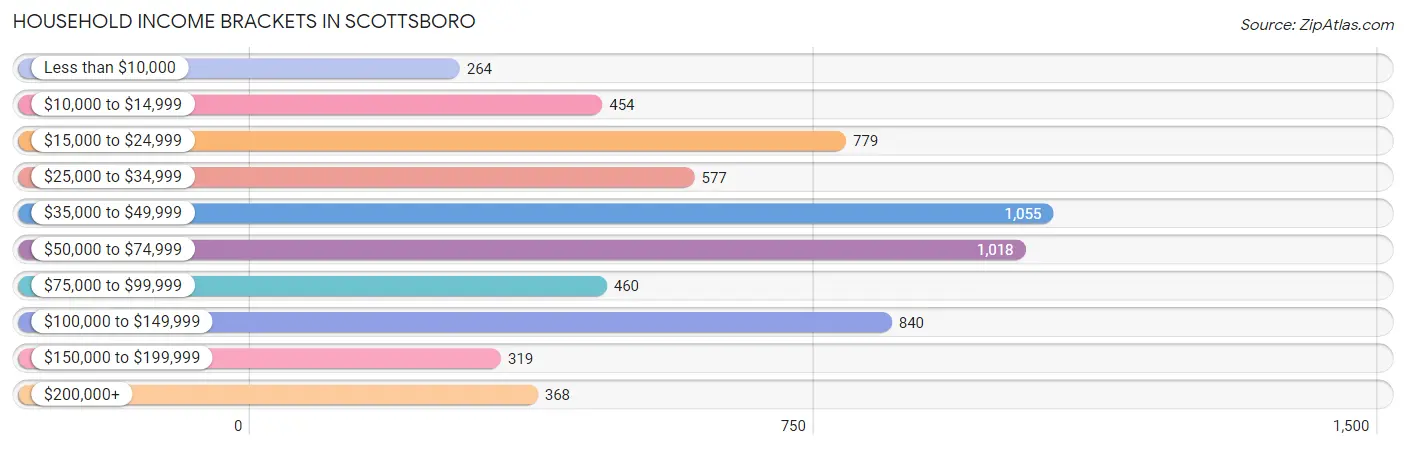
| Income Bracket | # Households | % Households |
| Less than $10,000 | 264 | 4.3% |
| $10,000 to $14,999 | 454 | 7.4% |
| $15,000 to $24,999 | 779 | 12.7% |
| $25,000 to $34,999 | 577 | 9.4% |
| $35,000 to $49,999 | 1,055 | 17.2% |
| $50,000 to $74,999 | 1,018 | 16.6% |
| $75,000 to $99,999 | 460 | 7.5% |
| $100,000 to $149,999 | 840 | 13.7% |
| $150,000 to $199,999 | 319 | 5.2% |
| $200,000+ | 368 | 6.0% |
Household Income by Householder Age in Scottsboro
The median household income in Scottsboro is $49,287, with the highest median household income of $68,464 found in the 45 to 64 years age bracket for the primary householder. A total of 2,172 households (35.4%) fall into this category. Meanwhile, the 15 to 24 years age bracket for the primary householder has the lowest median household income of $0, with 103 households (1.7%) in this group.
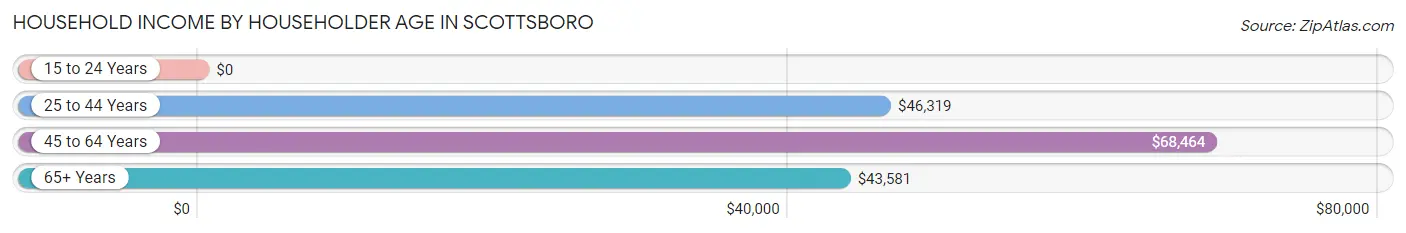
| Income Bracket | # Households | Median Income |
| 15 to 24 Years | 103 (1.7%) | $0 |
| 25 to 44 Years | 1,711 (27.9%) | $46,319 |
| 45 to 64 Years | 2,172 (35.4%) | $68,464 |
| 65+ Years | 2,147 (35.0%) | $43,581 |
| Total | 6,133 (100.0%) | $49,287 |
Poverty in Scottsboro
Income Below Poverty by Sex and Age in Scottsboro
With 18.2% poverty level for males and 20.3% for females among the residents of Scottsboro, under 5 year old males and 6 to 11 year old females are the most vulnerable to poverty, with 160 males (50.0%) and 160 females (40.0%) in their respective age groups living below the poverty level.
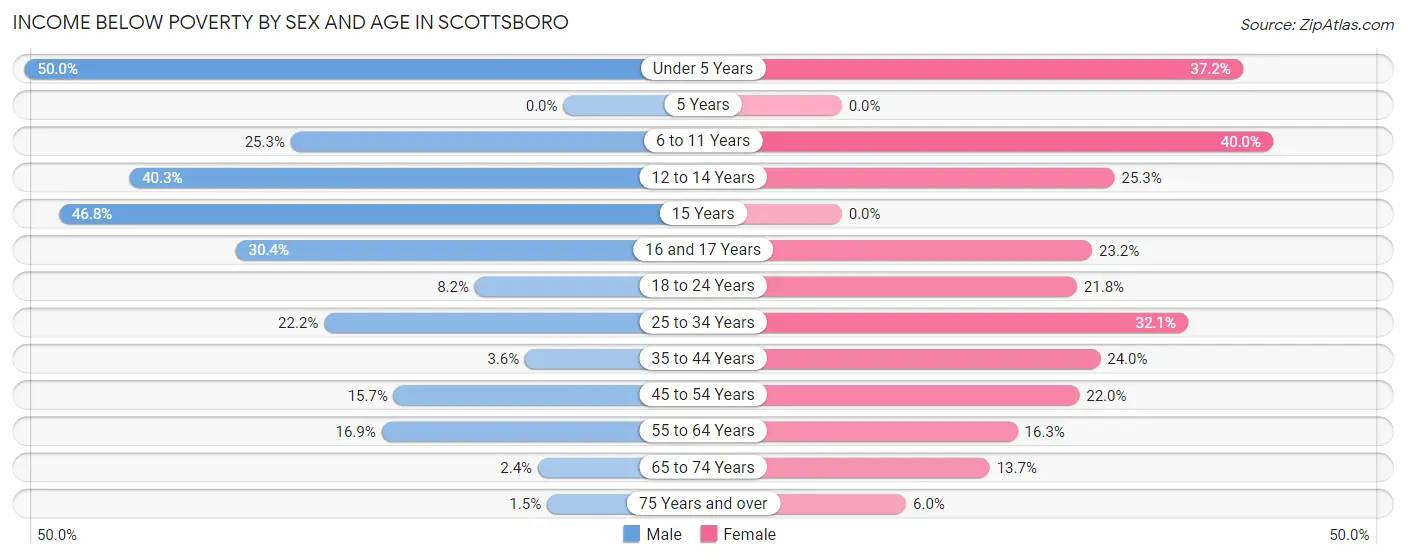
| Age Bracket | Male | Female |
| Under 5 Years | 160 (50.0%) | 122 (37.2%) |
| 5 Years | 0 (0.0%) | 0 (0.0%) |
| 6 to 11 Years | 148 (25.3%) | 160 (40.0%) |
| 12 to 14 Years | 247 (40.3%) | 60 (25.3%) |
| 15 Years | 66 (46.8%) | 0 (0.0%) |
| 16 and 17 Years | 45 (30.4%) | 36 (23.2%) |
| 18 to 24 Years | 43 (8.2%) | 146 (21.8%) |
| 25 to 34 Years | 254 (22.2%) | 246 (32.1%) |
| 35 to 44 Years | 26 (3.5%) | 238 (24.0%) |
| 45 to 54 Years | 170 (15.7%) | 218 (22.0%) |
| 55 to 64 Years | 151 (16.9%) | 147 (16.3%) |
| 65 to 74 Years | 15 (2.4%) | 160 (13.7%) |
| 75 Years and over | 7 (1.5%) | 52 (6.0%) |
| Total | 1,332 (18.2%) | 1,585 (20.3%) |
Income Above Poverty by Sex and Age in Scottsboro
According to the poverty statistics in Scottsboro, males aged 5 years and females aged 5 years are the age groups that are most secure financially, with 100.0% of males and 100.0% of females in these age groups living above the poverty line.
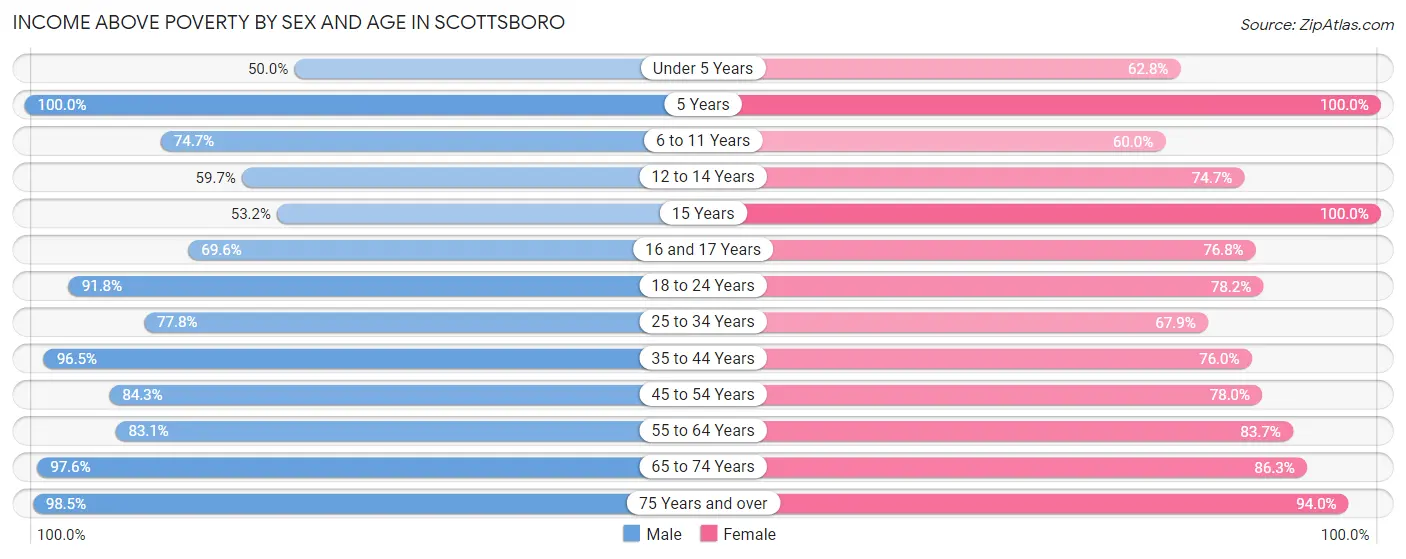
| Age Bracket | Male | Female |
| Under 5 Years | 160 (50.0%) | 206 (62.8%) |
| 5 Years | 27 (100.0%) | 125 (100.0%) |
| 6 to 11 Years | 437 (74.7%) | 240 (60.0%) |
| 12 to 14 Years | 366 (59.7%) | 177 (74.7%) |
| 15 Years | 75 (53.2%) | 189 (100.0%) |
| 16 and 17 Years | 103 (69.6%) | 119 (76.8%) |
| 18 to 24 Years | 480 (91.8%) | 523 (78.2%) |
| 25 to 34 Years | 890 (77.8%) | 520 (67.9%) |
| 35 to 44 Years | 707 (96.5%) | 754 (76.0%) |
| 45 to 54 Years | 910 (84.3%) | 771 (78.0%) |
| 55 to 64 Years | 744 (83.1%) | 754 (83.7%) |
| 65 to 74 Years | 621 (97.6%) | 1,005 (86.3%) |
| 75 Years and over | 454 (98.5%) | 819 (94.0%) |
| Total | 5,974 (81.8%) | 6,202 (79.6%) |
Income Below Poverty Among Married-Couple Families in Scottsboro
The poverty statistics for married-couple families in Scottsboro show that 7.9% or 198 of the total 2,502 families live below the poverty line. Families with 3 or 4 children have the highest poverty rate of 12.8%, comprising of 21 families. On the other hand, families with 1 or 2 children have the lowest poverty rate of 4.6%, which includes 32 families.
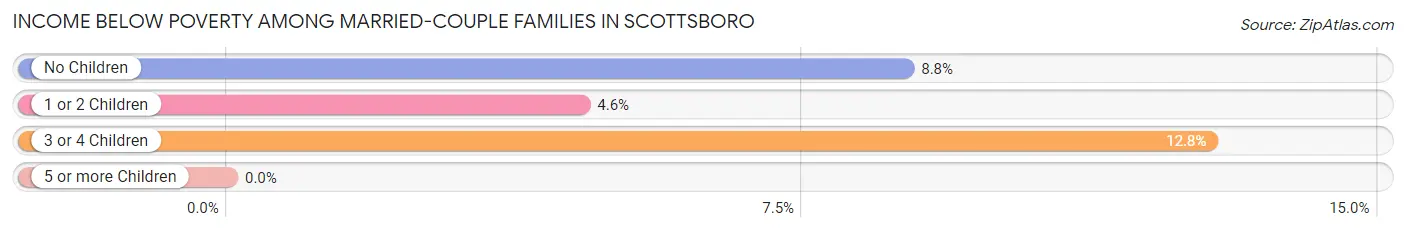
| Children | Above Poverty | Below Poverty |
| No Children | 1,498 (91.2%) | 145 (8.8%) |
| 1 or 2 Children | 663 (95.4%) | 32 (4.6%) |
| 3 or 4 Children | 143 (87.2%) | 21 (12.8%) |
| 5 or more Children | 0 (0.0%) | 0 (0.0%) |
| Total | 2,304 (92.1%) | 198 (7.9%) |
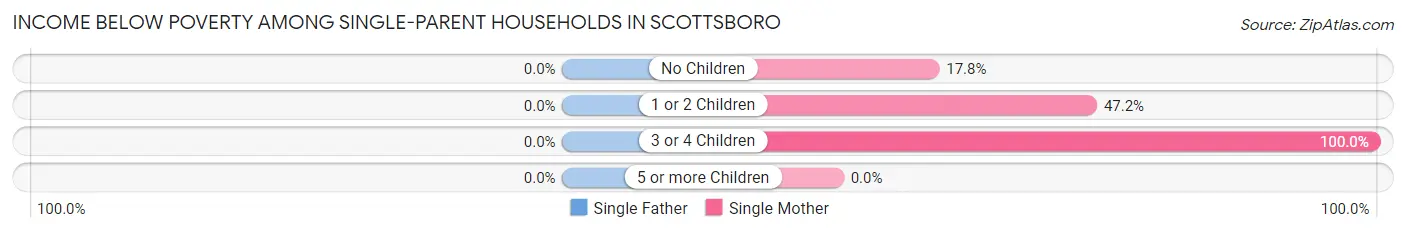
Income Below Poverty Among Single-Parent Households in Scottsboro
| Children | Single Father | Single Mother |
| No Children | 0 (0.0%) | 70 (17.8%) |
| 1 or 2 Children | 0 (0.0%) | 352 (47.2%) |
| 3 or 4 Children | 0 (0.0%) | 109 (100.0%) |
| 5 or more Children | 0 (0.0%) | 0 (0.0%) |
| Total | 0 (0.0%) | 531 (42.5%) |
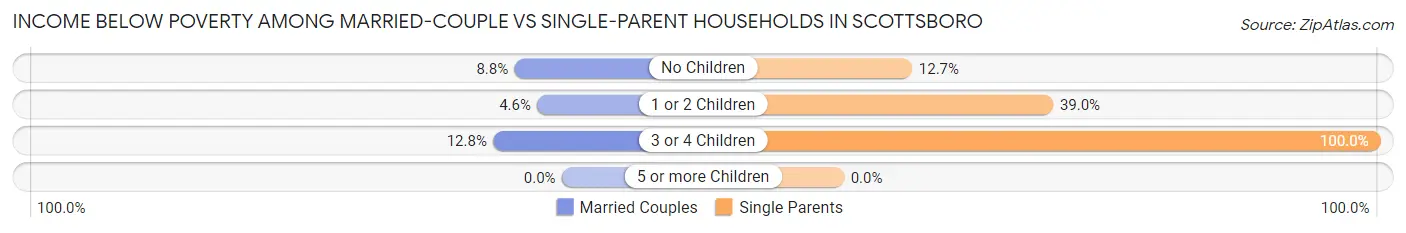
Income Below Poverty Among Married-Couple vs Single-Parent Households in Scottsboro
The poverty data for Scottsboro shows that 198 of the married-couple family households (7.9%) and 531 of the single-parent households (34.0%) are living below the poverty level. Within the married-couple family households, those with 3 or 4 children have the highest poverty rate, with 21 households (12.8%) falling below the poverty line. Among the single-parent households, those with 3 or 4 children have the highest poverty rate, with 109 household (100.0%) living below poverty.
| Children | Married-Couple Families | Single-Parent Households |
| No Children | 145 (8.8%) | 70 (12.7%) |
| 1 or 2 Children | 32 (4.6%) | 352 (39.0%) |
| 3 or 4 Children | 21 (12.8%) | 109 (100.0%) |
| 5 or more Children | 0 (0.0%) | 0 (0.0%) |
| Total | 198 (7.9%) | 531 (34.0%) |
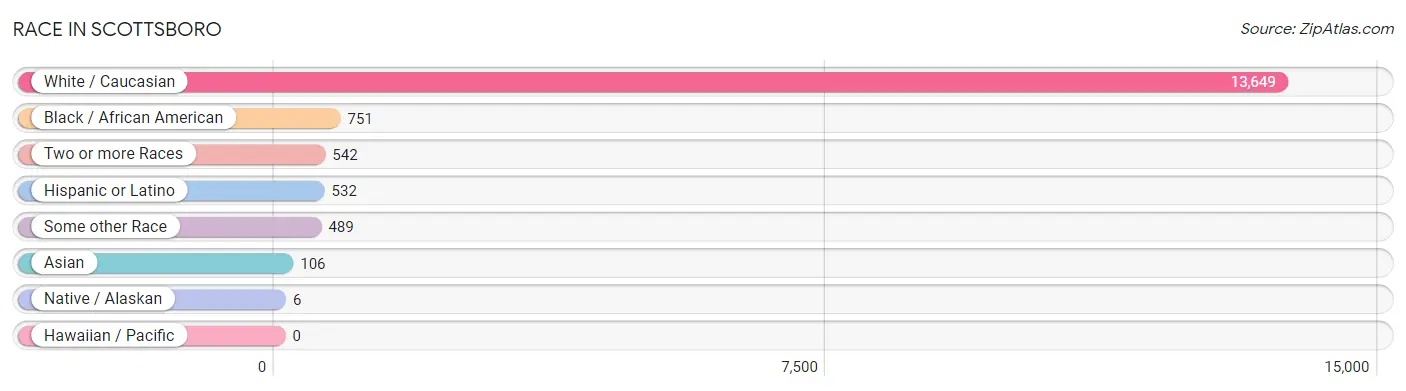
Race in Scottsboro
The most populous races in Scottsboro are White / Caucasian (13,649 | 87.8%), Black / African American (751 | 4.8%), and Two or more Races (542 | 3.5%).
| Race | # Population | % Population |
| Asian | 106 | 0.7% |
| Black / African American | 751 | 4.8% |
| Hawaiian / Pacific | 0 | 0.0% |
| Hispanic or Latino | 532 | 3.4% |
| Native / Alaskan | 6 | 0.0% |
| White / Caucasian | 13,649 | 87.8% |
| Two or more Races | 542 | 3.5% |
| Some other Race | 489 | 3.2% |
| Total | 15,543 | 100.0% |
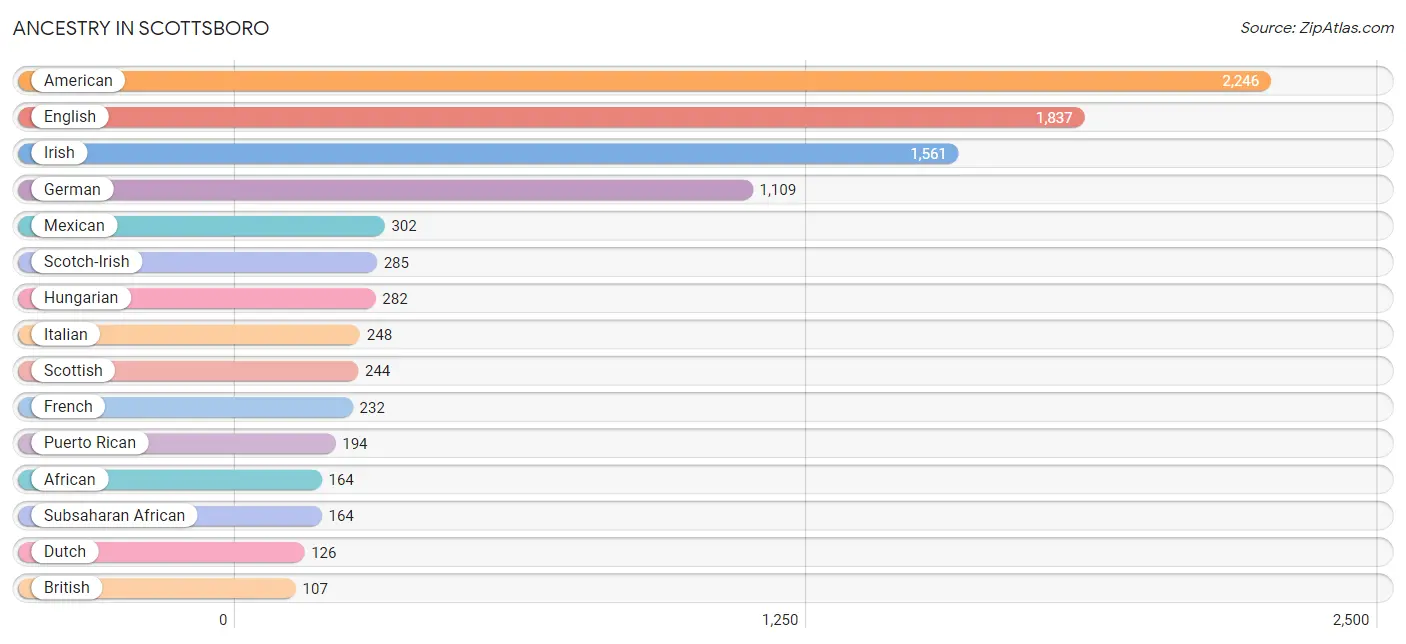
Ancestry in Scottsboro
The most populous ancestries reported in Scottsboro are American (2,246 | 14.4%), English (1,837 | 11.8%), Irish (1,561 | 10.0%), German (1,109 | 7.1%), and Mexican (302 | 1.9%), together accounting for 45.4% of all Scottsboro residents.
| Ancestry | # Population | % Population |
| African | 164 | 1.1% |
| American | 2,246 | 14.4% |
| Austrian | 10 | 0.1% |
| Bhutanese | 18 | 0.1% |
| British | 107 | 0.7% |
| Burmese | 68 | 0.4% |
| Canadian | 9 | 0.1% |
| Central American | 36 | 0.2% |
| Cherokee | 28 | 0.2% |
| Choctaw | 3 | 0.0% |
| Czech | 22 | 0.1% |
| Dutch | 126 | 0.8% |
| Eastern European | 81 | 0.5% |
| English | 1,837 | 11.8% |
| European | 50 | 0.3% |
| Finnish | 22 | 0.1% |
| French | 232 | 1.5% |
| French Canadian | 43 | 0.3% |
| German | 1,109 | 7.1% |
| Greek | 6 | 0.0% |
| Guatemalan | 36 | 0.2% |
| Hungarian | 282 | 1.8% |
| Irish | 1,561 | 10.0% |
| Italian | 248 | 1.6% |
| Jamaican | 19 | 0.1% |
| Korean | 48 | 0.3% |
| Mexican | 302 | 1.9% |
| Norwegian | 19 | 0.1% |
| Pakistani | 40 | 0.3% |
| Puerto Rican | 194 | 1.3% |
| Scotch-Irish | 285 | 1.8% |
| Scottish | 244 | 1.6% |
| Slavic | 8 | 0.1% |
| Slovak | 29 | 0.2% |
| Sri Lankan | 43 | 0.3% |
| Subsaharan African | 164 | 1.1% |
| Swedish | 46 | 0.3% |
| Welsh | 82 | 0.5% | View All 38 Rows |
Immigrants in Scottsboro
The most numerous immigrant groups reported in Scottsboro came from Latin America (202 | 1.3%), Central America (183 | 1.2%), Mexico (134 | 0.9%), Asia (44 | 0.3%), and Guatemala (36 | 0.2%), together accounting for 3.8% of all Scottsboro residents.
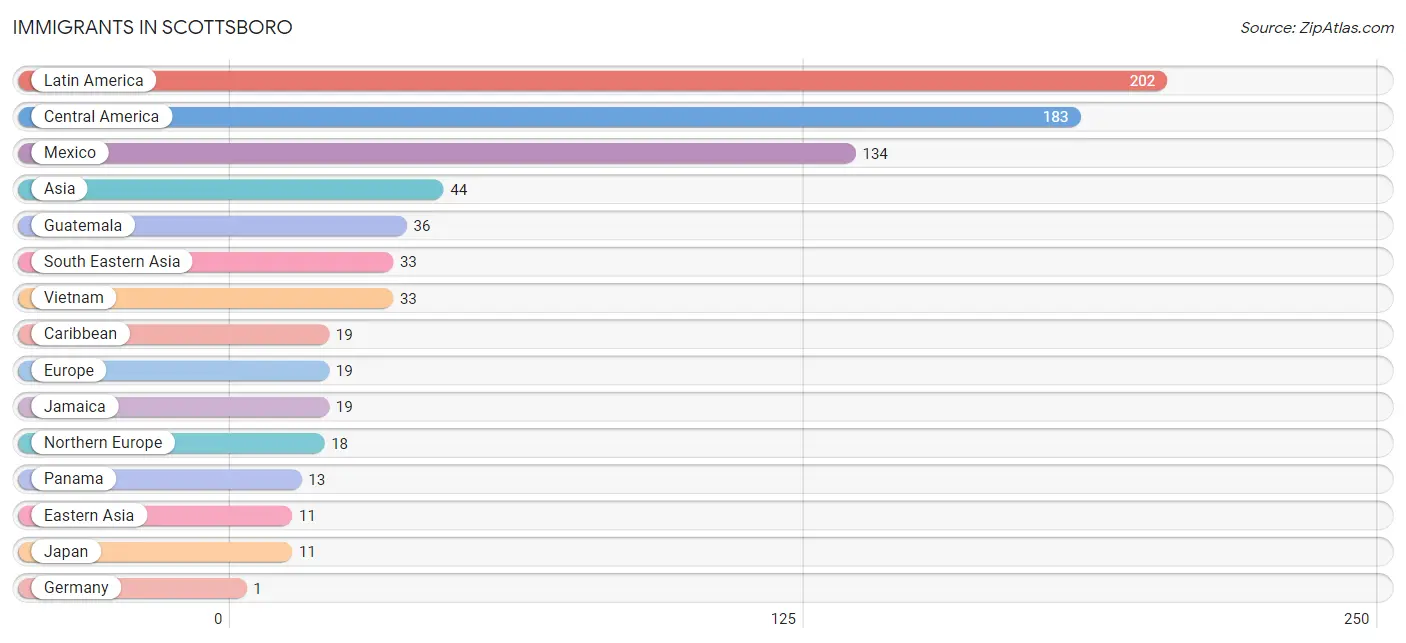
| Immigration Origin | # Population | % Population |
| Asia | 44 | 0.3% |
| Caribbean | 19 | 0.1% |
| Central America | 183 | 1.2% |
| Eastern Asia | 11 | 0.1% |
| Europe | 19 | 0.1% |
| Germany | 1 | 0.0% |
| Guatemala | 36 | 0.2% |
| Jamaica | 19 | 0.1% |
| Japan | 11 | 0.1% |
| Latin America | 202 | 1.3% |
| Mexico | 134 | 0.9% |
| Northern Europe | 18 | 0.1% |
| Panama | 13 | 0.1% |
| South Eastern Asia | 33 | 0.2% |
| Vietnam | 33 | 0.2% |
| Western Europe | 1 | 0.0% | View All 16 Rows |
Sex and Age in Scottsboro
Sex and Age in Scottsboro
The most populous age groups in Scottsboro are 10 to 14 Years (774 | 10.3%) for men and 65 to 69 Years (701 | 8.8%) for women.
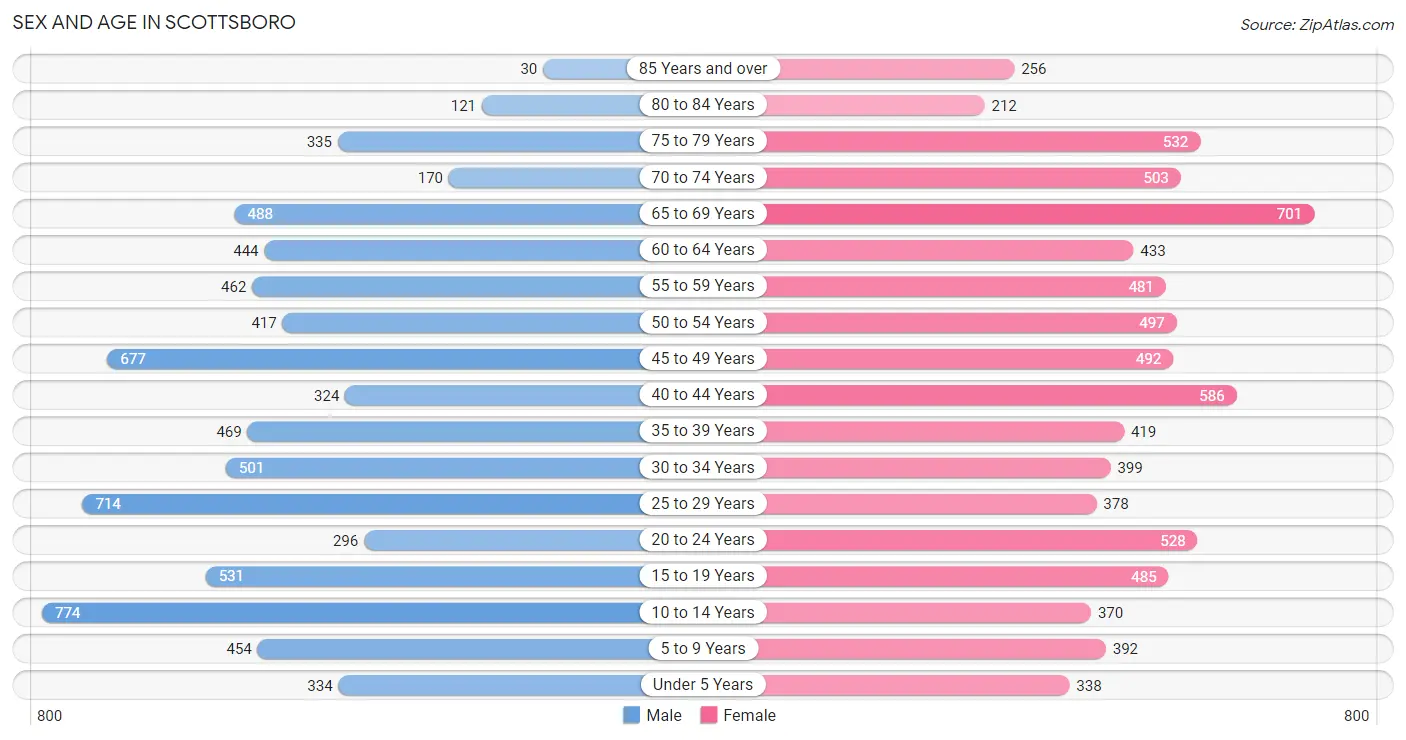
| Age Bracket | Male | Female |
| Under 5 Years | 334 (4.4%) | 338 (4.2%) |
| 5 to 9 Years | 454 (6.0%) | 392 (4.9%) |
| 10 to 14 Years | 774 (10.3%) | 370 (4.6%) |
| 15 to 19 Years | 531 (7.0%) | 485 (6.1%) |
| 20 to 24 Years | 296 (3.9%) | 528 (6.6%) |
| 25 to 29 Years | 714 (9.5%) | 378 (4.7%) |
| 30 to 34 Years | 501 (6.6%) | 399 (5.0%) |
| 35 to 39 Years | 469 (6.2%) | 419 (5.2%) |
| 40 to 44 Years | 324 (4.3%) | 586 (7.3%) |
| 45 to 49 Years | 677 (9.0%) | 492 (6.1%) |
| 50 to 54 Years | 417 (5.5%) | 497 (6.2%) |
| 55 to 59 Years | 462 (6.1%) | 481 (6.0%) |
| 60 to 64 Years | 444 (5.9%) | 433 (5.4%) |
| 65 to 69 Years | 488 (6.5%) | 701 (8.8%) |
| 70 to 74 Years | 170 (2.2%) | 503 (6.3%) |
| 75 to 79 Years | 335 (4.4%) | 532 (6.7%) |
| 80 to 84 Years | 121 (1.6%) | 212 (2.6%) |
| 85 Years and over | 30 (0.4%) | 256 (3.2%) |
| Total | 7,541 (100.0%) | 8,002 (100.0%) |
Families and Households in Scottsboro
Median Family Size in Scottsboro
The median family size in Scottsboro is 3.04 persons per family, with single female/mother families (1,248 | 30.7%) accounting for the largest median family size of 3.1 persons per family. On the other hand, single male/father families (315 | 7.7%) represent the smallest median family size with 2.98 persons per family.
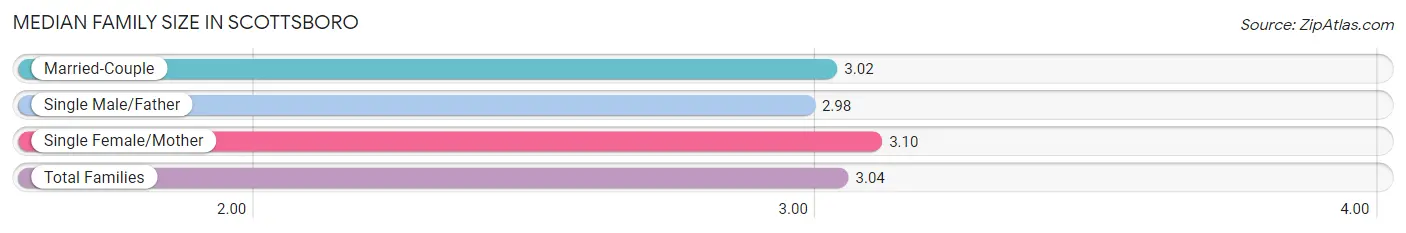
| Family Type | # Families | Family Size |
| Married-Couple | 2,502 (61.6%) | 3.02 |
| Single Male/Father | 315 (7.7%) | 2.98 |
| Single Female/Mother | 1,248 (30.7%) | 3.10 |
| Total Families | 4,065 (100.0%) | 3.04 |
Median Household Size in Scottsboro
The median household size in Scottsboro is 2.46 persons per household, with single female/mother households (1,248 | 20.3%) accounting for the largest median household size of 3.21 persons per household. non-family households (2,068 | 33.7%) represent the smallest median household size with 1.21 persons per household.
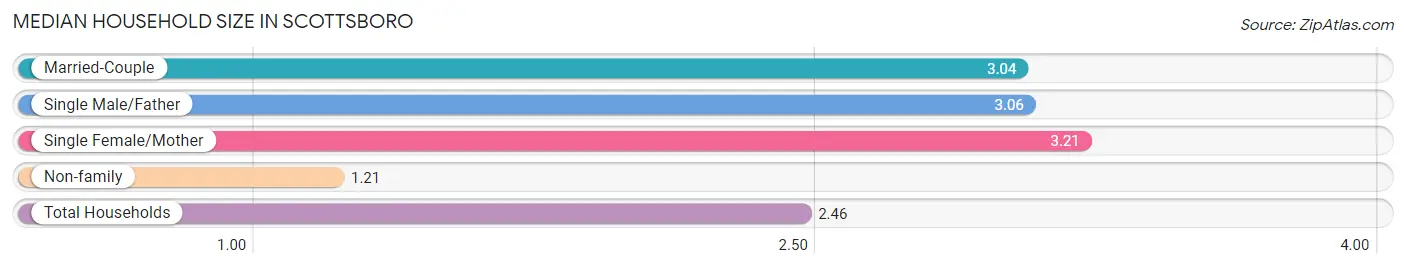
| Household Type | # Households | Household Size |
| Married-Couple | 2,502 (40.8%) | 3.04 |
| Single Male/Father | 315 (5.1%) | 3.06 |
| Single Female/Mother | 1,248 (20.3%) | 3.21 |
| Non-family | 2,068 (33.7%) | 1.21 |
| Total Households | 6,133 (100.0%) | 2.46 |
Household Size by Marriage Status in Scottsboro
Out of a total of 6,133 households in Scottsboro, 4,065 (66.3%) are family households, while 2,068 (33.7%) are nonfamily households. The most numerous type of family households are 2-person households, comprising 2,002, and the most common type of nonfamily households are 1-person households, comprising 1,791.
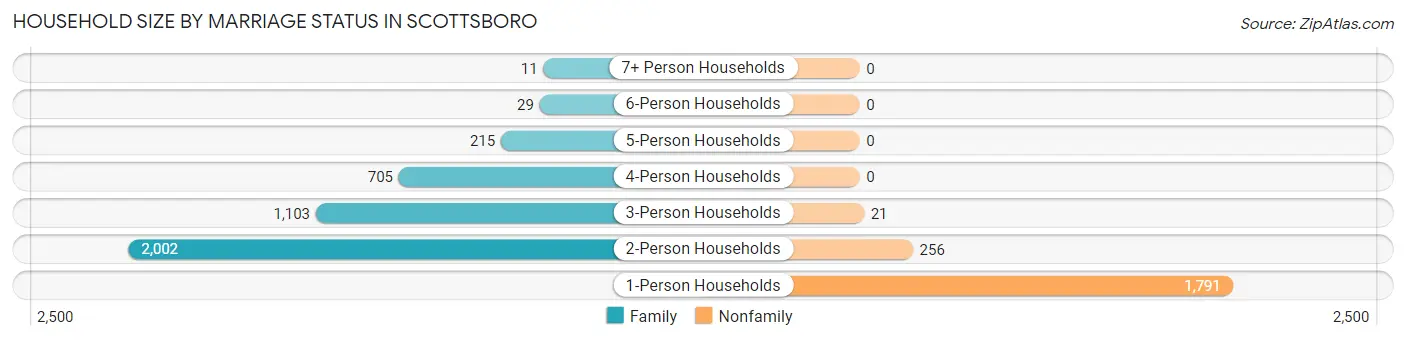
| Household Size | Family Households | Nonfamily Households |
| 1-Person Households | - | 1,791 (29.2%) |
| 2-Person Households | 2,002 (32.6%) | 256 (4.2%) |
| 3-Person Households | 1,103 (18.0%) | 21 (0.3%) |
| 4-Person Households | 705 (11.5%) | 0 (0.0%) |
| 5-Person Households | 215 (3.5%) | 0 (0.0%) |
| 6-Person Households | 29 (0.5%) | 0 (0.0%) |
| 7+ Person Households | 11 (0.2%) | 0 (0.0%) |
| Total | 4,065 (66.3%) | 2,068 (33.7%) |
Female Fertility in Scottsboro
Fertility by Age in Scottsboro
Average fertility rate in Scottsboro is 32.0 births per 1,000 women. Women in the age bracket of 20 to 34 years have the highest fertility rate with 63.0 births per 1,000 women. Women in the age bracket of 20 to 34 years acount for 74.6% of all women with births.
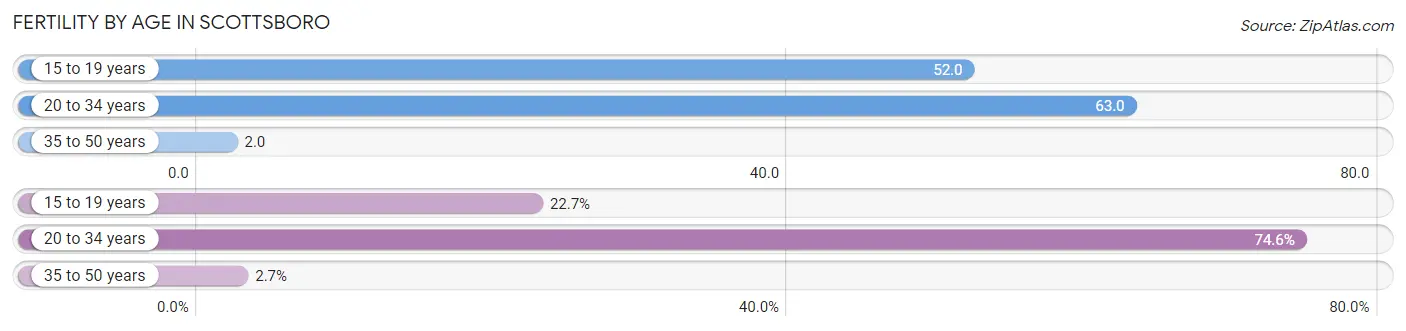
| Age Bracket | Women with Births | Births / 1,000 Women |
| 15 to 19 years | 25 (22.7%) | 52.0 |
| 20 to 34 years | 82 (74.6%) | 63.0 |
| 35 to 50 years | 3 (2.7%) | 2.0 |
| Total | 110 (100.0%) | 32.0 |
Fertility by Age by Marriage Status in Scottsboro
53.6% of women with births (110) in Scottsboro are married. The highest percentage of unmarried women with births falls into 15 to 19 years age bracket with 100.0% of them unmarried at the time of birth, while the lowest percentage of unmarried women with births belong to 20 to 34 years age bracket with 28.0% of them unmarried.
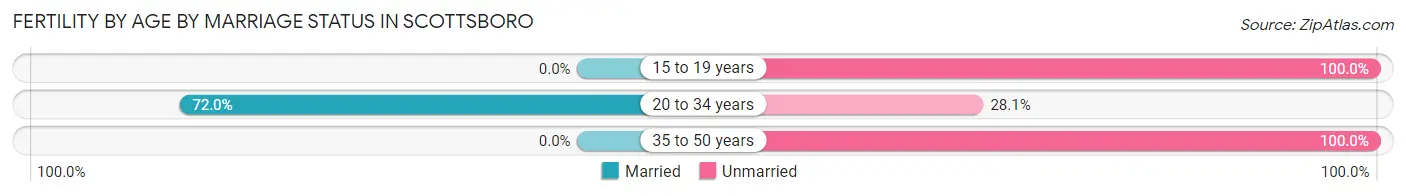
| Age Bracket | Married | Unmarried |
| 15 to 19 years | 0 (0.0%) | 25 (100.0%) |
| 20 to 34 years | 59 (72.0%) | 23 (28.1%) |
| 35 to 50 years | 0 (0.0%) | 3 (100.0%) |
| Total | 59 (53.6%) | 51 (46.4%) |
Fertility by Education in Scottsboro
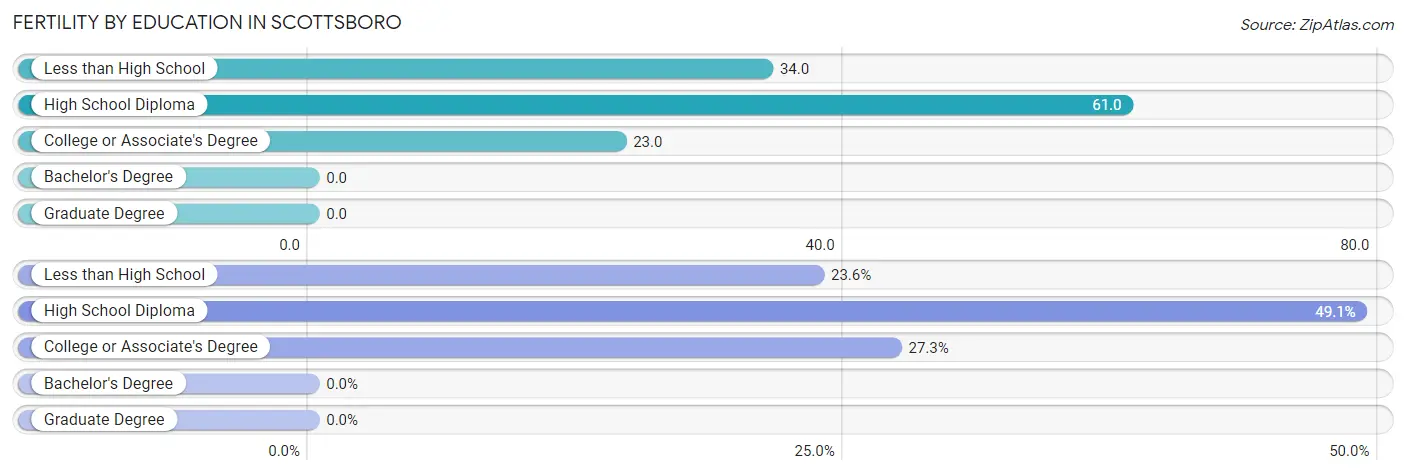
| Educational Attainment | Women with Births | Births / 1,000 Women |
| Less than High School | 26 (23.6%) | 34.0 |
| High School Diploma | 54 (49.1%) | 61.0 |
| College or Associate's Degree | 30 (27.3%) | 23.0 |
| Bachelor's Degree | 0 (0.0%) | 0.0 |
| Graduate Degree | 0 (0.0%) | 0.0 |
| Total | 110 (100.0%) | 32.0 |
Fertility by Education by Marriage Status in Scottsboro
46.4% of women with births in Scottsboro are unmarried. Women with the educational attainment of college or associate's degree are most likely to be married with 90.0% of them married at childbirth, while women with the educational attainment of less than high school are least likely to be married with 96.2% of them unmarried at childbirth.
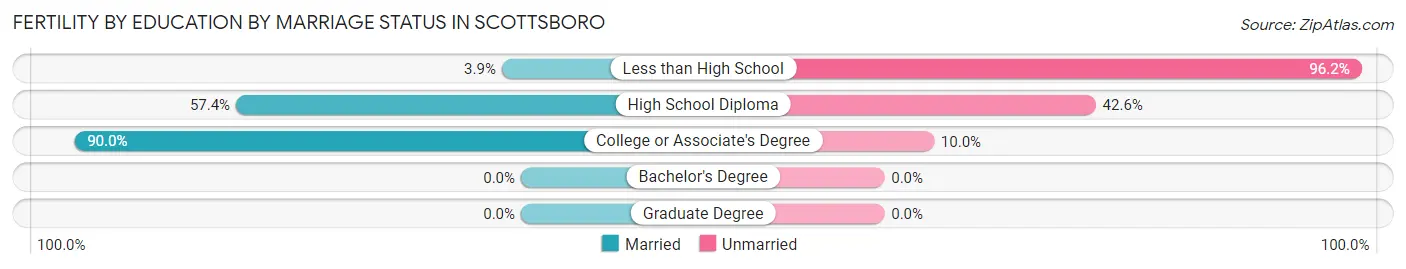
| Educational Attainment | Married | Unmarried |
| Less than High School | 1 (3.8%) | 25 (96.2%) |
| High School Diploma | 31 (57.4%) | 23 (42.6%) |
| College or Associate's Degree | 27 (90.0%) | 3 (10.0%) |
| Bachelor's Degree | 0 (0.0%) | 0 (0.0%) |
| Graduate Degree | 0 (0.0%) | 0 (0.0%) |
| Total | 59 (53.6%) | 51 (46.4%) |
Employment Characteristics in Scottsboro
Employment by Class of Employer in Scottsboro
Among the 6,161 employed individuals in Scottsboro, private company employees (4,096 | 66.5%), local government employees (665 | 10.8%), and not-for-profit organizations (456 | 7.4%) make up the most common classes of employment.
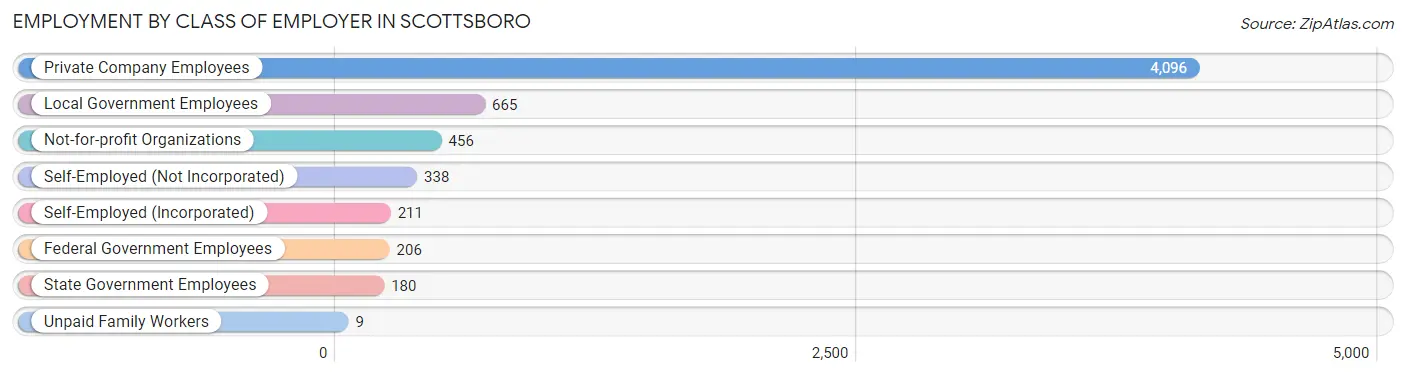
| Employer Class | # Employees | % Employees |
| Private Company Employees | 4,096 | 66.5% |
| Self-Employed (Incorporated) | 211 | 3.4% |
| Self-Employed (Not Incorporated) | 338 | 5.5% |
| Not-for-profit Organizations | 456 | 7.4% |
| Local Government Employees | 665 | 10.8% |
| State Government Employees | 180 | 2.9% |
| Federal Government Employees | 206 | 3.3% |
| Unpaid Family Workers | 9 | 0.2% |
| Total | 6,161 | 100.0% |
Employment Status by Age in Scottsboro
According to the labor force statistics for Scottsboro, out of the total population over 16 years of age (12,551), 51.9% or 6,514 individuals are in the labor force, with 3.8% or 248 of them unemployed. The age group with the highest labor force participation rate is 30 to 34 years, with 74.9% or 674 individuals in the labor force. Within the labor force, the 20 to 24 years age range has the highest percentage of unemployed individuals, with 10.7% or 36 of them being unemployed.
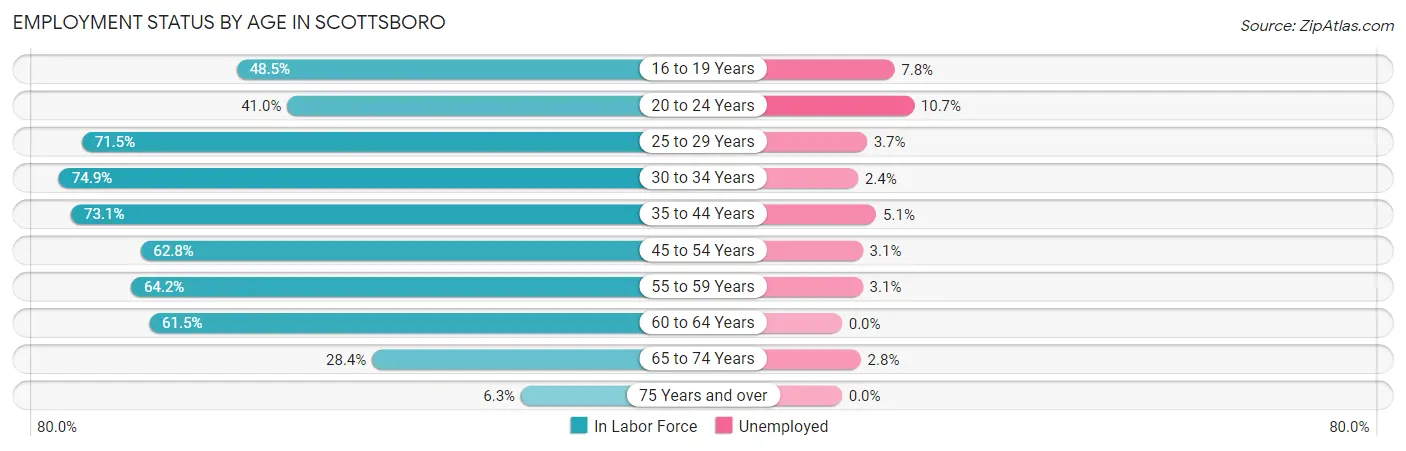
| Age Bracket | In Labor Force | Unemployed |
| 16 to 19 Years | 333 (48.5%) | 26 (7.8%) |
| 20 to 24 Years | 338 (41.0%) | 36 (10.7%) |
| 25 to 29 Years | 781 (71.5%) | 29 (3.7%) |
| 30 to 34 Years | 674 (74.9%) | 16 (2.4%) |
| 35 to 44 Years | 1,314 (73.1%) | 67 (5.1%) |
| 45 to 54 Years | 1,308 (62.8%) | 41 (3.1%) |
| 55 to 59 Years | 605 (64.2%) | 19 (3.1%) |
| 60 to 64 Years | 539 (61.5%) | 0 (0.0%) |
| 65 to 74 Years | 529 (28.4%) | 15 (2.8%) |
| 75 Years and over | 94 (6.3%) | 0 (0.0%) |
| Total | 6,514 (51.9%) | 248 (3.8%) |
Employment Status by Educational Attainment in Scottsboro
According to labor force statistics for Scottsboro, 67.9% of individuals (5,224) out of the total population between 25 and 64 years of age (7,693) are in the labor force, with 3.3% or 172 of them being unemployed. The group with the highest labor force participation rate are those with the educational attainment of bachelor's degree or higher, with 81.9% or 1,536 individuals in the labor force. Within the labor force, individuals with college / associate degree education have the highest percentage of unemployment, with 4.4% or 82 of them being unemployed.
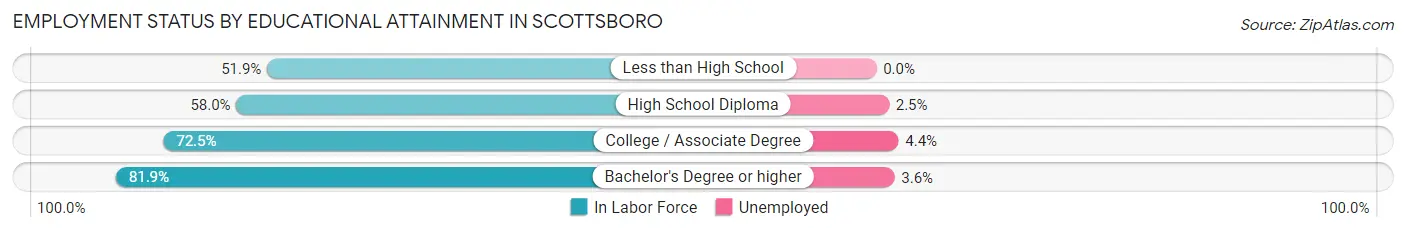
| Educational Attainment | In Labor Force | Unemployed |
| Less than High School | 513 (51.9%) | 0 (0.0%) |
| High School Diploma | 1,310 (58.0%) | 56 (2.5%) |
| College / Associate Degree | 1,863 (72.5%) | 113 (4.4%) |
| Bachelor's Degree or higher | 1,536 (81.9%) | 68 (3.6%) |
| Total | 5,224 (67.9%) | 254 (3.3%) |
Employment Occupations by Sex in Scottsboro
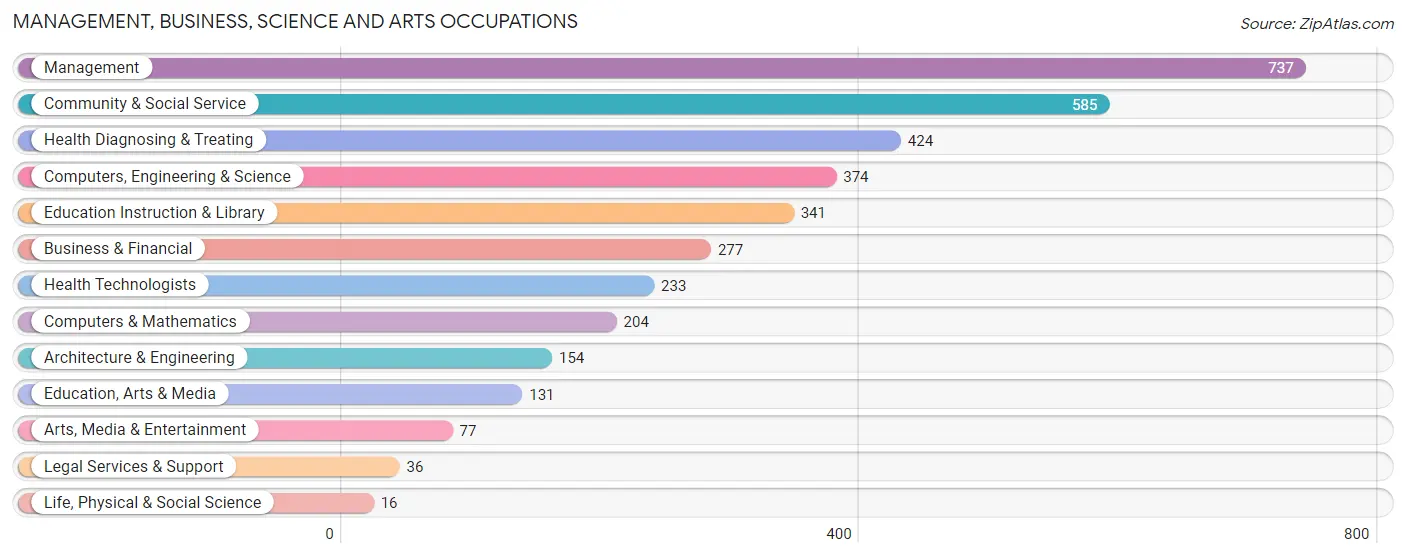
Management, Business, Science and Arts Occupations
The most common Management, Business, Science and Arts occupations in Scottsboro are Management (737 | 11.8%), Community & Social Service (585 | 9.3%), Health Diagnosing & Treating (424 | 6.8%), Computers, Engineering & Science (374 | 6.0%), and Education Instruction & Library (341 | 5.4%).
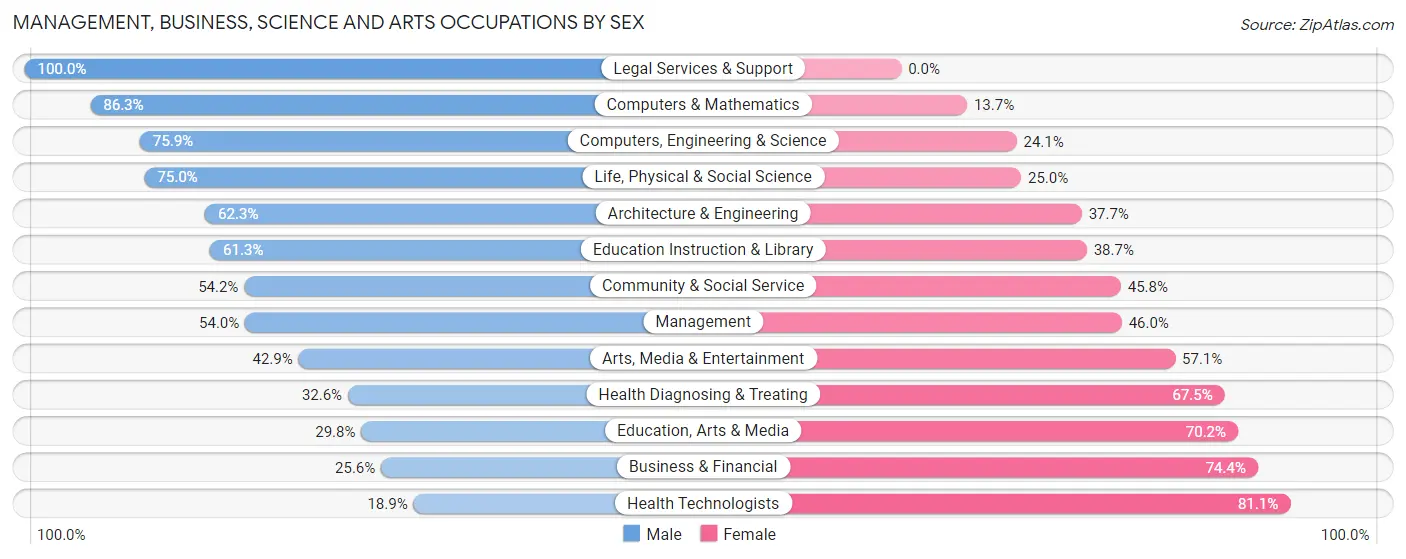
Management, Business, Science and Arts Occupations by Sex
Within the Management, Business, Science and Arts occupations in Scottsboro, the most male-oriented occupations are Legal Services & Support (100.0%), Computers & Mathematics (86.3%), and Computers, Engineering & Science (75.9%), while the most female-oriented occupations are Health Technologists (81.1%), Business & Financial (74.4%), and Education, Arts & Media (70.2%).
| Occupation | Male | Female |
| Management | 398 (54.0%) | 339 (46.0%) |
| Business & Financial | 71 (25.6%) | 206 (74.4%) |
| Computers, Engineering & Science | 284 (75.9%) | 90 (24.1%) |
| Computers & Mathematics | 176 (86.3%) | 28 (13.7%) |
| Architecture & Engineering | 96 (62.3%) | 58 (37.7%) |
| Life, Physical & Social Science | 12 (75.0%) | 4 (25.0%) |
| Community & Social Service | 317 (54.2%) | 268 (45.8%) |
| Education, Arts & Media | 39 (29.8%) | 92 (70.2%) |
| Legal Services & Support | 36 (100.0%) | 0 (0.0%) |
| Education Instruction & Library | 209 (61.3%) | 132 (38.7%) |
| Arts, Media & Entertainment | 33 (42.9%) | 44 (57.1%) |
| Health Diagnosing & Treating | 138 (32.6%) | 286 (67.4%) |
| Health Technologists | 44 (18.9%) | 189 (81.1%) |
| Total (Category) | 1,208 (50.4%) | 1,189 (49.6%) |
| Total (Overall) | 3,315 (52.9%) | 2,953 (47.1%) |
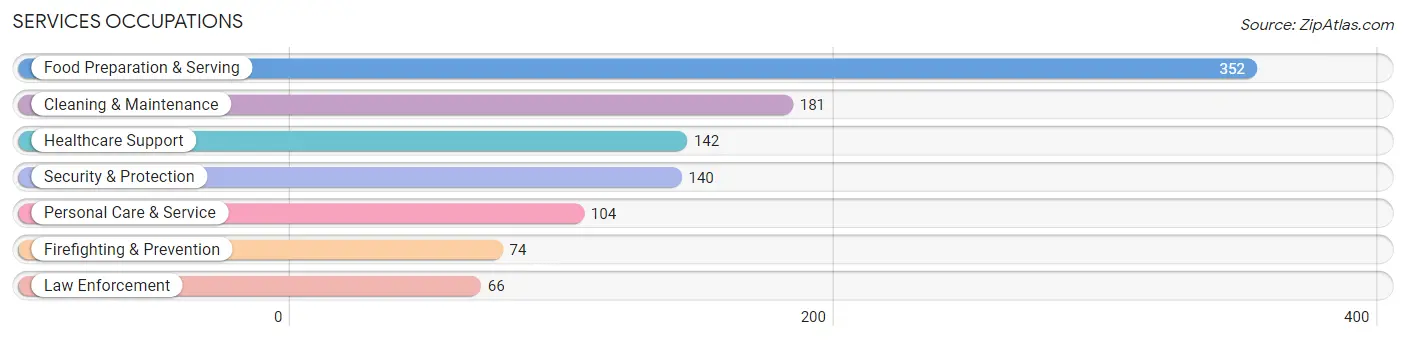
Services Occupations
The most common Services occupations in Scottsboro are Food Preparation & Serving (352 | 5.6%), Cleaning & Maintenance (181 | 2.9%), Healthcare Support (142 | 2.3%), Security & Protection (140 | 2.2%), and Personal Care & Service (104 | 1.7%).
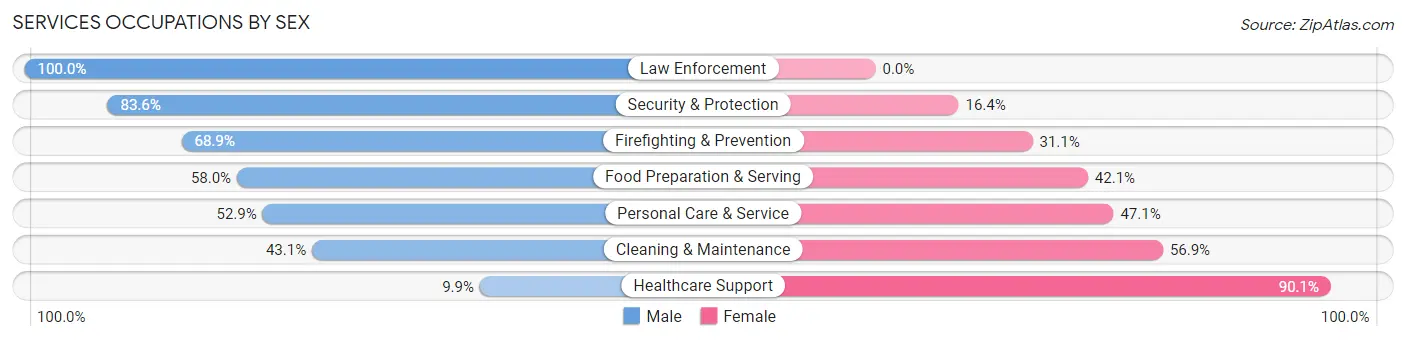
Services Occupations by Sex
Within the Services occupations in Scottsboro, the most male-oriented occupations are Law Enforcement (100.0%), Security & Protection (83.6%), and Firefighting & Prevention (68.9%), while the most female-oriented occupations are Healthcare Support (90.1%), Cleaning & Maintenance (56.9%), and Personal Care & Service (47.1%).
| Occupation | Male | Female |
| Healthcare Support | 14 (9.9%) | 128 (90.1%) |
| Security & Protection | 117 (83.6%) | 23 (16.4%) |
| Firefighting & Prevention | 51 (68.9%) | 23 (31.1%) |
| Law Enforcement | 66 (100.0%) | 0 (0.0%) |
| Food Preparation & Serving | 204 (58.0%) | 148 (42.0%) |
| Cleaning & Maintenance | 78 (43.1%) | 103 (56.9%) |
| Personal Care & Service | 55 (52.9%) | 49 (47.1%) |
| Total (Category) | 468 (50.9%) | 451 (49.1%) |
| Total (Overall) | 3,315 (52.9%) | 2,953 (47.1%) |
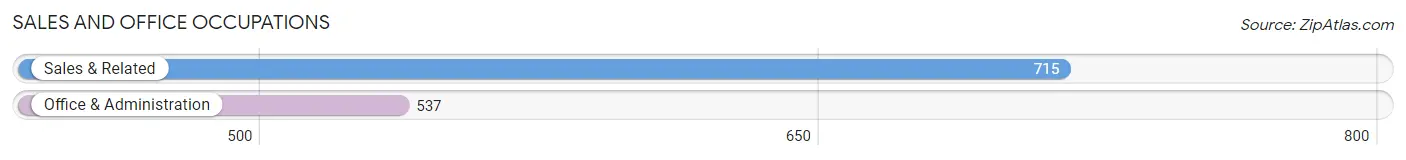
Sales and Office Occupations
The most common Sales and Office occupations in Scottsboro are Sales & Related (715 | 11.4%), and Office & Administration (537 | 8.6%).
Sales and Office Occupations by Sex
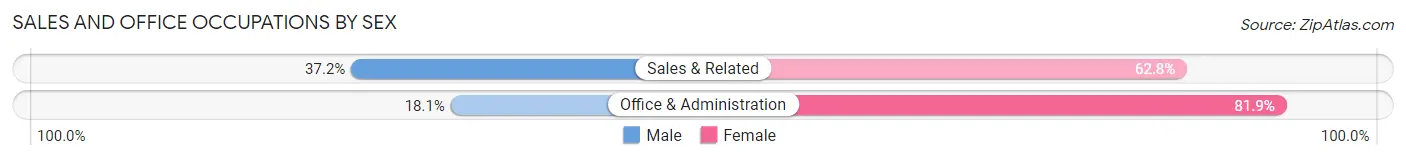
| Occupation | Male | Female |
| Sales & Related | 266 (37.2%) | 449 (62.8%) |
| Office & Administration | 97 (18.1%) | 440 (81.9%) |
| Total (Category) | 363 (29.0%) | 889 (71.0%) |
| Total (Overall) | 3,315 (52.9%) | 2,953 (47.1%) |
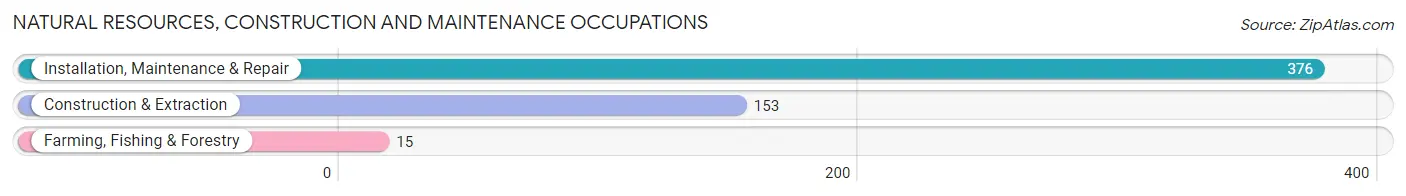
Natural Resources, Construction and Maintenance Occupations
The most common Natural Resources, Construction and Maintenance occupations in Scottsboro are Installation, Maintenance & Repair (376 | 6.0%), Construction & Extraction (153 | 2.4%), and Farming, Fishing & Forestry (15 | 0.2%).
Natural Resources, Construction and Maintenance Occupations by Sex
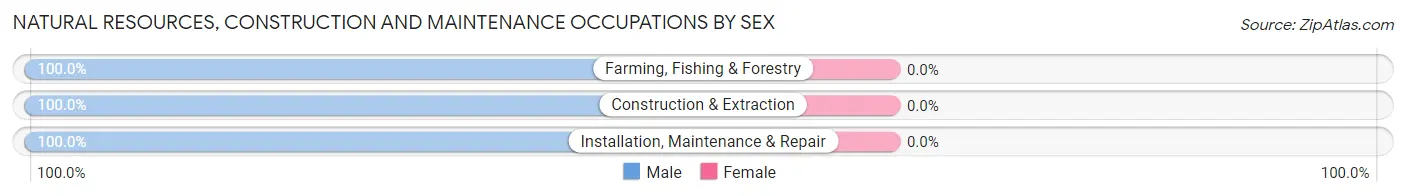
| Occupation | Male | Female |
| Farming, Fishing & Forestry | 15 (100.0%) | 0 (0.0%) |
| Construction & Extraction | 153 (100.0%) | 0 (0.0%) |
| Installation, Maintenance & Repair | 376 (100.0%) | 0 (0.0%) |
| Total (Category) | 544 (100.0%) | 0 (0.0%) |
| Total (Overall) | 3,315 (52.9%) | 2,953 (47.1%) |
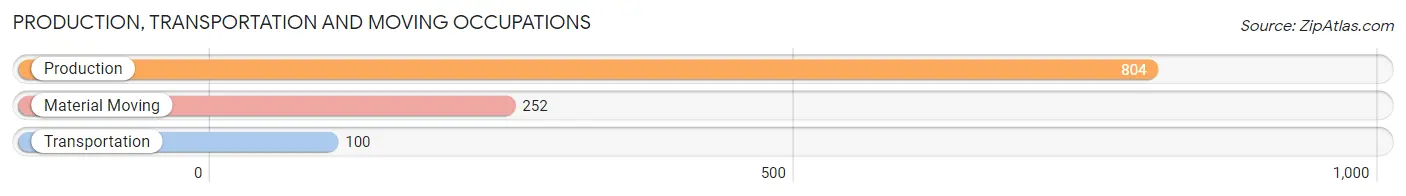
Production, Transportation and Moving Occupations
The most common Production, Transportation and Moving occupations in Scottsboro are Production (804 | 12.8%), Material Moving (252 | 4.0%), and Transportation (100 | 1.6%).
Production, Transportation and Moving Occupations by Sex
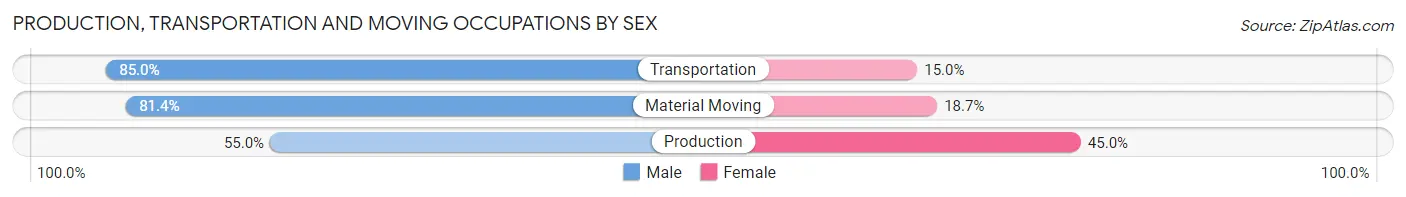
| Occupation | Male | Female |
| Production | 442 (55.0%) | 362 (45.0%) |
| Transportation | 85 (85.0%) | 15 (15.0%) |
| Material Moving | 205 (81.4%) | 47 (18.6%) |
| Total (Category) | 732 (63.3%) | 424 (36.7%) |
| Total (Overall) | 3,315 (52.9%) | 2,953 (47.1%) |
Employment Industries by Sex in Scottsboro
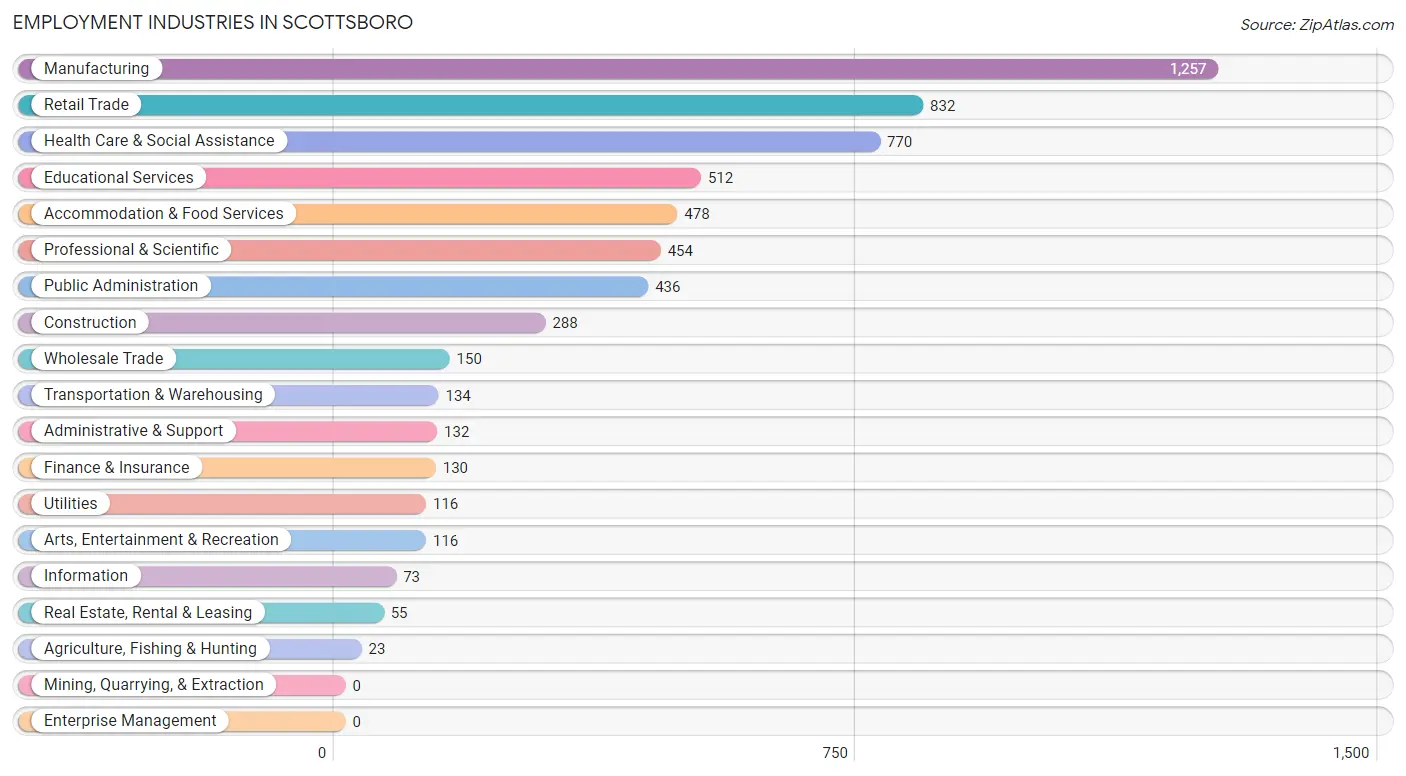
Employment Industries in Scottsboro
The major employment industries in Scottsboro include Manufacturing (1,257 | 20.1%), Retail Trade (832 | 13.3%), Health Care & Social Assistance (770 | 12.3%), Educational Services (512 | 8.2%), and Accommodation & Food Services (478 | 7.6%).
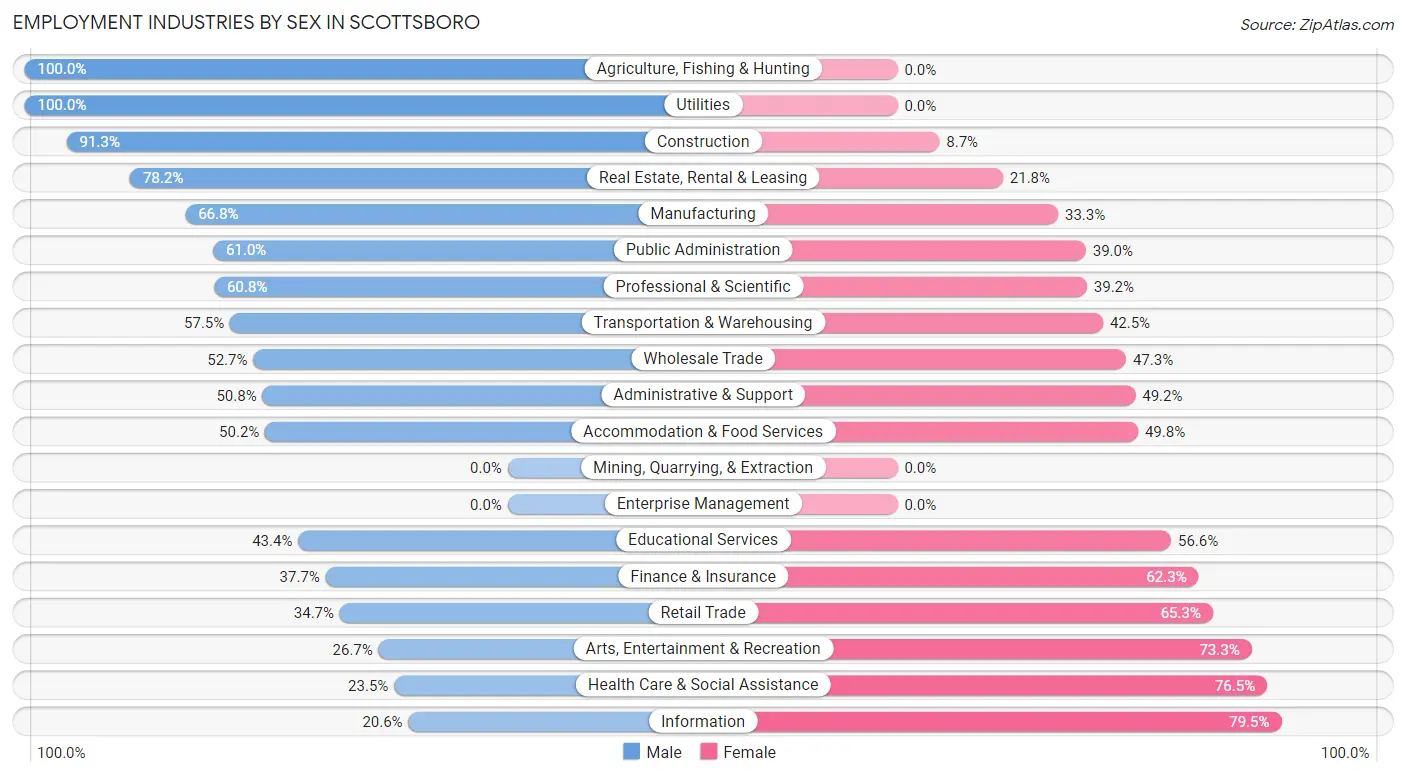
Employment Industries by Sex in Scottsboro
The Scottsboro industries that see more men than women are Agriculture, Fishing & Hunting (100.0%), Utilities (100.0%), and Construction (91.3%), whereas the industries that tend to have a higher number of women are Information (79.4%), Health Care & Social Assistance (76.5%), and Arts, Entertainment & Recreation (73.3%).
| Industry | Male | Female |
| Agriculture, Fishing & Hunting | 23 (100.0%) | 0 (0.0%) |
| Mining, Quarrying, & Extraction | 0 (0.0%) | 0 (0.0%) |
| Construction | 263 (91.3%) | 25 (8.7%) |
| Manufacturing | 839 (66.7%) | 418 (33.3%) |
| Wholesale Trade | 79 (52.7%) | 71 (47.3%) |
| Retail Trade | 289 (34.7%) | 543 (65.3%) |
| Transportation & Warehousing | 77 (57.5%) | 57 (42.5%) |
| Utilities | 116 (100.0%) | 0 (0.0%) |
| Information | 15 (20.5%) | 58 (79.4%) |
| Finance & Insurance | 49 (37.7%) | 81 (62.3%) |
| Real Estate, Rental & Leasing | 43 (78.2%) | 12 (21.8%) |
| Professional & Scientific | 276 (60.8%) | 178 (39.2%) |
| Enterprise Management | 0 (0.0%) | 0 (0.0%) |
| Administrative & Support | 67 (50.8%) | 65 (49.2%) |
| Educational Services | 222 (43.4%) | 290 (56.6%) |
| Health Care & Social Assistance | 181 (23.5%) | 589 (76.5%) |
| Arts, Entertainment & Recreation | 31 (26.7%) | 85 (73.3%) |
| Accommodation & Food Services | 240 (50.2%) | 238 (49.8%) |
| Public Administration | 266 (61.0%) | 170 (39.0%) |
| Total | 3,315 (52.9%) | 2,953 (47.1%) |
Education in Scottsboro
School Enrollment in Scottsboro
The most common levels of schooling among the 3,343 students in Scottsboro are high school (828 | 24.8%), middle school (807 | 24.1%), and college / undergraduate (699 | 20.9%).
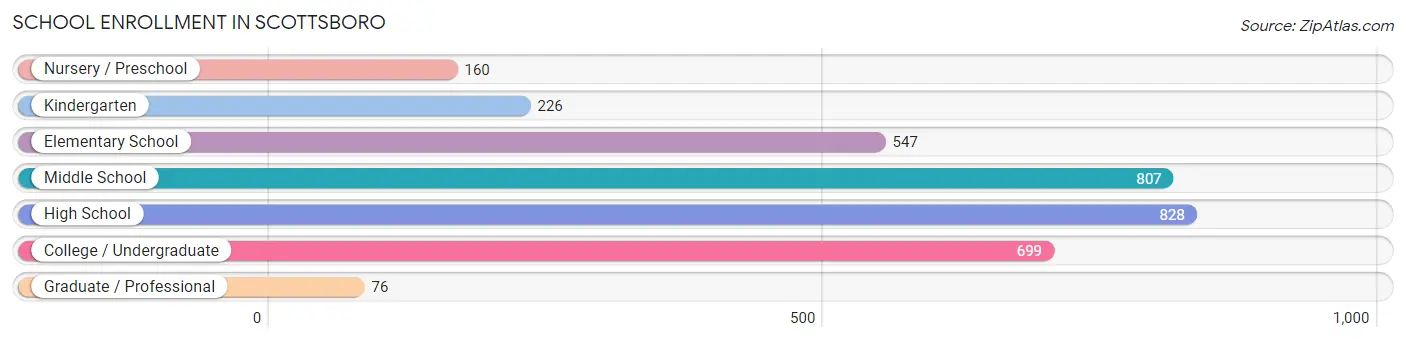
| School Level | # Students | % Students |
| Nursery / Preschool | 160 | 4.8% |
| Kindergarten | 226 | 6.8% |
| Elementary School | 547 | 16.4% |
| Middle School | 807 | 24.1% |
| High School | 828 | 24.8% |
| College / Undergraduate | 699 | 20.9% |
| Graduate / Professional | 76 | 2.3% |
| Total | 3,343 | 100.0% |
School Enrollment by Age by Funding Source in Scottsboro
Out of a total of 3,343 students who are enrolled in schools in Scottsboro, 314 (9.4%) attend a private institution, while the remaining 3,029 (90.6%) are enrolled in public schools. The age group of 3 to 4 year olds has the highest likelihood of being enrolled in private schools, with 40 (47.1% in the age bracket) enrolled. Conversely, the age group of 18 to 19 year olds has the lowest likelihood of being enrolled in a private school, with 178 (100.0% in the age bracket) attending a public institution.
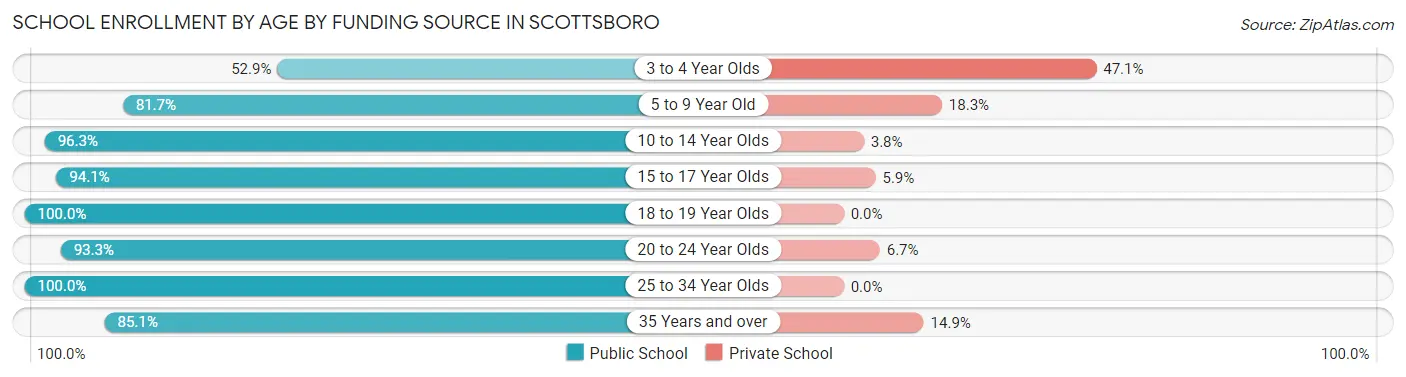
| Age Bracket | Public School | Private School |
| 3 to 4 Year Olds | 45 (52.9%) | 40 (47.1%) |
| 5 to 9 Year Old | 607 (81.7%) | 136 (18.3%) |
| 10 to 14 Year Olds | 976 (96.3%) | 38 (3.7%) |
| 15 to 17 Year Olds | 539 (94.1%) | 34 (5.9%) |
| 18 to 19 Year Olds | 178 (100.0%) | 0 (0.0%) |
| 20 to 24 Year Olds | 291 (93.3%) | 21 (6.7%) |
| 25 to 34 Year Olds | 136 (100.0%) | 0 (0.0%) |
| 35 Years and over | 257 (85.1%) | 45 (14.9%) |
| Total | 3,029 (90.6%) | 314 (9.4%) |
Educational Attainment by Field of Study in Scottsboro
Business (714 | 25.4%), education (714 | 25.4%), science & technology (301 | 10.7%), bio, nature & agricultural (187 | 6.7%), and engineering (171 | 6.1%) are the most common fields of study among 2,810 individuals in Scottsboro who have obtained a bachelor's degree or higher.
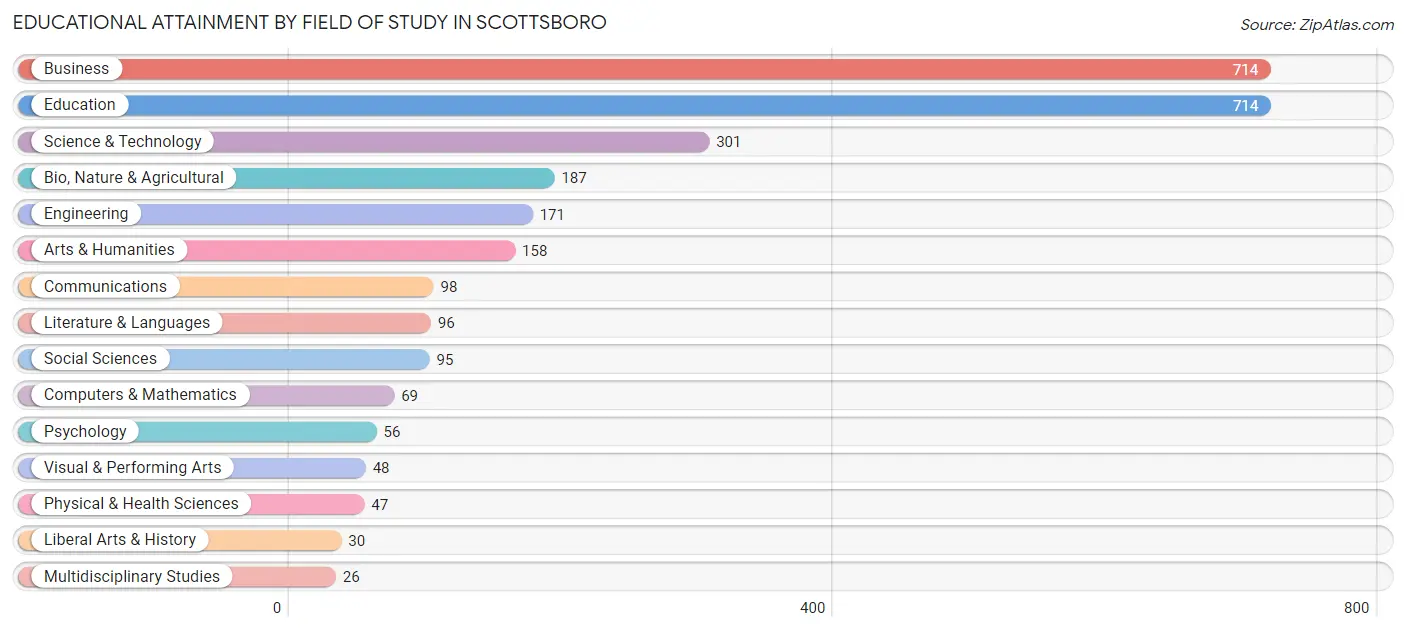
| Field of Study | # Graduates | % Graduates |
| Computers & Mathematics | 69 | 2.5% |
| Bio, Nature & Agricultural | 187 | 6.7% |
| Physical & Health Sciences | 47 | 1.7% |
| Psychology | 56 | 2.0% |
| Social Sciences | 95 | 3.4% |
| Engineering | 171 | 6.1% |
| Multidisciplinary Studies | 26 | 0.9% |
| Science & Technology | 301 | 10.7% |
| Business | 714 | 25.4% |
| Education | 714 | 25.4% |
| Literature & Languages | 96 | 3.4% |
| Liberal Arts & History | 30 | 1.1% |
| Visual & Performing Arts | 48 | 1.7% |
| Communications | 98 | 3.5% |
| Arts & Humanities | 158 | 5.6% |
| Total | 2,810 | 100.0% |
Transportation & Commute in Scottsboro
Vehicle Availability by Sex in Scottsboro
The most prevalent vehicle ownership categories in Scottsboro are males with 2 vehicles (1,454, accounting for 44.1%) and females with 2 vehicles (1,400, making up 50.8%).
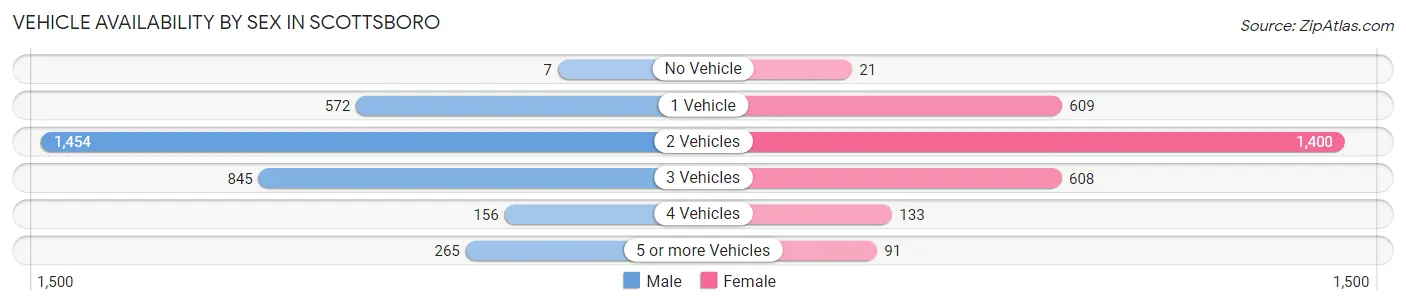
| Vehicles Available | Male | Female |
| No Vehicle | 7 (0.2%) | 21 (0.7%) |
| 1 Vehicle | 572 (17.3%) | 609 (21.3%) |
| 2 Vehicles | 1,454 (44.1%) | 1,400 (48.9%) |
| 3 Vehicles | 845 (25.6%) | 608 (21.2%) |
| 4 Vehicles | 156 (4.7%) | 133 (4.6%) |
| 5 or more Vehicles | 265 (8.0%) | 91 (3.2%) |
| Total | 3,299 (100.0%) | 2,862 (100.0%) |
Commute Time in Scottsboro
The most frequently occuring commute durations in Scottsboro are 5 to 9 minutes (1,561 commuters, 26.8%), 10 to 14 minutes (1,185 commuters, 20.3%), and 15 to 19 minutes (927 commuters, 15.9%).
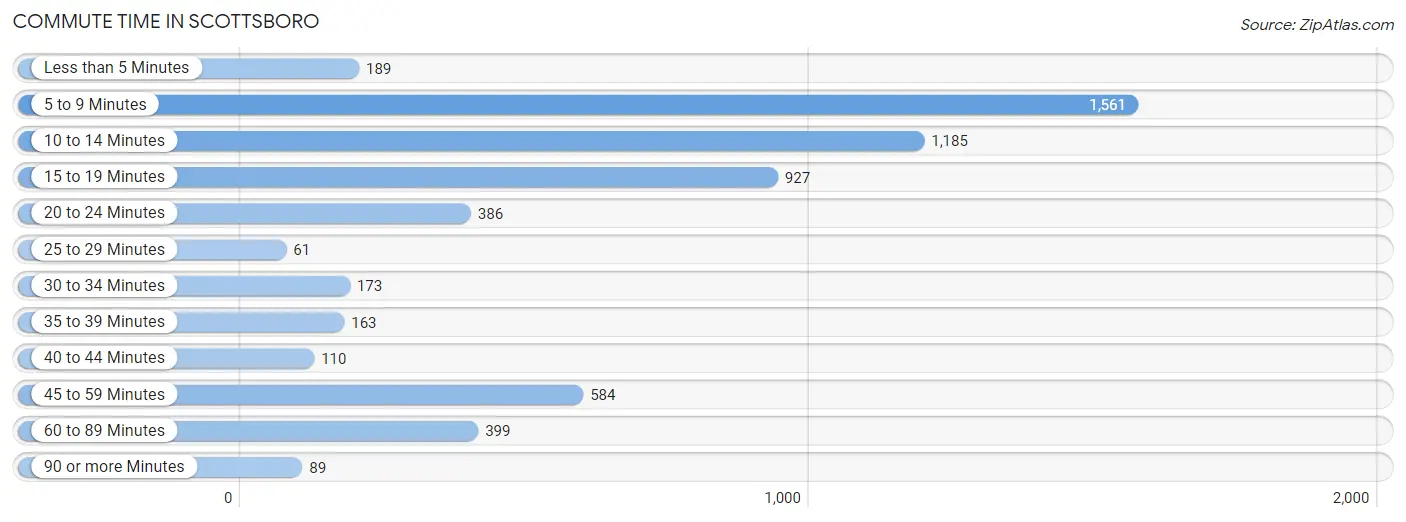
| Commute Time | # Commuters | % Commuters |
| Less than 5 Minutes | 189 | 3.2% |
| 5 to 9 Minutes | 1,561 | 26.8% |
| 10 to 14 Minutes | 1,185 | 20.3% |
| 15 to 19 Minutes | 927 | 15.9% |
| 20 to 24 Minutes | 386 | 6.6% |
| 25 to 29 Minutes | 61 | 1.1% |
| 30 to 34 Minutes | 173 | 3.0% |
| 35 to 39 Minutes | 163 | 2.8% |
| 40 to 44 Minutes | 110 | 1.9% |
| 45 to 59 Minutes | 584 | 10.0% |
| 60 to 89 Minutes | 399 | 6.9% |
| 90 or more Minutes | 89 | 1.5% |
Commute Time by Sex in Scottsboro
The most common commute times in Scottsboro are 5 to 9 minutes (783 commuters, 24.5%) for males and 5 to 9 minutes (778 commuters, 29.6%) for females.
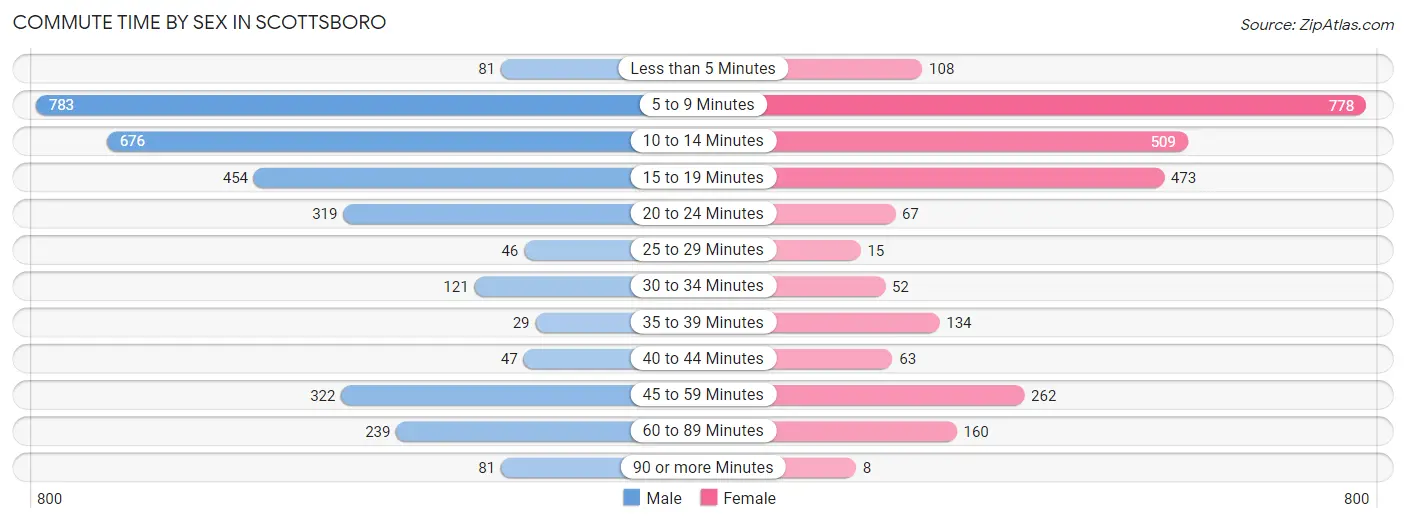
| Commute Time | Male | Female |
| Less than 5 Minutes | 81 (2.5%) | 108 (4.1%) |
| 5 to 9 Minutes | 783 (24.5%) | 778 (29.6%) |
| 10 to 14 Minutes | 676 (21.1%) | 509 (19.4%) |
| 15 to 19 Minutes | 454 (14.2%) | 473 (18.0%) |
| 20 to 24 Minutes | 319 (10.0%) | 67 (2.5%) |
| 25 to 29 Minutes | 46 (1.4%) | 15 (0.6%) |
| 30 to 34 Minutes | 121 (3.8%) | 52 (2.0%) |
| 35 to 39 Minutes | 29 (0.9%) | 134 (5.1%) |
| 40 to 44 Minutes | 47 (1.5%) | 63 (2.4%) |
| 45 to 59 Minutes | 322 (10.1%) | 262 (10.0%) |
| 60 to 89 Minutes | 239 (7.5%) | 160 (6.1%) |
| 90 or more Minutes | 81 (2.5%) | 8 (0.3%) |
Time of Departure to Work by Sex in Scottsboro
The most frequent times of departure to work in Scottsboro are 7:00 AM to 7:29 AM (476, 14.9%) for males and 7:00 AM to 7:29 AM (526, 20.0%) for females.
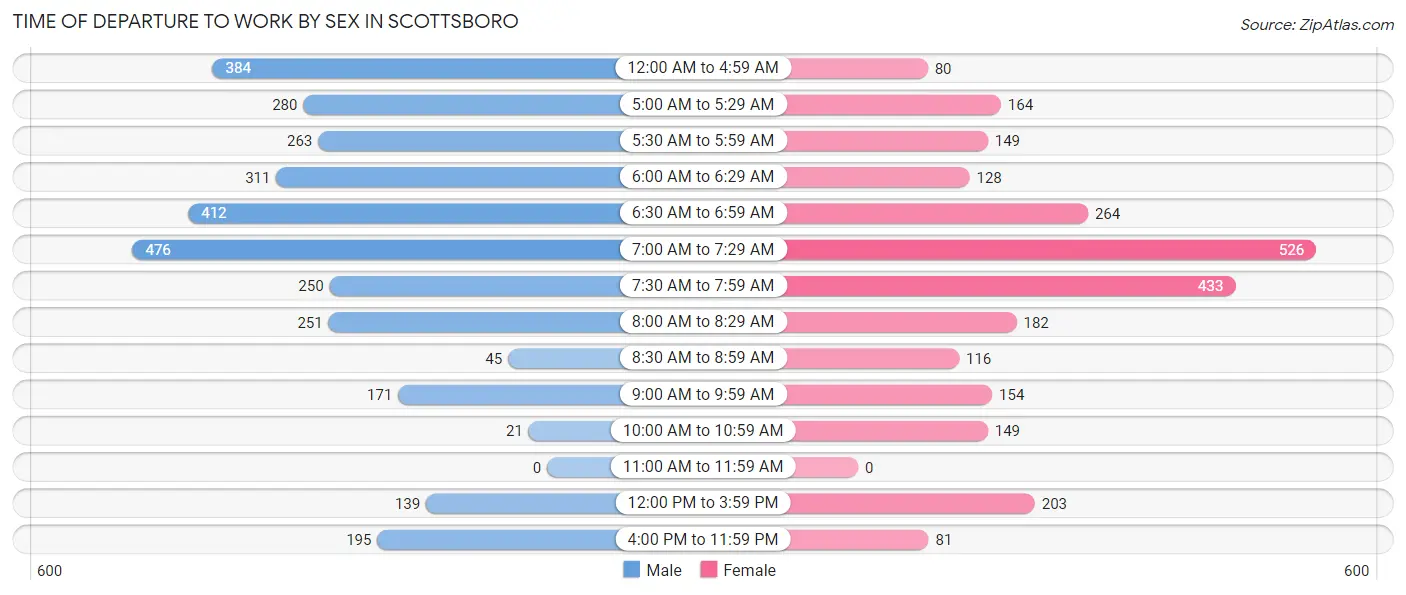
| Time of Departure | Male | Female |
| 12:00 AM to 4:59 AM | 384 (12.0%) | 80 (3.0%) |
| 5:00 AM to 5:29 AM | 280 (8.8%) | 164 (6.2%) |
| 5:30 AM to 5:59 AM | 263 (8.2%) | 149 (5.7%) |
| 6:00 AM to 6:29 AM | 311 (9.7%) | 128 (4.9%) |
| 6:30 AM to 6:59 AM | 412 (12.9%) | 264 (10.0%) |
| 7:00 AM to 7:29 AM | 476 (14.9%) | 526 (20.0%) |
| 7:30 AM to 7:59 AM | 250 (7.8%) | 433 (16.5%) |
| 8:00 AM to 8:29 AM | 251 (7.9%) | 182 (6.9%) |
| 8:30 AM to 8:59 AM | 45 (1.4%) | 116 (4.4%) |
| 9:00 AM to 9:59 AM | 171 (5.3%) | 154 (5.9%) |
| 10:00 AM to 10:59 AM | 21 (0.7%) | 149 (5.7%) |
| 11:00 AM to 11:59 AM | 0 (0.0%) | 0 (0.0%) |
| 12:00 PM to 3:59 PM | 139 (4.3%) | 203 (7.7%) |
| 4:00 PM to 11:59 PM | 195 (6.1%) | 81 (3.1%) |
| Total | 3,198 (100.0%) | 2,629 (100.0%) |
Housing Occupancy in Scottsboro
Occupancy by Ownership in Scottsboro
Of the total 6,133 dwellings in Scottsboro, owner-occupied units account for 4,335 (70.7%), while renter-occupied units make up 1,798 (29.3%).
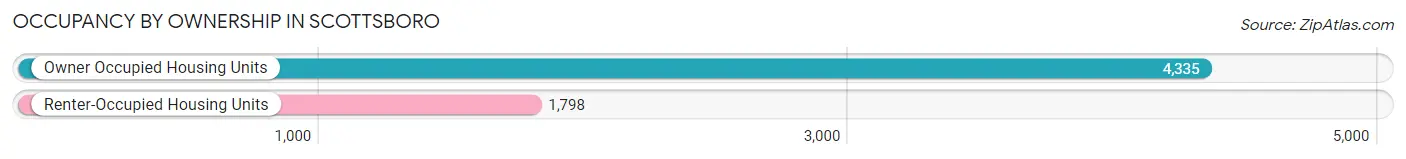
| Occupancy | # Housing Units | % Housing Units |
| Owner Occupied Housing Units | 4,335 | 70.7% |
| Renter-Occupied Housing Units | 1,798 | 29.3% |
| Total Occupied Housing Units | 6,133 | 100.0% |
Occupancy by Household Size in Scottsboro
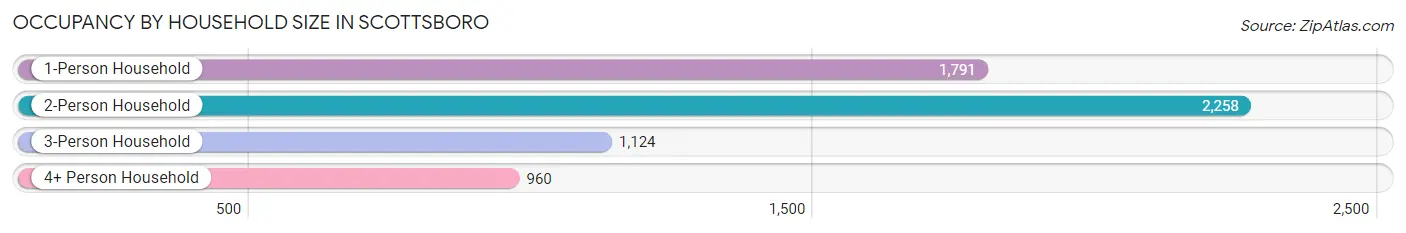
| Household Size | # Housing Units | % Housing Units |
| 1-Person Household | 1,791 | 29.2% |
| 2-Person Household | 2,258 | 36.8% |
| 3-Person Household | 1,124 | 18.3% |
| 4+ Person Household | 960 | 15.7% |
| Total Housing Units | 6,133 | 100.0% |
Occupancy by Ownership by Household Size in Scottsboro
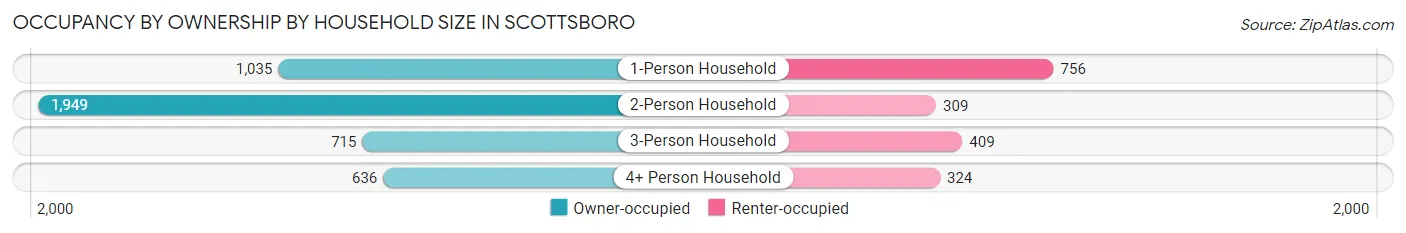
| Household Size | Owner-occupied | Renter-occupied |
| 1-Person Household | 1,035 (57.8%) | 756 (42.2%) |
| 2-Person Household | 1,949 (86.3%) | 309 (13.7%) |
| 3-Person Household | 715 (63.6%) | 409 (36.4%) |
| 4+ Person Household | 636 (66.2%) | 324 (33.8%) |
| Total Housing Units | 4,335 (70.7%) | 1,798 (29.3%) |
Occupancy by Educational Attainment in Scottsboro
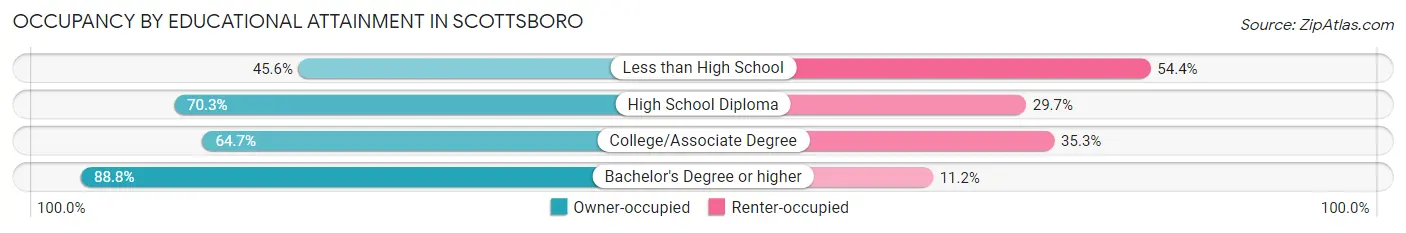
| Household Size | Owner-occupied | Renter-occupied |
| Less than High School | 324 (45.6%) | 386 (54.4%) |
| High School Diploma | 1,328 (70.3%) | 560 (29.7%) |
| College/Associate Degree | 1,225 (64.7%) | 668 (35.3%) |
| Bachelor's Degree or higher | 1,458 (88.8%) | 184 (11.2%) |
Occupancy by Age of Householder in Scottsboro
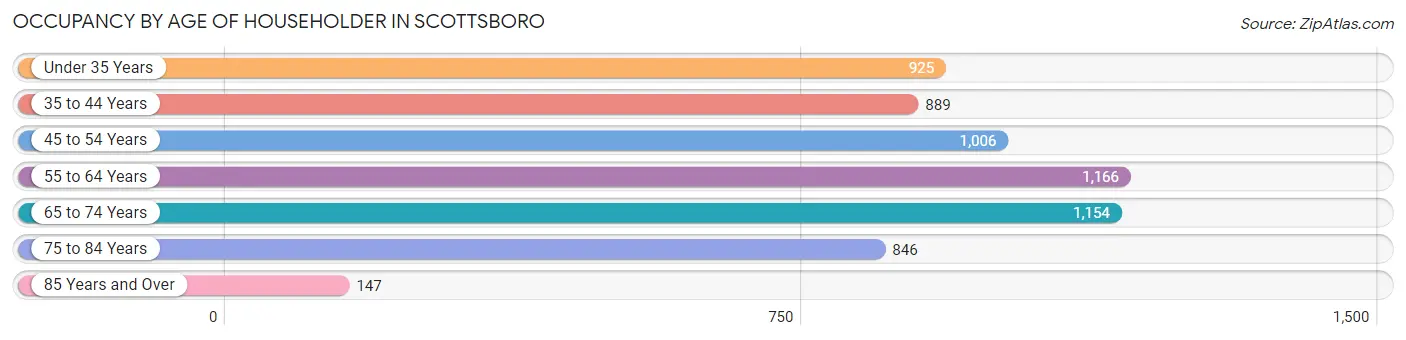
| Age Bracket | # Households | % Households |
| Under 35 Years | 925 | 15.1% |
| 35 to 44 Years | 889 | 14.5% |
| 45 to 54 Years | 1,006 | 16.4% |
| 55 to 64 Years | 1,166 | 19.0% |
| 65 to 74 Years | 1,154 | 18.8% |
| 75 to 84 Years | 846 | 13.8% |
| 85 Years and Over | 147 | 2.4% |
| Total | 6,133 | 100.0% |
Housing Finances in Scottsboro
Median Income by Occupancy in Scottsboro
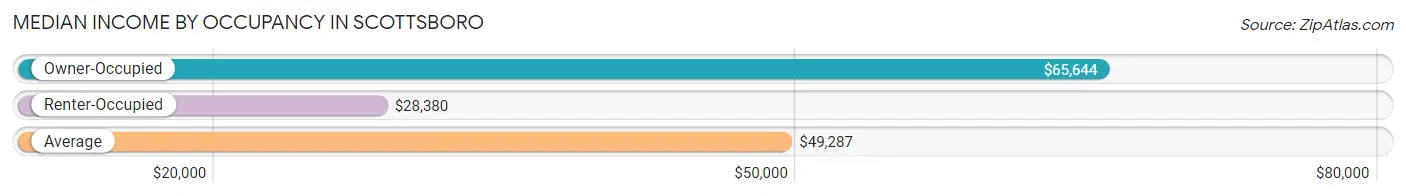
| Occupancy Type | # Households | Median Income |
| Owner-Occupied | 4,335 (70.7%) | $65,644 |
| Renter-Occupied | 1,798 (29.3%) | $28,380 |
| Average | 6,133 (100.0%) | $49,287 |
Occupancy by Householder Income Bracket in Scottsboro
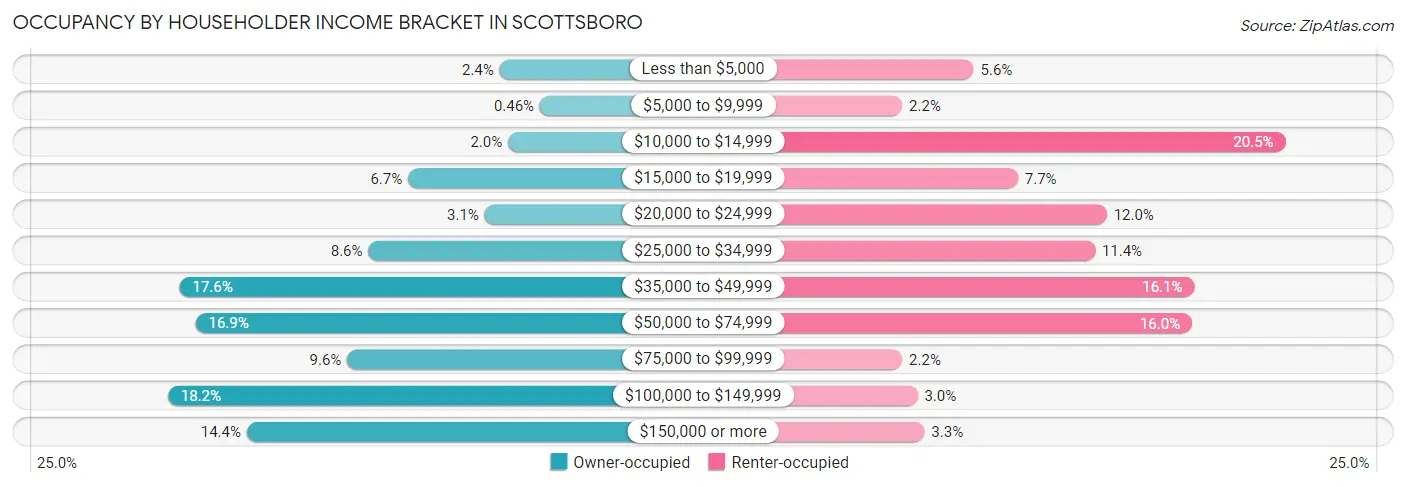
| Income Bracket | Owner-occupied | Renter-occupied |
| Less than $5,000 | 103 (2.4%) | 101 (5.6%) |
| $5,000 to $9,999 | 20 (0.5%) | 40 (2.2%) |
| $10,000 to $14,999 | 86 (2.0%) | 368 (20.5%) |
| $15,000 to $19,999 | 292 (6.7%) | 139 (7.7%) |
| $20,000 to $24,999 | 134 (3.1%) | 215 (12.0%) |
| $25,000 to $34,999 | 374 (8.6%) | 205 (11.4%) |
| $35,000 to $49,999 | 764 (17.6%) | 290 (16.1%) |
| $50,000 to $74,999 | 731 (16.9%) | 288 (16.0%) |
| $75,000 to $99,999 | 418 (9.6%) | 40 (2.2%) |
| $100,000 to $149,999 | 788 (18.2%) | 53 (2.9%) |
| $150,000 or more | 625 (14.4%) | 59 (3.3%) |
| Total | 4,335 (100.0%) | 1,798 (100.0%) |
Monthly Housing Cost Tiers in Scottsboro
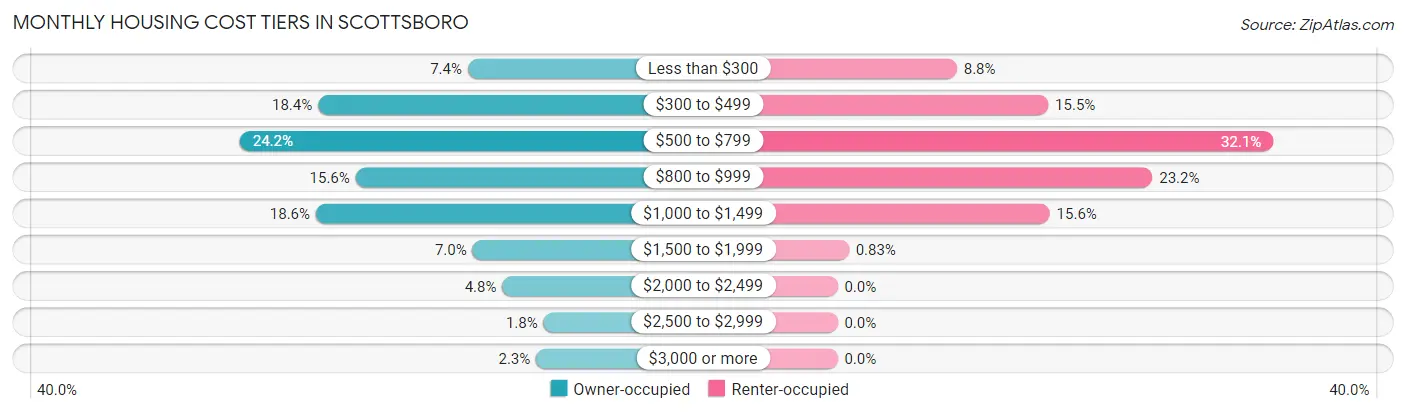
| Monthly Cost | Owner-occupied | Renter-occupied |
| Less than $300 | 319 (7.4%) | 158 (8.8%) |
| $300 to $499 | 797 (18.4%) | 279 (15.5%) |
| $500 to $799 | 1,047 (24.1%) | 577 (32.1%) |
| $800 to $999 | 677 (15.6%) | 417 (23.2%) |
| $1,000 to $1,499 | 804 (18.5%) | 281 (15.6%) |
| $1,500 to $1,999 | 304 (7.0%) | 15 (0.8%) |
| $2,000 to $2,499 | 209 (4.8%) | 0 (0.0%) |
| $2,500 to $2,999 | 77 (1.8%) | 0 (0.0%) |
| $3,000 or more | 101 (2.3%) | 0 (0.0%) |
| Total | 4,335 (100.0%) | 1,798 (100.0%) |
Physical Housing Characteristics in Scottsboro
Housing Structures in Scottsboro
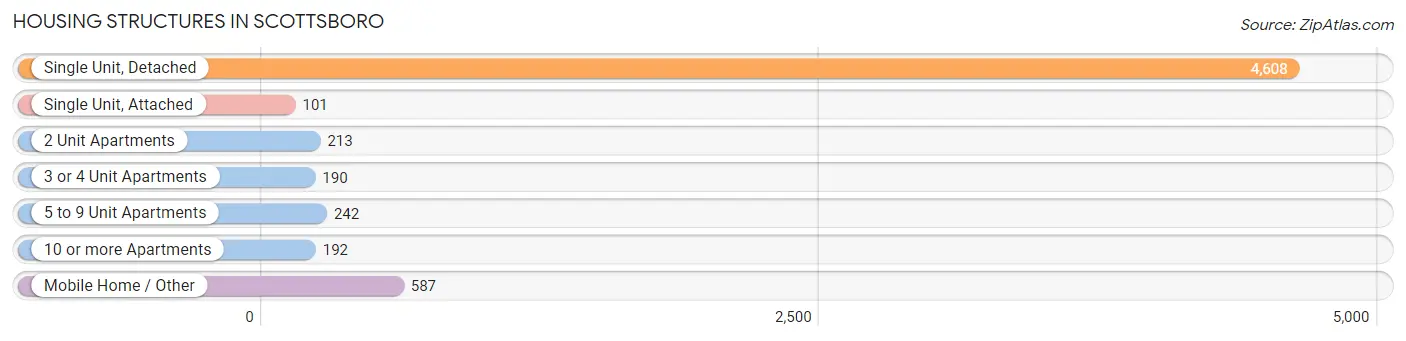
| Structure Type | # Housing Units | % Housing Units |
| Single Unit, Detached | 4,608 | 75.1% |
| Single Unit, Attached | 101 | 1.7% |
| 2 Unit Apartments | 213 | 3.5% |
| 3 or 4 Unit Apartments | 190 | 3.1% |
| 5 to 9 Unit Apartments | 242 | 4.0% |
| 10 or more Apartments | 192 | 3.1% |
| Mobile Home / Other | 587 | 9.6% |
| Total | 6,133 | 100.0% |
Housing Structures by Occupancy in Scottsboro
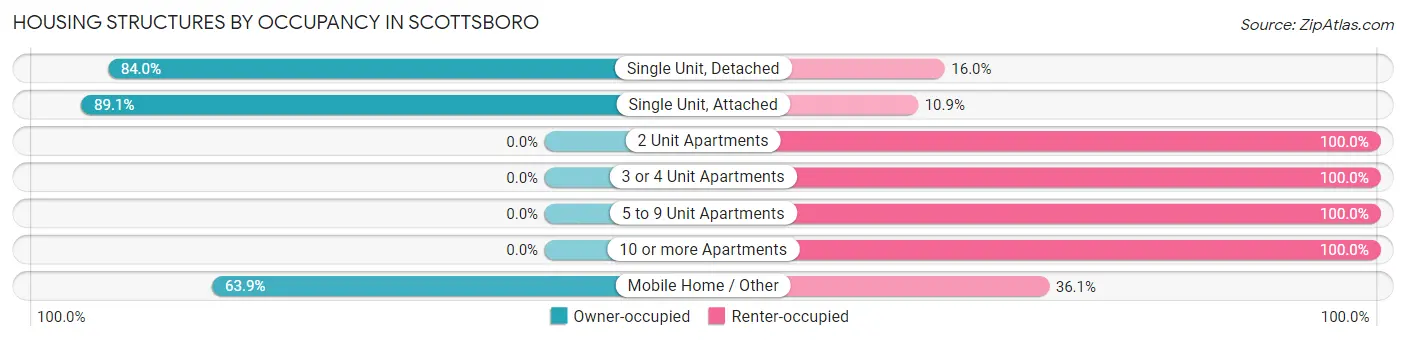
| Structure Type | Owner-occupied | Renter-occupied |
| Single Unit, Detached | 3,870 (84.0%) | 738 (16.0%) |
| Single Unit, Attached | 90 (89.1%) | 11 (10.9%) |
| 2 Unit Apartments | 0 (0.0%) | 213 (100.0%) |
| 3 or 4 Unit Apartments | 0 (0.0%) | 190 (100.0%) |
| 5 to 9 Unit Apartments | 0 (0.0%) | 242 (100.0%) |
| 10 or more Apartments | 0 (0.0%) | 192 (100.0%) |
| Mobile Home / Other | 375 (63.9%) | 212 (36.1%) |
| Total | 4,335 (70.7%) | 1,798 (29.3%) |
Housing Structures by Number of Rooms in Scottsboro
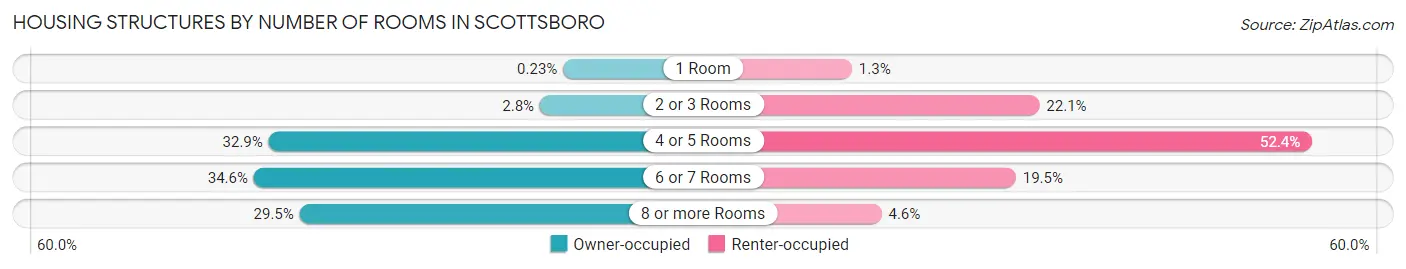
| Number of Rooms | Owner-occupied | Renter-occupied |
| 1 Room | 10 (0.2%) | 24 (1.3%) |
| 2 or 3 Rooms | 122 (2.8%) | 398 (22.1%) |
| 4 or 5 Rooms | 1,427 (32.9%) | 942 (52.4%) |
| 6 or 7 Rooms | 1,498 (34.6%) | 351 (19.5%) |
| 8 or more Rooms | 1,278 (29.5%) | 83 (4.6%) |
| Total | 4,335 (100.0%) | 1,798 (100.0%) |
Housing Structure by Heating Type in Scottsboro
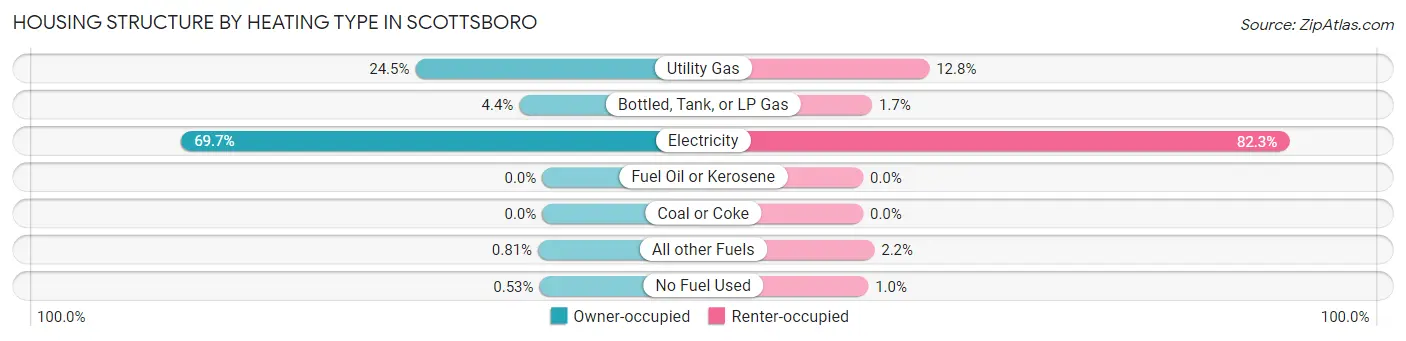
| Heating Type | Owner-occupied | Renter-occupied |
| Utility Gas | 1,062 (24.5%) | 230 (12.8%) |
| Bottled, Tank, or LP Gas | 192 (4.4%) | 31 (1.7%) |
| Electricity | 3,023 (69.7%) | 1,480 (82.3%) |
| Fuel Oil or Kerosene | 0 (0.0%) | 0 (0.0%) |
| Coal or Coke | 0 (0.0%) | 0 (0.0%) |
| All other Fuels | 35 (0.8%) | 39 (2.2%) |
| No Fuel Used | 23 (0.5%) | 18 (1.0%) |
| Total | 4,335 (100.0%) | 1,798 (100.0%) |
Household Vehicle Usage in Scottsboro
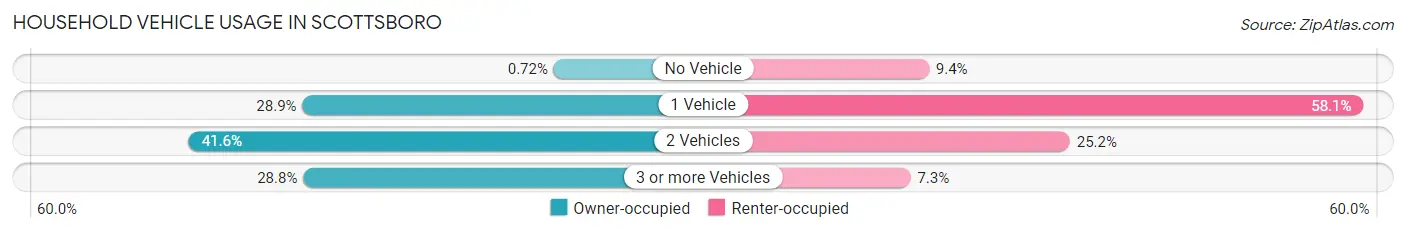
| Vehicles per Household | Owner-occupied | Renter-occupied |
| No Vehicle | 31 (0.7%) | 169 (9.4%) |
| 1 Vehicle | 1,252 (28.9%) | 1,044 (58.1%) |
| 2 Vehicles | 1,804 (41.6%) | 453 (25.2%) |
| 3 or more Vehicles | 1,248 (28.8%) | 132 (7.3%) |
| Total | 4,335 (100.0%) | 1,798 (100.0%) |
Real Estate & Mortgages in Scottsboro
Real Estate and Mortgage Overview in Scottsboro
| Characteristic | Without Mortgage | With Mortgage |
| Housing Units | 2,100 | 2,235 |
| Median Property Value | $122,400 | $171,700 |
| Median Household Income | $53,203 | $390 |
| Monthly Housing Costs | $470 | $101 |
| Real Estate Taxes | $565 | $260 |
Property Value by Mortgage Status in Scottsboro
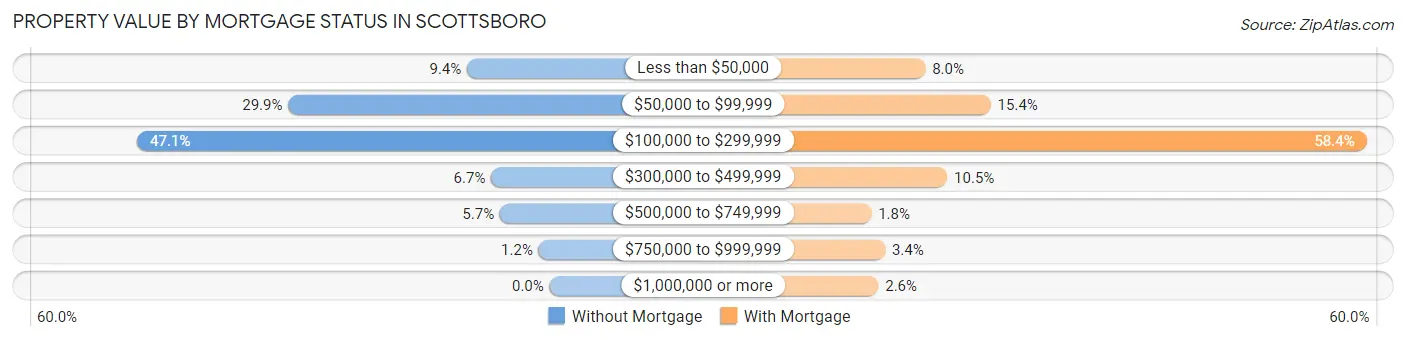
| Property Value | Without Mortgage | With Mortgage |
| Less than $50,000 | 198 (9.4%) | 178 (8.0%) |
| $50,000 to $99,999 | 627 (29.9%) | 345 (15.4%) |
| $100,000 to $299,999 | 990 (47.1%) | 1,305 (58.4%) |
| $300,000 to $499,999 | 140 (6.7%) | 234 (10.5%) |
| $500,000 to $749,999 | 119 (5.7%) | 40 (1.8%) |
| $750,000 to $999,999 | 26 (1.2%) | 75 (3.4%) |
| $1,000,000 or more | 0 (0.0%) | 58 (2.6%) |
| Total | 2,100 (100.0%) | 2,235 (100.0%) |
Household Income by Mortgage Status in Scottsboro
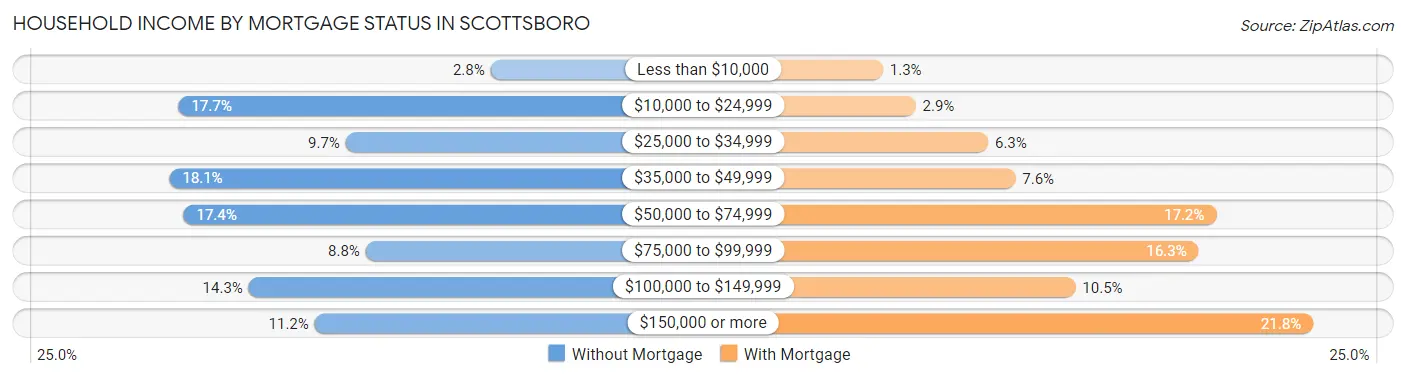
| Household Income | Without Mortgage | With Mortgage |
| Less than $10,000 | 59 (2.8%) | 29 (1.3%) |
| $10,000 to $24,999 | 371 (17.7%) | 64 (2.9%) |
| $25,000 to $34,999 | 204 (9.7%) | 141 (6.3%) |
| $35,000 to $49,999 | 380 (18.1%) | 170 (7.6%) |
| $50,000 to $74,999 | 366 (17.4%) | 384 (17.2%) |
| $75,000 to $99,999 | 184 (8.8%) | 365 (16.3%) |
| $100,000 to $149,999 | 301 (14.3%) | 234 (10.5%) |
| $150,000 or more | 235 (11.2%) | 487 (21.8%) |
| Total | 2,100 (100.0%) | 2,235 (100.0%) |
Property Value to Household Income Ratio in Scottsboro
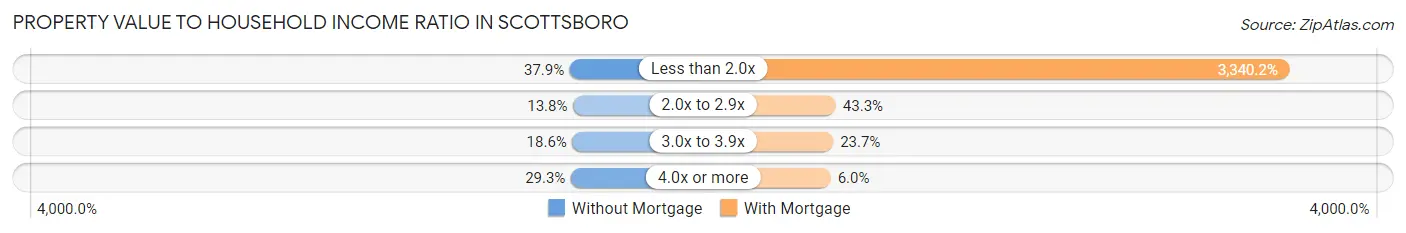
| Value-to-Income Ratio | Without Mortgage | With Mortgage |
| Less than 2.0x | 795 (37.9%) | 74,654 (3,340.2%) |
| 2.0x to 2.9x | 290 (13.8%) | 968 (43.3%) |
| 3.0x to 3.9x | 391 (18.6%) | 530 (23.7%) |
| 4.0x or more | 615 (29.3%) | 135 (6.0%) |
| Total | 2,100 (100.0%) | 2,235 (100.0%) |
Real Estate Taxes by Mortgage Status in Scottsboro
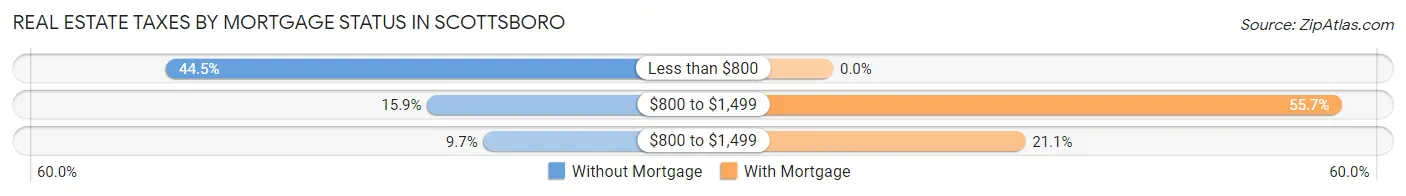
| Property Taxes | Without Mortgage | With Mortgage |
| Less than $800 | 934 (44.5%) | 0 (0.0%) |
| $800 to $1,499 | 333 (15.9%) | 1,245 (55.7%) |
| $800 to $1,499 | 204 (9.7%) | 471 (21.1%) |
| Total | 2,100 (100.0%) | 2,235 (100.0%) |
Health & Disability in Scottsboro
Health Insurance Coverage by Age in Scottsboro
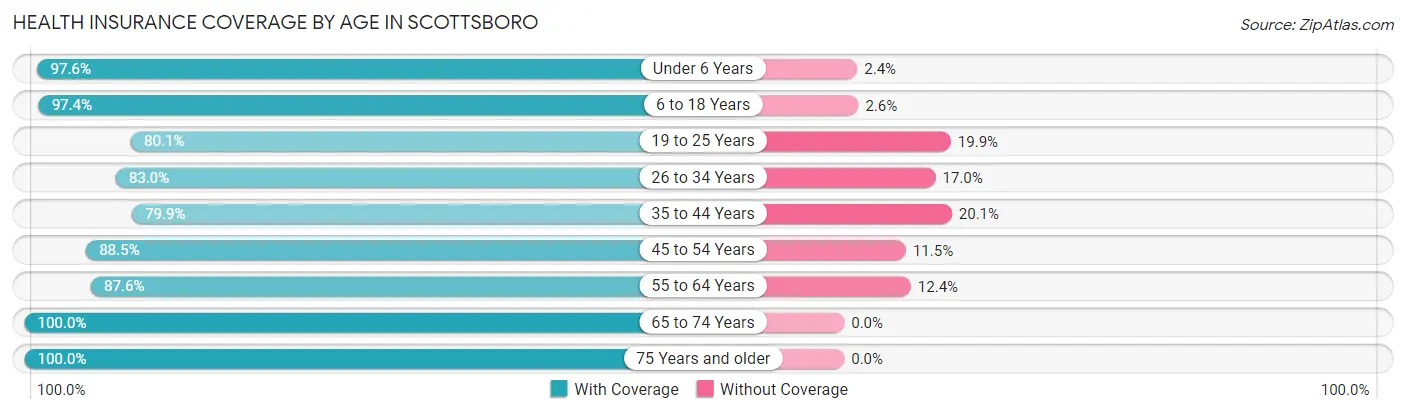
| Age Bracket | With Coverage | Without Coverage |
| Under 6 Years | 804 (97.6%) | 20 (2.4%) |
| 6 to 18 Years | 2,614 (97.4%) | 71 (2.6%) |
| 19 to 25 Years | 923 (80.1%) | 229 (19.9%) |
| 26 to 34 Years | 1,438 (83.0%) | 295 (17.0%) |
| 35 to 44 Years | 1,379 (79.9%) | 346 (20.1%) |
| 45 to 54 Years | 1,831 (88.5%) | 238 (11.5%) |
| 55 to 64 Years | 1,573 (87.6%) | 223 (12.4%) |
| 65 to 74 Years | 1,801 (100.0%) | 0 (0.0%) |
| 75 Years and older | 1,332 (100.0%) | 0 (0.0%) |
| Total | 13,695 (90.6%) | 1,422 (9.4%) |
Health Insurance Coverage by Citizenship Status in Scottsboro
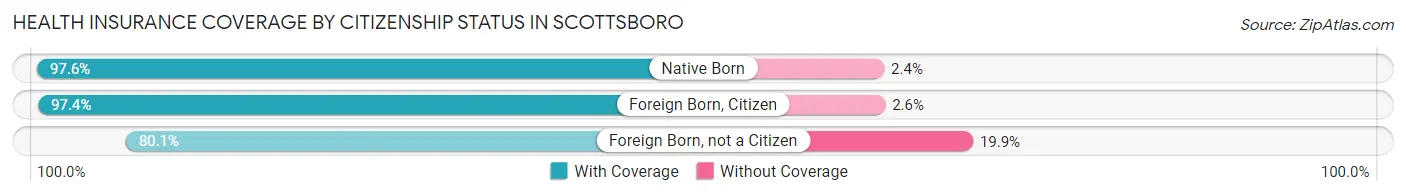
| Citizenship Status | With Coverage | Without Coverage |
| Native Born | 804 (97.6%) | 20 (2.4%) |
| Foreign Born, Citizen | 2,614 (97.4%) | 71 (2.6%) |
| Foreign Born, not a Citizen | 923 (80.1%) | 229 (19.9%) |
Health Insurance Coverage by Household Income in Scottsboro
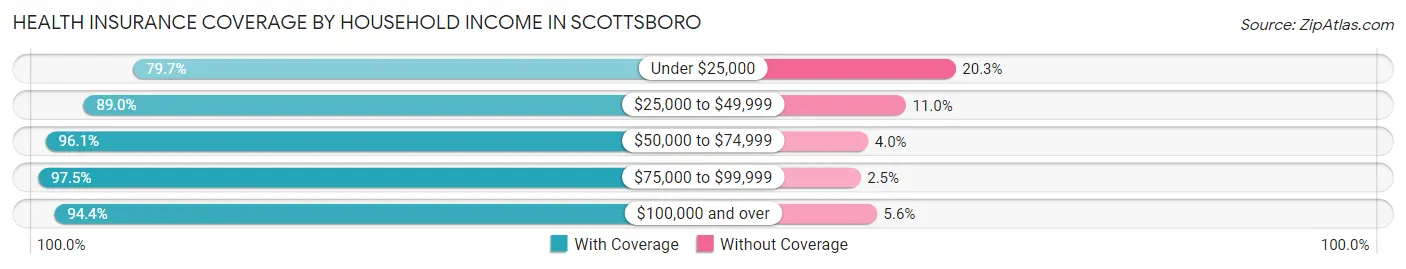
| Household Income | With Coverage | Without Coverage |
| Under $25,000 | 2,357 (79.7%) | 602 (20.3%) |
| $25,000 to $49,999 | 3,500 (89.0%) | 433 (11.0%) |
| $50,000 to $74,999 | 2,453 (96.1%) | 101 (4.0%) |
| $75,000 to $99,999 | 1,000 (97.5%) | 26 (2.5%) |
| $100,000 and over | 4,365 (94.4%) | 258 (5.6%) |
Public vs Private Health Insurance Coverage by Age in Scottsboro
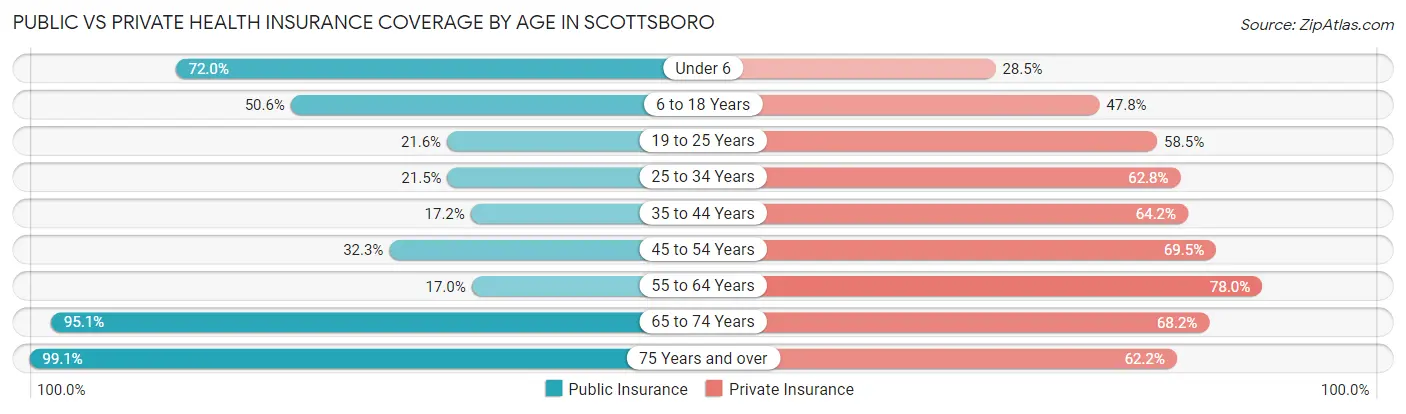
| Age Bracket | Public Insurance | Private Insurance |
| Under 6 | 593 (72.0%) | 235 (28.5%) |
| 6 to 18 Years | 1,359 (50.6%) | 1,284 (47.8%) |
| 19 to 25 Years | 249 (21.6%) | 674 (58.5%) |
| 25 to 34 Years | 373 (21.5%) | 1,089 (62.8%) |
| 35 to 44 Years | 297 (17.2%) | 1,108 (64.2%) |
| 45 to 54 Years | 669 (32.3%) | 1,437 (69.5%) |
| 55 to 64 Years | 306 (17.0%) | 1,401 (78.0%) |
| 65 to 74 Years | 1,713 (95.1%) | 1,228 (68.2%) |
| 75 Years and over | 1,320 (99.1%) | 828 (62.2%) |
| Total | 6,879 (45.5%) | 9,284 (61.4%) |
Disability Status by Sex by Age in Scottsboro
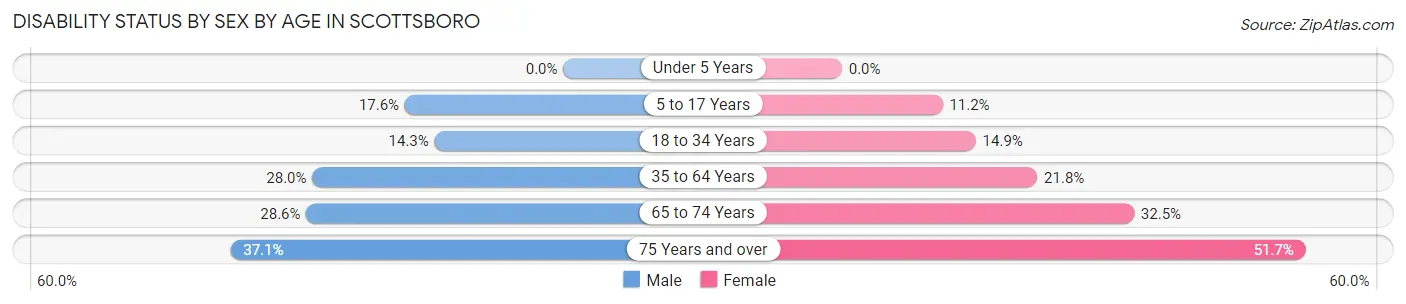
| Age Bracket | Male | Female |
| Under 5 Years | 0 (0.0%) | 0 (0.0%) |
| 5 to 17 Years | 267 (17.6%) | 124 (11.2%) |
| 18 to 34 Years | 239 (14.3%) | 214 (14.9%) |
| 35 to 64 Years | 757 (28.0%) | 627 (21.8%) |
| 65 to 74 Years | 182 (28.6%) | 379 (32.5%) |
| 75 Years and over | 171 (37.1%) | 450 (51.7%) |
Disability Class by Sex by Age in Scottsboro
Disability Class: Hearing Difficulty
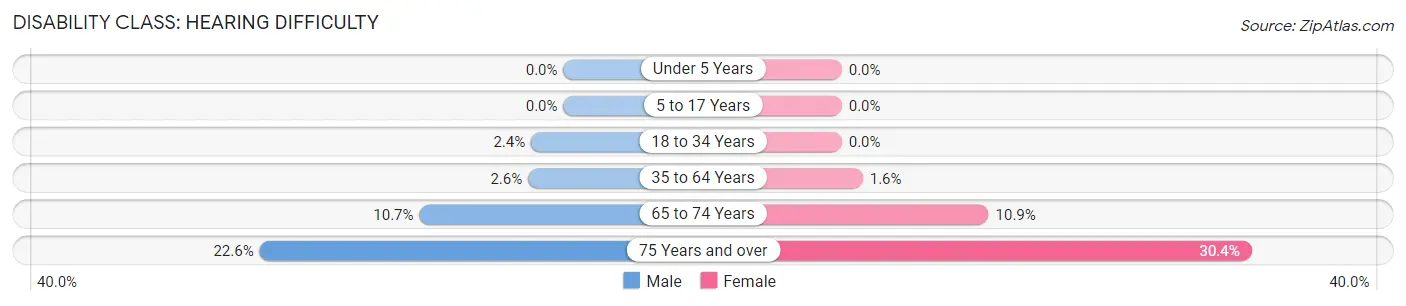
| Age Bracket | Male | Female |
| Under 5 Years | 0 (0.0%) | 0 (0.0%) |
| 5 to 17 Years | 0 (0.0%) | 0 (0.0%) |
| 18 to 34 Years | 40 (2.4%) | 0 (0.0%) |
| 35 to 64 Years | 71 (2.6%) | 45 (1.6%) |
| 65 to 74 Years | 68 (10.7%) | 127 (10.9%) |
| 75 Years and over | 104 (22.6%) | 265 (30.4%) |
Disability Class: Vision Difficulty
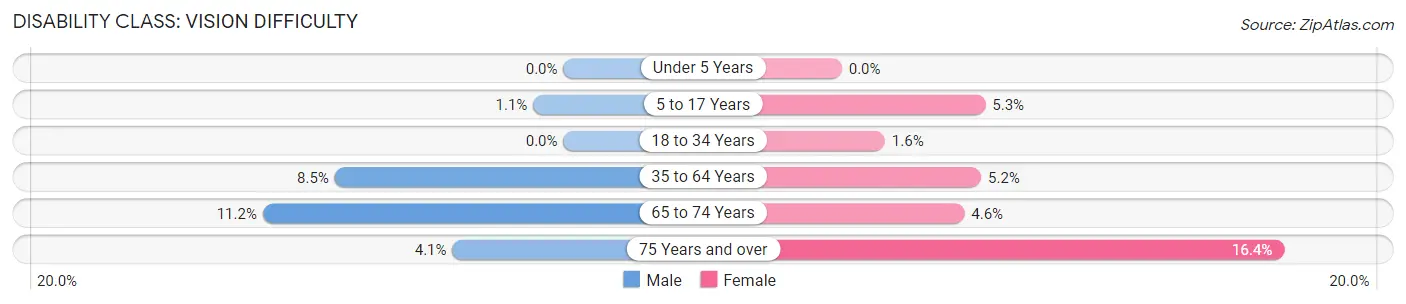
| Age Bracket | Male | Female |
| Under 5 Years | 0 (0.0%) | 0 (0.0%) |
| 5 to 17 Years | 17 (1.1%) | 59 (5.3%) |
| 18 to 34 Years | 0 (0.0%) | 23 (1.6%) |
| 35 to 64 Years | 230 (8.5%) | 149 (5.2%) |
| 65 to 74 Years | 71 (11.2%) | 53 (4.5%) |
| 75 Years and over | 19 (4.1%) | 143 (16.4%) |
Disability Class: Cognitive Difficulty
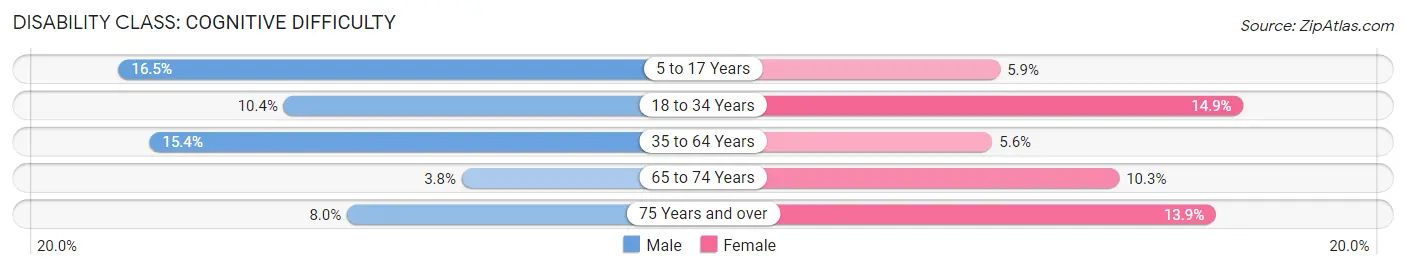
| Age Bracket | Male | Female |
| 5 to 17 Years | 250 (16.5%) | 65 (5.9%) |
| 18 to 34 Years | 173 (10.4%) | 214 (14.9%) |
| 35 to 64 Years | 416 (15.4%) | 161 (5.6%) |
| 65 to 74 Years | 24 (3.8%) | 120 (10.3%) |
| 75 Years and over | 37 (8.0%) | 121 (13.9%) |
Disability Class: Ambulatory Difficulty
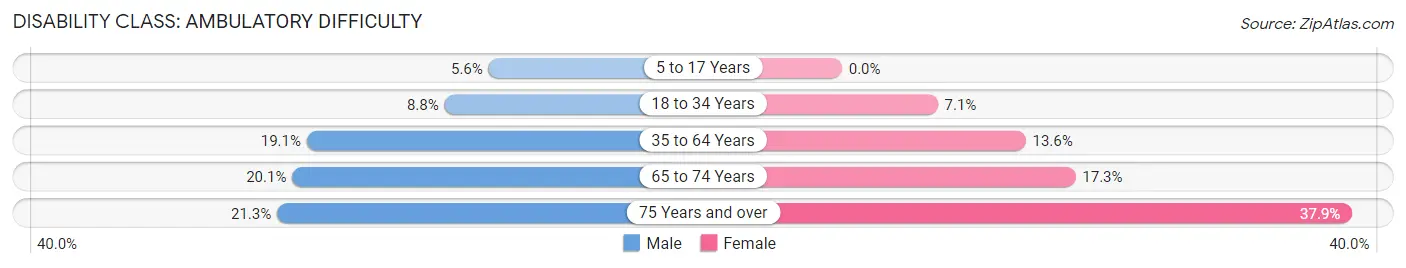
| Age Bracket | Male | Female |
| 5 to 17 Years | 84 (5.6%) | 0 (0.0%) |
| 18 to 34 Years | 147 (8.8%) | 102 (7.1%) |
| 35 to 64 Years | 516 (19.1%) | 393 (13.6%) |
| 65 to 74 Years | 128 (20.1%) | 202 (17.3%) |
| 75 Years and over | 98 (21.3%) | 330 (37.9%) |
Disability Class: Self-Care Difficulty
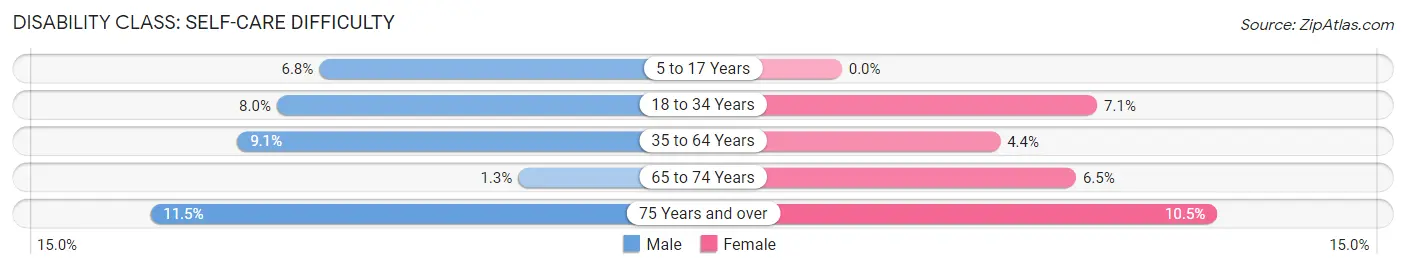
| Age Bracket | Male | Female |
| 5 to 17 Years | 103 (6.8%) | 0 (0.0%) |
| 18 to 34 Years | 133 (8.0%) | 102 (7.1%) |
| 35 to 64 Years | 246 (9.1%) | 127 (4.4%) |
| 65 to 74 Years | 8 (1.3%) | 76 (6.5%) |
| 75 Years and over | 53 (11.5%) | 91 (10.4%) |
Technology Access in Scottsboro
Computing Device Access in Scottsboro
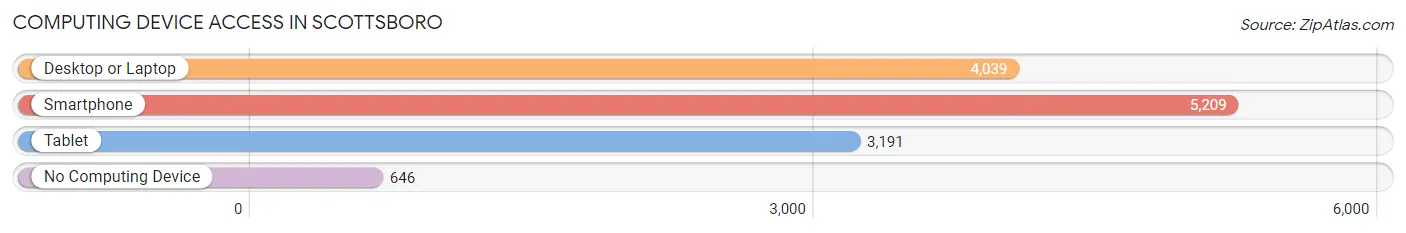
| Device Type | # Households | % Households |
| Desktop or Laptop | 4,039 | 65.9% |
| Smartphone | 5,209 | 84.9% |
| Tablet | 3,191 | 52.0% |
| No Computing Device | 646 | 10.5% |
| Total | 6,133 | 100.0% |
Internet Access in Scottsboro
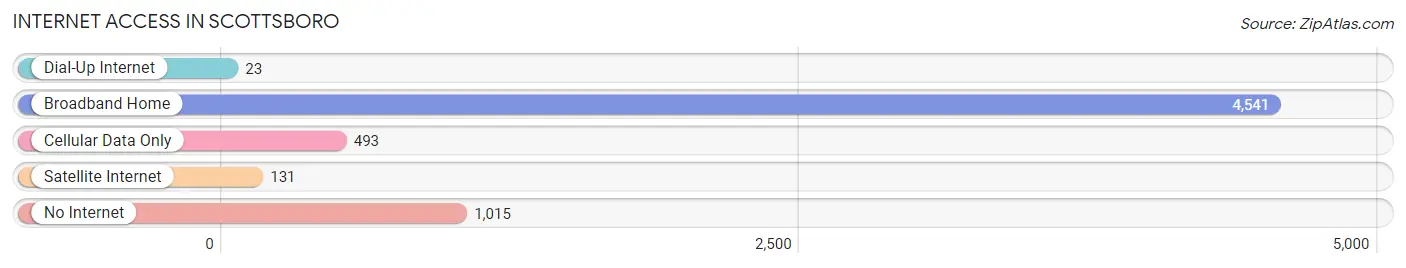
| Internet Type | # Households | % Households |
| Dial-Up Internet | 23 | 0.4% |
| Broadband Home | 4,541 | 74.0% |
| Cellular Data Only | 493 | 8.0% |
| Satellite Internet | 131 | 2.1% |
| No Internet | 1,015 | 16.6% |
| Total | 6,133 | 100.0% |
Scottsboro Summary
Scottboro, Alabama is a small town located in Jackson County, Alabama. It is situated on the banks of the Tennessee River and is the county seat of Jackson County. The town was founded in 1872 and was named after Robert Scott, a local landowner. The population of Scottsboro was 14,770 as of the 2010 census.
Geography
Scottsboro is located at 34°41'25" North, 86°02'45" West (34.690278, -86.045278). It is situated on the banks of the Tennessee River and is the county seat of Jackson County. The town is located in the foothills of the Appalachian Mountains and is surrounded by the cities of Stevenson, Bridgeport, and Paint Rock. The town has a total area of 8.3 square miles, all of which is land.
Climate
Scottsboro has a humid subtropical climate, with hot, humid summers and mild winters. The average annual temperature is 64°F, with an average high of 87°F in July and an average low of 41°F in January. The average annual precipitation is 52.3 inches, with the wettest month being April, with an average of 6.2 inches of rain.
Economy
The economy of Scottsboro is largely based on agriculture and manufacturing. The town is home to several large manufacturing plants, including a paper mill, a steel mill, and a plastics plant. The town is also home to several small businesses, including restaurants, retail stores, and service providers.
Demographics
As of the 2010 census, the population of Scottsboro was 14,770. The racial makeup of the town was 79.2% White, 17.3% African American, 0.3% Native American, 0.7% Asian, 0.1% Pacific Islander, 1.2% from other races, and 1.4% from two or more races. Hispanic or Latino of any race were 2.7% of the population.
The median income for a household in Scottsboro was $31,945, and the median income for a family was $41,945. The per capita income for the town was $17,845. About 17.2% of families and 20.7% of the population were below the poverty line, including 28.2% of those under age 18 and 16.2% of those age 65 or over.
Education
Scottsboro is served by the Jackson County School System. The town is home to two public elementary schools, one middle school, and one high school. The town is also home to several private schools, including a Christian school and a Montessori school.
Conclusion
Scottsboro, Alabama is a small town located in Jackson County, Alabama. It is situated on the banks of the Tennessee River and is the county seat of Jackson County. The town was founded in 1872 and was named after Robert Scott, a local landowner. The population of Scottsboro was 14,770 as of the 2010 census. The economy of Scottsboro is largely based on agriculture and manufacturing. The town is home to several large manufacturing plants, including a paper mill, a steel mill, and a plastics plant. The town is also home to several small businesses, including restaurants, retail stores, and service providers. The racial makeup of the town was 79.2% White, 17.3% African American, 0.3% Native American, 0.7% Asian, 0.1% Pacific Islander, 1.2% from other races, and 1.4% from two or more races. Scottsboro is served by the Jackson County School System. The town is home to two public elementary schools, one middle school, and one high school. The town is also home to several private schools, including a Christian school and a Montessori school.
Common Questions
What is Per Capita Income in Scottsboro?
Per Capita income in Scottsboro is $31,876.
What is the Median Family Income in Scottsboro?
Median Family Income in Scottsboro is $61,605.
What is the Median Household income in Scottsboro?
Median Household Income in Scottsboro is $49,287.
What is Income or Wage Gap in Scottsboro?
Income or Wage Gap in Scottsboro is 28.6%.
Women in Scottsboro earn 71.4 cents for every dollar earned by a man.
What is Family Income Deficit in Scottsboro?
Family Income Deficit in Scottsboro is $7,515.
Families that are below poverty line in Scottsboro earn $7,515 less on average than the poverty threshold level.
What is Inequality or Gini Index in Scottsboro?
Inequality or Gini Index in Scottsboro is 0.48.
What is the Total Population of Scottsboro?
Total Population of Scottsboro is 15,543.
What is the Total Male Population of Scottsboro?
Total Male Population of Scottsboro is 7,541.
What is the Total Female Population of Scottsboro?
Total Female Population of Scottsboro is 8,002.
What is the Ratio of Males per 100 Females in Scottsboro?
There are 94.24 Males per 100 Females in Scottsboro.
What is the Ratio of Females per 100 Males in Scottsboro?
There are 106.11 Females per 100 Males in Scottsboro.
What is the Median Population Age in Scottsboro?
Median Population Age in Scottsboro is 41.7 Years.
What is the Average Family Size in Scottsboro
Average Family Size in Scottsboro is 3.0 People.
What is the Average Household Size in Scottsboro
Average Household Size in Scottsboro is 2.5 People.
How Large is the Labor Force in Scottsboro?
There are 6,514 People in the Labor Forcein in Scottsboro.
What is the Percentage of People in the Labor Force in Scottsboro?
51.9% of People are in the Labor Force in Scottsboro.
What is the Unemployment Rate in Scottsboro?
Unemployment Rate in Scottsboro is 3.8%.