Repton, AL Map & Demographics
Repton Map
Repton Overview
$13,379
PER CAPITA INCOME
$43,333
AVG FAMILY INCOME
$39,000
AVG HOUSEHOLD INCOME
0.25
INEQUALITY / GINI INDEX
289
TOTAL POPULATION
166
MALE POPULATION
123
FEMALE POPULATION
134.96
MALES / 100 FEMALES
74.10
FEMALES / 100 MALES
35.1
MEDIAN AGE
4.2
AVG FAMILY SIZE
3.5
AVG HOUSEHOLD SIZE
107
LABOR FORCE [ PEOPLE ]
45.1%
PERCENT IN LABOR FORCE
3.7%
UNEMPLOYMENT RATE
Repton Zip Codes
Repton Area Codes
Income in Repton
Income Overview in Repton
Per Capita Income in Repton is $13,379, while median incomes of families and households are $43,333 and $39,000 respectively.
| Characteristic | Number | Measure |
| Per Capita Income | 289 | $13,379 |
| Median Family Income | 58 | $43,333 |
| Mean Family Income | 58 | $46,824 |
| Median Household Income | 82 | $39,000 |
| Mean Household Income | 82 | $39,554 |
| Income Deficit | 58 | $0 |
| Wage / Income Gap (%) | 289 | 0.00% |
| Wage / Income Gap ($) | 289 | 100.00¢ per $1 |
| Gini / Inequality Index | 289 | 0.25 |
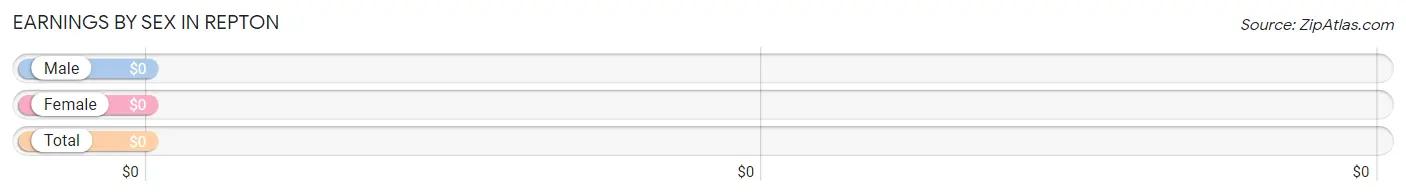
Earnings by Sex in Repton
| Sex | Number | Average Earnings |
| Male | 84 (75.7%) | $0 |
| Female | 27 (24.3%) | $0 |
| Total | 111 (100.0%) | $0 |
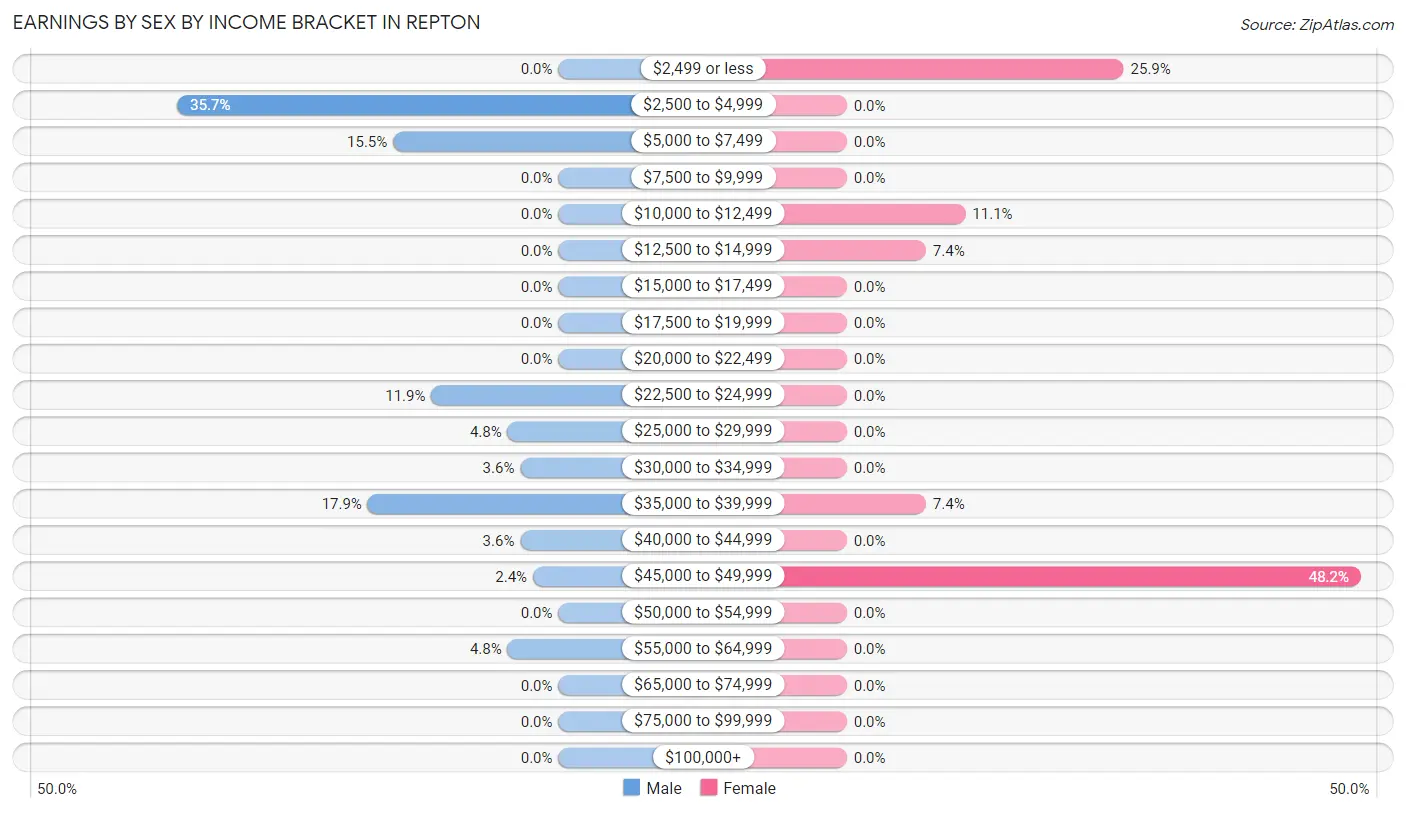
Earnings by Sex by Income Bracket in Repton
The most common earnings brackets in Repton are $2,500 to $4,999 for men (30 | 35.7%) and $45,000 to $49,999 for women (13 | 48.1%).
| Income | Male | Female |
| $2,499 or less | 0 (0.0%) | 7 (25.9%) |
| $2,500 to $4,999 | 30 (35.7%) | 0 (0.0%) |
| $5,000 to $7,499 | 13 (15.5%) | 0 (0.0%) |
| $7,500 to $9,999 | 0 (0.0%) | 0 (0.0%) |
| $10,000 to $12,499 | 0 (0.0%) | 3 (11.1%) |
| $12,500 to $14,999 | 0 (0.0%) | 2 (7.4%) |
| $15,000 to $17,499 | 0 (0.0%) | 0 (0.0%) |
| $17,500 to $19,999 | 0 (0.0%) | 0 (0.0%) |
| $20,000 to $22,499 | 0 (0.0%) | 0 (0.0%) |
| $22,500 to $24,999 | 10 (11.9%) | 0 (0.0%) |
| $25,000 to $29,999 | 4 (4.8%) | 0 (0.0%) |
| $30,000 to $34,999 | 3 (3.6%) | 0 (0.0%) |
| $35,000 to $39,999 | 15 (17.9%) | 2 (7.4%) |
| $40,000 to $44,999 | 3 (3.6%) | 0 (0.0%) |
| $45,000 to $49,999 | 2 (2.4%) | 13 (48.1%) |
| $50,000 to $54,999 | 0 (0.0%) | 0 (0.0%) |
| $55,000 to $64,999 | 4 (4.8%) | 0 (0.0%) |
| $65,000 to $74,999 | 0 (0.0%) | 0 (0.0%) |
| $75,000 to $99,999 | 0 (0.0%) | 0 (0.0%) |
| $100,000+ | 0 (0.0%) | 0 (0.0%) |
| Total | 84 (100.0%) | 27 (100.0%) |
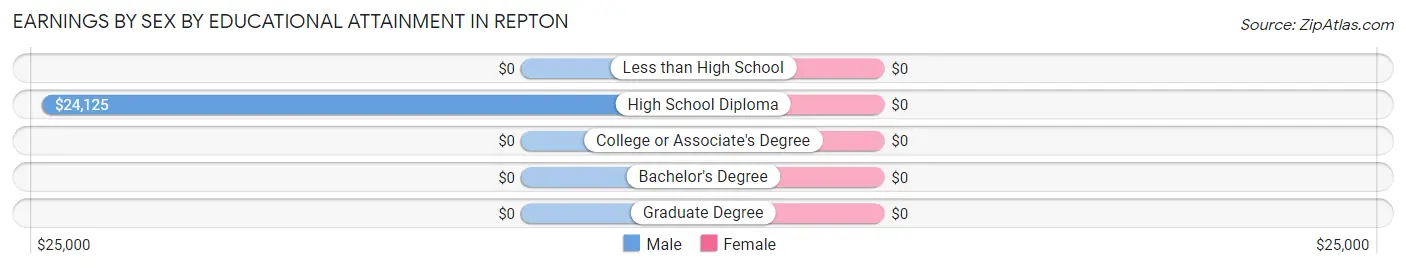
Earnings by Sex by Educational Attainment in Repton
| Educational Attainment | Male Income | Female Income |
| Less than High School | - | - |
| High School Diploma | $24,125 | $0 |
| College or Associate's Degree | - | - |
| Bachelor's Degree | - | - |
| Graduate Degree | - | - |
| Total | $35,667 | $0 |
Family Income in Repton
Family Income Brackets in Repton
According to the Repton family income data, there are 27 families falling into the $35,000 to $49,999 income range, which is the most common income bracket and makes up 46.6% of all families.
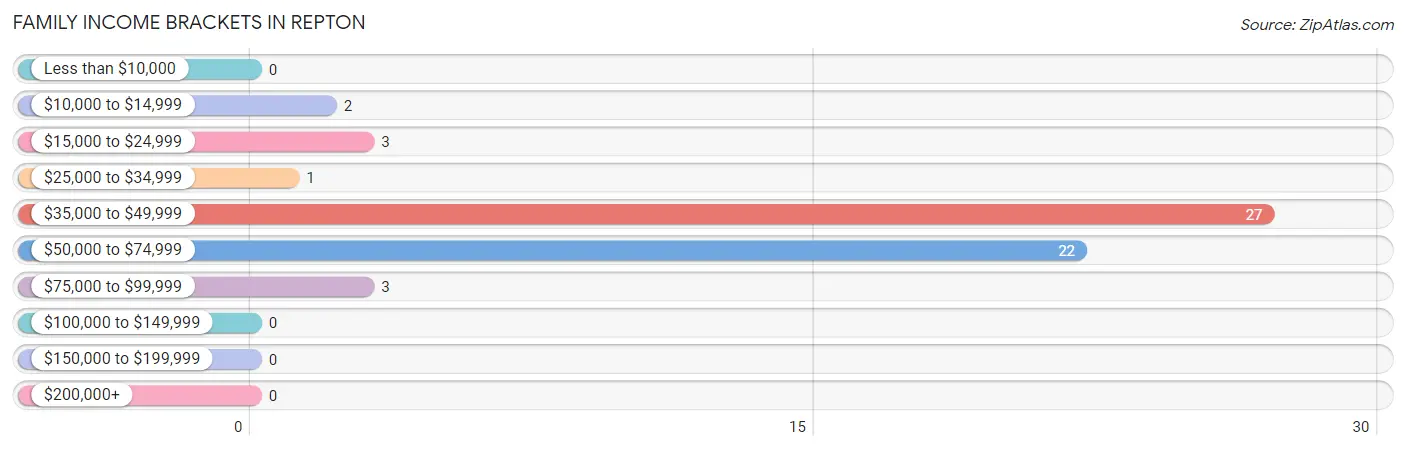
| Income Bracket | # Families | % Families |
| Less than $10,000 | 0 | 0.0% |
| $10,000 to $14,999 | 2 | 3.4% |
| $15,000 to $24,999 | 3 | 5.2% |
| $25,000 to $34,999 | 1 | 1.7% |
| $35,000 to $49,999 | 27 | 46.6% |
| $50,000 to $74,999 | 22 | 37.9% |
| $75,000 to $99,999 | 3 | 5.2% |
| $100,000 to $149,999 | 0 | 0.0% |
| $150,000 to $199,999 | 0 | 0.0% |
| $200,000+ | 0 | 0.0% |
Family Income by Famaliy Size in Repton
2-person families (19 | 32.8%) account for the highest median family income in Repton with $56,250 per family, while 2-person families (19 | 32.8%) have the highest median income of $28,125 per family member.
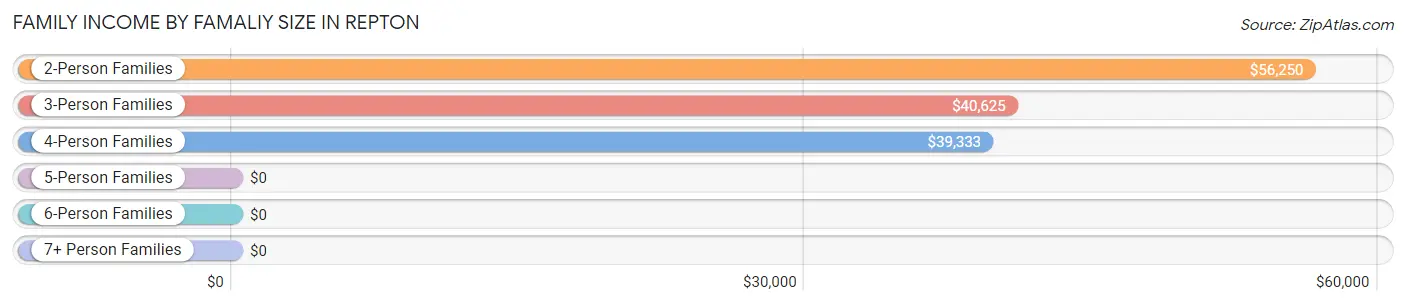
| Income Bracket | # Families | Median Income |
| 2-Person Families | 19 (32.8%) | $56,250 |
| 3-Person Families | 17 (29.3%) | $40,625 |
| 4-Person Families | 22 (37.9%) | $39,333 |
| 5-Person Families | 0 (0.0%) | $0 |
| 6-Person Families | 0 (0.0%) | $0 |
| 7+ Person Families | 0 (0.0%) | $0 |
| Total | 58 (100.0%) | $43,333 |
Family Income by Number of Earners in Repton
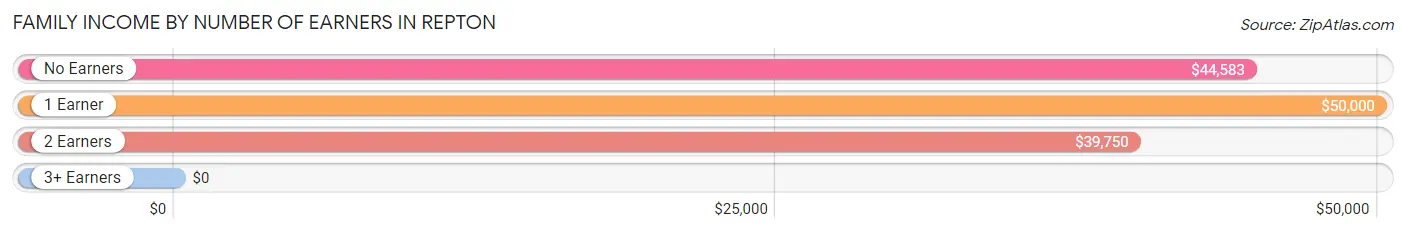
| Number of Earners | # Families | Median Income |
| No Earners | 15 (25.9%) | $44,583 |
| 1 Earner | 12 (20.7%) | $50,000 |
| 2 Earners | 31 (53.4%) | $39,750 |
| 3+ Earners | 0 (0.0%) | $0 |
| Total | 58 (100.0%) | $43,333 |
Household Income in Repton
Household Income Brackets in Repton
With 32 households falling in the category, the $35,000 to $49,999 income range is the most frequent in Repton, accounting for 39.0% of all households.
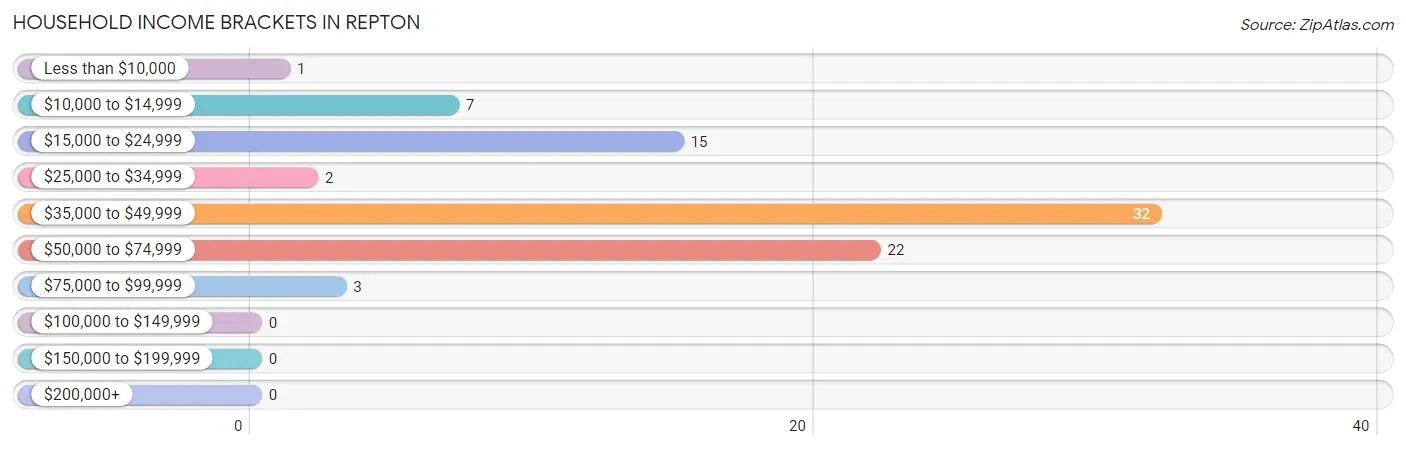
| Income Bracket | # Households | % Households |
| Less than $10,000 | 1 | 1.2% |
| $10,000 to $14,999 | 7 | 8.5% |
| $15,000 to $24,999 | 15 | 18.3% |
| $25,000 to $34,999 | 2 | 2.4% |
| $35,000 to $49,999 | 32 | 39.0% |
| $50,000 to $74,999 | 22 | 26.8% |
| $75,000 to $99,999 | 3 | 3.7% |
| $100,000 to $149,999 | 0 | 0.0% |
| $150,000 to $199,999 | 0 | 0.0% |
| $200,000+ | 0 | 0.0% |
Household Income by Householder Age in Repton
The median household income in Repton is $39,000, with the highest median household income of $55,568 found in the 25 to 44 years age bracket for the primary householder. A total of 17 households (20.7%) fall into this category. Meanwhile, the 15 to 24 years age bracket for the primary householder has the lowest median household income of $0, with 1 households (1.2%) in this group.
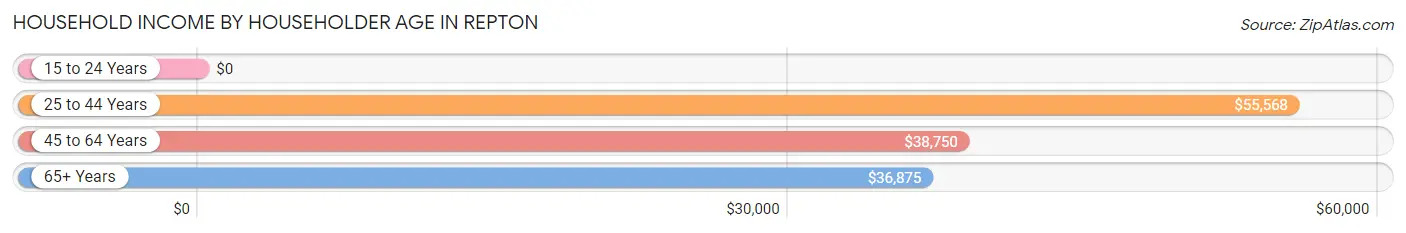
| Income Bracket | # Households | Median Income |
| 15 to 24 Years | 1 (1.2%) | $0 |
| 25 to 44 Years | 17 (20.7%) | $55,568 |
| 45 to 64 Years | 35 (42.7%) | $38,750 |
| 65+ Years | 29 (35.4%) | $36,875 |
| Total | 82 (100.0%) | $39,000 |
Poverty in Repton
Income Below Poverty by Sex and Age in Repton
With 4.8% poverty level for males and 31.7% for females among the residents of Repton, 12 to 14 year old males and 18 to 24 year old females are the most vulnerable to poverty, with 5 males (100.0%) and 10 females (100.0%) in their respective age groups living below the poverty level.
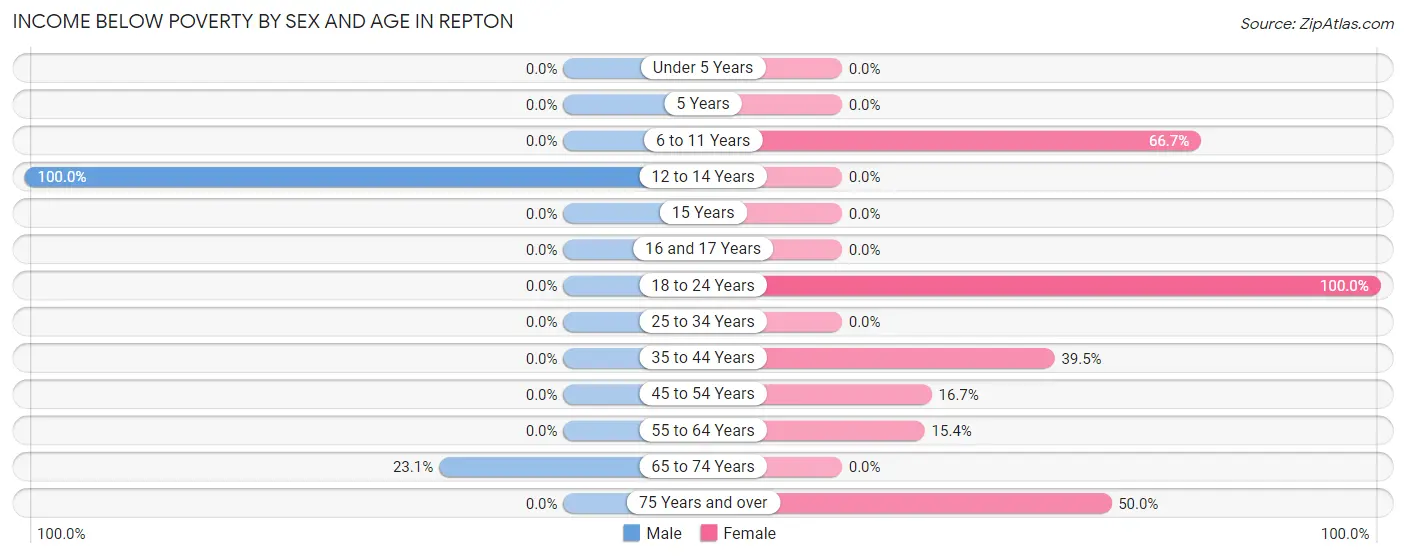
| Age Bracket | Male | Female |
| Under 5 Years | 0 (0.0%) | 0 (0.0%) |
| 5 Years | 0 (0.0%) | 0 (0.0%) |
| 6 to 11 Years | 0 (0.0%) | 4 (66.7%) |
| 12 to 14 Years | 5 (100.0%) | 0 (0.0%) |
| 15 Years | 0 (0.0%) | 0 (0.0%) |
| 16 and 17 Years | 0 (0.0%) | 0 (0.0%) |
| 18 to 24 Years | 0 (0.0%) | 10 (100.0%) |
| 25 to 34 Years | 0 (0.0%) | 0 (0.0%) |
| 35 to 44 Years | 0 (0.0%) | 15 (39.5%) |
| 45 to 54 Years | 0 (0.0%) | 2 (16.7%) |
| 55 to 64 Years | 0 (0.0%) | 2 (15.4%) |
| 65 to 74 Years | 3 (23.1%) | 0 (0.0%) |
| 75 Years and over | 0 (0.0%) | 6 (50.0%) |
| Total | 8 (4.8%) | 39 (31.7%) |
Income Above Poverty by Sex and Age in Repton
According to the poverty statistics in Repton, males aged 6 to 11 years and females aged under 5 years are the age groups that are most secure financially, with 100.0% of males and 100.0% of females in these age groups living above the poverty line.
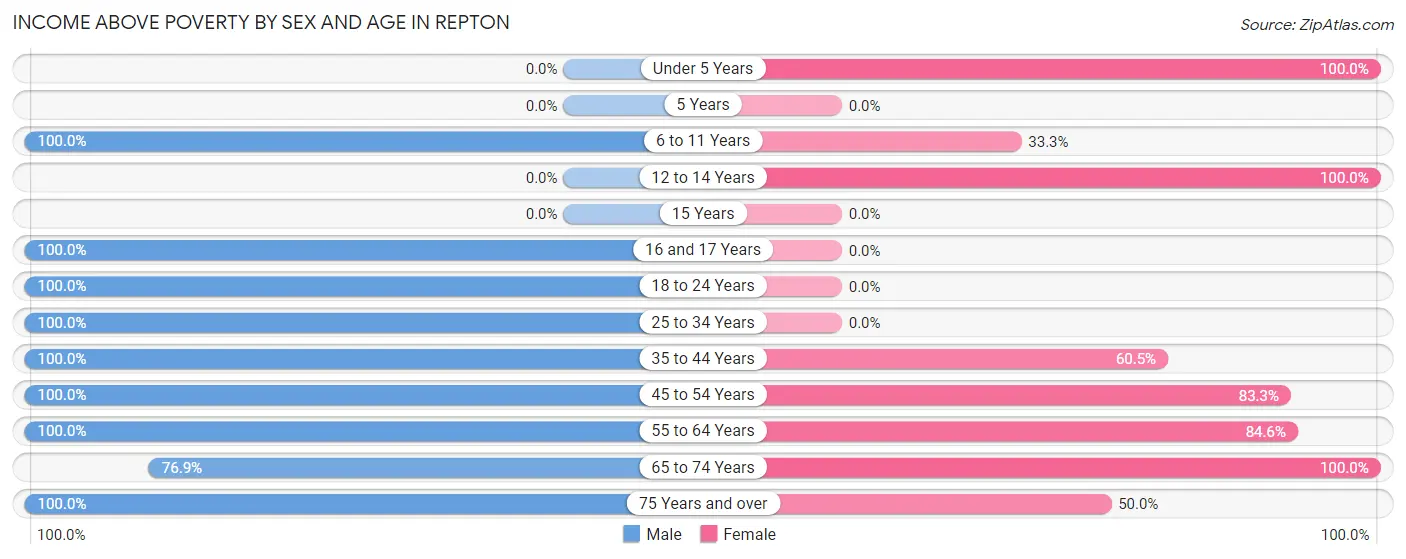
| Age Bracket | Male | Female |
| Under 5 Years | 0 (0.0%) | 23 (100.0%) |
| 5 Years | 0 (0.0%) | 0 (0.0%) |
| 6 to 11 Years | 13 (100.0%) | 2 (33.3%) |
| 12 to 14 Years | 0 (0.0%) | 5 (100.0%) |
| 15 Years | 0 (0.0%) | 0 (0.0%) |
| 16 and 17 Years | 25 (100.0%) | 0 (0.0%) |
| 18 to 24 Years | 44 (100.0%) | 0 (0.0%) |
| 25 to 34 Years | 13 (100.0%) | 0 (0.0%) |
| 35 to 44 Years | 10 (100.0%) | 23 (60.5%) |
| 45 to 54 Years | 20 (100.0%) | 10 (83.3%) |
| 55 to 64 Years | 12 (100.0%) | 11 (84.6%) |
| 65 to 74 Years | 10 (76.9%) | 4 (100.0%) |
| 75 Years and over | 11 (100.0%) | 6 (50.0%) |
| Total | 158 (95.2%) | 84 (68.3%) |
Income Below Poverty Among Married-Couple Families in Repton
The poverty statistics for married-couple families in Repton show that 12.5% or 3 of the total 24 families live below the poverty line. Families with 1 or 2 children have the highest poverty rate of 30.0%, comprising of 3 families. On the other hand, families with no children have the lowest poverty rate of 0.0%, which includes 0 families.
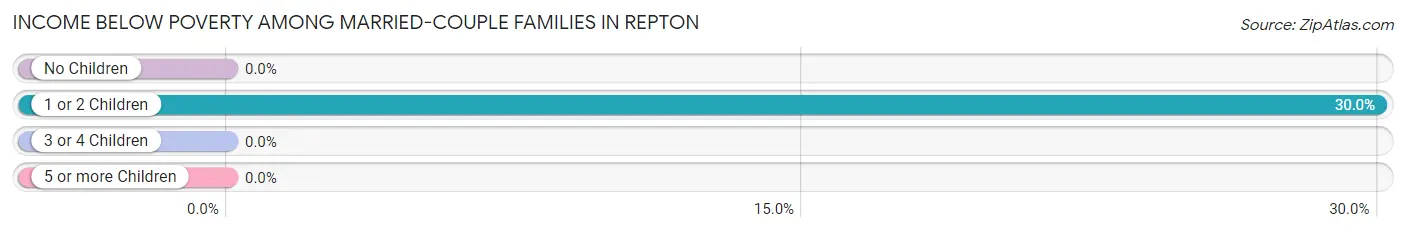
| Children | Above Poverty | Below Poverty |
| No Children | 14 (100.0%) | 0 (0.0%) |
| 1 or 2 Children | 7 (70.0%) | 3 (30.0%) |
| 3 or 4 Children | 0 (0.0%) | 0 (0.0%) |
| 5 or more Children | 0 (0.0%) | 0 (0.0%) |
| Total | 21 (87.5%) | 3 (12.5%) |
Income Below Poverty Among Single-Parent Households in Repton
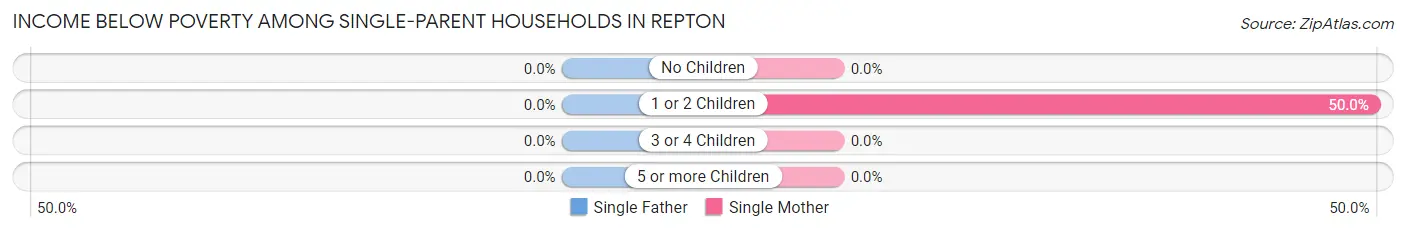
| Children | Single Father | Single Mother |
| No Children | 0 (0.0%) | 0 (0.0%) |
| 1 or 2 Children | 0 (0.0%) | 2 (50.0%) |
| 3 or 4 Children | 0 (0.0%) | 0 (0.0%) |
| 5 or more Children | 0 (0.0%) | 0 (0.0%) |
| Total | 0 (0.0%) | 2 (13.3%) |
Income Below Poverty Among Married-Couple vs Single-Parent Households in Repton
The poverty data for Repton shows that 3 of the married-couple family households (12.5%) and 2 of the single-parent households (5.9%) are living below the poverty level. Within the married-couple family households, those with 1 or 2 children have the highest poverty rate, with 3 households (30.0%) falling below the poverty line. Among the single-parent households, those with 1 or 2 children have the highest poverty rate, with 2 household (9.1%) living below poverty.
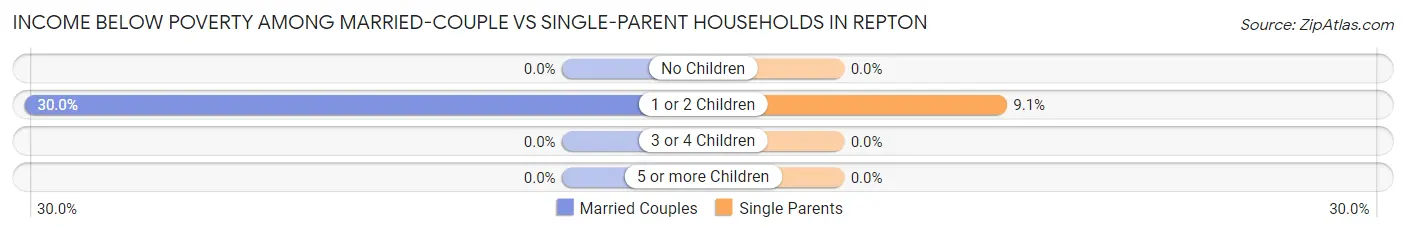
| Children | Married-Couple Families | Single-Parent Households |
| No Children | 0 (0.0%) | 0 (0.0%) |
| 1 or 2 Children | 3 (30.0%) | 2 (9.1%) |
| 3 or 4 Children | 0 (0.0%) | 0 (0.0%) |
| 5 or more Children | 0 (0.0%) | 0 (0.0%) |
| Total | 3 (12.5%) | 2 (5.9%) |
Race in Repton
The most populous races in Repton are White / Caucasian (156 | 54.0%), Black / African American (118 | 40.8%), and Asian (15 | 5.2%).
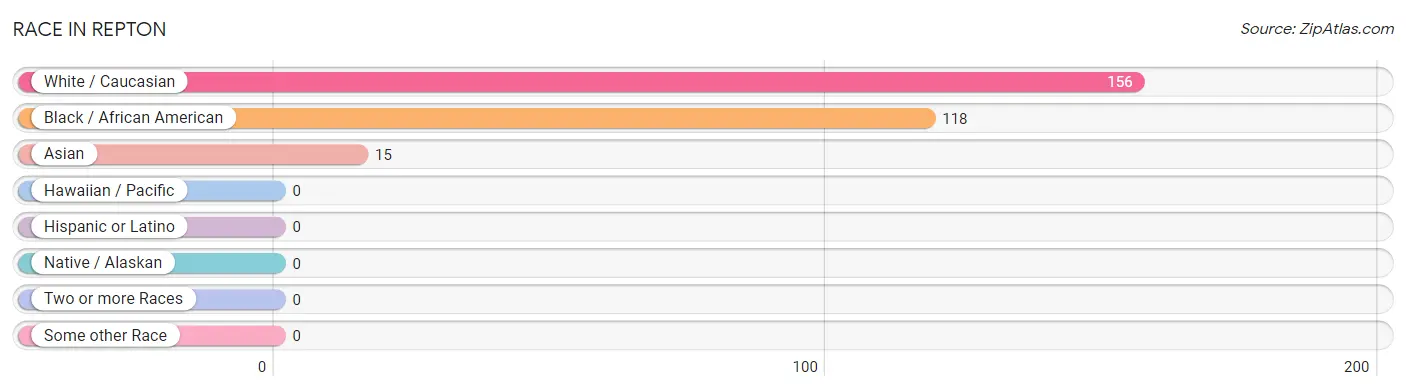
| Race | # Population | % Population |
| Asian | 15 | 5.2% |
| Black / African American | 118 | 40.8% |
| Hawaiian / Pacific | 0 | 0.0% |
| Hispanic or Latino | 0 | 0.0% |
| Native / Alaskan | 0 | 0.0% |
| White / Caucasian | 156 | 54.0% |
| Two or more Races | 0 | 0.0% |
| Some other Race | 0 | 0.0% |
| Total | 289 | 100.0% |
Ancestry in Repton
The most populous ancestries reported in Repton are Korean (15 | 5.2%), American (14 | 4.8%), English (7 | 2.4%), and German (5 | 1.7%), together accounting for 14.2% of all Repton residents.
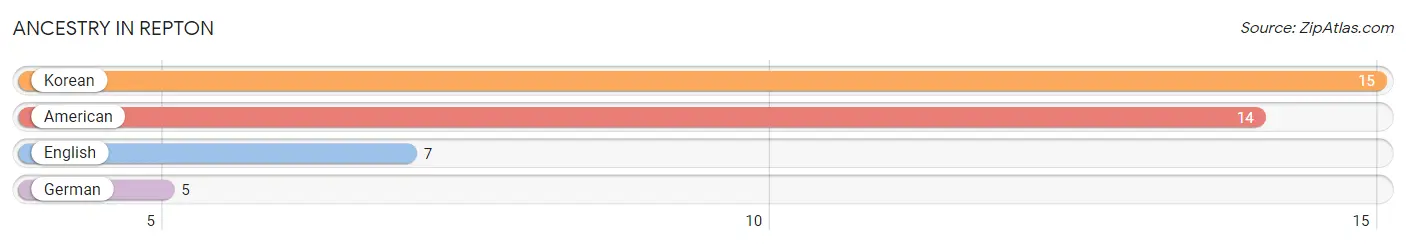
| Ancestry | # Population | % Population |
| American | 14 | 4.8% |
| English | 7 | 2.4% |
| German | 5 | 1.7% |
| Korean | 15 | 5.2% | View All 4 Rows |
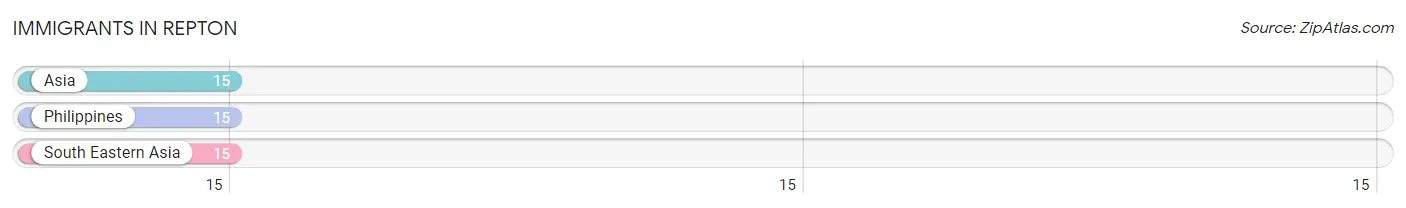
Immigrants in Repton
The most numerous immigrant groups reported in Repton came from Asia (15 | 5.2%), Philippines (15 | 5.2%), and South Eastern Asia (15 | 5.2%), together accounting for 15.6% of all Repton residents.
| Immigration Origin | # Population | % Population |
| Asia | 15 | 5.2% |
| Philippines | 15 | 5.2% |
| South Eastern Asia | 15 | 5.2% | View All 3 Rows |
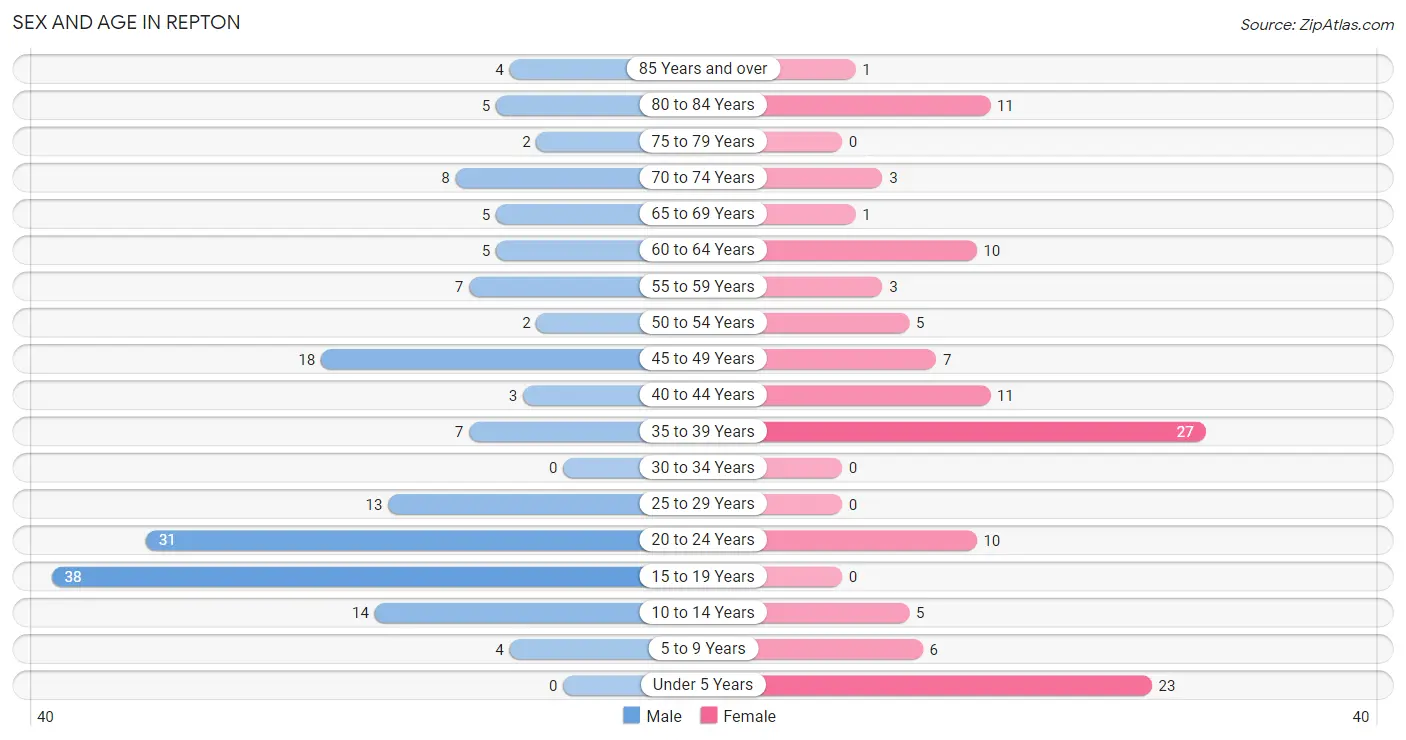
Sex and Age in Repton
Sex and Age in Repton
The most populous age groups in Repton are 15 to 19 Years (38 | 22.9%) for men and 35 to 39 Years (27 | 22.0%) for women.
| Age Bracket | Male | Female |
| Under 5 Years | 0 (0.0%) | 23 (18.7%) |
| 5 to 9 Years | 4 (2.4%) | 6 (4.9%) |
| 10 to 14 Years | 14 (8.4%) | 5 (4.1%) |
| 15 to 19 Years | 38 (22.9%) | 0 (0.0%) |
| 20 to 24 Years | 31 (18.7%) | 10 (8.1%) |
| 25 to 29 Years | 13 (7.8%) | 0 (0.0%) |
| 30 to 34 Years | 0 (0.0%) | 0 (0.0%) |
| 35 to 39 Years | 7 (4.2%) | 27 (22.0%) |
| 40 to 44 Years | 3 (1.8%) | 11 (8.9%) |
| 45 to 49 Years | 18 (10.8%) | 7 (5.7%) |
| 50 to 54 Years | 2 (1.2%) | 5 (4.1%) |
| 55 to 59 Years | 7 (4.2%) | 3 (2.4%) |
| 60 to 64 Years | 5 (3.0%) | 10 (8.1%) |
| 65 to 69 Years | 5 (3.0%) | 1 (0.8%) |
| 70 to 74 Years | 8 (4.8%) | 3 (2.4%) |
| 75 to 79 Years | 2 (1.2%) | 0 (0.0%) |
| 80 to 84 Years | 5 (3.0%) | 11 (8.9%) |
| 85 Years and over | 4 (2.4%) | 1 (0.8%) |
| Total | 166 (100.0%) | 123 (100.0%) |
Families and Households in Repton
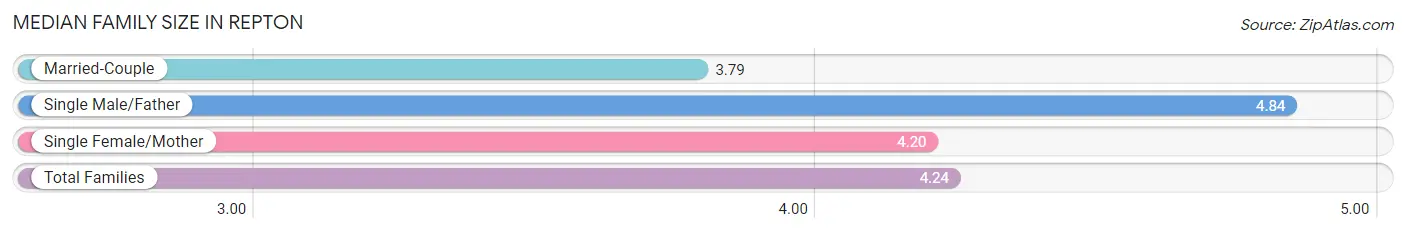
Median Family Size in Repton
The median family size in Repton is 4.24 persons per family, with single male/father families (19 | 32.8%) accounting for the largest median family size of 4.84 persons per family. On the other hand, married-couple families (24 | 41.4%) represent the smallest median family size with 3.79 persons per family.
| Family Type | # Families | Family Size |
| Married-Couple | 24 (41.4%) | 3.79 |
| Single Male/Father | 19 (32.8%) | 4.84 |
| Single Female/Mother | 15 (25.9%) | 4.20 |
| Total Families | 58 (100.0%) | 4.24 |
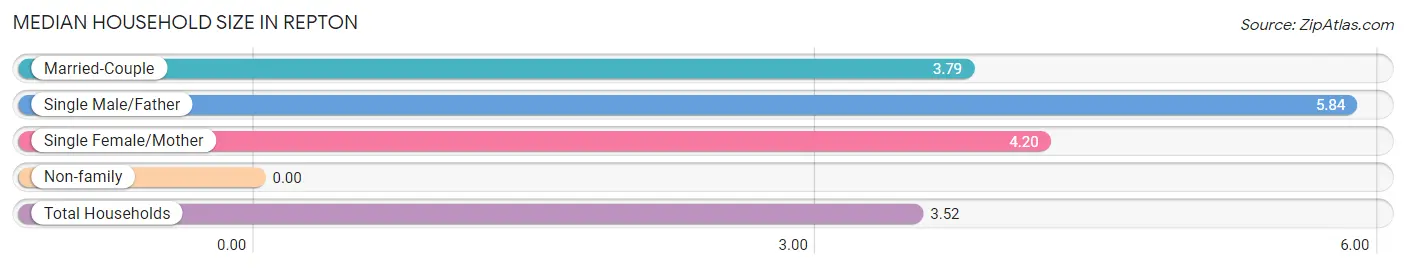
Median Household Size in Repton
| Household Type | # Households | Household Size |
| Married-Couple | 24 (29.3%) | 3.79 |
| Single Male/Father | 19 (23.2%) | 5.84 |
| Single Female/Mother | 15 (18.3%) | 4.20 |
| Non-family | 24 (29.3%) | - |
| Total Households | 82 (100.0%) | 3.52 |
Household Size by Marriage Status in Repton
Out of a total of 82 households in Repton, 58 (70.7%) are family households, while 24 (29.3%) are nonfamily households. The most numerous type of family households are 2-person households, comprising 19, and the most common type of nonfamily households are 1-person households, comprising 24.
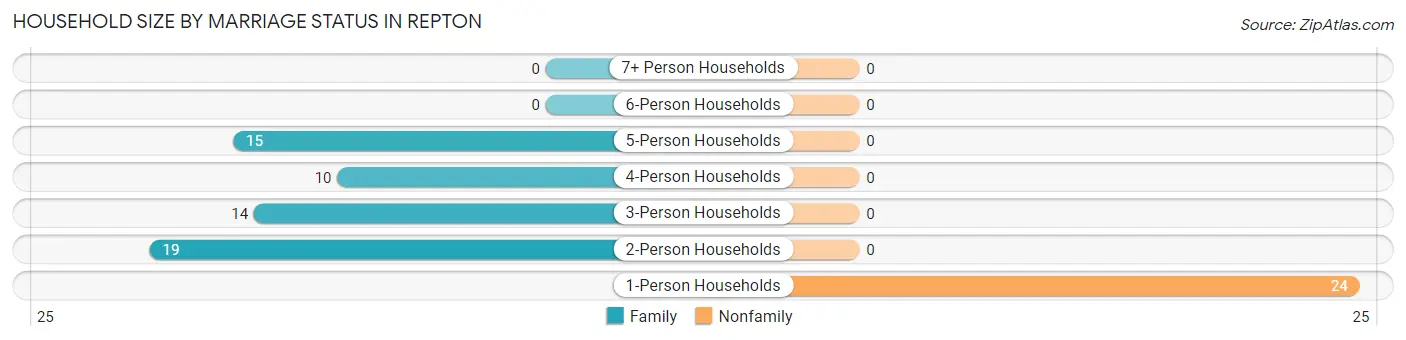
| Household Size | Family Households | Nonfamily Households |
| 1-Person Households | - | 24 (29.3%) |
| 2-Person Households | 19 (23.2%) | 0 (0.0%) |
| 3-Person Households | 14 (17.1%) | 0 (0.0%) |
| 4-Person Households | 10 (12.2%) | 0 (0.0%) |
| 5-Person Households | 15 (18.3%) | 0 (0.0%) |
| 6-Person Households | 0 (0.0%) | 0 (0.0%) |
| 7+ Person Households | 0 (0.0%) | 0 (0.0%) |
| Total | 58 (70.7%) | 24 (29.3%) |
Female Fertility in Repton
Fertility by Age in Repton
Average fertility rate in Repton is 70.0 births per 1,000 women. Women in the age bracket of 20 to 34 years have the highest fertility rate with 400.0 births per 1,000 women. Women in the age bracket of 20 to 34 years acount for 100.0% of all women with births.
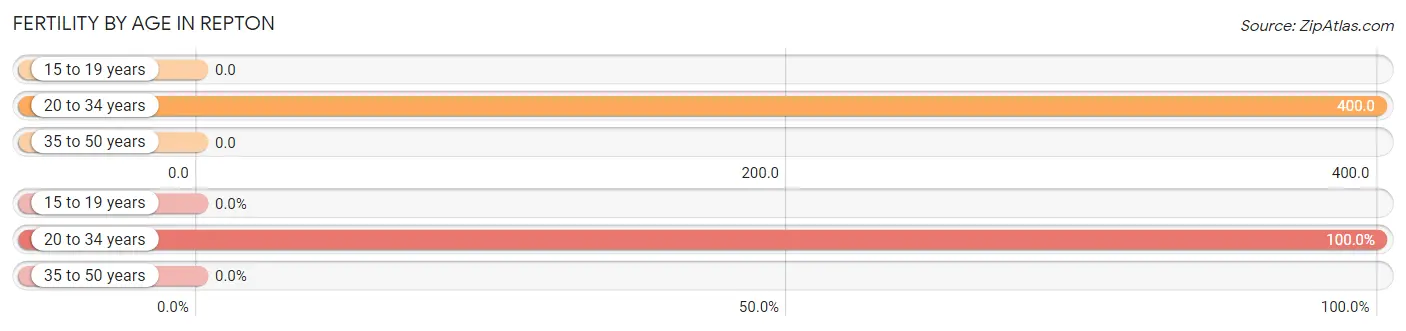
| Age Bracket | Women with Births | Births / 1,000 Women |
| 15 to 19 years | 0 (0.0%) | 0.0 |
| 20 to 34 years | 4 (100.0%) | 400.0 |
| 35 to 50 years | 0 (0.0%) | 0.0 |
| Total | 4 (100.0%) | 70.0 |
Fertility by Age by Marriage Status in Repton
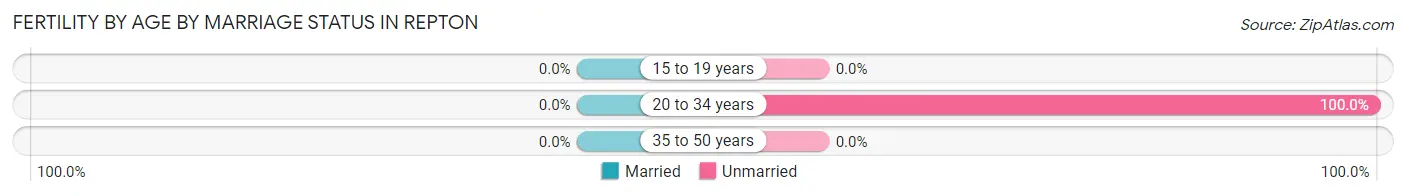
| Age Bracket | Married | Unmarried |
| 15 to 19 years | 0 (0.0%) | 0 (0.0%) |
| 20 to 34 years | 0 (0.0%) | 4 (100.0%) |
| 35 to 50 years | 0 (0.0%) | 0 (0.0%) |
| Total | 0 (0.0%) | 4 (100.0%) |
Fertility by Education in Repton
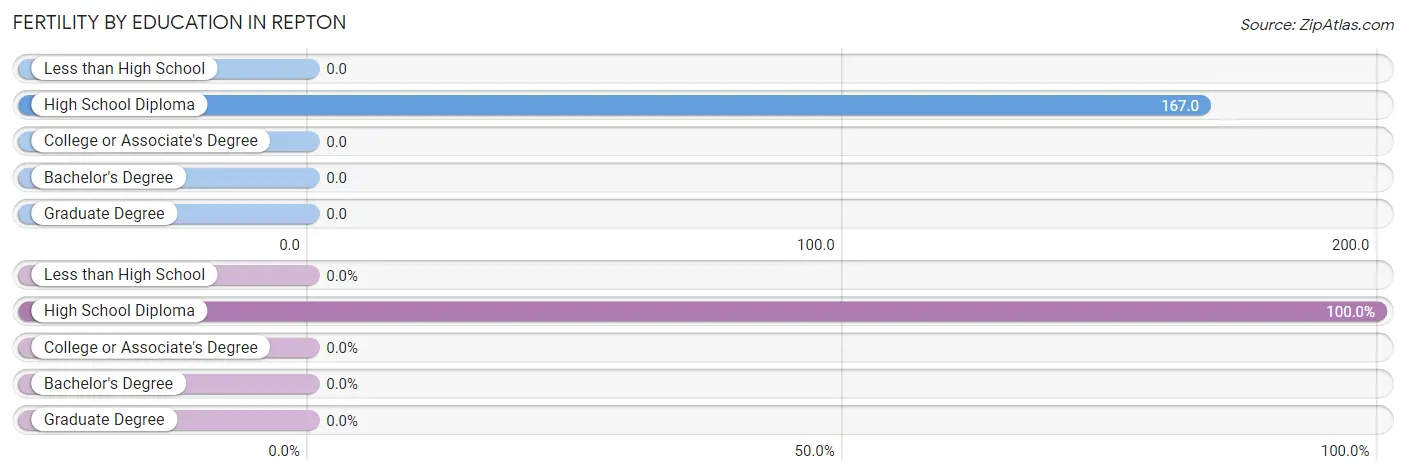
| Educational Attainment | Women with Births | Births / 1,000 Women |
| Less than High School | 0 (0.0%) | 0.0 |
| High School Diploma | 4 (100.0%) | 167.0 |
| College or Associate's Degree | 0 (0.0%) | 0.0 |
| Bachelor's Degree | 0 (0.0%) | 0.0 |
| Graduate Degree | 0 (0.0%) | 0.0 |
| Total | 4 (100.0%) | 70.0 |
Fertility by Education by Marriage Status in Repton
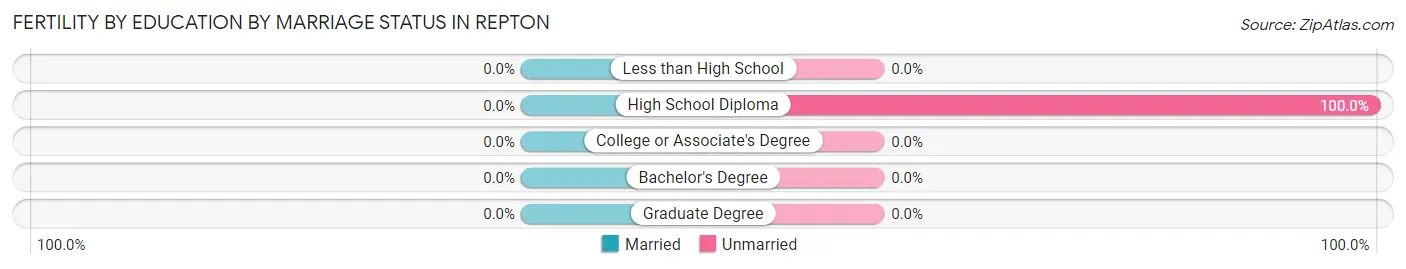
| Educational Attainment | Married | Unmarried |
| Less than High School | 0 (0.0%) | 0 (0.0%) |
| High School Diploma | 0 (0.0%) | 4 (100.0%) |
| College or Associate's Degree | 0 (0.0%) | 0 (0.0%) |
| Bachelor's Degree | 0 (0.0%) | 0 (0.0%) |
| Graduate Degree | 0 (0.0%) | 0 (0.0%) |
| Total | 0 (0.0%) | 4 (100.0%) |
Employment Characteristics in Repton
Employment by Class of Employer in Repton
Among the 103 employed individuals in Repton, private company employees (67 | 65.0%), self-employed (incorporated) (19 | 18.4%), and state government employees (7 | 6.8%) make up the most common classes of employment.
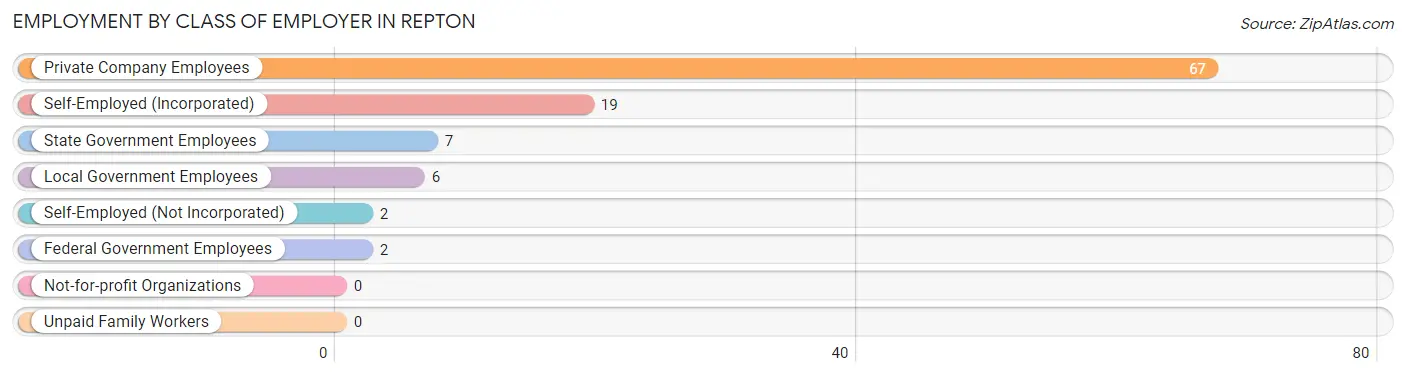
| Employer Class | # Employees | % Employees |
| Private Company Employees | 67 | 65.0% |
| Self-Employed (Incorporated) | 19 | 18.4% |
| Self-Employed (Not Incorporated) | 2 | 1.9% |
| Not-for-profit Organizations | 0 | 0.0% |
| Local Government Employees | 6 | 5.8% |
| State Government Employees | 7 | 6.8% |
| Federal Government Employees | 2 | 1.9% |
| Unpaid Family Workers | 0 | 0.0% |
| Total | 103 | 100.0% |
Employment Status by Age in Repton
According to the labor force statistics for Repton, out of the total population over 16 years of age (237), 45.1% or 107 individuals are in the labor force, with 3.7% or 4 of them unemployed. The age group with the highest labor force participation rate is 20 to 24 years, with 85.4% or 35 individuals in the labor force. Within the labor force, the 20 to 24 years age range has the highest percentage of unemployed individuals, with 11.4% or 4 of them being unemployed.
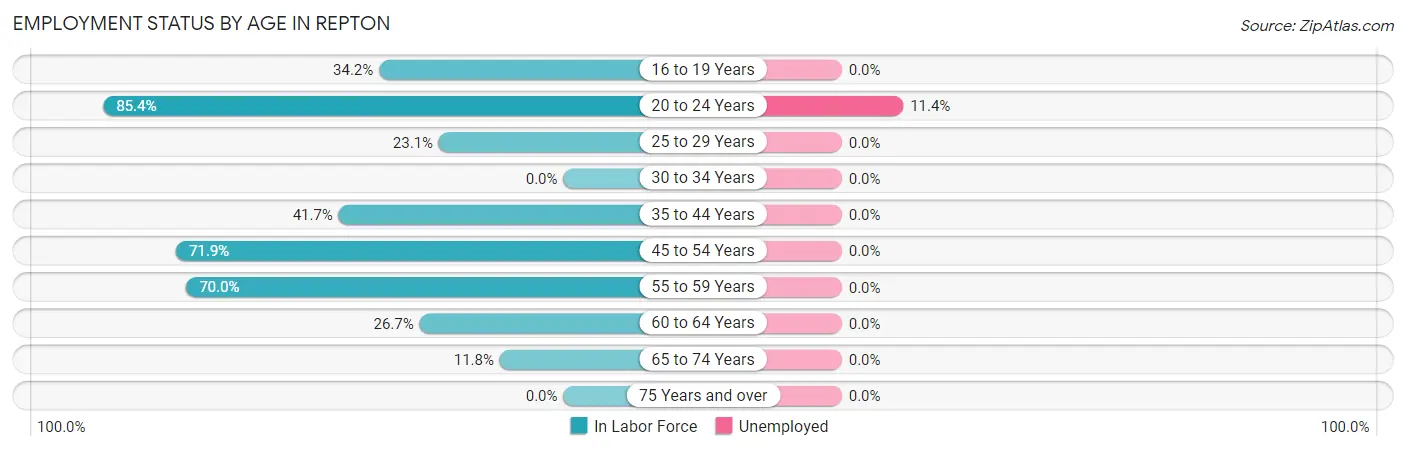
| Age Bracket | In Labor Force | Unemployed |
| 16 to 19 Years | 13 (34.2%) | 0 (0.0%) |
| 20 to 24 Years | 35 (85.4%) | 4 (11.4%) |
| 25 to 29 Years | 3 (23.1%) | 0 (0.0%) |
| 30 to 34 Years | 0 (0.0%) | 0 (0.0%) |
| 35 to 44 Years | 20 (41.7%) | 0 (0.0%) |
| 45 to 54 Years | 23 (71.9%) | 0 (0.0%) |
| 55 to 59 Years | 7 (70.0%) | 0 (0.0%) |
| 60 to 64 Years | 4 (26.7%) | 0 (0.0%) |
| 65 to 74 Years | 2 (11.8%) | 0 (0.0%) |
| 75 Years and over | 0 (0.0%) | 0 (0.0%) |
| Total | 107 (45.1%) | 4 (3.7%) |
Employment Status by Educational Attainment in Repton
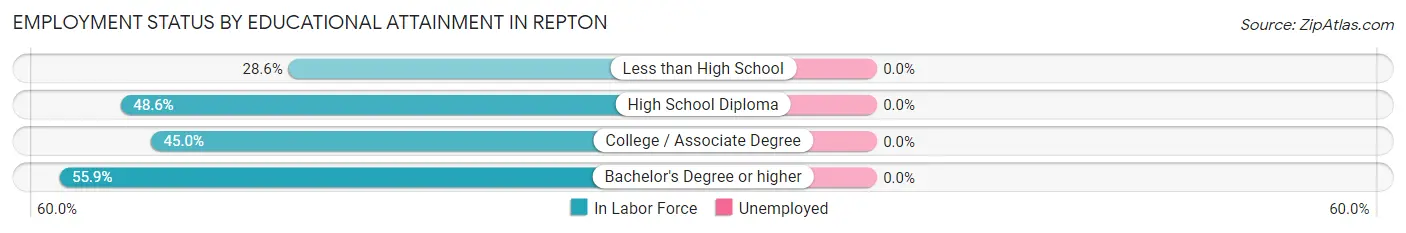
| Educational Attainment | In Labor Force | Unemployed |
| Less than High School | 2 (28.6%) | 0 (0.0%) |
| High School Diploma | 18 (48.6%) | 0 (0.0%) |
| College / Associate Degree | 18 (45.0%) | 0 (0.0%) |
| Bachelor's Degree or higher | 19 (55.9%) | 0 (0.0%) |
| Total | 57 (48.3%) | 0 (0.0%) |
Employment Occupations by Sex in Repton
Management, Business, Science and Arts Occupations
The most common Management, Business, Science and Arts occupations in Repton are Community & Social Service (13 | 12.6%), Education Instruction & Library (13 | 12.6%), and Management (4 | 3.9%).
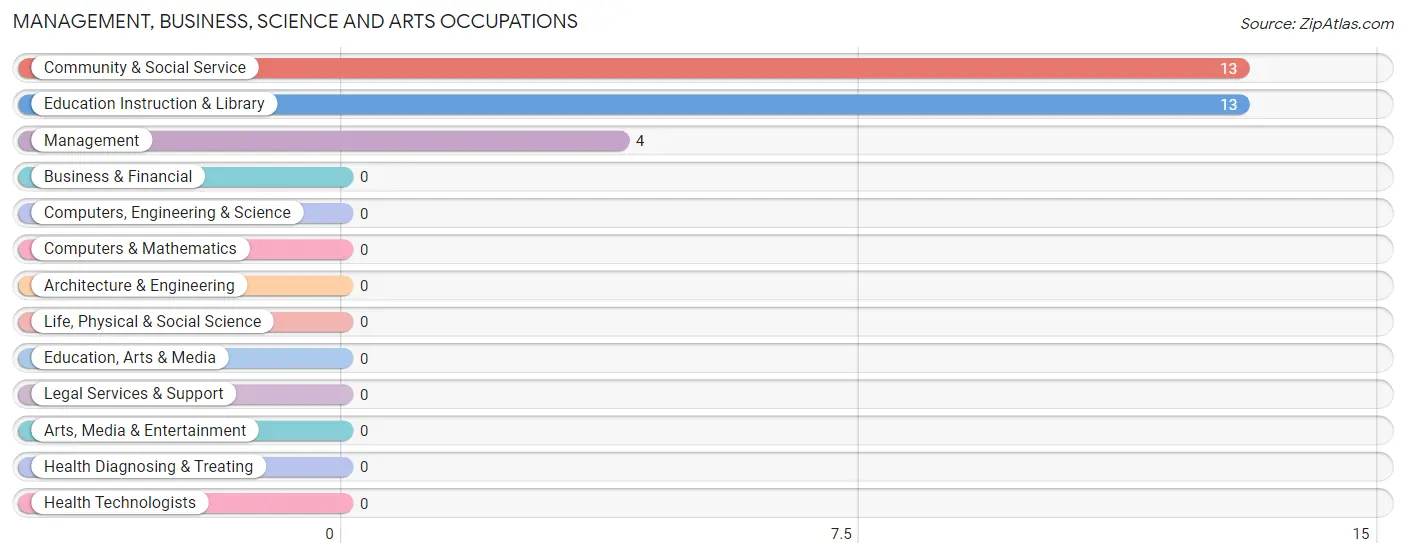
Management, Business, Science and Arts Occupations by Sex
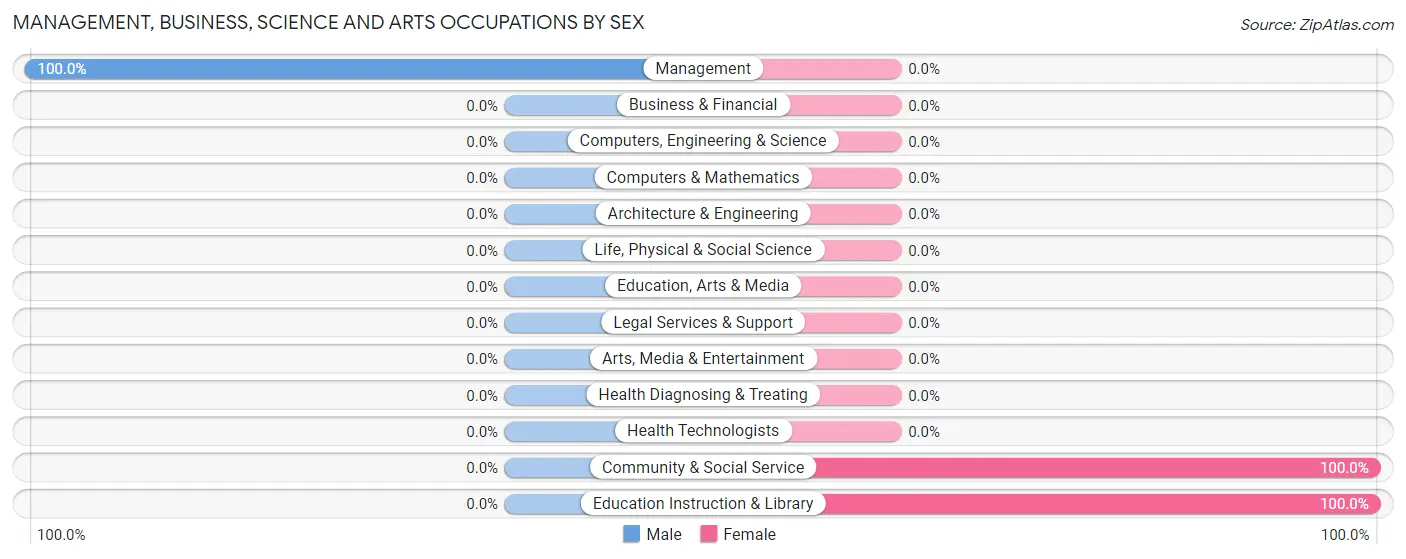
| Occupation | Male | Female |
| Management | 4 (100.0%) | 0 (0.0%) |
| Business & Financial | 0 (0.0%) | 0 (0.0%) |
| Computers, Engineering & Science | 0 (0.0%) | 0 (0.0%) |
| Computers & Mathematics | 0 (0.0%) | 0 (0.0%) |
| Architecture & Engineering | 0 (0.0%) | 0 (0.0%) |
| Life, Physical & Social Science | 0 (0.0%) | 0 (0.0%) |
| Community & Social Service | 0 (0.0%) | 13 (100.0%) |
| Education, Arts & Media | 0 (0.0%) | 0 (0.0%) |
| Legal Services & Support | 0 (0.0%) | 0 (0.0%) |
| Education Instruction & Library | 0 (0.0%) | 13 (100.0%) |
| Arts, Media & Entertainment | 0 (0.0%) | 0 (0.0%) |
| Health Diagnosing & Treating | 0 (0.0%) | 0 (0.0%) |
| Health Technologists | 0 (0.0%) | 0 (0.0%) |
| Total (Category) | 4 (23.5%) | 13 (76.5%) |
| Total (Overall) | 81 (78.6%) | 22 (21.4%) |
Services Occupations
The most common Services occupations in Repton are Food Preparation & Serving (14 | 13.6%), and Cleaning & Maintenance (5 | 4.9%).
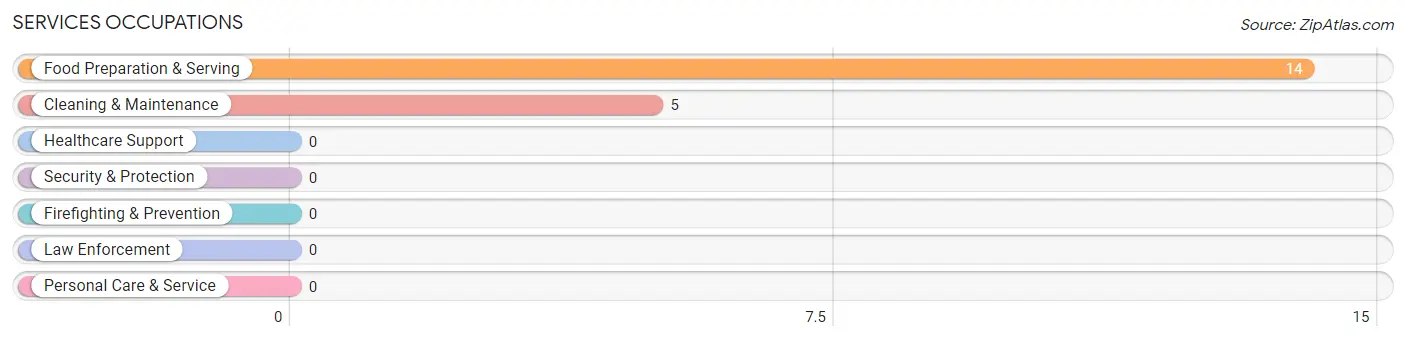
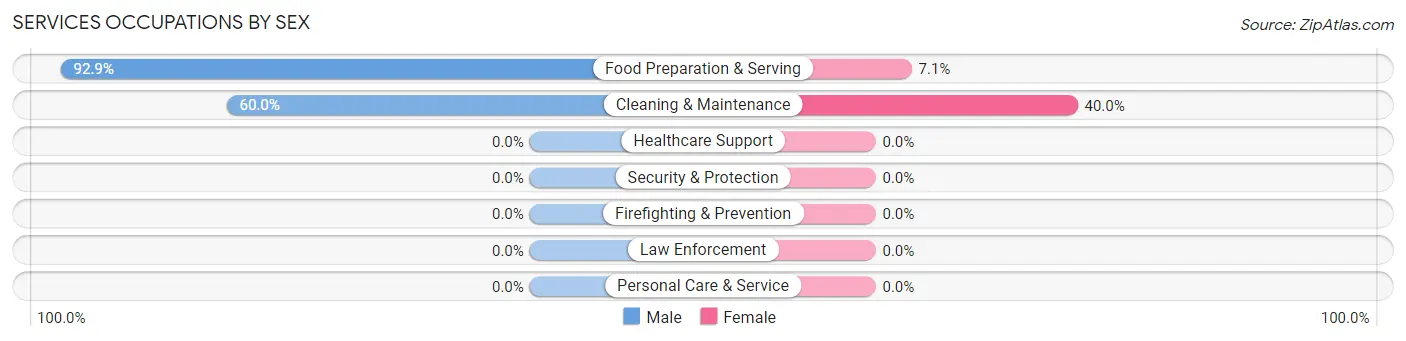
Services Occupations by Sex
Within the Services occupations in Repton, the most male-oriented occupations are Food Preparation & Serving (92.9%), and Cleaning & Maintenance (60.0%), while the most female-oriented occupations are Cleaning & Maintenance (40.0%), and Food Preparation & Serving (7.1%).
| Occupation | Male | Female |
| Healthcare Support | 0 (0.0%) | 0 (0.0%) |
| Security & Protection | 0 (0.0%) | 0 (0.0%) |
| Firefighting & Prevention | 0 (0.0%) | 0 (0.0%) |
| Law Enforcement | 0 (0.0%) | 0 (0.0%) |
| Food Preparation & Serving | 13 (92.9%) | 1 (7.1%) |
| Cleaning & Maintenance | 3 (60.0%) | 2 (40.0%) |
| Personal Care & Service | 0 (0.0%) | 0 (0.0%) |
| Total (Category) | 16 (84.2%) | 3 (15.8%) |
| Total (Overall) | 81 (78.6%) | 22 (21.4%) |
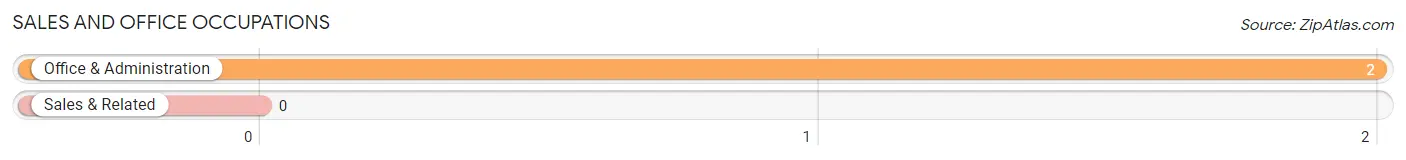
Sales and Office Occupations
The most common Sales and Office occupations in Repton are , and Office & Administration (2 | 1.9%).
Sales and Office Occupations by Sex
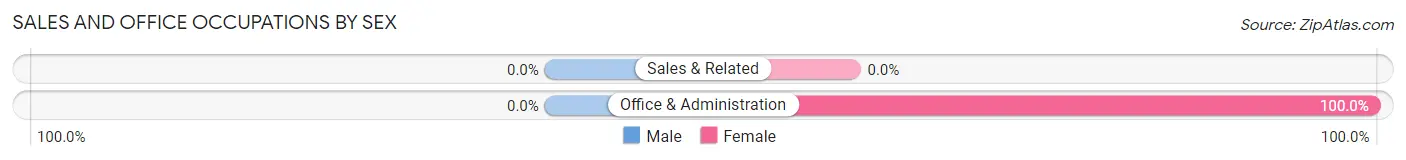
| Occupation | Male | Female |
| Sales & Related | 0 (0.0%) | 0 (0.0%) |
| Office & Administration | 0 (0.0%) | 2 (100.0%) |
| Total (Category) | 0 (0.0%) | 2 (100.0%) |
| Total (Overall) | 81 (78.6%) | 22 (21.4%) |
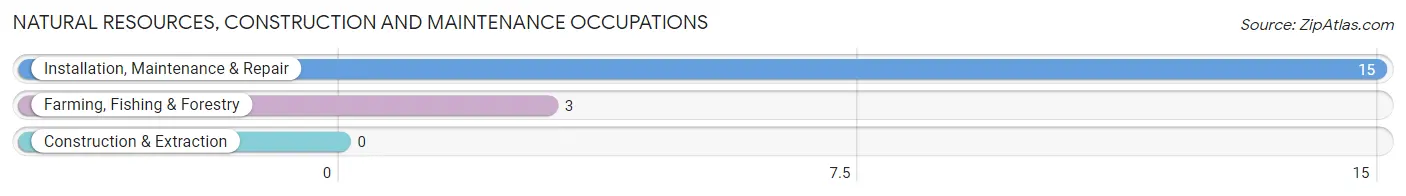
Natural Resources, Construction and Maintenance Occupations
The most common Natural Resources, Construction and Maintenance occupations in Repton are Installation, Maintenance & Repair (15 | 14.6%), and Farming, Fishing & Forestry (3 | 2.9%).
Natural Resources, Construction and Maintenance Occupations by Sex
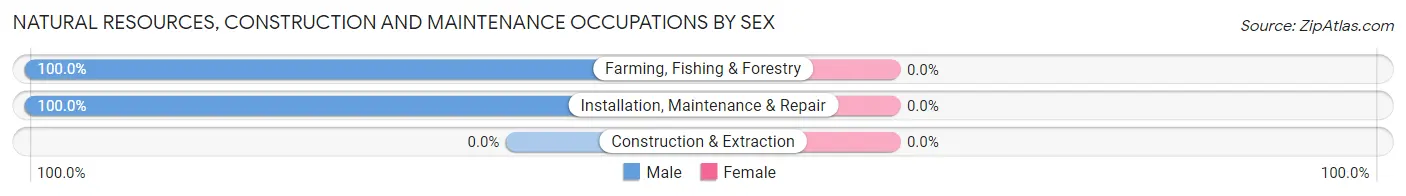
| Occupation | Male | Female |
| Farming, Fishing & Forestry | 3 (100.0%) | 0 (0.0%) |
| Construction & Extraction | 0 (0.0%) | 0 (0.0%) |
| Installation, Maintenance & Repair | 15 (100.0%) | 0 (0.0%) |
| Total (Category) | 18 (100.0%) | 0 (0.0%) |
| Total (Overall) | 81 (78.6%) | 22 (21.4%) |
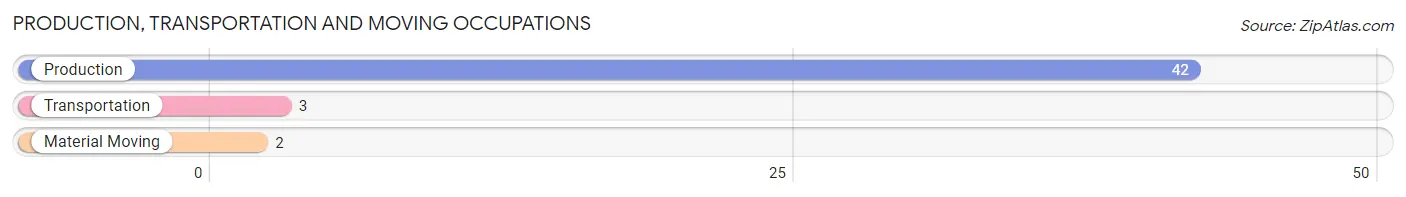
Production, Transportation and Moving Occupations
The most common Production, Transportation and Moving occupations in Repton are Production (42 | 40.8%), Transportation (3 | 2.9%), and Material Moving (2 | 1.9%).
Production, Transportation and Moving Occupations by Sex
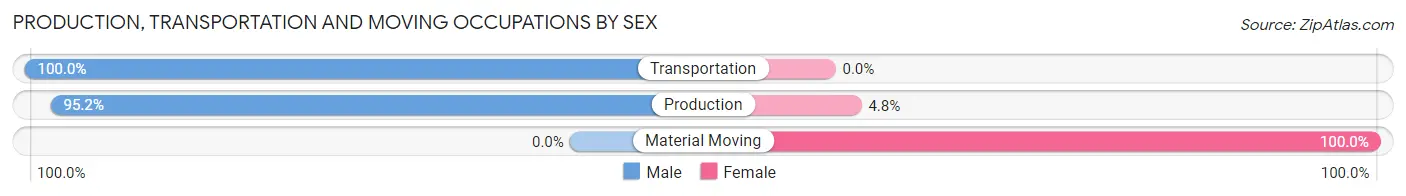
| Occupation | Male | Female |
| Production | 40 (95.2%) | 2 (4.8%) |
| Transportation | 3 (100.0%) | 0 (0.0%) |
| Material Moving | 0 (0.0%) | 2 (100.0%) |
| Total (Category) | 43 (91.5%) | 4 (8.5%) |
| Total (Overall) | 81 (78.6%) | 22 (21.4%) |
Employment Industries by Sex in Repton
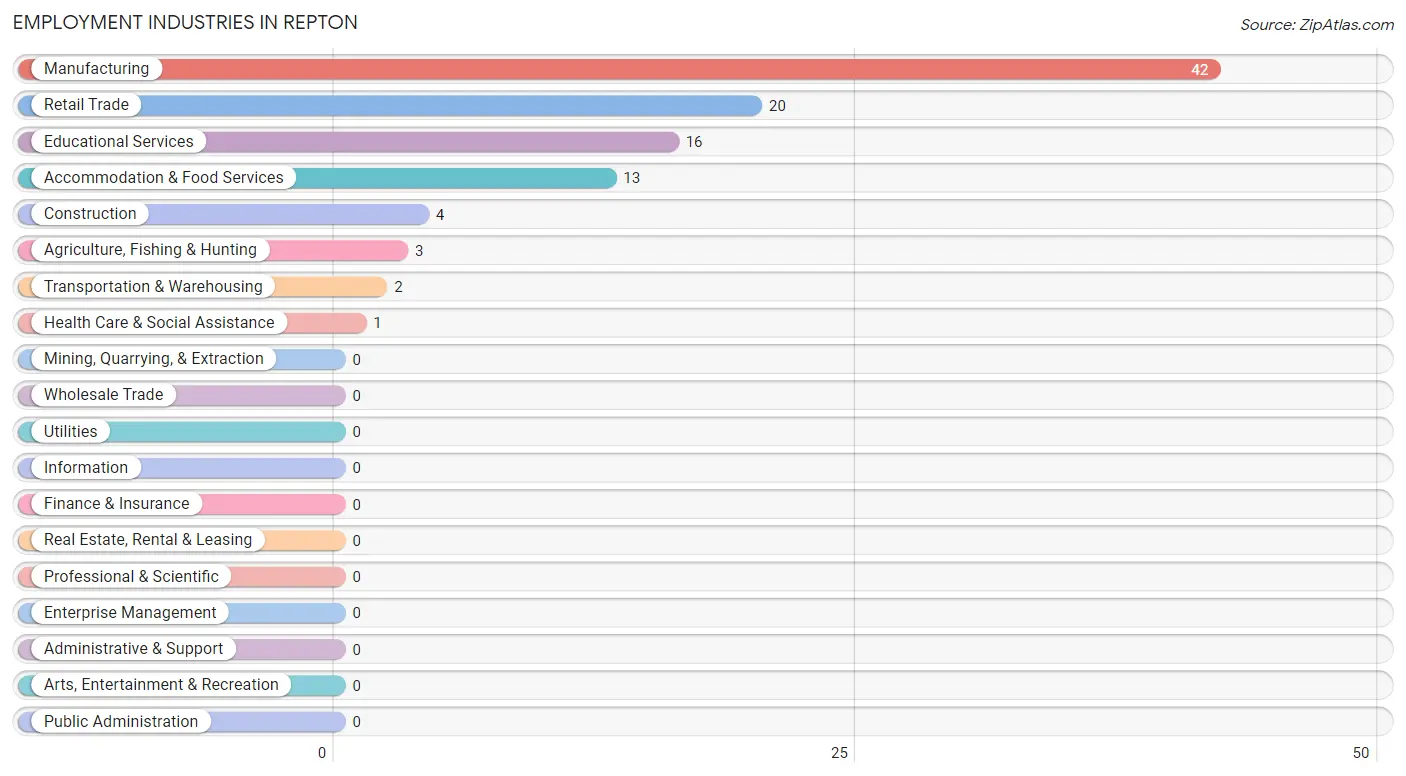
Employment Industries in Repton
The major employment industries in Repton include Manufacturing (42 | 40.8%), Retail Trade (20 | 19.4%), Educational Services (16 | 15.5%), Accommodation & Food Services (13 | 12.6%), and Construction (4 | 3.9%).
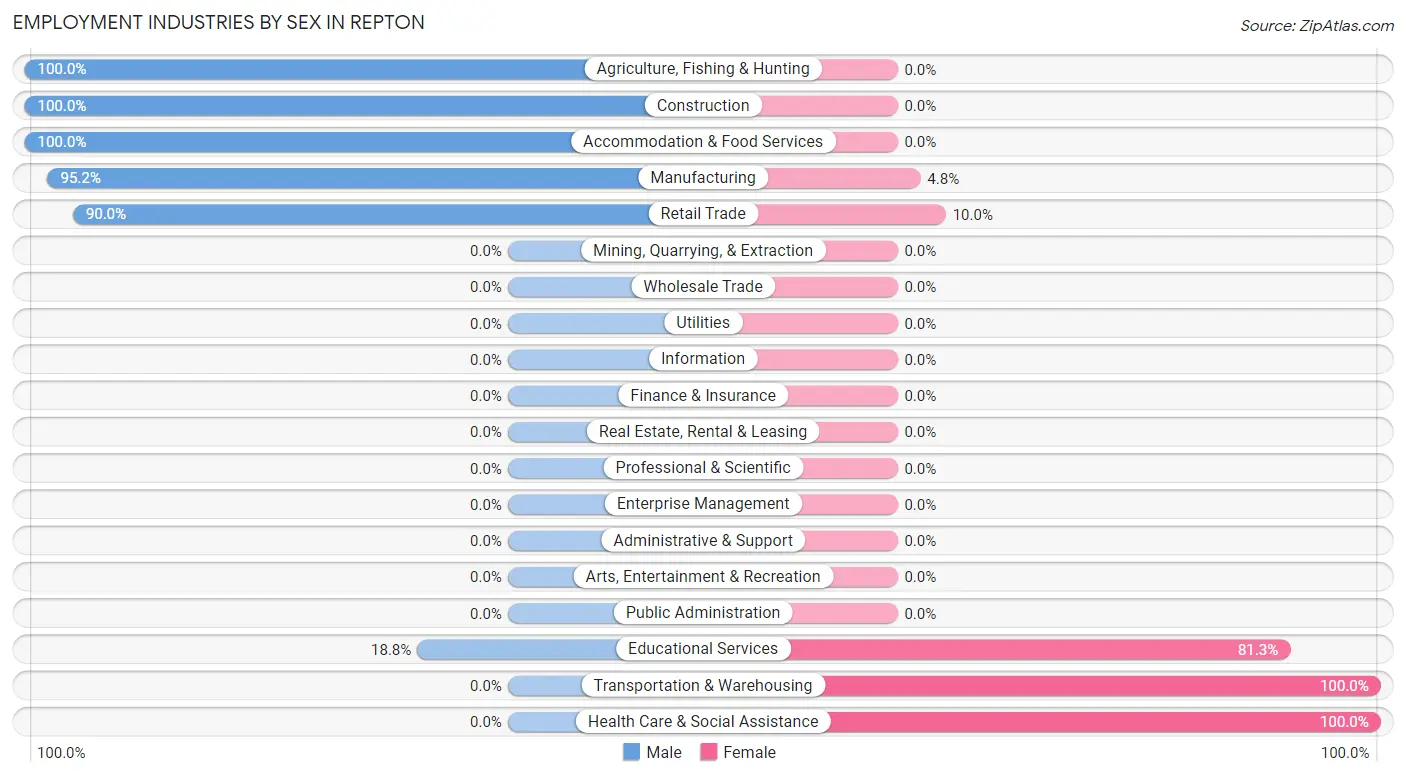
Employment Industries by Sex in Repton
The Repton industries that see more men than women are Agriculture, Fishing & Hunting (100.0%), Construction (100.0%), and Accommodation & Food Services (100.0%), whereas the industries that tend to have a higher number of women are Transportation & Warehousing (100.0%), Health Care & Social Assistance (100.0%), and Educational Services (81.2%).
| Industry | Male | Female |
| Agriculture, Fishing & Hunting | 3 (100.0%) | 0 (0.0%) |
| Mining, Quarrying, & Extraction | 0 (0.0%) | 0 (0.0%) |
| Construction | 4 (100.0%) | 0 (0.0%) |
| Manufacturing | 40 (95.2%) | 2 (4.8%) |
| Wholesale Trade | 0 (0.0%) | 0 (0.0%) |
| Retail Trade | 18 (90.0%) | 2 (10.0%) |
| Transportation & Warehousing | 0 (0.0%) | 2 (100.0%) |
| Utilities | 0 (0.0%) | 0 (0.0%) |
| Information | 0 (0.0%) | 0 (0.0%) |
| Finance & Insurance | 0 (0.0%) | 0 (0.0%) |
| Real Estate, Rental & Leasing | 0 (0.0%) | 0 (0.0%) |
| Professional & Scientific | 0 (0.0%) | 0 (0.0%) |
| Enterprise Management | 0 (0.0%) | 0 (0.0%) |
| Administrative & Support | 0 (0.0%) | 0 (0.0%) |
| Educational Services | 3 (18.8%) | 13 (81.2%) |
| Health Care & Social Assistance | 0 (0.0%) | 1 (100.0%) |
| Arts, Entertainment & Recreation | 0 (0.0%) | 0 (0.0%) |
| Accommodation & Food Services | 13 (100.0%) | 0 (0.0%) |
| Public Administration | 0 (0.0%) | 0 (0.0%) |
| Total | 81 (78.6%) | 22 (21.4%) |
Education in Repton
School Enrollment in Repton
The most common levels of schooling among the 87 students in Repton are high school (35 | 40.2%), college / undergraduate (31 | 35.6%), and elementary school (10 | 11.5%).
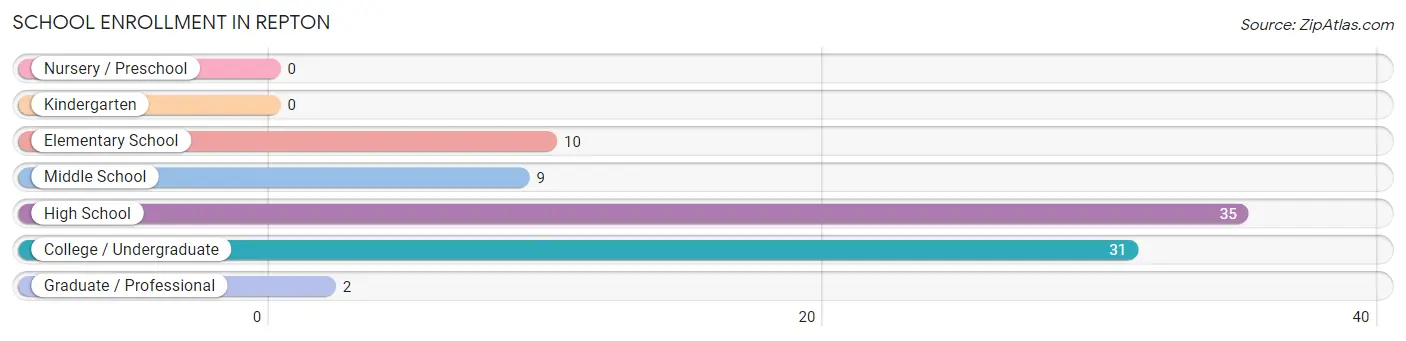
| School Level | # Students | % Students |
| Nursery / Preschool | 0 | 0.0% |
| Kindergarten | 0 | 0.0% |
| Elementary School | 10 | 11.5% |
| Middle School | 9 | 10.3% |
| High School | 35 | 40.2% |
| College / Undergraduate | 31 | 35.6% |
| Graduate / Professional | 2 | 2.3% |
| Total | 87 | 100.0% |
School Enrollment by Age by Funding Source in Repton
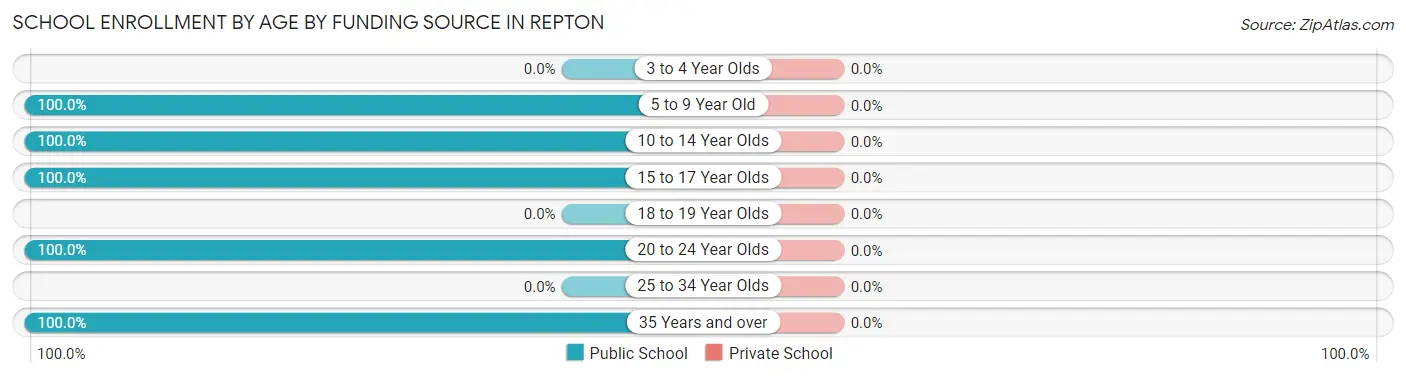
| Age Bracket | Public School | Private School |
| 3 to 4 Year Olds | 0 (0.0%) | 0 (0.0%) |
| 5 to 9 Year Old | 10 (100.0%) | 0 (0.0%) |
| 10 to 14 Year Olds | 19 (100.0%) | 0 (0.0%) |
| 15 to 17 Year Olds | 25 (100.0%) | 0 (0.0%) |
| 18 to 19 Year Olds | 0 (0.0%) | 0 (0.0%) |
| 20 to 24 Year Olds | 24 (100.0%) | 0 (0.0%) |
| 25 to 34 Year Olds | 0 (0.0%) | 0 (0.0%) |
| 35 Years and over | 9 (100.0%) | 0 (0.0%) |
| Total | 87 (100.0%) | 0 (0.0%) |
Educational Attainment by Field of Study in Repton
Social sciences (15 | 36.6%), education (11 | 26.8%), science & technology (7 | 17.1%), psychology (5 | 12.2%), and arts & humanities (2 | 4.9%) are the most common fields of study among 41 individuals in Repton who have obtained a bachelor's degree or higher.
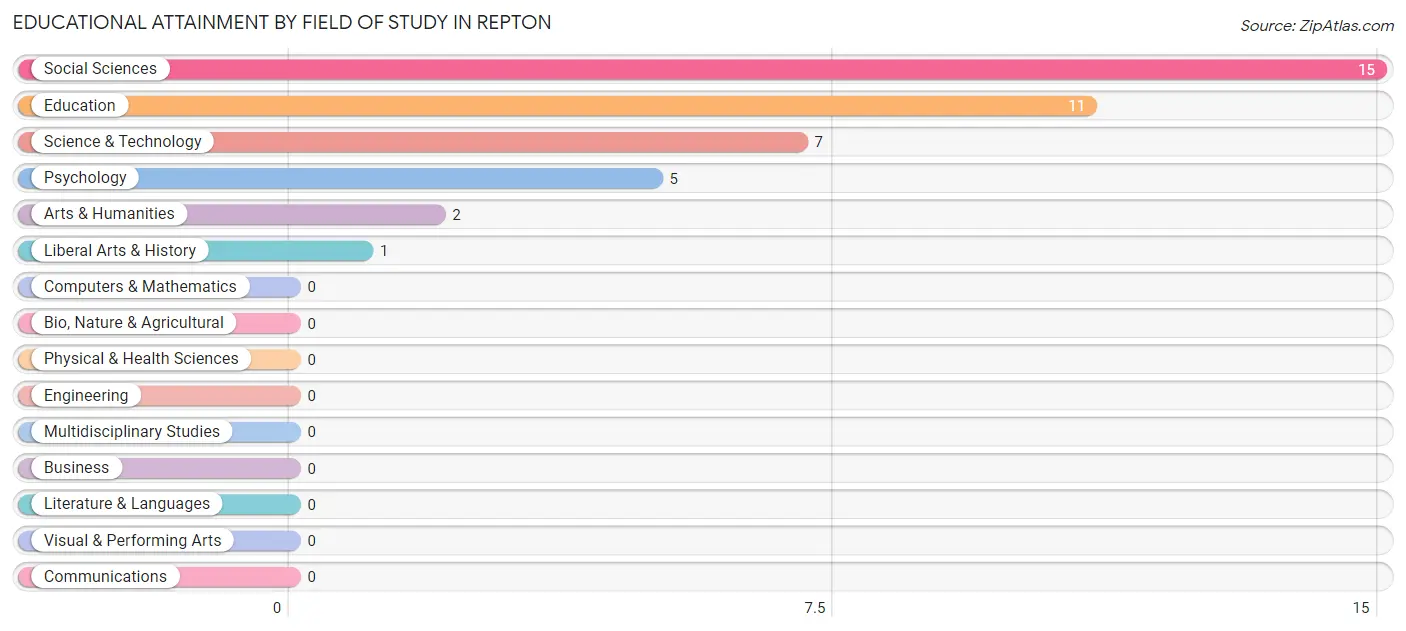
| Field of Study | # Graduates | % Graduates |
| Computers & Mathematics | 0 | 0.0% |
| Bio, Nature & Agricultural | 0 | 0.0% |
| Physical & Health Sciences | 0 | 0.0% |
| Psychology | 5 | 12.2% |
| Social Sciences | 15 | 36.6% |
| Engineering | 0 | 0.0% |
| Multidisciplinary Studies | 0 | 0.0% |
| Science & Technology | 7 | 17.1% |
| Business | 0 | 0.0% |
| Education | 11 | 26.8% |
| Literature & Languages | 0 | 0.0% |
| Liberal Arts & History | 1 | 2.4% |
| Visual & Performing Arts | 0 | 0.0% |
| Communications | 0 | 0.0% |
| Arts & Humanities | 2 | 4.9% |
| Total | 41 | 100.0% |
Transportation & Commute in Repton
Vehicle Availability by Sex in Repton
The most prevalent vehicle ownership categories in Repton are males with 3 vehicles (43, accounting for 53.1%) and females with 3 vehicles (8, making up 195.4%).
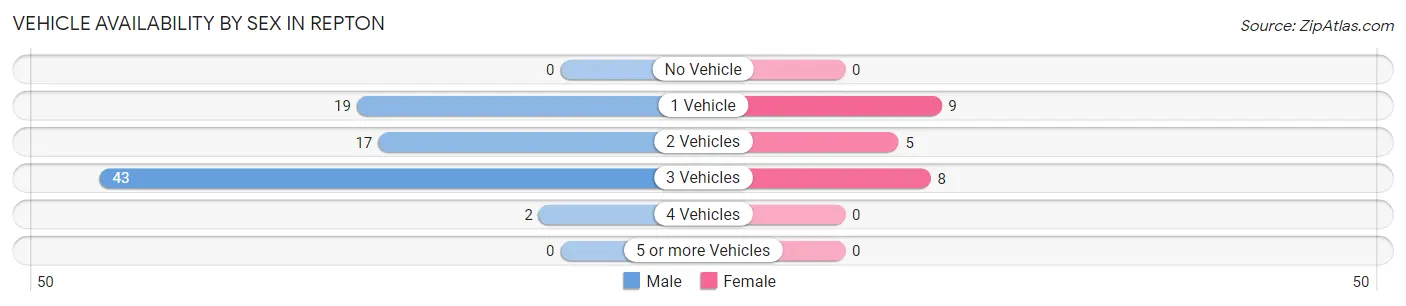
| Vehicles Available | Male | Female |
| No Vehicle | 0 (0.0%) | 0 (0.0%) |
| 1 Vehicle | 19 (23.5%) | 9 (40.9%) |
| 2 Vehicles | 17 (21.0%) | 5 (22.7%) |
| 3 Vehicles | 43 (53.1%) | 8 (36.4%) |
| 4 Vehicles | 2 (2.5%) | 0 (0.0%) |
| 5 or more Vehicles | 0 (0.0%) | 0 (0.0%) |
| Total | 81 (100.0%) | 22 (100.0%) |
Commute Time in Repton
The most frequently occuring commute durations in Repton are 10 to 14 minutes (45 commuters, 43.7%), 45 to 59 minutes (19 commuters, 18.4%), and 30 to 34 minutes (14 commuters, 13.6%).
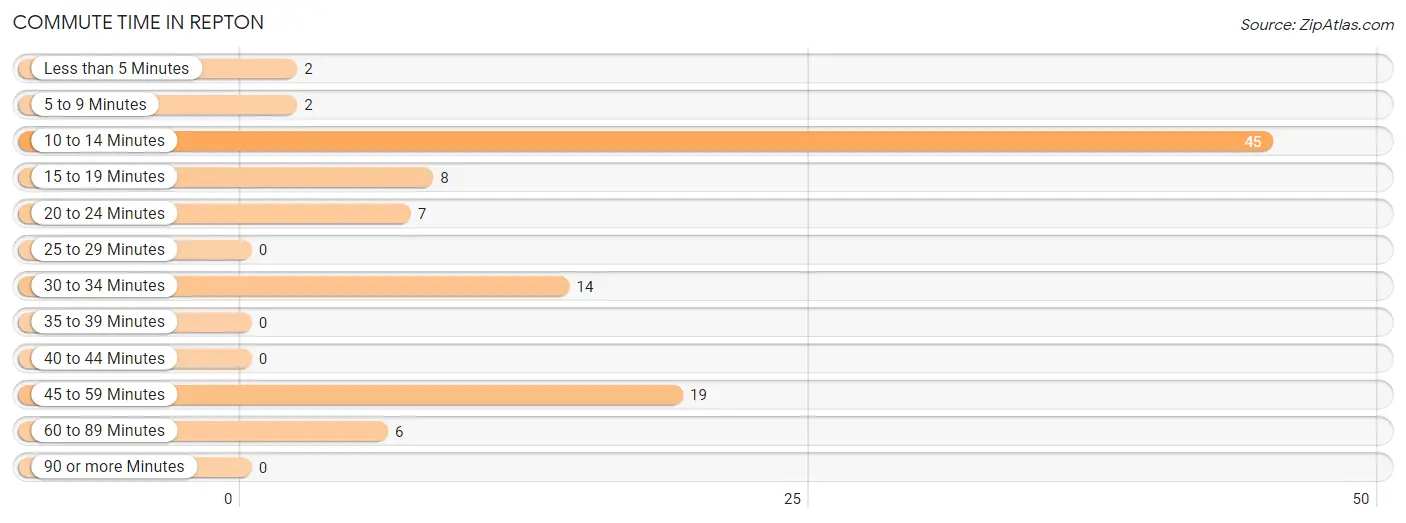
| Commute Time | # Commuters | % Commuters |
| Less than 5 Minutes | 2 | 1.9% |
| 5 to 9 Minutes | 2 | 1.9% |
| 10 to 14 Minutes | 45 | 43.7% |
| 15 to 19 Minutes | 8 | 7.8% |
| 20 to 24 Minutes | 7 | 6.8% |
| 25 to 29 Minutes | 0 | 0.0% |
| 30 to 34 Minutes | 14 | 13.6% |
| 35 to 39 Minutes | 0 | 0.0% |
| 40 to 44 Minutes | 0 | 0.0% |
| 45 to 59 Minutes | 19 | 18.4% |
| 60 to 89 Minutes | 6 | 5.8% |
| 90 or more Minutes | 0 | 0.0% |
Commute Time by Sex in Repton
The most common commute times in Repton are 10 to 14 minutes (43 commuters, 53.1%) for males and 30 to 34 minutes (14 commuters, 63.6%) for females.
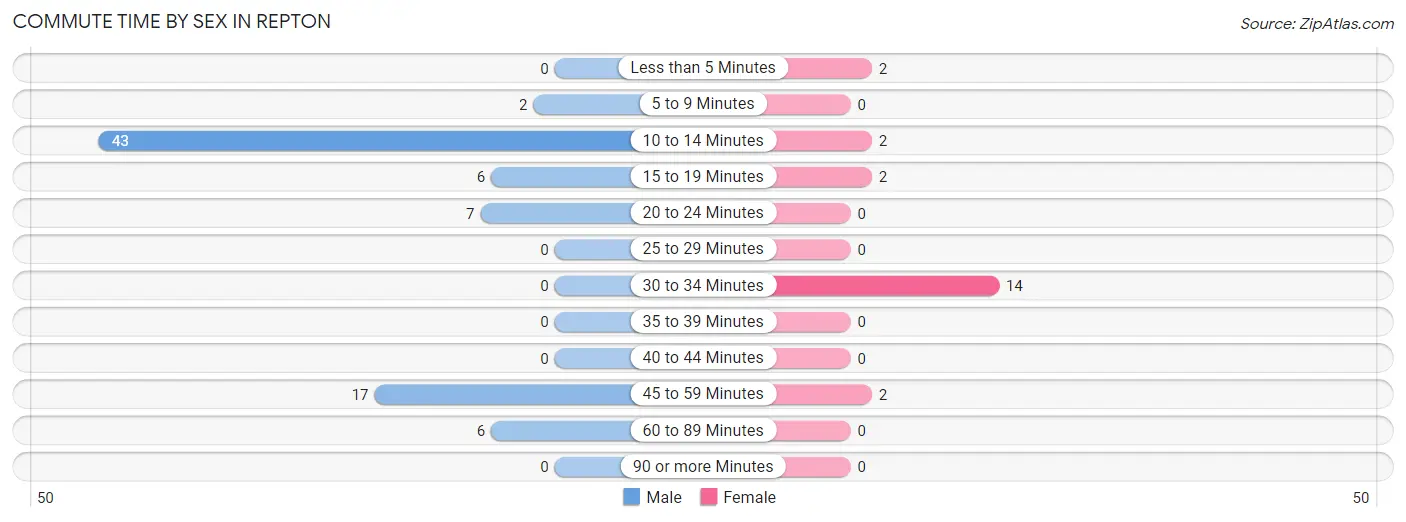
| Commute Time | Male | Female |
| Less than 5 Minutes | 0 (0.0%) | 2 (9.1%) |
| 5 to 9 Minutes | 2 (2.5%) | 0 (0.0%) |
| 10 to 14 Minutes | 43 (53.1%) | 2 (9.1%) |
| 15 to 19 Minutes | 6 (7.4%) | 2 (9.1%) |
| 20 to 24 Minutes | 7 (8.6%) | 0 (0.0%) |
| 25 to 29 Minutes | 0 (0.0%) | 0 (0.0%) |
| 30 to 34 Minutes | 0 (0.0%) | 14 (63.6%) |
| 35 to 39 Minutes | 0 (0.0%) | 0 (0.0%) |
| 40 to 44 Minutes | 0 (0.0%) | 0 (0.0%) |
| 45 to 59 Minutes | 17 (21.0%) | 2 (9.1%) |
| 60 to 89 Minutes | 6 (7.4%) | 0 (0.0%) |
| 90 or more Minutes | 0 (0.0%) | 0 (0.0%) |
Time of Departure to Work by Sex in Repton
The most frequent times of departure to work in Repton are 6:00 AM to 6:29 AM (37, 45.7%) for males and 6:00 AM to 6:29 AM (9, 40.9%) for females.
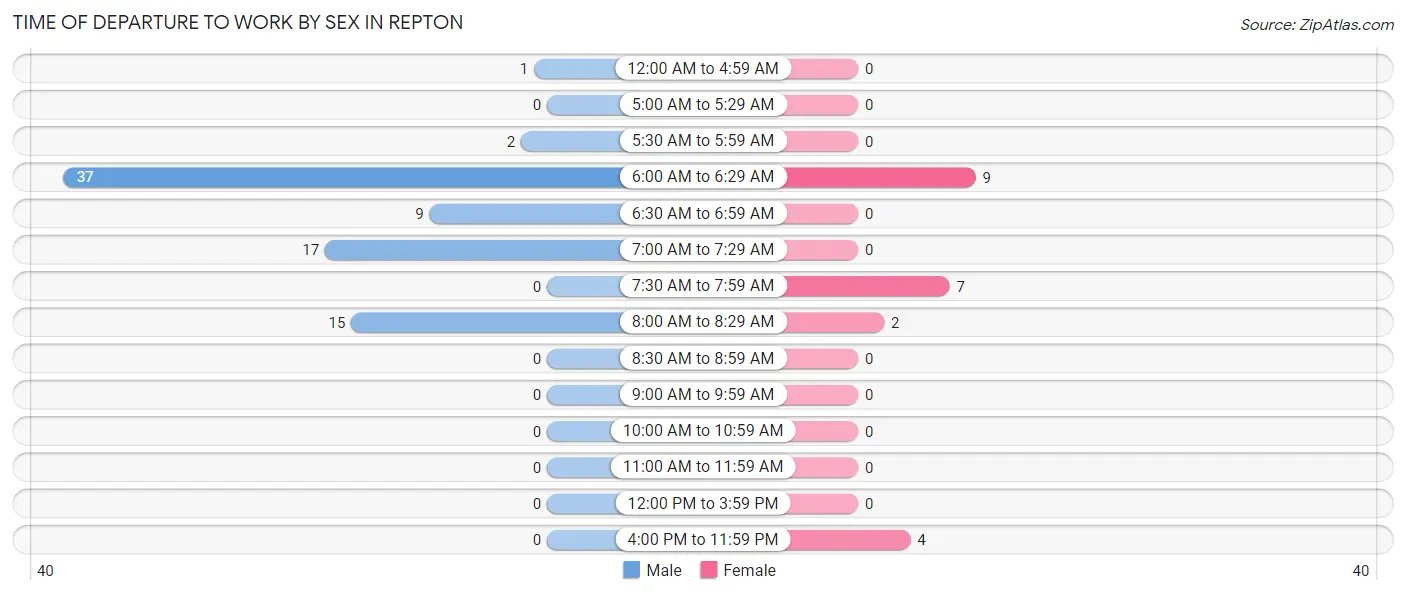
| Time of Departure | Male | Female |
| 12:00 AM to 4:59 AM | 1 (1.2%) | 0 (0.0%) |
| 5:00 AM to 5:29 AM | 0 (0.0%) | 0 (0.0%) |
| 5:30 AM to 5:59 AM | 2 (2.5%) | 0 (0.0%) |
| 6:00 AM to 6:29 AM | 37 (45.7%) | 9 (40.9%) |
| 6:30 AM to 6:59 AM | 9 (11.1%) | 0 (0.0%) |
| 7:00 AM to 7:29 AM | 17 (21.0%) | 0 (0.0%) |
| 7:30 AM to 7:59 AM | 0 (0.0%) | 7 (31.8%) |
| 8:00 AM to 8:29 AM | 15 (18.5%) | 2 (9.1%) |
| 8:30 AM to 8:59 AM | 0 (0.0%) | 0 (0.0%) |
| 9:00 AM to 9:59 AM | 0 (0.0%) | 0 (0.0%) |
| 10:00 AM to 10:59 AM | 0 (0.0%) | 0 (0.0%) |
| 11:00 AM to 11:59 AM | 0 (0.0%) | 0 (0.0%) |
| 12:00 PM to 3:59 PM | 0 (0.0%) | 0 (0.0%) |
| 4:00 PM to 11:59 PM | 0 (0.0%) | 4 (18.2%) |
| Total | 81 (100.0%) | 22 (100.0%) |
Housing Occupancy in Repton
Occupancy by Ownership in Repton
Of the total 82 dwellings in Repton, owner-occupied units account for 73 (89.0%), while renter-occupied units make up 9 (11.0%).
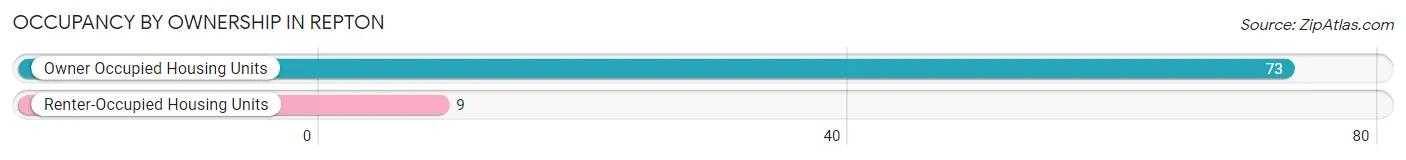
| Occupancy | # Housing Units | % Housing Units |
| Owner Occupied Housing Units | 73 | 89.0% |
| Renter-Occupied Housing Units | 9 | 11.0% |
| Total Occupied Housing Units | 82 | 100.0% |
Occupancy by Household Size in Repton
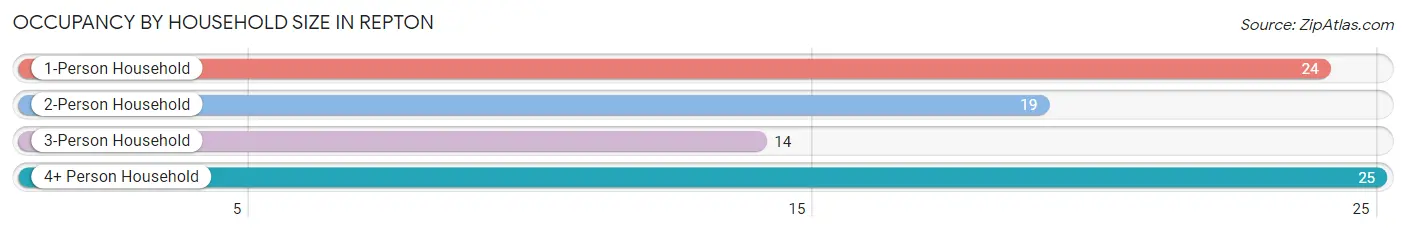
| Household Size | # Housing Units | % Housing Units |
| 1-Person Household | 24 | 29.3% |
| 2-Person Household | 19 | 23.2% |
| 3-Person Household | 14 | 17.1% |
| 4+ Person Household | 25 | 30.5% |
| Total Housing Units | 82 | 100.0% |
Occupancy by Ownership by Household Size in Repton
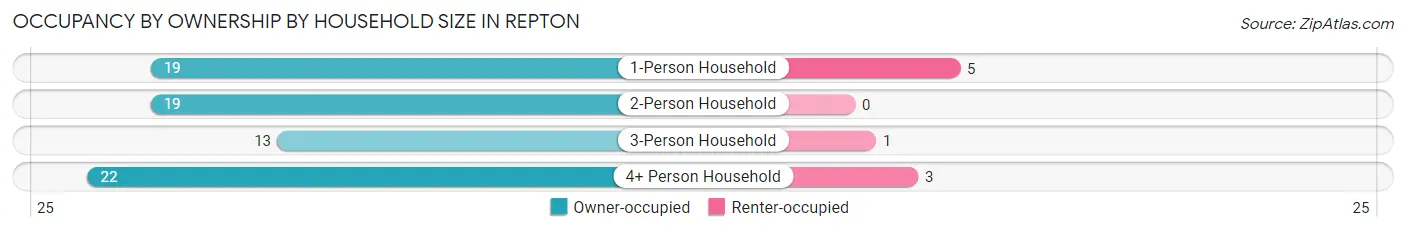
| Household Size | Owner-occupied | Renter-occupied |
| 1-Person Household | 19 (79.2%) | 5 (20.8%) |
| 2-Person Household | 19 (100.0%) | 0 (0.0%) |
| 3-Person Household | 13 (92.9%) | 1 (7.1%) |
| 4+ Person Household | 22 (88.0%) | 3 (12.0%) |
| Total Housing Units | 73 (89.0%) | 9 (11.0%) |
Occupancy by Educational Attainment in Repton
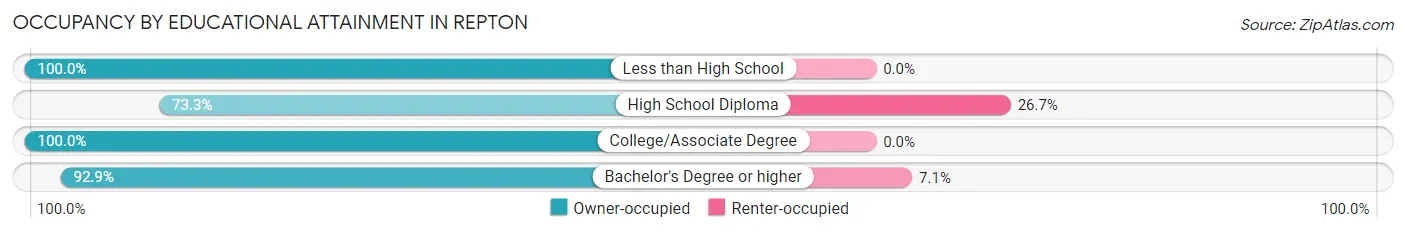
| Household Size | Owner-occupied | Renter-occupied |
| Less than High School | 16 (100.0%) | 0 (0.0%) |
| High School Diploma | 22 (73.3%) | 8 (26.7%) |
| College/Associate Degree | 22 (100.0%) | 0 (0.0%) |
| Bachelor's Degree or higher | 13 (92.9%) | 1 (7.1%) |
Occupancy by Age of Householder in Repton
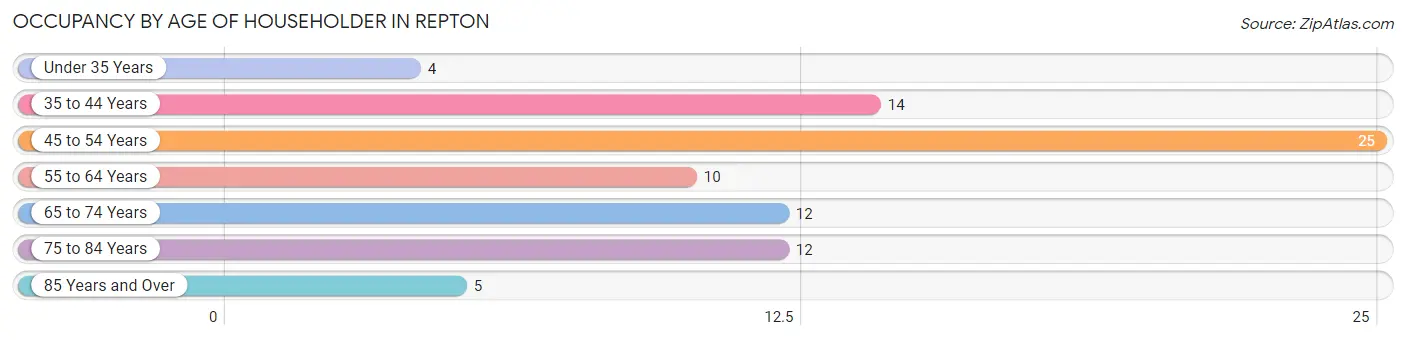
| Age Bracket | # Households | % Households |
| Under 35 Years | 4 | 4.9% |
| 35 to 44 Years | 14 | 17.1% |
| 45 to 54 Years | 25 | 30.5% |
| 55 to 64 Years | 10 | 12.2% |
| 65 to 74 Years | 12 | 14.6% |
| 75 to 84 Years | 12 | 14.6% |
| 85 Years and Over | 5 | 6.1% |
| Total | 82 | 100.0% |
Housing Finances in Repton
Median Income by Occupancy in Repton
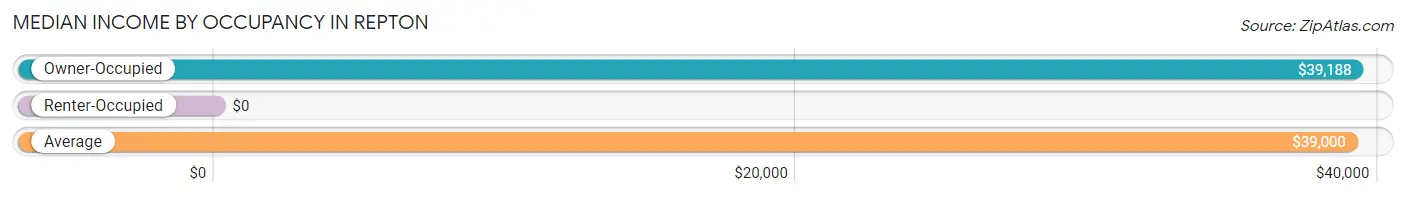
| Occupancy Type | # Households | Median Income |
| Owner-Occupied | 73 (89.0%) | $39,188 |
| Renter-Occupied | 9 (11.0%) | $0 |
| Average | 82 (100.0%) | $39,000 |
Occupancy by Householder Income Bracket in Repton
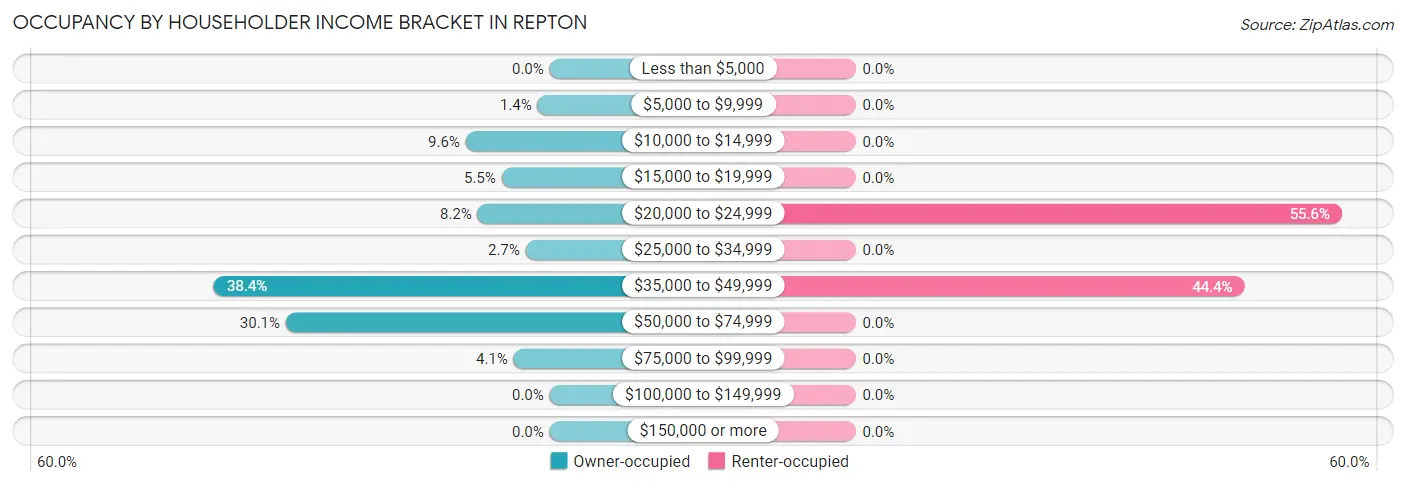
| Income Bracket | Owner-occupied | Renter-occupied |
| Less than $5,000 | 0 (0.0%) | 0 (0.0%) |
| $5,000 to $9,999 | 1 (1.4%) | 0 (0.0%) |
| $10,000 to $14,999 | 7 (9.6%) | 0 (0.0%) |
| $15,000 to $19,999 | 4 (5.5%) | 0 (0.0%) |
| $20,000 to $24,999 | 6 (8.2%) | 5 (55.6%) |
| $25,000 to $34,999 | 2 (2.7%) | 0 (0.0%) |
| $35,000 to $49,999 | 28 (38.4%) | 4 (44.4%) |
| $50,000 to $74,999 | 22 (30.1%) | 0 (0.0%) |
| $75,000 to $99,999 | 3 (4.1%) | 0 (0.0%) |
| $100,000 to $149,999 | 0 (0.0%) | 0 (0.0%) |
| $150,000 or more | 0 (0.0%) | 0 (0.0%) |
| Total | 73 (100.0%) | 9 (100.0%) |
Monthly Housing Cost Tiers in Repton
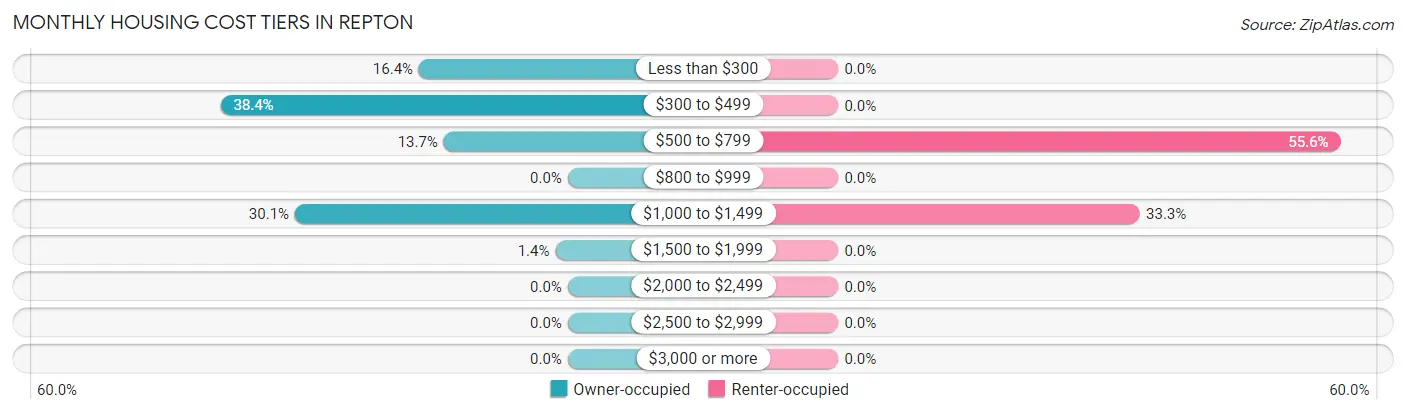
| Monthly Cost | Owner-occupied | Renter-occupied |
| Less than $300 | 12 (16.4%) | 0 (0.0%) |
| $300 to $499 | 28 (38.4%) | 0 (0.0%) |
| $500 to $799 | 10 (13.7%) | 5 (55.6%) |
| $800 to $999 | 0 (0.0%) | 0 (0.0%) |
| $1,000 to $1,499 | 22 (30.1%) | 3 (33.3%) |
| $1,500 to $1,999 | 1 (1.4%) | 0 (0.0%) |
| $2,000 to $2,499 | 0 (0.0%) | 0 (0.0%) |
| $2,500 to $2,999 | 0 (0.0%) | 0 (0.0%) |
| $3,000 or more | 0 (0.0%) | 0 (0.0%) |
| Total | 73 (100.0%) | 9 (100.0%) |
Physical Housing Characteristics in Repton
Housing Structures in Repton
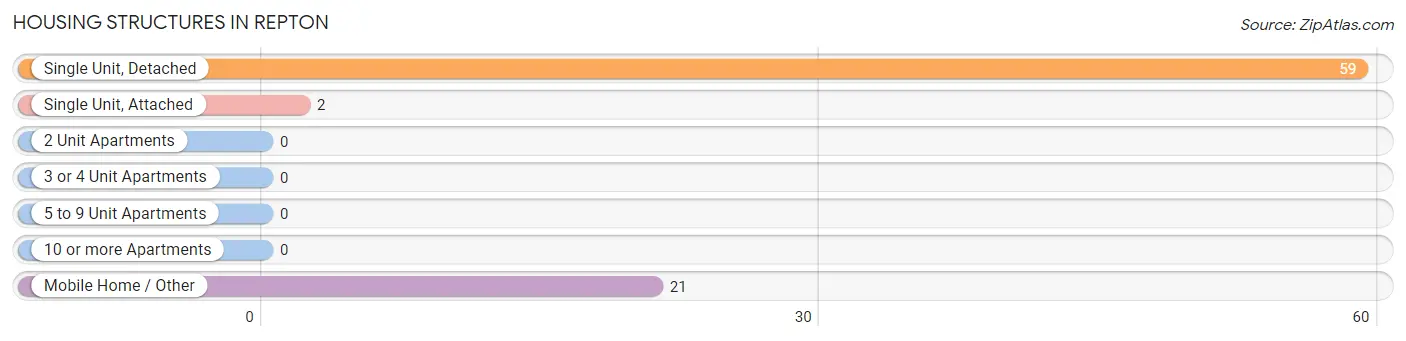
| Structure Type | # Housing Units | % Housing Units |
| Single Unit, Detached | 59 | 72.0% |
| Single Unit, Attached | 2 | 2.4% |
| 2 Unit Apartments | 0 | 0.0% |
| 3 or 4 Unit Apartments | 0 | 0.0% |
| 5 to 9 Unit Apartments | 0 | 0.0% |
| 10 or more Apartments | 0 | 0.0% |
| Mobile Home / Other | 21 | 25.6% |
| Total | 82 | 100.0% |
Housing Structures by Occupancy in Repton
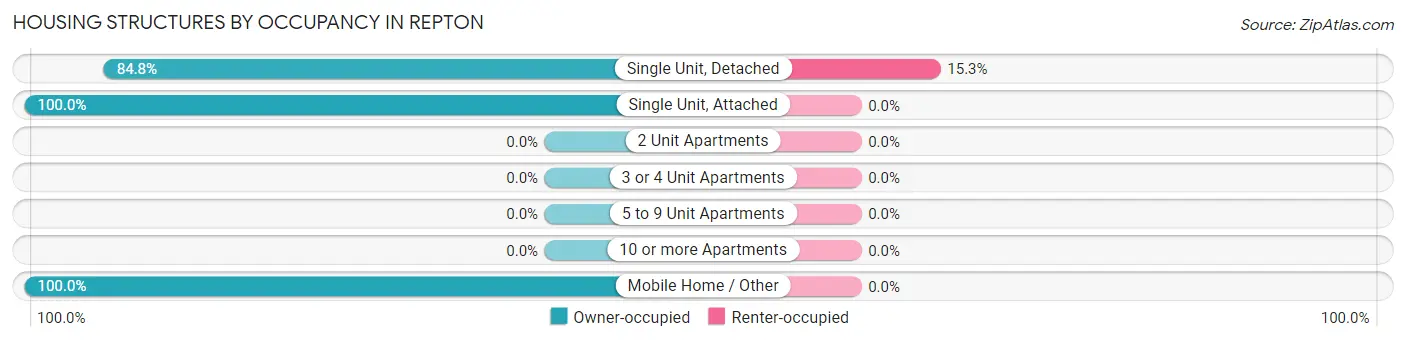
| Structure Type | Owner-occupied | Renter-occupied |
| Single Unit, Detached | 50 (84.8%) | 9 (15.2%) |
| Single Unit, Attached | 2 (100.0%) | 0 (0.0%) |
| 2 Unit Apartments | 0 (0.0%) | 0 (0.0%) |
| 3 or 4 Unit Apartments | 0 (0.0%) | 0 (0.0%) |
| 5 to 9 Unit Apartments | 0 (0.0%) | 0 (0.0%) |
| 10 or more Apartments | 0 (0.0%) | 0 (0.0%) |
| Mobile Home / Other | 21 (100.0%) | 0 (0.0%) |
| Total | 73 (89.0%) | 9 (11.0%) |
Housing Structures by Number of Rooms in Repton
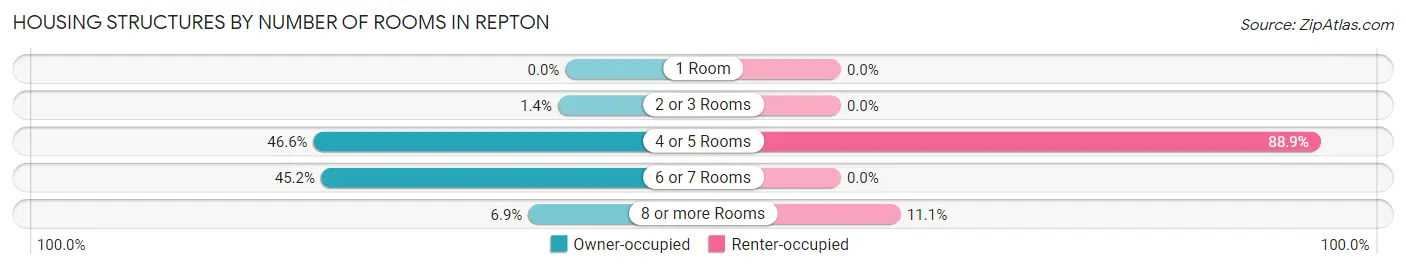
| Number of Rooms | Owner-occupied | Renter-occupied |
| 1 Room | 0 (0.0%) | 0 (0.0%) |
| 2 or 3 Rooms | 1 (1.4%) | 0 (0.0%) |
| 4 or 5 Rooms | 34 (46.6%) | 8 (88.9%) |
| 6 or 7 Rooms | 33 (45.2%) | 0 (0.0%) |
| 8 or more Rooms | 5 (6.9%) | 1 (11.1%) |
| Total | 73 (100.0%) | 9 (100.0%) |
Housing Structure by Heating Type in Repton
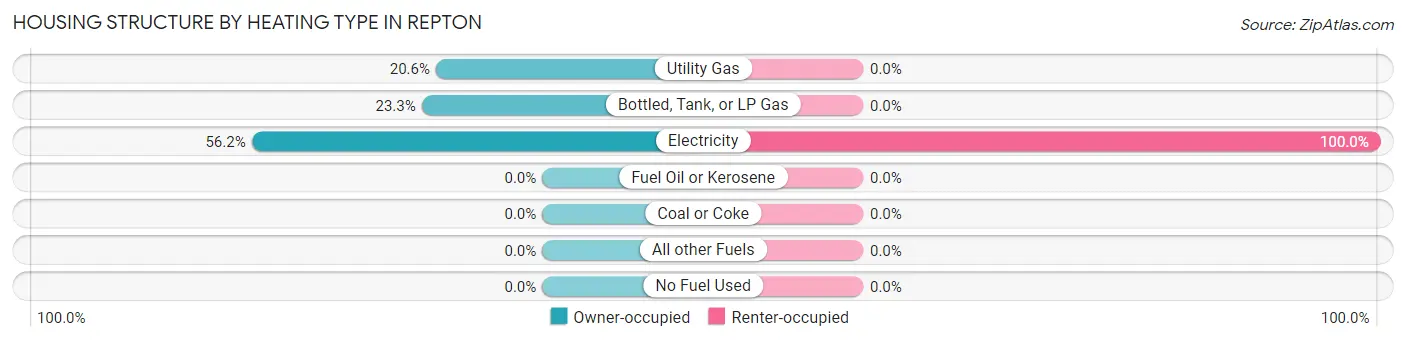
| Heating Type | Owner-occupied | Renter-occupied |
| Utility Gas | 15 (20.5%) | 0 (0.0%) |
| Bottled, Tank, or LP Gas | 17 (23.3%) | 0 (0.0%) |
| Electricity | 41 (56.2%) | 9 (100.0%) |
| Fuel Oil or Kerosene | 0 (0.0%) | 0 (0.0%) |
| Coal or Coke | 0 (0.0%) | 0 (0.0%) |
| All other Fuels | 0 (0.0%) | 0 (0.0%) |
| No Fuel Used | 0 (0.0%) | 0 (0.0%) |
| Total | 73 (100.0%) | 9 (100.0%) |
Household Vehicle Usage in Repton
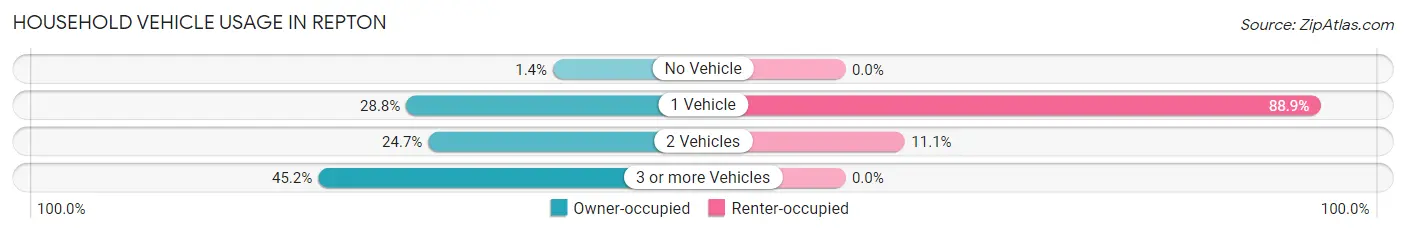
| Vehicles per Household | Owner-occupied | Renter-occupied |
| No Vehicle | 1 (1.4%) | 0 (0.0%) |
| 1 Vehicle | 21 (28.8%) | 8 (88.9%) |
| 2 Vehicles | 18 (24.7%) | 1 (11.1%) |
| 3 or more Vehicles | 33 (45.2%) | 0 (0.0%) |
| Total | 73 (100.0%) | 9 (100.0%) |
Real Estate & Mortgages in Repton
Real Estate and Mortgage Overview in Repton
| Characteristic | Without Mortgage | With Mortgage |
| Housing Units | 45 | 28 |
| Median Property Value | $93,100 | $131,700 |
| Median Household Income | $40,625 | $0 |
| Monthly Housing Costs | $375 | $0 |
| Real Estate Taxes | $371 | $5 |
Property Value by Mortgage Status in Repton
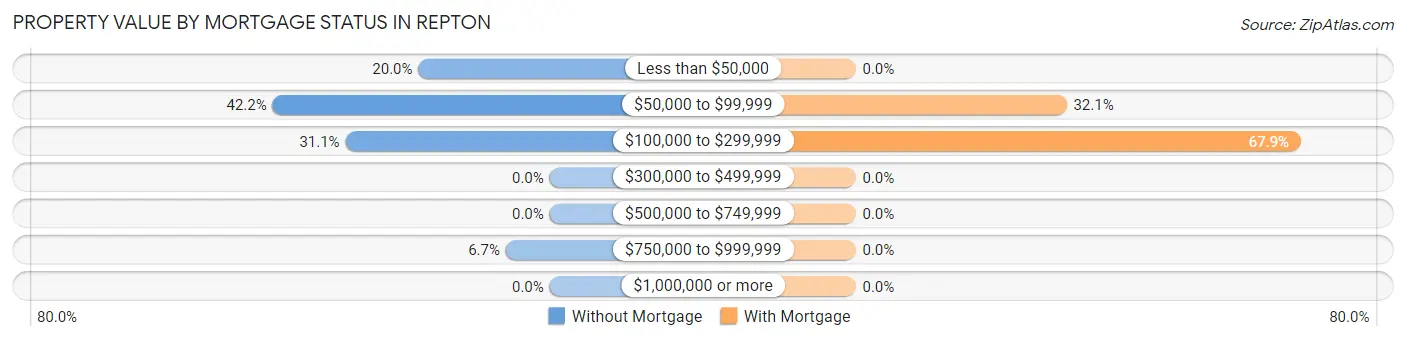
| Property Value | Without Mortgage | With Mortgage |
| Less than $50,000 | 9 (20.0%) | 0 (0.0%) |
| $50,000 to $99,999 | 19 (42.2%) | 9 (32.1%) |
| $100,000 to $299,999 | 14 (31.1%) | 19 (67.9%) |
| $300,000 to $499,999 | 0 (0.0%) | 0 (0.0%) |
| $500,000 to $749,999 | 0 (0.0%) | 0 (0.0%) |
| $750,000 to $999,999 | 3 (6.7%) | 0 (0.0%) |
| $1,000,000 or more | 0 (0.0%) | 0 (0.0%) |
| Total | 45 (100.0%) | 28 (100.0%) |
Household Income by Mortgage Status in Repton
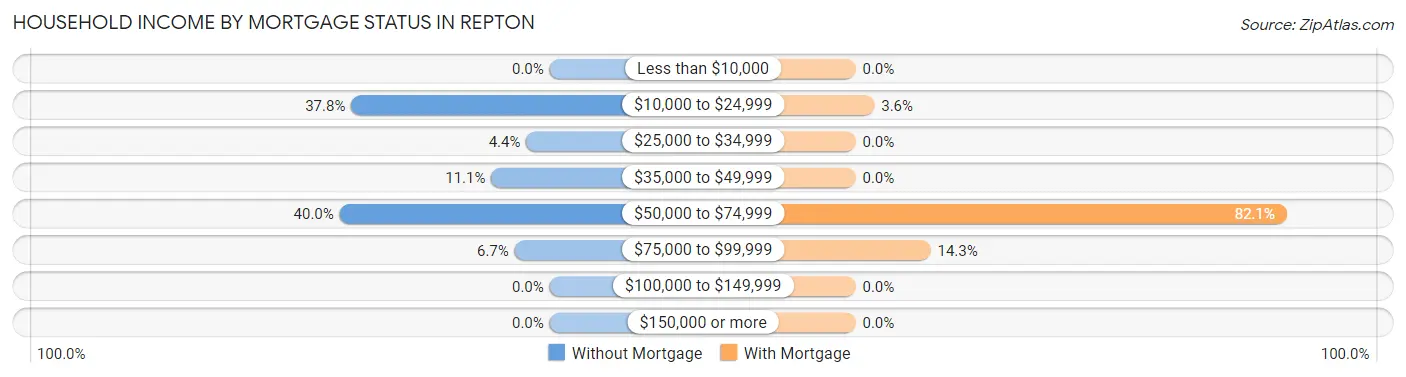
| Household Income | Without Mortgage | With Mortgage |
| Less than $10,000 | 0 (0.0%) | 0 (0.0%) |
| $10,000 to $24,999 | 17 (37.8%) | 1 (3.6%) |
| $25,000 to $34,999 | 2 (4.4%) | 0 (0.0%) |
| $35,000 to $49,999 | 5 (11.1%) | 0 (0.0%) |
| $50,000 to $74,999 | 18 (40.0%) | 23 (82.1%) |
| $75,000 to $99,999 | 3 (6.7%) | 4 (14.3%) |
| $100,000 to $149,999 | 0 (0.0%) | 0 (0.0%) |
| $150,000 or more | 0 (0.0%) | 0 (0.0%) |
| Total | 45 (100.0%) | 28 (100.0%) |
Property Value to Household Income Ratio in Repton
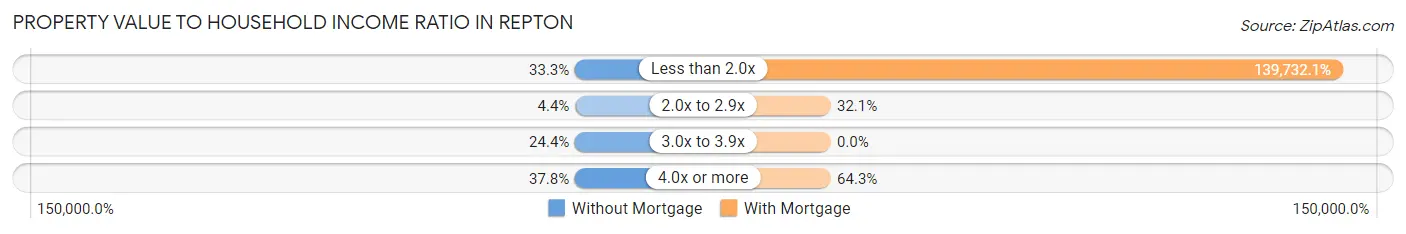
| Value-to-Income Ratio | Without Mortgage | With Mortgage |
| Less than 2.0x | 15 (33.3%) | 39,125 (139,732.1%) |
| 2.0x to 2.9x | 2 (4.4%) | 9 (32.1%) |
| 3.0x to 3.9x | 11 (24.4%) | 0 (0.0%) |
| 4.0x or more | 17 (37.8%) | 18 (64.3%) |
| Total | 45 (100.0%) | 28 (100.0%) |
Real Estate Taxes by Mortgage Status in Repton
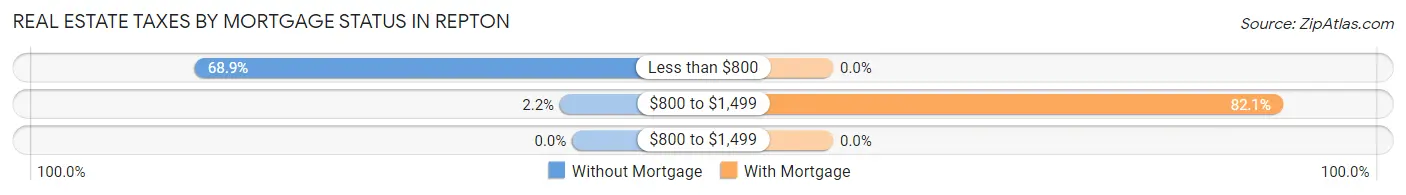
| Property Taxes | Without Mortgage | With Mortgage |
| Less than $800 | 31 (68.9%) | 0 (0.0%) |
| $800 to $1,499 | 1 (2.2%) | 23 (82.1%) |
| $800 to $1,499 | 0 (0.0%) | 0 (0.0%) |
| Total | 45 (100.0%) | 28 (100.0%) |
Health & Disability in Repton
Health Insurance Coverage by Age in Repton
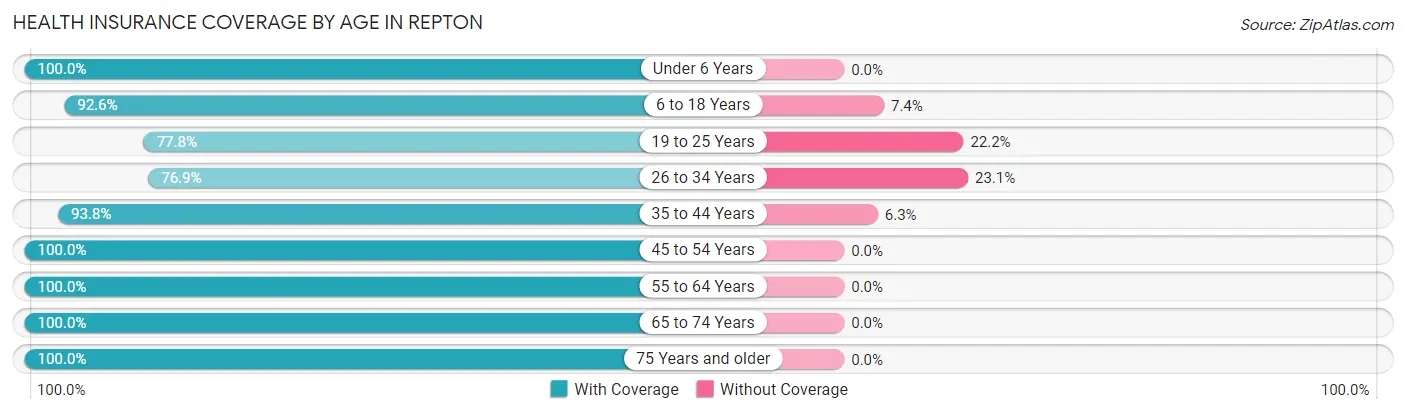
| Age Bracket | With Coverage | Without Coverage |
| Under 6 Years | 23 (100.0%) | 0 (0.0%) |
| 6 to 18 Years | 50 (92.6%) | 4 (7.4%) |
| 19 to 25 Years | 42 (77.8%) | 12 (22.2%) |
| 26 to 34 Years | 10 (76.9%) | 3 (23.1%) |
| 35 to 44 Years | 45 (93.8%) | 3 (6.2%) |
| 45 to 54 Years | 32 (100.0%) | 0 (0.0%) |
| 55 to 64 Years | 25 (100.0%) | 0 (0.0%) |
| 65 to 74 Years | 17 (100.0%) | 0 (0.0%) |
| 75 Years and older | 23 (100.0%) | 0 (0.0%) |
| Total | 267 (92.4%) | 22 (7.6%) |
Health Insurance Coverage by Citizenship Status in Repton
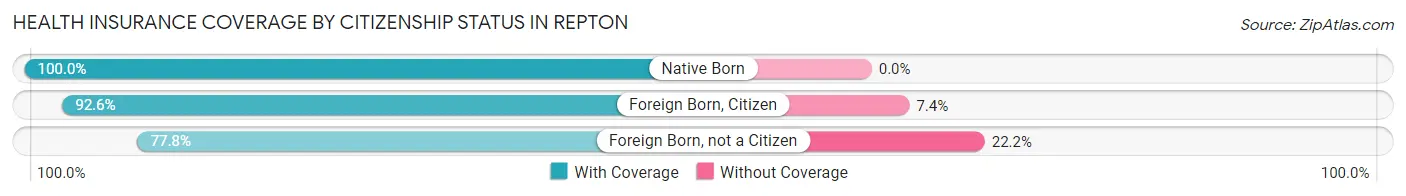
| Citizenship Status | With Coverage | Without Coverage |
| Native Born | 23 (100.0%) | 0 (0.0%) |
| Foreign Born, Citizen | 50 (92.6%) | 4 (7.4%) |
| Foreign Born, not a Citizen | 42 (77.8%) | 12 (22.2%) |
Health Insurance Coverage by Household Income in Repton
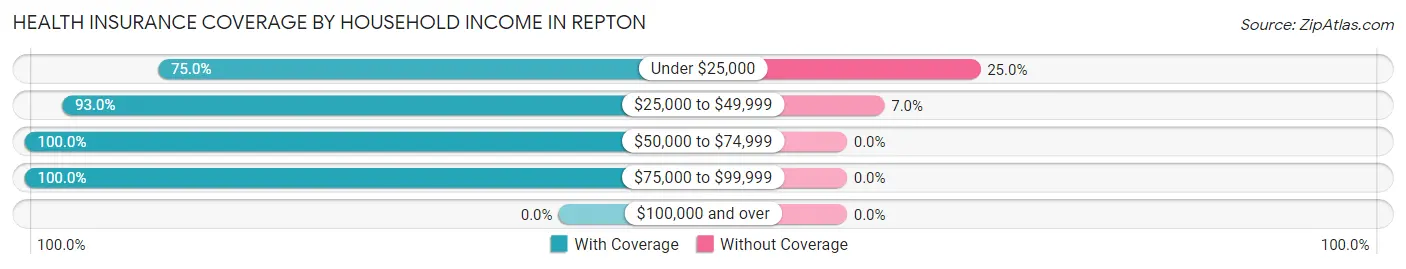
| Household Income | With Coverage | Without Coverage |
| Under $25,000 | 30 (75.0%) | 10 (25.0%) |
| $25,000 to $49,999 | 159 (93.0%) | 12 (7.0%) |
| $50,000 to $74,999 | 68 (100.0%) | 0 (0.0%) |
| $75,000 to $99,999 | 10 (100.0%) | 0 (0.0%) |
| $100,000 and over | 0 (0.0%) | 0 (0.0%) |
Public vs Private Health Insurance Coverage by Age in Repton
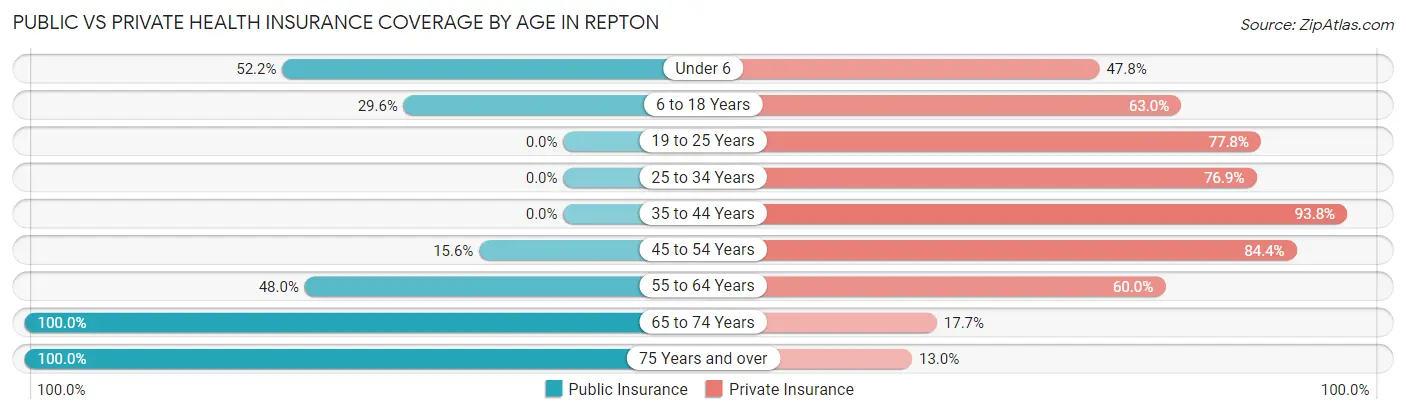
| Age Bracket | Public Insurance | Private Insurance |
| Under 6 | 12 (52.2%) | 11 (47.8%) |
| 6 to 18 Years | 16 (29.6%) | 34 (63.0%) |
| 19 to 25 Years | 0 (0.0%) | 42 (77.8%) |
| 25 to 34 Years | 0 (0.0%) | 10 (76.9%) |
| 35 to 44 Years | 0 (0.0%) | 45 (93.8%) |
| 45 to 54 Years | 5 (15.6%) | 27 (84.4%) |
| 55 to 64 Years | 12 (48.0%) | 15 (60.0%) |
| 65 to 74 Years | 17 (100.0%) | 3 (17.6%) |
| 75 Years and over | 23 (100.0%) | 3 (13.0%) |
| Total | 85 (29.4%) | 190 (65.7%) |
Disability Status by Sex by Age in Repton
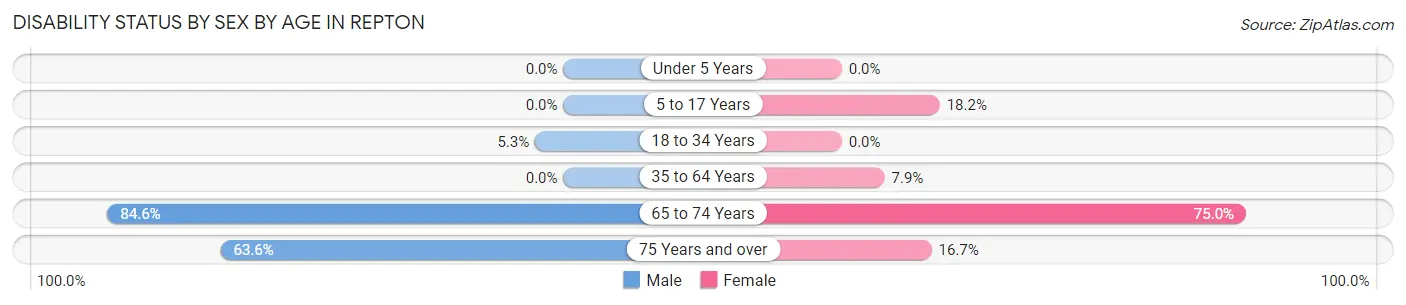
| Age Bracket | Male | Female |
| Under 5 Years | 0 (0.0%) | 0 (0.0%) |
| 5 to 17 Years | 0 (0.0%) | 2 (18.2%) |
| 18 to 34 Years | 3 (5.3%) | 0 (0.0%) |
| 35 to 64 Years | 0 (0.0%) | 5 (7.9%) |
| 65 to 74 Years | 11 (84.6%) | 3 (75.0%) |
| 75 Years and over | 7 (63.6%) | 2 (16.7%) |
Disability Class by Sex by Age in Repton
Disability Class: Hearing Difficulty
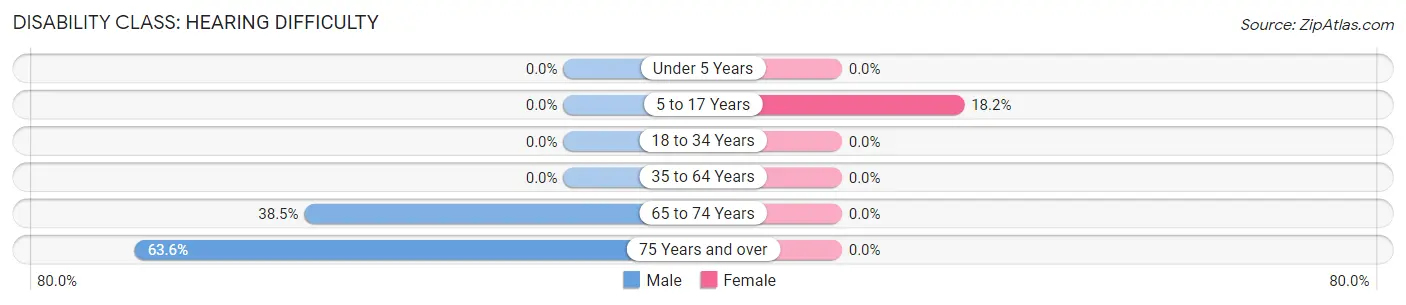
| Age Bracket | Male | Female |
| Under 5 Years | 0 (0.0%) | 0 (0.0%) |
| 5 to 17 Years | 0 (0.0%) | 2 (18.2%) |
| 18 to 34 Years | 0 (0.0%) | 0 (0.0%) |
| 35 to 64 Years | 0 (0.0%) | 0 (0.0%) |
| 65 to 74 Years | 5 (38.5%) | 0 (0.0%) |
| 75 Years and over | 7 (63.6%) | 0 (0.0%) |
Disability Class: Vision Difficulty
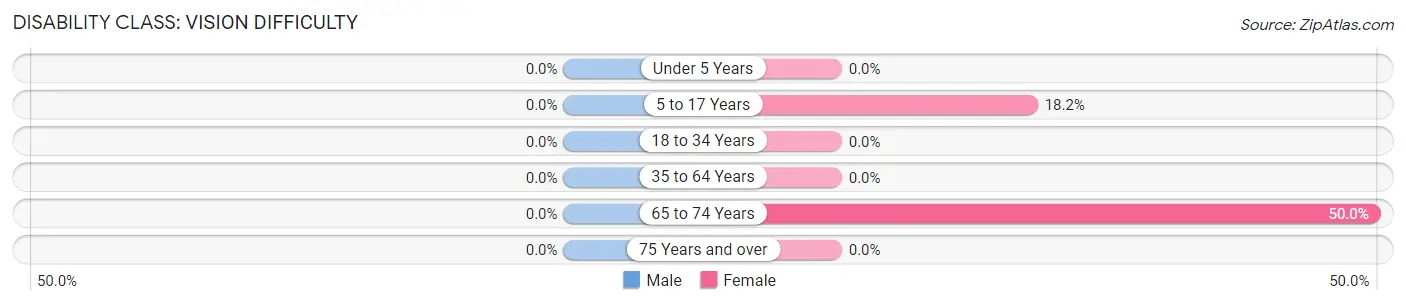
| Age Bracket | Male | Female |
| Under 5 Years | 0 (0.0%) | 0 (0.0%) |
| 5 to 17 Years | 0 (0.0%) | 2 (18.2%) |
| 18 to 34 Years | 0 (0.0%) | 0 (0.0%) |
| 35 to 64 Years | 0 (0.0%) | 0 (0.0%) |
| 65 to 74 Years | 0 (0.0%) | 2 (50.0%) |
| 75 Years and over | 0 (0.0%) | 0 (0.0%) |
Disability Class: Cognitive Difficulty
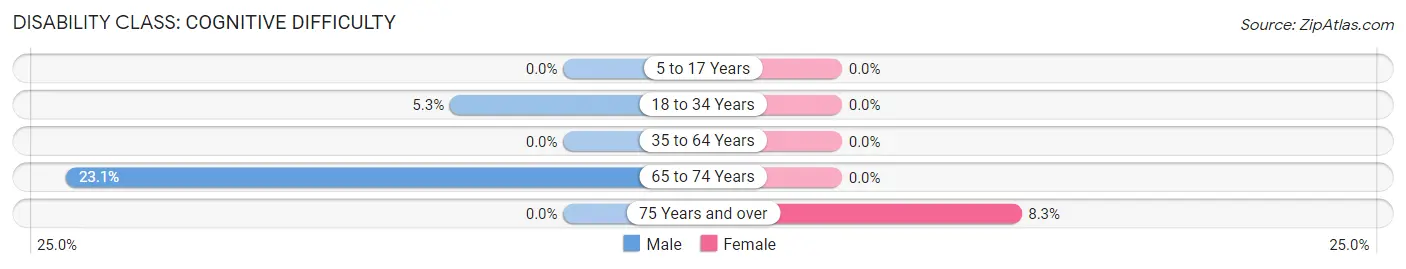
| Age Bracket | Male | Female |
| 5 to 17 Years | 0 (0.0%) | 0 (0.0%) |
| 18 to 34 Years | 3 (5.3%) | 0 (0.0%) |
| 35 to 64 Years | 0 (0.0%) | 0 (0.0%) |
| 65 to 74 Years | 3 (23.1%) | 0 (0.0%) |
| 75 Years and over | 0 (0.0%) | 1 (8.3%) |
Disability Class: Ambulatory Difficulty
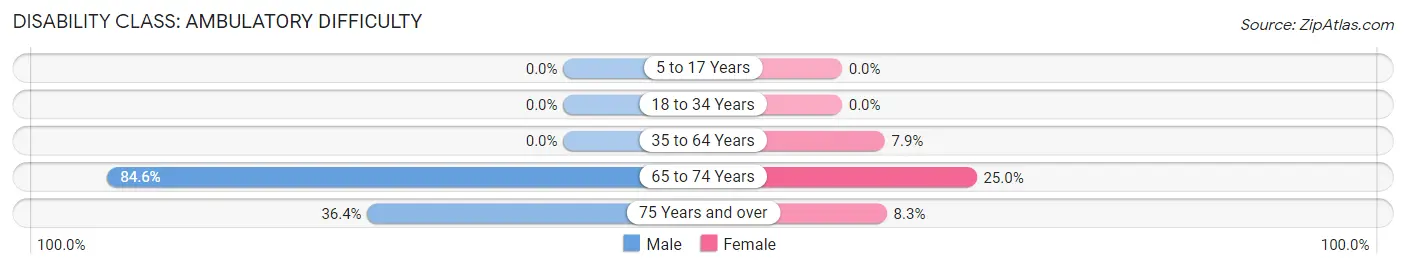
| Age Bracket | Male | Female |
| 5 to 17 Years | 0 (0.0%) | 0 (0.0%) |
| 18 to 34 Years | 0 (0.0%) | 0 (0.0%) |
| 35 to 64 Years | 0 (0.0%) | 5 (7.9%) |
| 65 to 74 Years | 11 (84.6%) | 1 (25.0%) |
| 75 Years and over | 4 (36.4%) | 1 (8.3%) |
Disability Class: Self-Care Difficulty
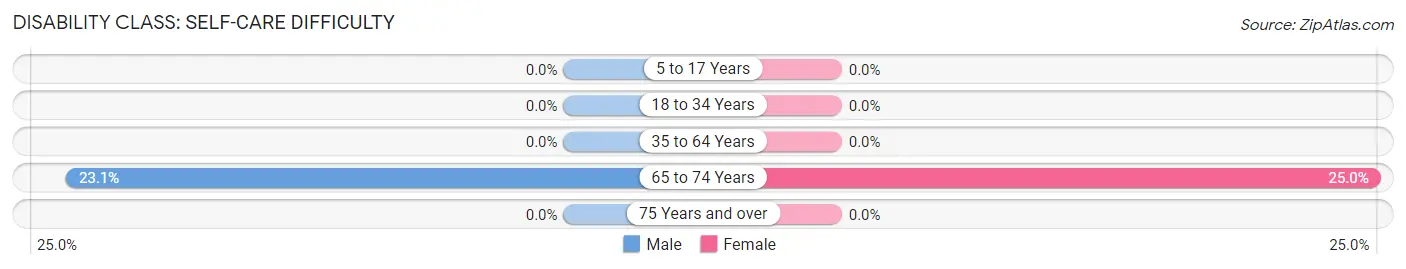
| Age Bracket | Male | Female |
| 5 to 17 Years | 0 (0.0%) | 0 (0.0%) |
| 18 to 34 Years | 0 (0.0%) | 0 (0.0%) |
| 35 to 64 Years | 0 (0.0%) | 0 (0.0%) |
| 65 to 74 Years | 3 (23.1%) | 1 (25.0%) |
| 75 Years and over | 0 (0.0%) | 0 (0.0%) |
Technology Access in Repton
Computing Device Access in Repton
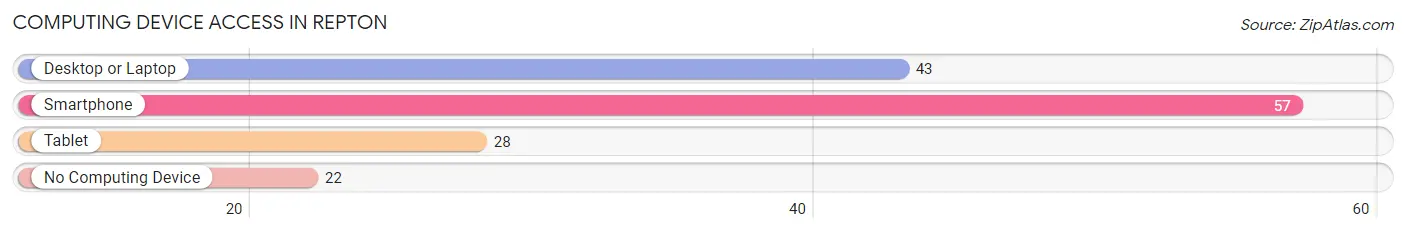
| Device Type | # Households | % Households |
| Desktop or Laptop | 43 | 52.4% |
| Smartphone | 57 | 69.5% |
| Tablet | 28 | 34.2% |
| No Computing Device | 22 | 26.8% |
| Total | 82 | 100.0% |
Internet Access in Repton
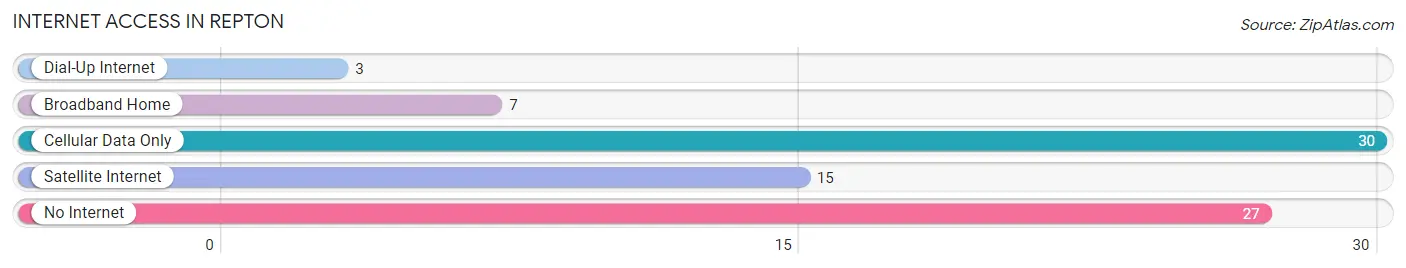
| Internet Type | # Households | % Households |
| Dial-Up Internet | 3 | 3.7% |
| Broadband Home | 7 | 8.5% |
| Cellular Data Only | 30 | 36.6% |
| Satellite Internet | 15 | 18.3% |
| No Internet | 27 | 32.9% |
| Total | 82 | 100.0% |
Repton Summary
Repton, Alabama is a small town located in Conecuh County, Alabama. It is situated on the banks of the Conecuh River, about 20 miles south of Evergreen. The town was founded in 1819 and is the oldest settlement in the county. The population of Repton was estimated to be 545 in 2019.
History
Repton was founded in 1819 by a group of settlers from Georgia. The town was named after a town in England, and the settlers chose the name because of its similarity to the English town. The settlers were attracted to the area because of its fertile soil and abundant timber. The town quickly grew and by 1820, it had a population of over 200.
In 1821, Repton was incorporated as a town. The town was a major trading center for the surrounding area and was home to several stores, a post office, and a school. The town also had a cotton gin and a sawmill.
In the late 1800s, Repton was a thriving community. The town had a population of over 1,000 and was home to several businesses, including a bank, a hotel, and a newspaper. The town also had a railroad station and was a major shipping center for the area.
Geography
Repton is located in Conecuh County, Alabama. The town is situated on the banks of the Conecuh River, about 20 miles south of Evergreen. The town is surrounded by rolling hills and is located in a rural area. The climate in Repton is humid subtropical, with hot summers and mild winters.
Economy
Repton’s economy is largely based on agriculture. The town is home to several farms, which produce a variety of crops, including cotton, corn, soybeans, and peanuts. The town also has several timber companies, which harvest timber from the surrounding forests.
In addition to agriculture, Repton is home to several small businesses, including restaurants, stores, and a gas station. The town also has a few manufacturing companies, which produce a variety of products, including furniture and clothing.
Demographics
Repton’s population was estimated to be 545 in 2019. The town is predominantly white, with a small African American population. The median household income in Repton is $31,250, and the median home value is $87,500. The town has a poverty rate of 22.3%, which is higher than the national average.
Repton is a small town with a rich history and a vibrant economy. The town is home to several farms and businesses, and is a popular destination for tourists. The town is also home to a diverse population, with a mix of races and cultures.
Common Questions
What is Per Capita Income in Repton?
Per Capita income in Repton is $13,379.
What is the Median Family Income in Repton?
Median Family Income in Repton is $43,333.
What is the Median Household income in Repton?
Median Household Income in Repton is $39,000.
What is Inequality or Gini Index in Repton?
Inequality or Gini Index in Repton is 0.25.
What is the Total Population of Repton?
Total Population of Repton is 289.
What is the Total Male Population of Repton?
Total Male Population of Repton is 166.
What is the Total Female Population of Repton?
Total Female Population of Repton is 123.
What is the Ratio of Males per 100 Females in Repton?
There are 134.96 Males per 100 Females in Repton.
What is the Ratio of Females per 100 Males in Repton?
There are 74.10 Females per 100 Males in Repton.
What is the Median Population Age in Repton?
Median Population Age in Repton is 35.1 Years.
What is the Average Family Size in Repton
Average Family Size in Repton is 4.2 People.
What is the Average Household Size in Repton
Average Household Size in Repton is 3.5 People.
How Large is the Labor Force in Repton?
There are 107 People in the Labor Forcein in Repton.
What is the Percentage of People in the Labor Force in Repton?
45.1% of People are in the Labor Force in Repton.
What is the Unemployment Rate in Repton?
Unemployment Rate in Repton is 3.7%.