Rainsville, AL Map & Demographics
Rainsville Map
Rainsville Overview
$27,308
PER CAPITA INCOME
$80,353
AVG FAMILY INCOME
$60,339
AVG HOUSEHOLD INCOME
41.2%
WAGE / INCOME GAP [ % ]
58.8¢/ $1
WAGE / INCOME GAP [ $ ]
0.39
INEQUALITY / GINI INDEX
5,545
TOTAL POPULATION
3,024
MALE POPULATION
2,521
FEMALE POPULATION
119.95
MALES / 100 FEMALES
83.37
FEMALES / 100 MALES
44.9
MEDIAN AGE
2.9
AVG FAMILY SIZE
2.5
AVG HOUSEHOLD SIZE
2,597
LABOR FORCE [ PEOPLE ]
58.0%
PERCENT IN LABOR FORCE
1.2%
UNEMPLOYMENT RATE
Rainsville Zip Codes
Rainsville Area Codes
Income in Rainsville
Income Overview in Rainsville
Per Capita Income in Rainsville is $27,308, while median incomes of families and households are $80,353 and $60,339 respectively.
| Characteristic | Number | Measure |
| Per Capita Income | 5,545 | $27,308 |
| Median Family Income | 1,699 | $80,353 |
| Mean Family Income | 1,699 | $78,322 |
| Median Household Income | 2,182 | $60,339 |
| Mean Household Income | 2,182 | $67,183 |
| Income Deficit | 1,699 | $0 |
| Wage / Income Gap (%) | 5,545 | 41.24% |
| Wage / Income Gap ($) | 5,545 | 58.76¢ per $1 |
| Gini / Inequality Index | 5,545 | 0.39 |
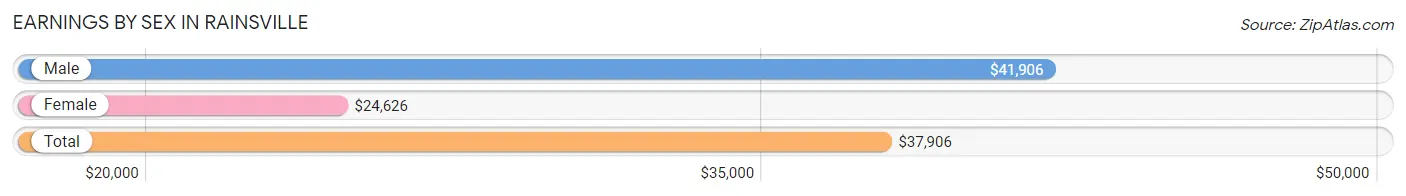
Earnings by Sex in Rainsville
Average Earnings in Rainsville are $37,906, $41,906 for men and $24,626 for women, a difference of 41.2%.
| Sex | Number | Average Earnings |
| Male | 1,516 (56.0%) | $41,906 |
| Female | 1,191 (44.0%) | $24,626 |
| Total | 2,707 (100.0%) | $37,906 |
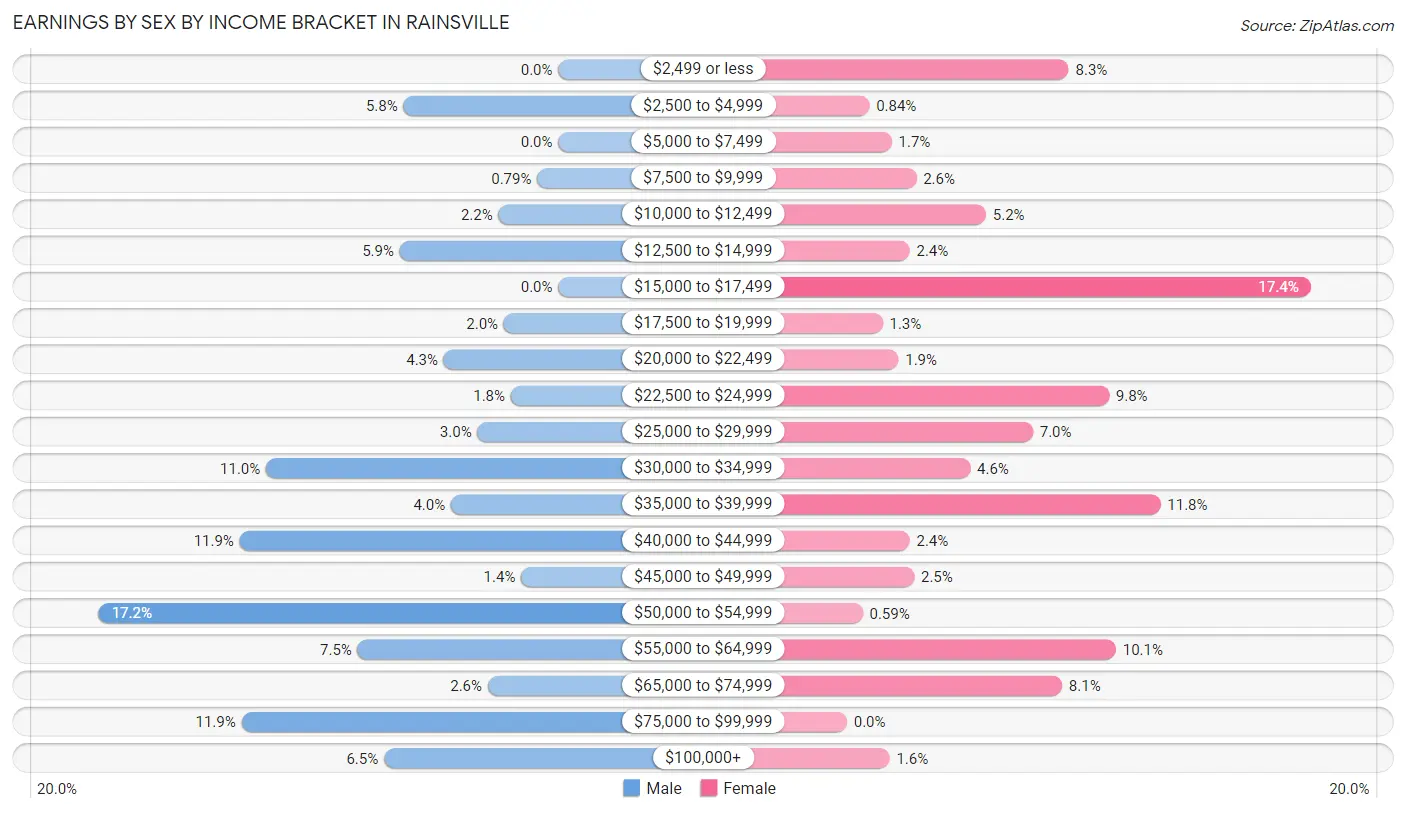
Earnings by Sex by Income Bracket in Rainsville
The most common earnings brackets in Rainsville are $50,000 to $54,999 for men (261 | 17.2%) and $15,000 to $17,499 for women (207 | 17.4%).
| Income | Male | Female |
| $2,499 or less | 0 (0.0%) | 99 (8.3%) |
| $2,500 to $4,999 | 88 (5.8%) | 10 (0.8%) |
| $5,000 to $7,499 | 0 (0.0%) | 20 (1.7%) |
| $7,500 to $9,999 | 12 (0.8%) | 31 (2.6%) |
| $10,000 to $12,499 | 34 (2.2%) | 62 (5.2%) |
| $12,500 to $14,999 | 90 (5.9%) | 28 (2.4%) |
| $15,000 to $17,499 | 0 (0.0%) | 207 (17.4%) |
| $17,500 to $19,999 | 31 (2.0%) | 16 (1.3%) |
| $20,000 to $22,499 | 65 (4.3%) | 23 (1.9%) |
| $22,500 to $24,999 | 27 (1.8%) | 117 (9.8%) |
| $25,000 to $29,999 | 46 (3.0%) | 83 (7.0%) |
| $30,000 to $34,999 | 166 (11.0%) | 55 (4.6%) |
| $35,000 to $39,999 | 61 (4.0%) | 140 (11.7%) |
| $40,000 to $44,999 | 181 (11.9%) | 28 (2.4%) |
| $45,000 to $49,999 | 21 (1.4%) | 30 (2.5%) |
| $50,000 to $54,999 | 261 (17.2%) | 7 (0.6%) |
| $55,000 to $64,999 | 114 (7.5%) | 120 (10.1%) |
| $65,000 to $74,999 | 40 (2.6%) | 96 (8.1%) |
| $75,000 to $99,999 | 180 (11.9%) | 0 (0.0%) |
| $100,000+ | 99 (6.5%) | 19 (1.6%) |
| Total | 1,516 (100.0%) | 1,191 (100.0%) |
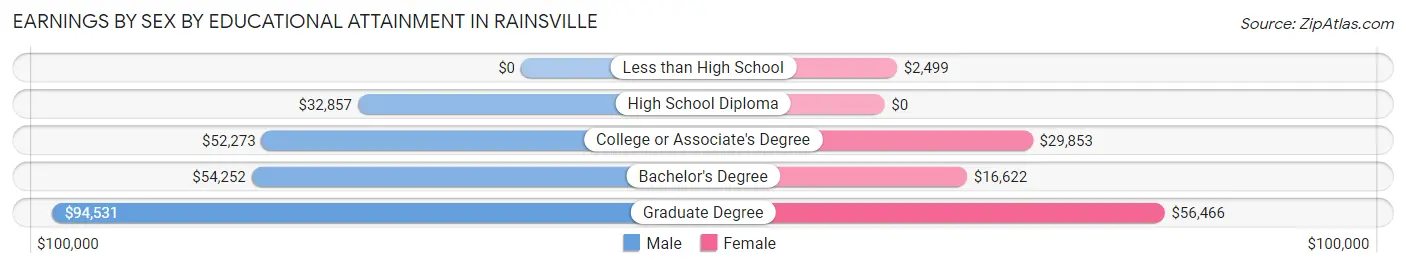
Earnings by Sex by Educational Attainment in Rainsville
Average earnings in Rainsville are $53,310 for men and $24,653 for women, a difference of 53.8%. Men with an educational attainment of graduate degree enjoy the highest average annual earnings of $94,531, while those with high school diploma education earn the least with $32,857. Women with an educational attainment of graduate degree earn the most with the average annual earnings of $56,466, while those with less than high school education have the smallest earnings of $2,499.
| Educational Attainment | Male Income | Female Income |
| Less than High School | - | - |
| High School Diploma | $32,857 | $0 |
| College or Associate's Degree | $52,273 | $29,853 |
| Bachelor's Degree | $54,252 | $16,622 |
| Graduate Degree | $94,531 | $56,466 |
| Total | $53,310 | $24,653 |
Family Income in Rainsville
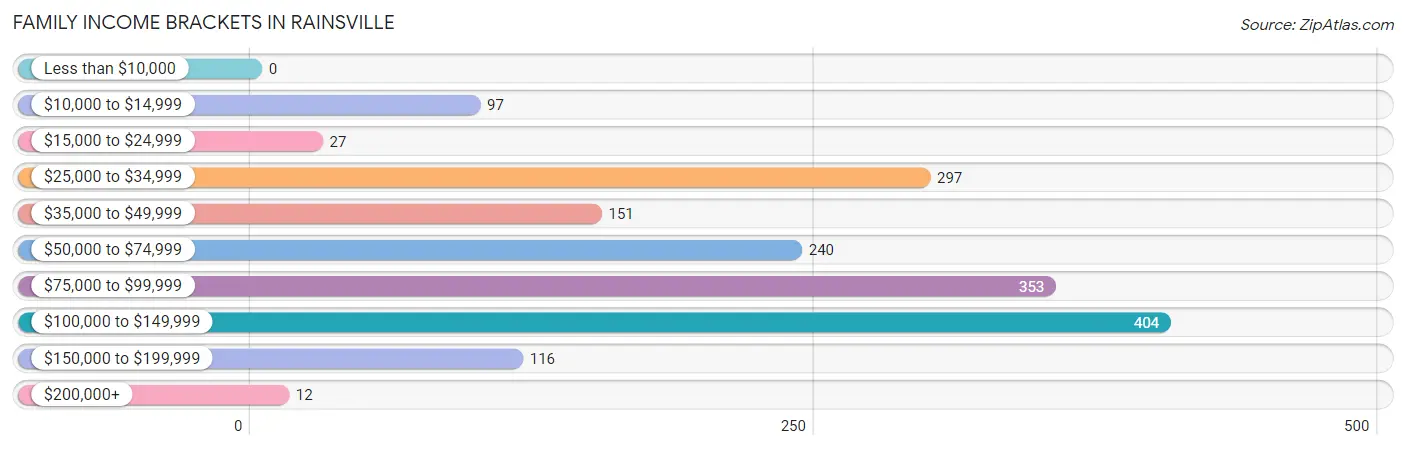
Family Income Brackets in Rainsville
According to the Rainsville family income data, there are 404 families falling into the $100,000 to $149,999 income range, which is the most common income bracket and makes up 23.8% of all families.
| Income Bracket | # Families | % Families |
| Less than $10,000 | 0 | 0.0% |
| $10,000 to $14,999 | 97 | 5.7% |
| $15,000 to $24,999 | 27 | 1.6% |
| $25,000 to $34,999 | 297 | 17.5% |
| $35,000 to $49,999 | 151 | 8.9% |
| $50,000 to $74,999 | 240 | 14.1% |
| $75,000 to $99,999 | 353 | 20.8% |
| $100,000 to $149,999 | 404 | 23.8% |
| $150,000 to $199,999 | 116 | 6.8% |
| $200,000+ | 12 | 0.7% |
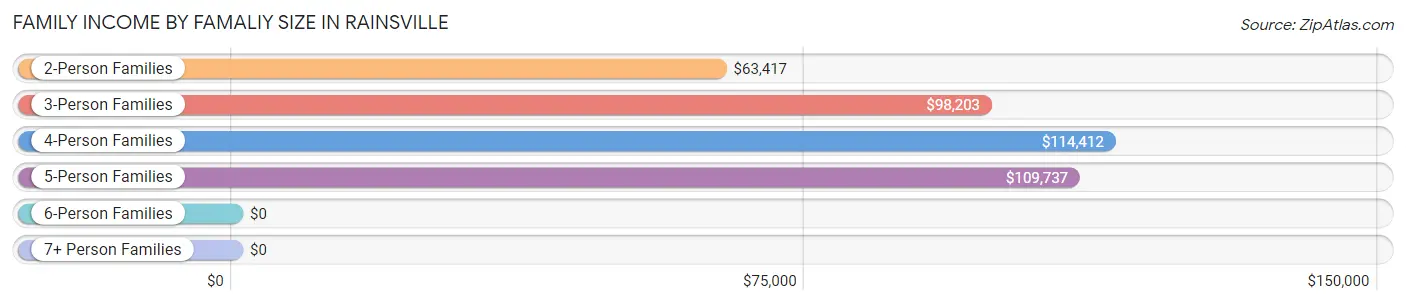
Family Income by Famaliy Size in Rainsville
4-person families (224 | 13.2%) account for the highest median family income in Rainsville with $114,412 per family, while 3-person families (293 | 17.2%) have the highest median income of $32,734 per family member.
| Income Bracket | # Families | Median Income |
| 2-Person Families | 995 (58.6%) | $63,417 |
| 3-Person Families | 293 (17.2%) | $98,203 |
| 4-Person Families | 224 (13.2%) | $114,412 |
| 5-Person Families | 94 (5.5%) | $109,737 |
| 6-Person Families | 21 (1.2%) | $0 |
| 7+ Person Families | 72 (4.2%) | $0 |
| Total | 1,699 (100.0%) | $80,353 |
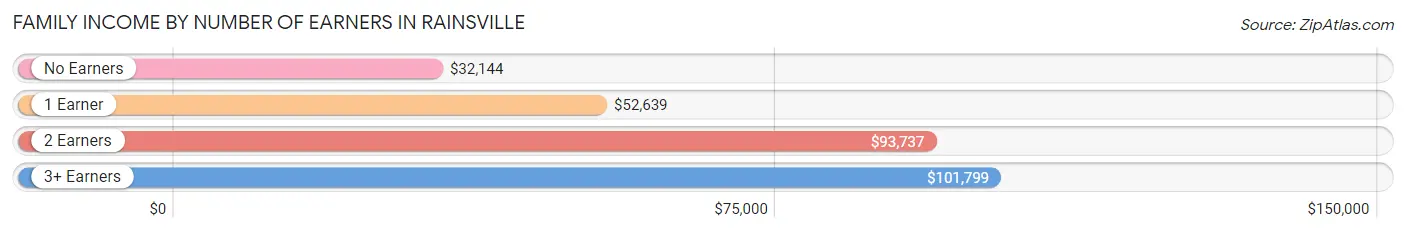
Family Income by Number of Earners in Rainsville
The median family income in Rainsville is $80,353, with families comprising 3+ earners (182) having the highest median family income of $101,799, while families with no earners (379) have the lowest median family income of $32,144, accounting for 10.7% and 22.3% of families, respectively.
| Number of Earners | # Families | Median Income |
| No Earners | 379 (22.3%) | $32,144 |
| 1 Earner | 419 (24.7%) | $52,639 |
| 2 Earners | 719 (42.3%) | $93,737 |
| 3+ Earners | 182 (10.7%) | $101,799 |
| Total | 1,699 (100.0%) | $80,353 |
Household Income in Rainsville
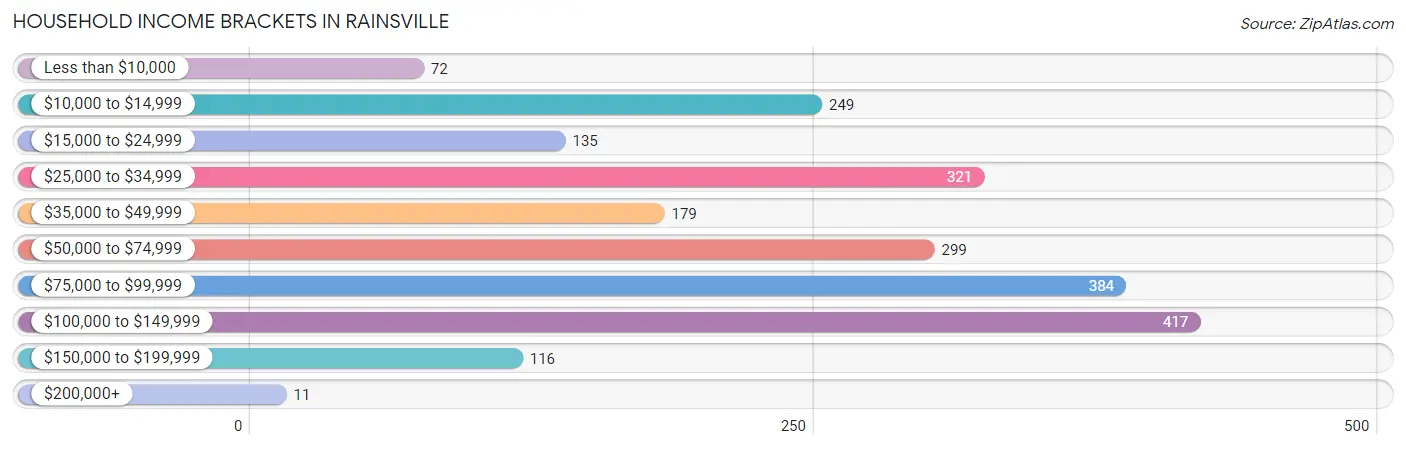
Household Income Brackets in Rainsville
With 417 households falling in the category, the $100,000 to $149,999 income range is the most frequent in Rainsville, accounting for 19.1% of all households. In contrast, only 11 households (0.5%) fall into the $200,000+ income bracket, making it the least populous group.
| Income Bracket | # Households | % Households |
| Less than $10,000 | 72 | 3.3% |
| $10,000 to $14,999 | 249 | 11.4% |
| $15,000 to $24,999 | 135 | 6.2% |
| $25,000 to $34,999 | 321 | 14.7% |
| $35,000 to $49,999 | 179 | 8.2% |
| $50,000 to $74,999 | 299 | 13.7% |
| $75,000 to $99,999 | 384 | 17.6% |
| $100,000 to $149,999 | 417 | 19.1% |
| $150,000 to $199,999 | 116 | 5.3% |
| $200,000+ | 11 | 0.5% |
Household Income by Householder Age in Rainsville
The median household income in Rainsville is $60,339, with the highest median household income of $92,950 found in the 45 to 64 years age bracket for the primary householder. A total of 854 households (39.1%) fall into this category. Meanwhile, the 15 to 24 years age bracket for the primary householder has the lowest median household income of $0, with 38 households (1.7%) in this group.
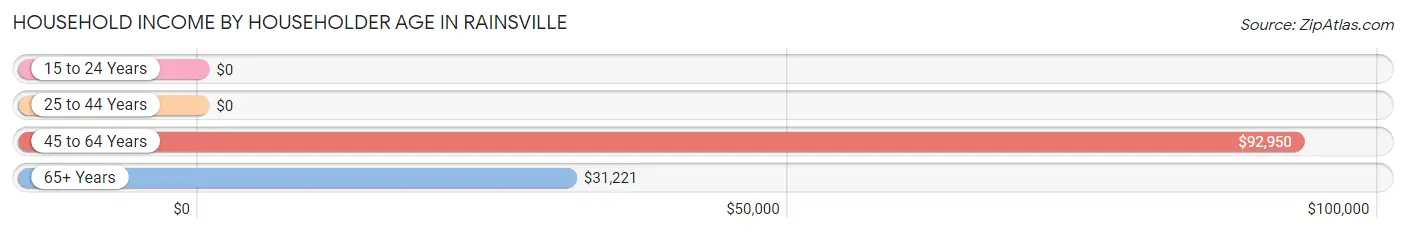
| Income Bracket | # Households | Median Income |
| 15 to 24 Years | 38 (1.7%) | $0 |
| 25 to 44 Years | 546 (25.0%) | $0 |
| 45 to 64 Years | 854 (39.1%) | $92,950 |
| 65+ Years | 744 (34.1%) | $31,221 |
| Total | 2,182 (100.0%) | $60,339 |
Poverty in Rainsville
Income Below Poverty by Sex and Age in Rainsville
With 16.2% poverty level for males and 17.8% for females among the residents of Rainsville, 5 year old males and 16 and 17 year old females are the most vulnerable to poverty, with 92 males (100.0%) and 87 females (68.5%) in their respective age groups living below the poverty level.
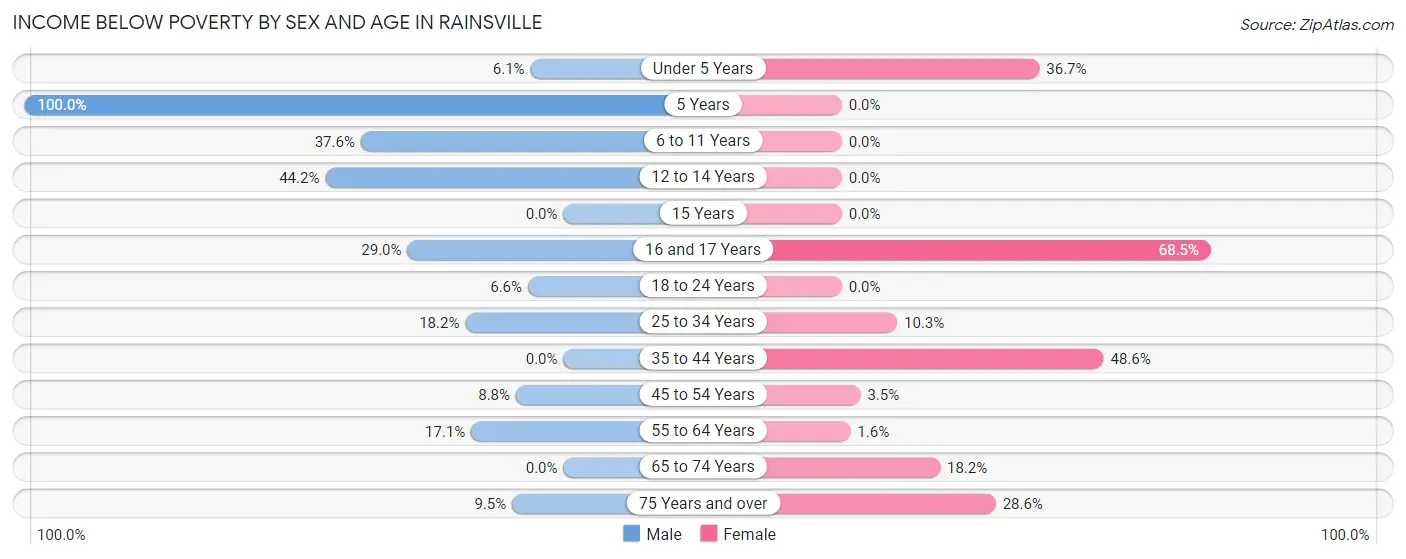
| Age Bracket | Male | Female |
| Under 5 Years | 11 (6.1%) | 77 (36.7%) |
| 5 Years | 92 (100.0%) | 0 (0.0%) |
| 6 to 11 Years | 88 (37.6%) | 0 (0.0%) |
| 12 to 14 Years | 80 (44.2%) | 0 (0.0%) |
| 15 Years | 0 (0.0%) | 0 (0.0%) |
| 16 and 17 Years | 11 (28.9%) | 87 (68.5%) |
| 18 to 24 Years | 25 (6.6%) | 0 (0.0%) |
| 25 to 34 Years | 65 (18.2%) | 27 (10.3%) |
| 35 to 44 Years | 0 (0.0%) | 121 (48.6%) |
| 45 to 54 Years | 23 (8.8%) | 10 (3.5%) |
| 55 to 64 Years | 77 (17.1%) | 9 (1.6%) |
| 65 to 74 Years | 0 (0.0%) | 74 (18.2%) |
| 75 Years and over | 14 (9.5%) | 38 (28.6%) |
| Total | 486 (16.2%) | 443 (17.8%) |
Income Above Poverty by Sex and Age in Rainsville
According to the poverty statistics in Rainsville, males aged 35 to 44 years and females aged 5 years are the age groups that are most secure financially, with 100.0% of males and 100.0% of females in these age groups living above the poverty line.
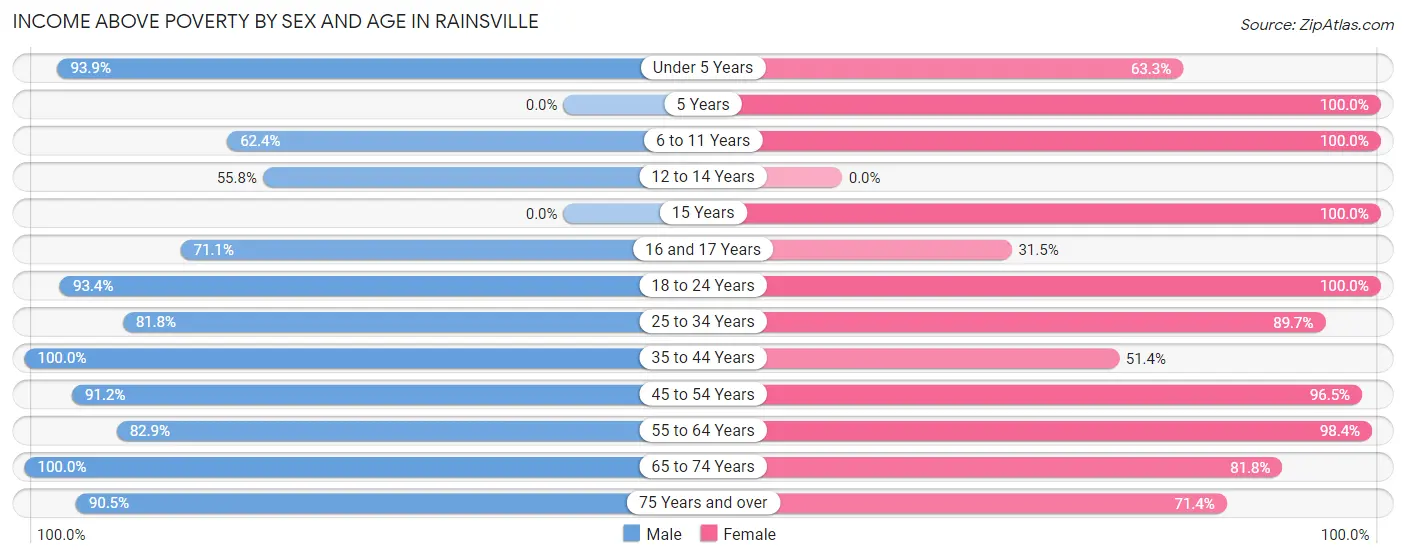
| Age Bracket | Male | Female |
| Under 5 Years | 169 (93.9%) | 133 (63.3%) |
| 5 Years | 0 (0.0%) | 22 (100.0%) |
| 6 to 11 Years | 146 (62.4%) | 63 (100.0%) |
| 12 to 14 Years | 101 (55.8%) | 0 (0.0%) |
| 15 Years | 0 (0.0%) | 32 (100.0%) |
| 16 and 17 Years | 27 (71.1%) | 40 (31.5%) |
| 18 to 24 Years | 355 (93.4%) | 137 (100.0%) |
| 25 to 34 Years | 292 (81.8%) | 236 (89.7%) |
| 35 to 44 Years | 162 (100.0%) | 128 (51.4%) |
| 45 to 54 Years | 238 (91.2%) | 279 (96.5%) |
| 55 to 64 Years | 373 (82.9%) | 555 (98.4%) |
| 65 to 74 Years | 515 (100.0%) | 332 (81.8%) |
| 75 Years and over | 133 (90.5%) | 95 (71.4%) |
| Total | 2,511 (83.8%) | 2,052 (82.2%) |
Income Below Poverty Among Married-Couple Families in Rainsville
The poverty statistics for married-couple families in Rainsville show that 5.9% or 95 of the total 1,596 families live below the poverty line. Families with 5 or more children have the highest poverty rate of 100.0%, comprising of 72 families. On the other hand, families with no children have the lowest poverty rate of 0.0%, which includes 0 families.
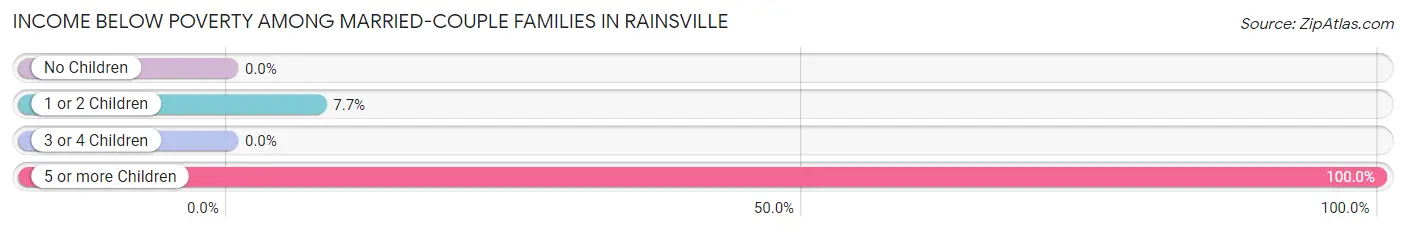
| Children | Above Poverty | Below Poverty |
| No Children | 1,125 (100.0%) | 0 (0.0%) |
| 1 or 2 Children | 276 (92.3%) | 23 (7.7%) |
| 3 or 4 Children | 100 (100.0%) | 0 (0.0%) |
| 5 or more Children | 0 (0.0%) | 72 (100.0%) |
| Total | 1,501 (94.1%) | 95 (5.9%) |
Income Below Poverty Among Single-Parent Households in Rainsville
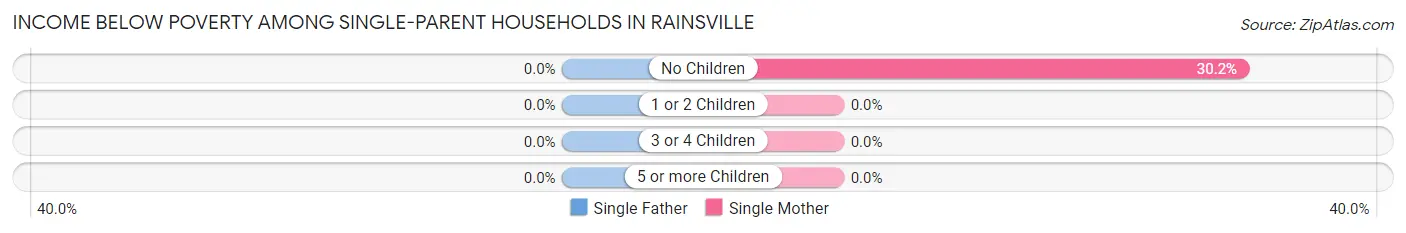
| Children | Single Father | Single Mother |
| No Children | 0 (0.0%) | 16 (30.2%) |
| 1 or 2 Children | 0 (0.0%) | 0 (0.0%) |
| 3 or 4 Children | 0 (0.0%) | 0 (0.0%) |
| 5 or more Children | 0 (0.0%) | 0 (0.0%) |
| Total | 0 (0.0%) | 16 (16.3%) |
Income Below Poverty Among Married-Couple vs Single-Parent Households in Rainsville
The poverty data for Rainsville shows that 95 of the married-couple family households (5.9%) and 16 of the single-parent households (15.5%) are living below the poverty level. Within the married-couple family households, those with 5 or more children have the highest poverty rate, with 72 households (100.0%) falling below the poverty line. Among the single-parent households, those with no children have the highest poverty rate, with 16 household (30.2%) living below poverty.
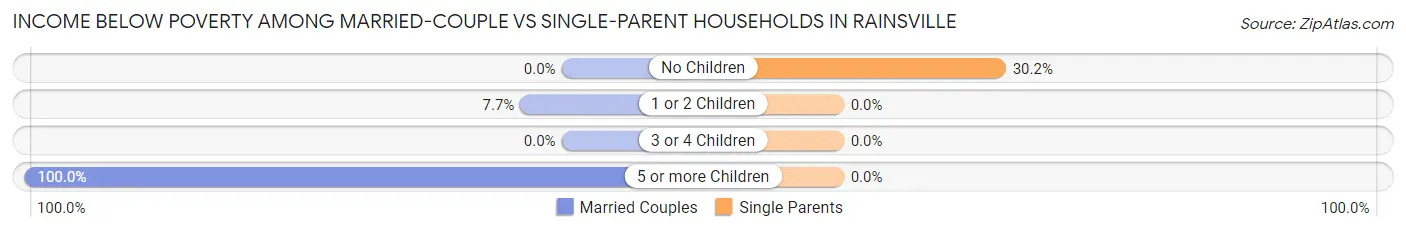
| Children | Married-Couple Families | Single-Parent Households |
| No Children | 0 (0.0%) | 16 (30.2%) |
| 1 or 2 Children | 23 (7.7%) | 0 (0.0%) |
| 3 or 4 Children | 0 (0.0%) | 0 (0.0%) |
| 5 or more Children | 72 (100.0%) | 0 (0.0%) |
| Total | 95 (5.9%) | 16 (15.5%) |
Race in Rainsville
The most populous races in Rainsville are White / Caucasian (4,689 | 84.6%), Hispanic or Latino (524 | 9.5%), and Some other Race (524 | 9.5%).
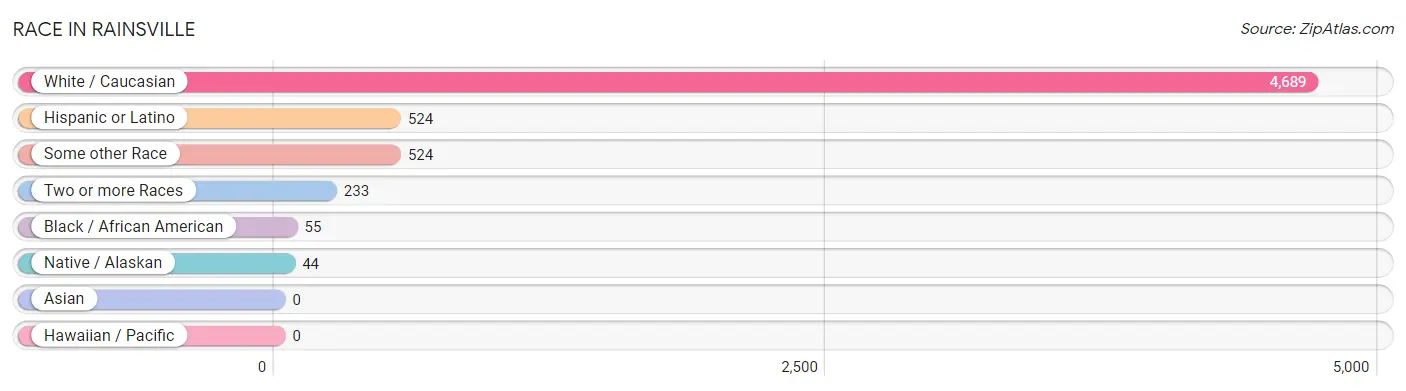
| Race | # Population | % Population |
| Asian | 0 | 0.0% |
| Black / African American | 55 | 1.0% |
| Hawaiian / Pacific | 0 | 0.0% |
| Hispanic or Latino | 524 | 9.5% |
| Native / Alaskan | 44 | 0.8% |
| White / Caucasian | 4,689 | 84.6% |
| Two or more Races | 233 | 4.2% |
| Some other Race | 524 | 9.5% |
| Total | 5,545 | 100.0% |
Ancestry in Rainsville
The most populous ancestries reported in Rainsville are English (957 | 17.3%), American (833 | 15.0%), Central American (524 | 9.5%), Guatemalan (524 | 9.5%), and German (463 | 8.4%), together accounting for 59.5% of all Rainsville residents.
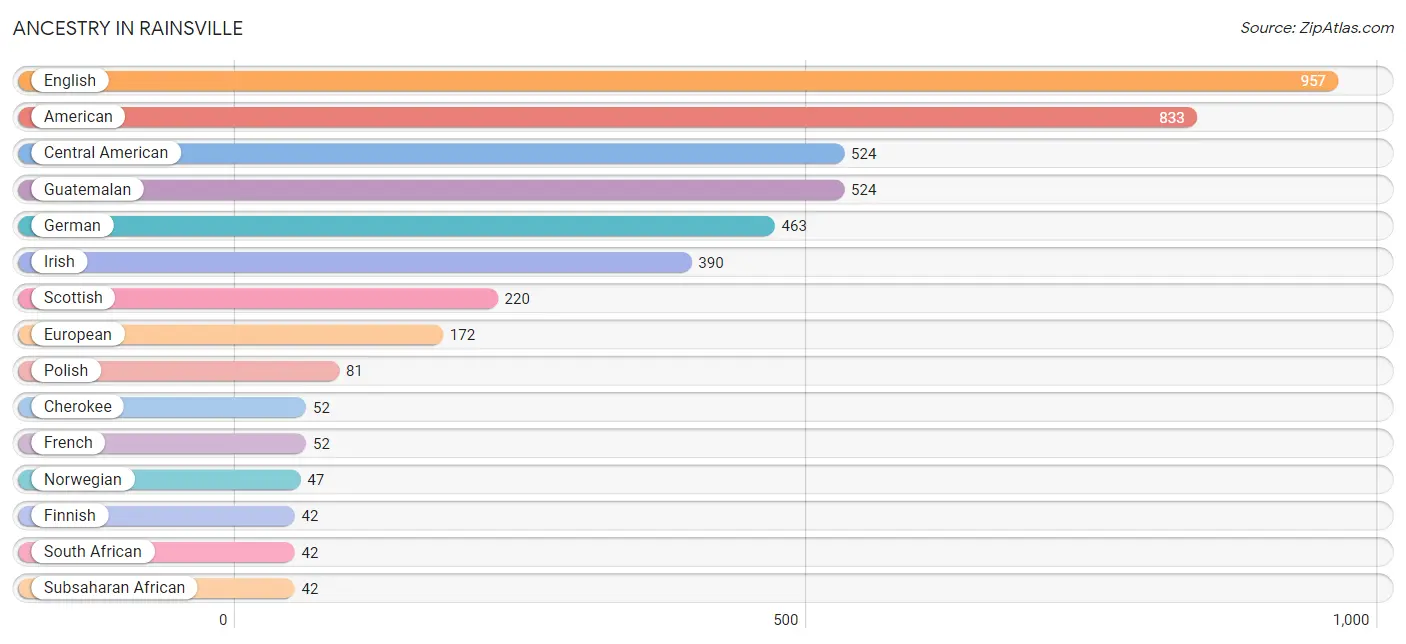
| Ancestry | # Population | % Population |
| American | 833 | 15.0% |
| Blackfeet | 41 | 0.7% |
| British | 25 | 0.4% |
| Central American | 524 | 9.5% |
| Cherokee | 52 | 0.9% |
| Creek | 33 | 0.6% |
| Dutch | 10 | 0.2% |
| English | 957 | 17.3% |
| European | 172 | 3.1% |
| Finnish | 42 | 0.8% |
| French | 52 | 0.9% |
| German | 463 | 8.4% |
| Guatemalan | 524 | 9.5% |
| Irish | 390 | 7.0% |
| Norwegian | 47 | 0.9% |
| Polish | 81 | 1.5% |
| Russian | 33 | 0.6% |
| Scandinavian | 16 | 0.3% |
| Scottish | 220 | 4.0% |
| South African | 42 | 0.8% |
| Subsaharan African | 42 | 0.8% | View All 21 Rows |
Immigrants in Rainsville
The most numerous immigrant groups reported in Rainsville came from Central America (121 | 2.2%), Guatemala (121 | 2.2%), Latin America (121 | 2.2%), Canada (26 | 0.5%), and Africa (13 | 0.2%), together accounting for 7.2% of all Rainsville residents.
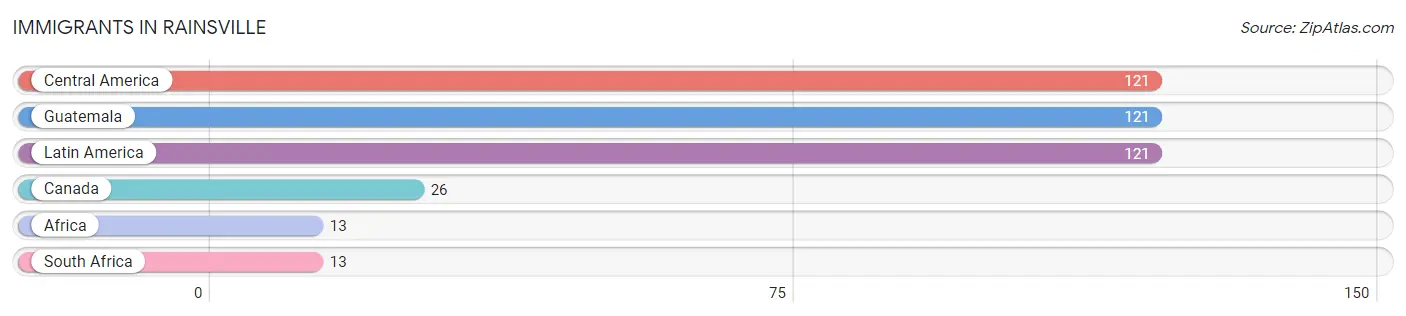
| Immigration Origin | # Population | % Population |
| Africa | 13 | 0.2% |
| Canada | 26 | 0.5% |
| Central America | 121 | 2.2% |
| Guatemala | 121 | 2.2% |
| Latin America | 121 | 2.2% |
| South Africa | 13 | 0.2% | View All 6 Rows |
Sex and Age in Rainsville
Sex and Age in Rainsville
The most populous age groups in Rainsville are 60 to 64 Years (309 | 10.2%) for men and 55 to 59 Years (292 | 11.6%) for women.
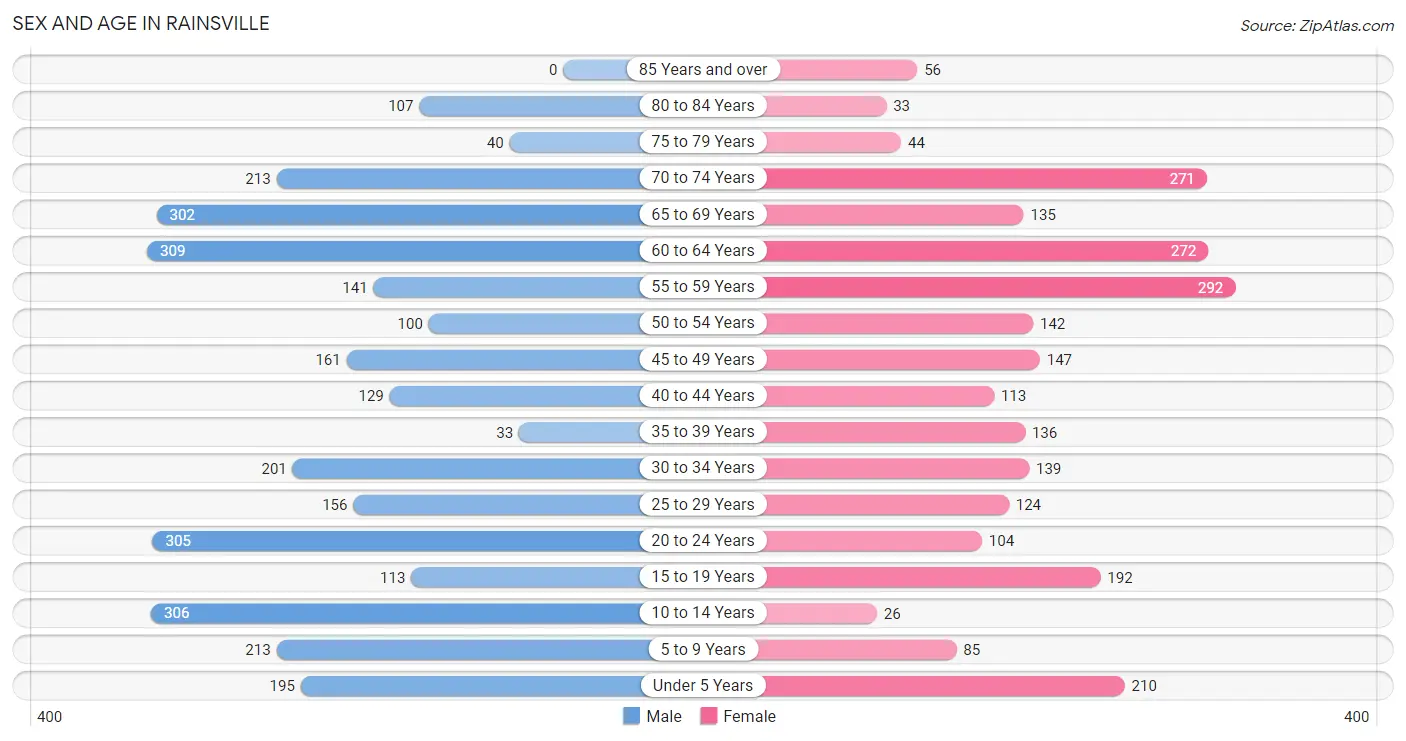
| Age Bracket | Male | Female |
| Under 5 Years | 195 (6.5%) | 210 (8.3%) |
| 5 to 9 Years | 213 (7.0%) | 85 (3.4%) |
| 10 to 14 Years | 306 (10.1%) | 26 (1.0%) |
| 15 to 19 Years | 113 (3.7%) | 192 (7.6%) |
| 20 to 24 Years | 305 (10.1%) | 104 (4.1%) |
| 25 to 29 Years | 156 (5.2%) | 124 (4.9%) |
| 30 to 34 Years | 201 (6.7%) | 139 (5.5%) |
| 35 to 39 Years | 33 (1.1%) | 136 (5.4%) |
| 40 to 44 Years | 129 (4.3%) | 113 (4.5%) |
| 45 to 49 Years | 161 (5.3%) | 147 (5.8%) |
| 50 to 54 Years | 100 (3.3%) | 142 (5.6%) |
| 55 to 59 Years | 141 (4.7%) | 292 (11.6%) |
| 60 to 64 Years | 309 (10.2%) | 272 (10.8%) |
| 65 to 69 Years | 302 (10.0%) | 135 (5.4%) |
| 70 to 74 Years | 213 (7.0%) | 271 (10.7%) |
| 75 to 79 Years | 40 (1.3%) | 44 (1.8%) |
| 80 to 84 Years | 107 (3.5%) | 33 (1.3%) |
| 85 Years and over | 0 (0.0%) | 56 (2.2%) |
| Total | 3,024 (100.0%) | 2,521 (100.0%) |
Families and Households in Rainsville
Median Family Size in Rainsville
The median family size in Rainsville is 2.90 persons per family, with single male/father families (5 | 0.3%) accounting for the largest median family size of 3.6 persons per family. On the other hand, married-couple families (1,596 | 93.9%) represent the smallest median family size with 2.89 persons per family.
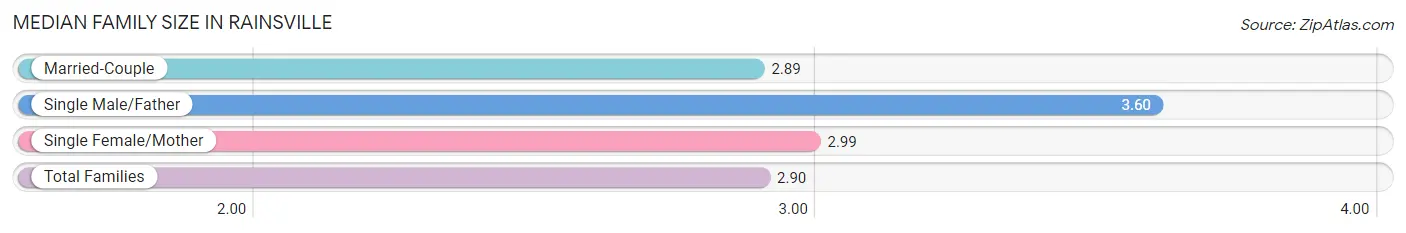
| Family Type | # Families | Family Size |
| Married-Couple | 1,596 (93.9%) | 2.89 |
| Single Male/Father | 5 (0.3%) | 3.60 |
| Single Female/Mother | 98 (5.8%) | 2.99 |
| Total Families | 1,699 (100.0%) | 2.90 |
Median Household Size in Rainsville
The median household size in Rainsville is 2.54 persons per household, with single male/father households (5 | 0.2%) accounting for the largest median household size of 3.6 persons per household. non-family households (483 | 22.1%) represent the smallest median household size with 1.18 persons per household.
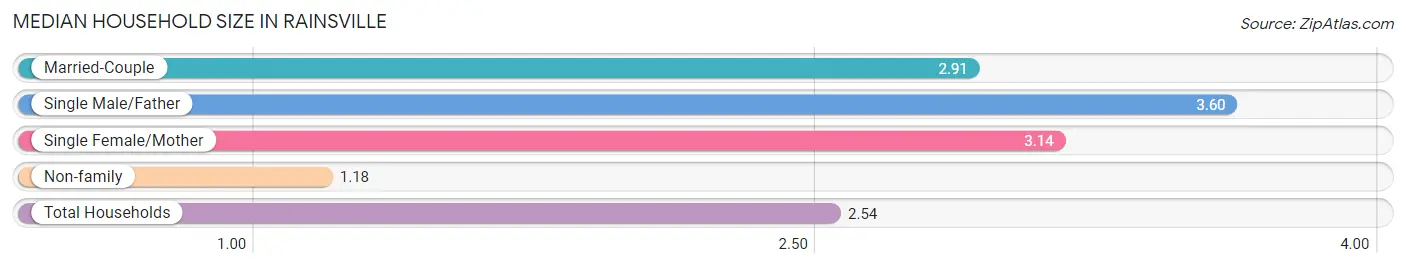
| Household Type | # Households | Household Size |
| Married-Couple | 1,596 (73.1%) | 2.91 |
| Single Male/Father | 5 (0.2%) | 3.60 |
| Single Female/Mother | 98 (4.5%) | 3.14 |
| Non-family | 483 (22.1%) | 1.18 |
| Total Households | 2,182 (100.0%) | 2.54 |
Household Size by Marriage Status in Rainsville
Out of a total of 2,182 households in Rainsville, 1,699 (77.9%) are family households, while 483 (22.1%) are nonfamily households. The most numerous type of family households are 2-person households, comprising 979, and the most common type of nonfamily households are 1-person households, comprising 431.
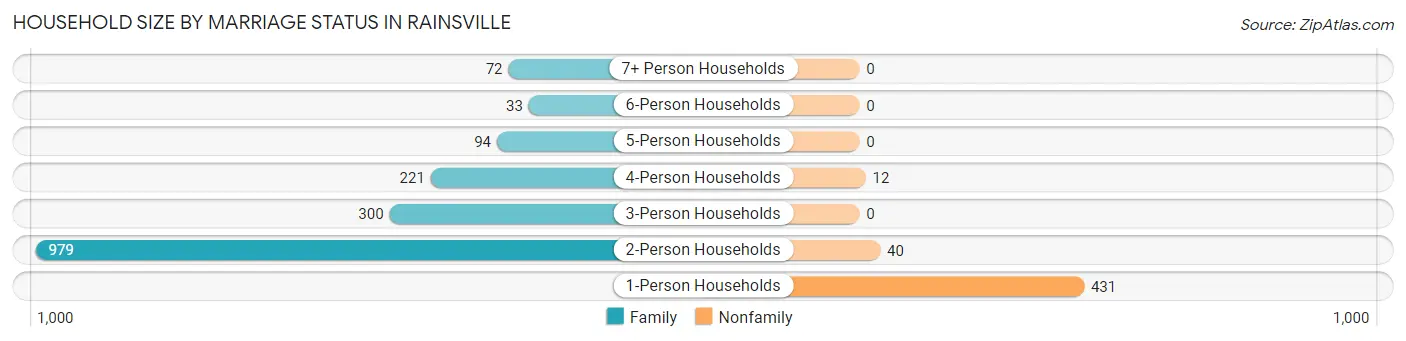
| Household Size | Family Households | Nonfamily Households |
| 1-Person Households | - | 431 (19.8%) |
| 2-Person Households | 979 (44.9%) | 40 (1.8%) |
| 3-Person Households | 300 (13.8%) | 0 (0.0%) |
| 4-Person Households | 221 (10.1%) | 12 (0.5%) |
| 5-Person Households | 94 (4.3%) | 0 (0.0%) |
| 6-Person Households | 33 (1.5%) | 0 (0.0%) |
| 7+ Person Households | 72 (3.3%) | 0 (0.0%) |
| Total | 1,699 (77.9%) | 483 (22.1%) |
Female Fertility in Rainsville
Fertility by Age in Rainsville
Average fertility rate in Rainsville is 114.0 births per 1,000 women. Women in the age bracket of 35 to 50 years have the highest fertility rate with 159.0 births per 1,000 women. Women in the age bracket of 35 to 50 years acount for 62.6% of all women with births.
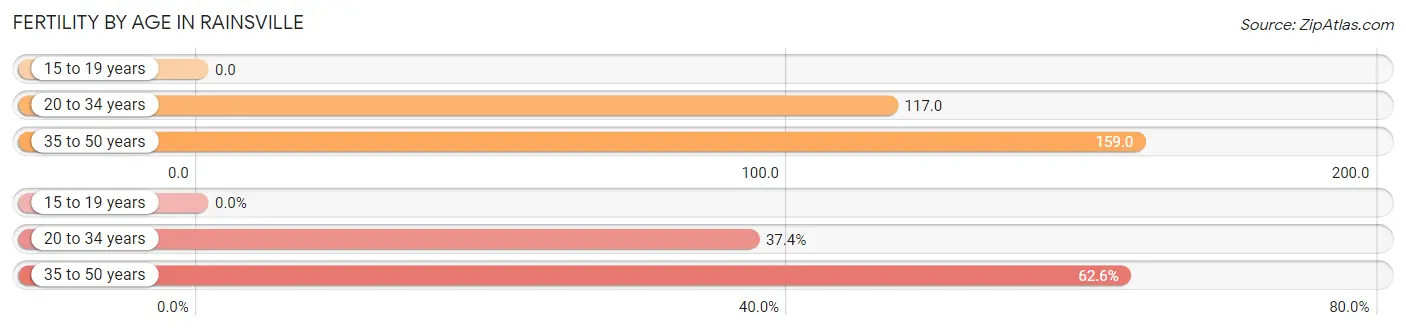
| Age Bracket | Women with Births | Births / 1,000 Women |
| 15 to 19 years | 0 (0.0%) | 0.0 |
| 20 to 34 years | 43 (37.4%) | 117.0 |
| 35 to 50 years | 72 (62.6%) | 159.0 |
| Total | 115 (100.0%) | 114.0 |
Fertility by Age by Marriage Status in Rainsville
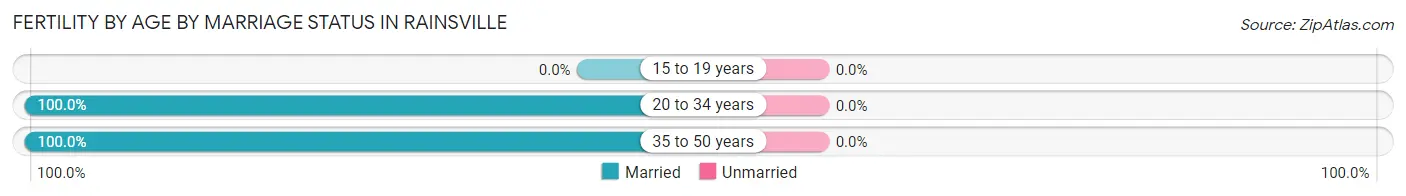
| Age Bracket | Married | Unmarried |
| 15 to 19 years | 0 (0.0%) | 0 (0.0%) |
| 20 to 34 years | 43 (100.0%) | 0 (0.0%) |
| 35 to 50 years | 72 (100.0%) | 0 (0.0%) |
| Total | 115 (100.0%) | 0 (0.0%) |
Fertility by Education in Rainsville
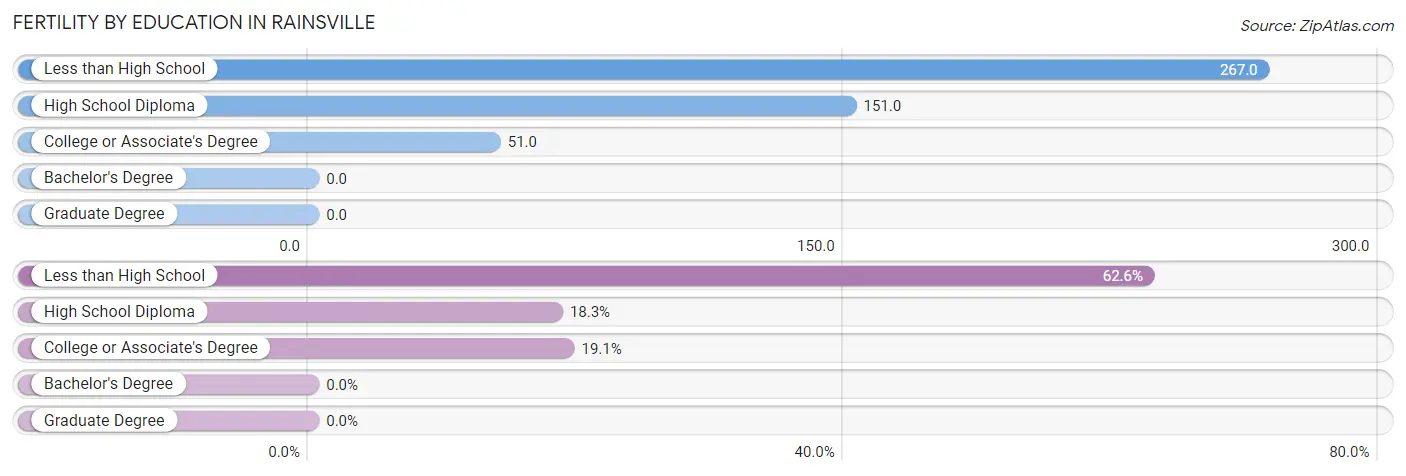
| Educational Attainment | Women with Births | Births / 1,000 Women |
| Less than High School | 72 (62.6%) | 267.0 |
| High School Diploma | 21 (18.3%) | 151.0 |
| College or Associate's Degree | 22 (19.1%) | 51.0 |
| Bachelor's Degree | 0 (0.0%) | 0.0 |
| Graduate Degree | 0 (0.0%) | 0.0 |
| Total | 115 (100.0%) | 114.0 |
Fertility by Education by Marriage Status in Rainsville
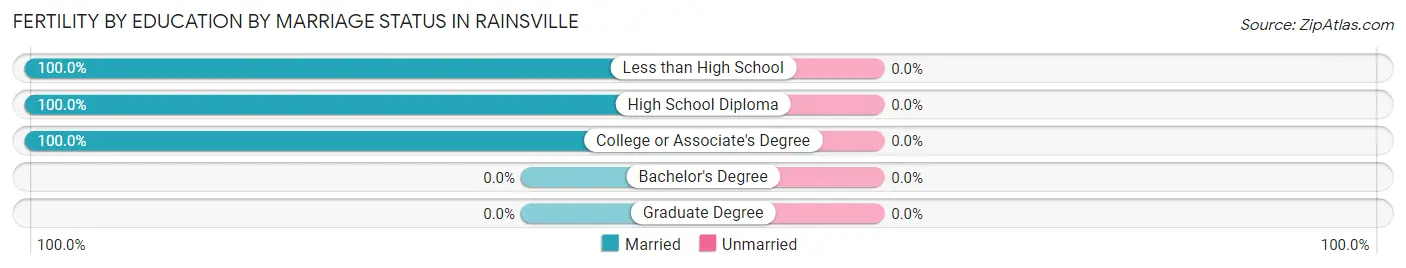
| Educational Attainment | Married | Unmarried |
| Less than High School | 72 (100.0%) | 0 (0.0%) |
| High School Diploma | 21 (100.0%) | 0 (0.0%) |
| College or Associate's Degree | 22 (100.0%) | 0 (0.0%) |
| Bachelor's Degree | 0 (0.0%) | 0 (0.0%) |
| Graduate Degree | 0 (0.0%) | 0 (0.0%) |
| Total | 115 (100.0%) | 0 (0.0%) |
Employment Characteristics in Rainsville
Employment by Class of Employer in Rainsville
Among the 2,549 employed individuals in Rainsville, private company employees (1,548 | 60.7%), self-employed (incorporated) (405 | 15.9%), and local government employees (225 | 8.8%) make up the most common classes of employment.
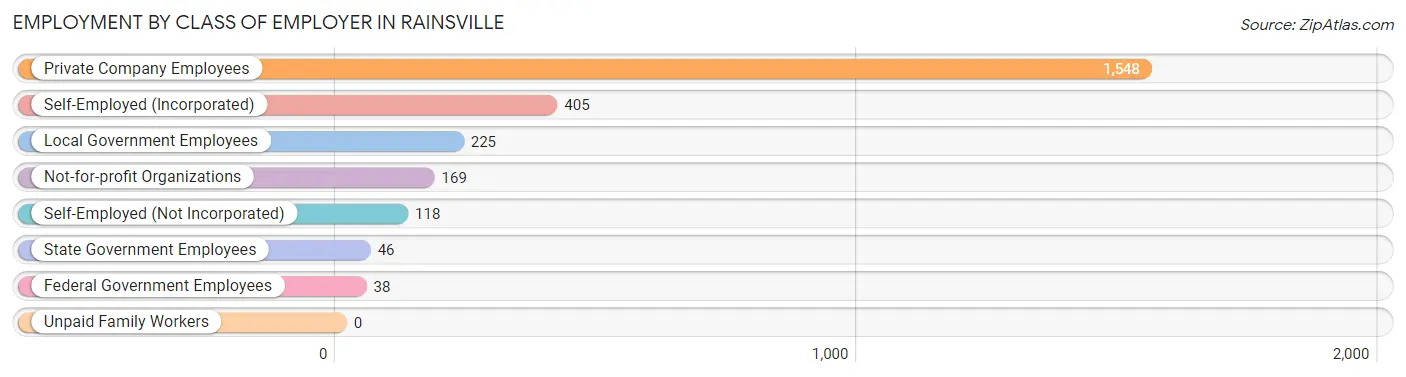
| Employer Class | # Employees | % Employees |
| Private Company Employees | 1,548 | 60.7% |
| Self-Employed (Incorporated) | 405 | 15.9% |
| Self-Employed (Not Incorporated) | 118 | 4.6% |
| Not-for-profit Organizations | 169 | 6.6% |
| Local Government Employees | 225 | 8.8% |
| State Government Employees | 46 | 1.8% |
| Federal Government Employees | 38 | 1.5% |
| Unpaid Family Workers | 0 | 0.0% |
| Total | 2,549 | 100.0% |
Employment Status by Age in Rainsville
According to the labor force statistics for Rainsville, out of the total population over 16 years of age (4,478), 58.0% or 2,597 individuals are in the labor force, with 1.2% or 31 of them unemployed. The age group with the highest labor force participation rate is 20 to 24 years, with 95.1% or 389 individuals in the labor force. Within the labor force, the 20 to 24 years age range has the highest percentage of unemployed individuals, with 4.6% or 18 of them being unemployed.
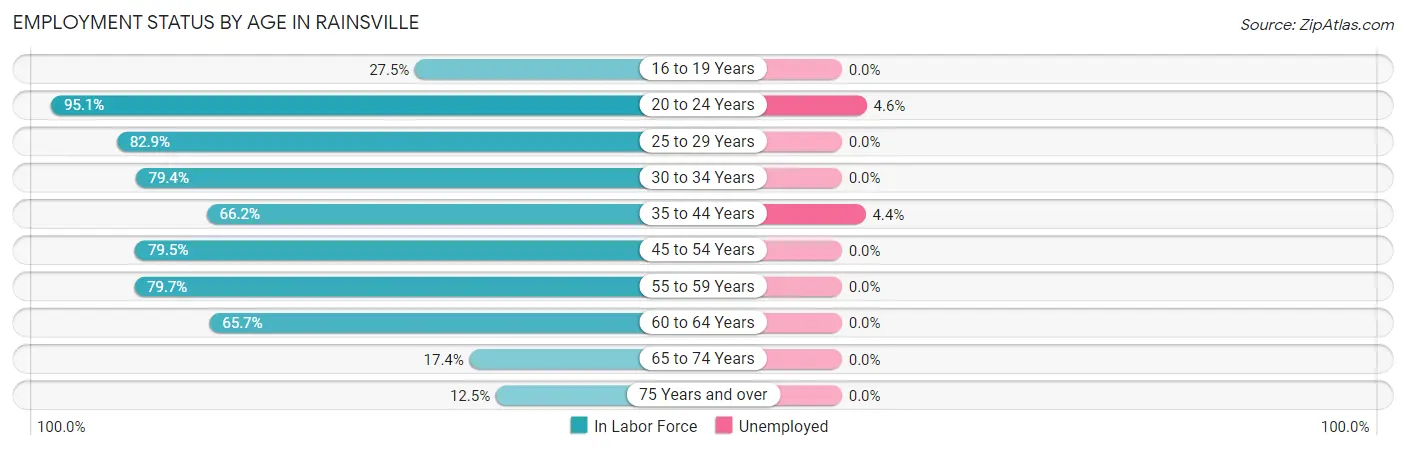
| Age Bracket | In Labor Force | Unemployed |
| 16 to 19 Years | 75 (27.5%) | 0 (0.0%) |
| 20 to 24 Years | 389 (95.1%) | 18 (4.6%) |
| 25 to 29 Years | 232 (82.9%) | 0 (0.0%) |
| 30 to 34 Years | 270 (79.4%) | 0 (0.0%) |
| 35 to 44 Years | 272 (66.2%) | 12 (4.4%) |
| 45 to 54 Years | 437 (79.5%) | 0 (0.0%) |
| 55 to 59 Years | 345 (79.7%) | 0 (0.0%) |
| 60 to 64 Years | 382 (65.7%) | 0 (0.0%) |
| 65 to 74 Years | 160 (17.4%) | 0 (0.0%) |
| 75 Years and over | 35 (12.5%) | 0 (0.0%) |
| Total | 2,597 (58.0%) | 31 (1.2%) |
Employment Status by Educational Attainment in Rainsville
According to labor force statistics for Rainsville, 74.7% of individuals (1,938) out of the total population between 25 and 64 years of age (2,595) are in the labor force, with 0.6% or 12 of them being unemployed. The group with the highest labor force participation rate are those with the educational attainment of bachelor's degree or higher, with 95.4% or 722 individuals in the labor force. Within the labor force, individuals with high school diploma education have the highest percentage of unemployment, with 2.6% or 12 of them being unemployed.
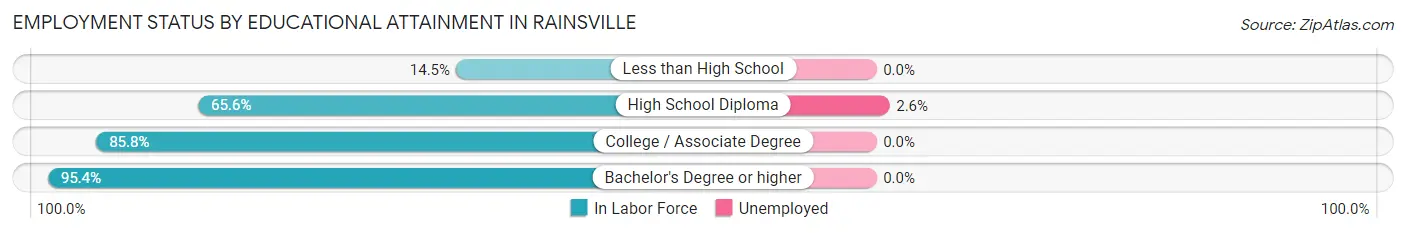
| Educational Attainment | In Labor Force | Unemployed |
| Less than High School | 45 (14.5%) | 0 (0.0%) |
| High School Diploma | 454 (65.6%) | 18 (2.6%) |
| College / Associate Degree | 717 (85.8%) | 0 (0.0%) |
| Bachelor's Degree or higher | 722 (95.4%) | 0 (0.0%) |
| Total | 1,938 (74.7%) | 16 (0.6%) |
Employment Occupations by Sex in Rainsville
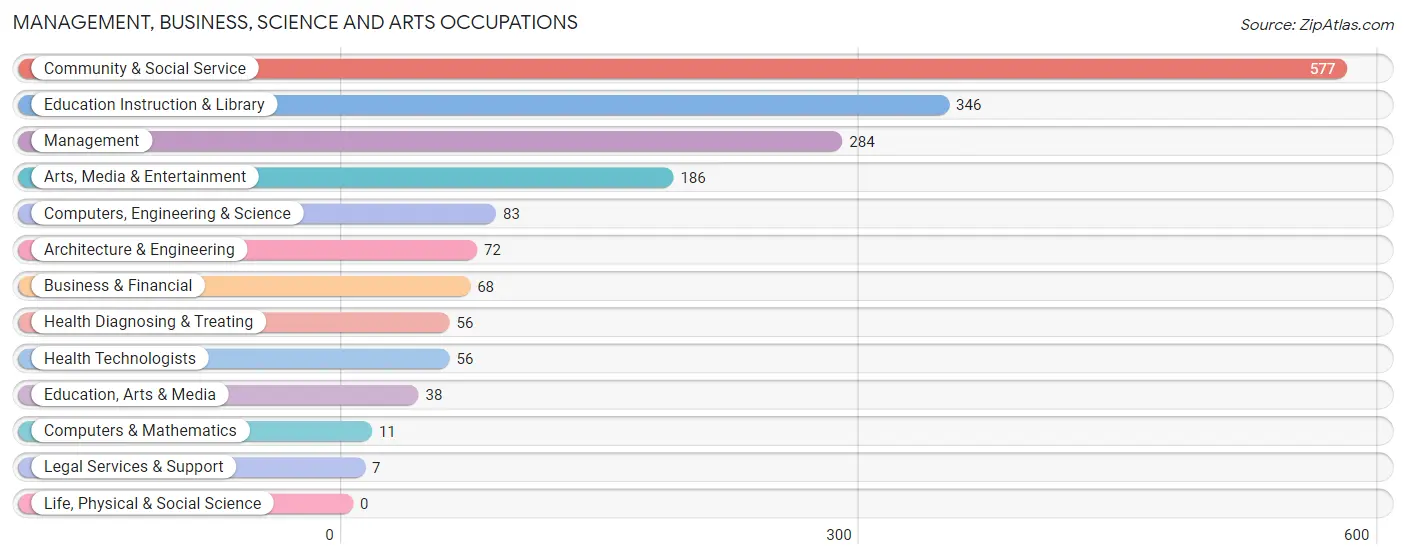
Management, Business, Science and Arts Occupations
The most common Management, Business, Science and Arts occupations in Rainsville are Community & Social Service (577 | 22.5%), Education Instruction & Library (346 | 13.5%), Management (284 | 11.1%), Arts, Media & Entertainment (186 | 7.2%), and Computers, Engineering & Science (83 | 3.2%).
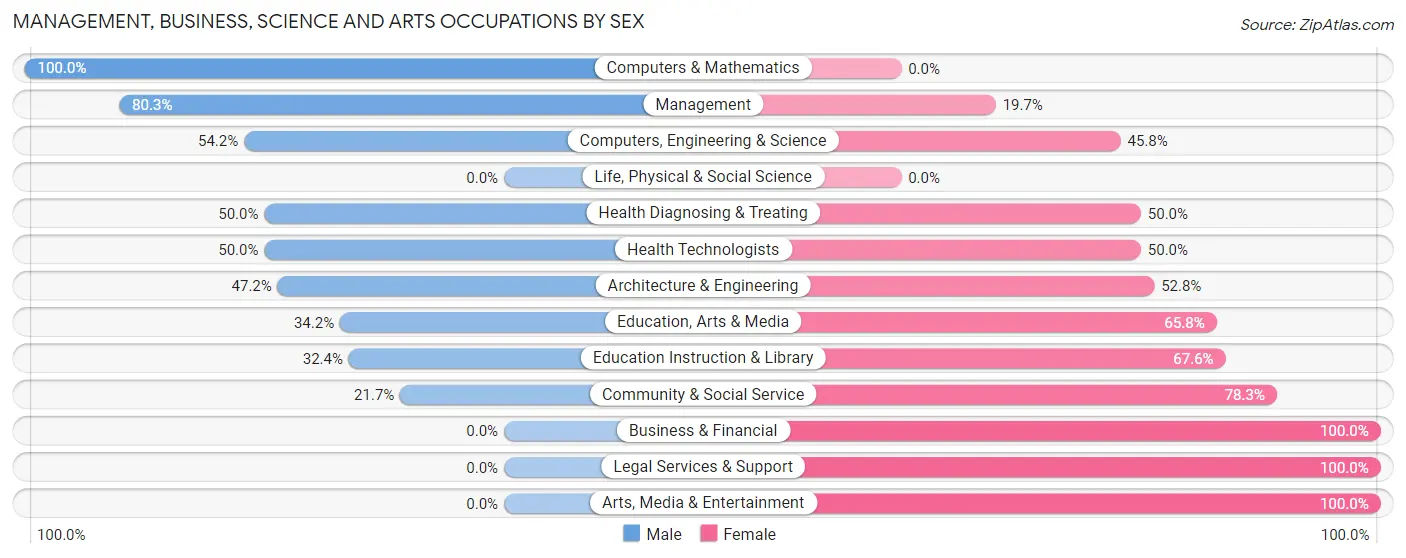
Management, Business, Science and Arts Occupations by Sex
Within the Management, Business, Science and Arts occupations in Rainsville, the most male-oriented occupations are Computers & Mathematics (100.0%), Management (80.3%), and Computers, Engineering & Science (54.2%), while the most female-oriented occupations are Business & Financial (100.0%), Legal Services & Support (100.0%), and Arts, Media & Entertainment (100.0%).
| Occupation | Male | Female |
| Management | 228 (80.3%) | 56 (19.7%) |
| Business & Financial | 0 (0.0%) | 68 (100.0%) |
| Computers, Engineering & Science | 45 (54.2%) | 38 (45.8%) |
| Computers & Mathematics | 11 (100.0%) | 0 (0.0%) |
| Architecture & Engineering | 34 (47.2%) | 38 (52.8%) |
| Life, Physical & Social Science | 0 (0.0%) | 0 (0.0%) |
| Community & Social Service | 125 (21.7%) | 452 (78.3%) |
| Education, Arts & Media | 13 (34.2%) | 25 (65.8%) |
| Legal Services & Support | 0 (0.0%) | 7 (100.0%) |
| Education Instruction & Library | 112 (32.4%) | 234 (67.6%) |
| Arts, Media & Entertainment | 0 (0.0%) | 186 (100.0%) |
| Health Diagnosing & Treating | 28 (50.0%) | 28 (50.0%) |
| Health Technologists | 28 (50.0%) | 28 (50.0%) |
| Total (Category) | 426 (39.9%) | 642 (60.1%) |
| Total (Overall) | 1,470 (57.3%) | 1,097 (42.7%) |
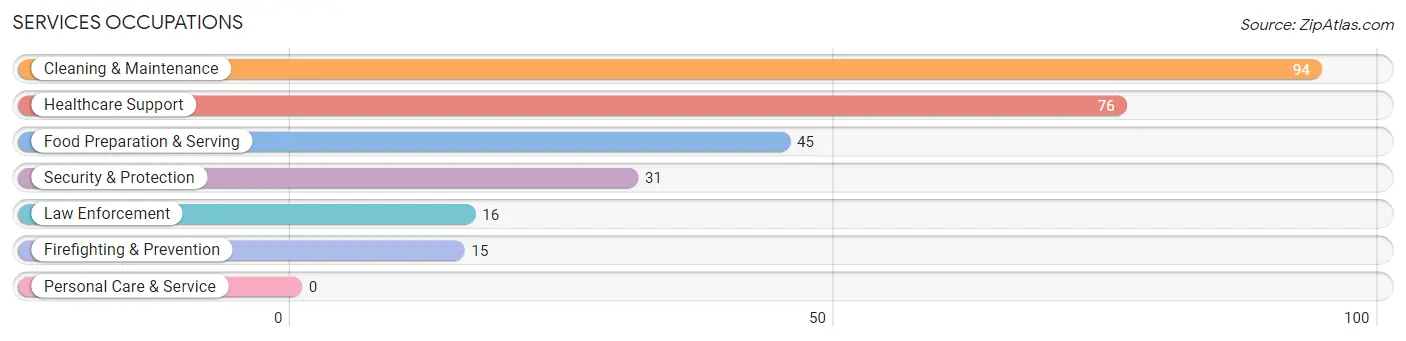
Services Occupations
The most common Services occupations in Rainsville are Cleaning & Maintenance (94 | 3.7%), Healthcare Support (76 | 3.0%), Food Preparation & Serving (45 | 1.8%), Security & Protection (31 | 1.2%), and Law Enforcement (16 | 0.6%).
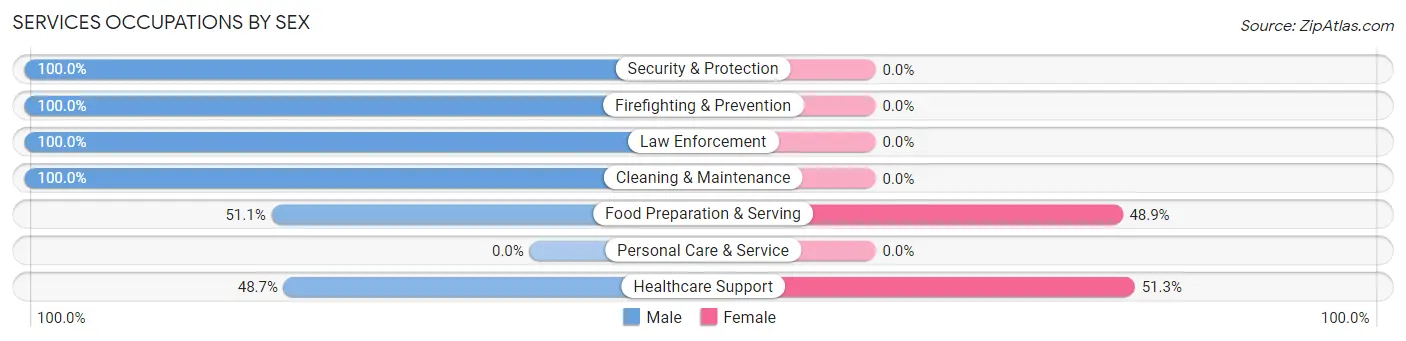
Services Occupations by Sex
Within the Services occupations in Rainsville, the most male-oriented occupations are Security & Protection (100.0%), Firefighting & Prevention (100.0%), and Law Enforcement (100.0%), while the most female-oriented occupations are Healthcare Support (51.3%), and Food Preparation & Serving (48.9%).
| Occupation | Male | Female |
| Healthcare Support | 37 (48.7%) | 39 (51.3%) |
| Security & Protection | 31 (100.0%) | 0 (0.0%) |
| Firefighting & Prevention | 15 (100.0%) | 0 (0.0%) |
| Law Enforcement | 16 (100.0%) | 0 (0.0%) |
| Food Preparation & Serving | 23 (51.1%) | 22 (48.9%) |
| Cleaning & Maintenance | 94 (100.0%) | 0 (0.0%) |
| Personal Care & Service | 0 (0.0%) | 0 (0.0%) |
| Total (Category) | 185 (75.2%) | 61 (24.8%) |
| Total (Overall) | 1,470 (57.3%) | 1,097 (42.7%) |
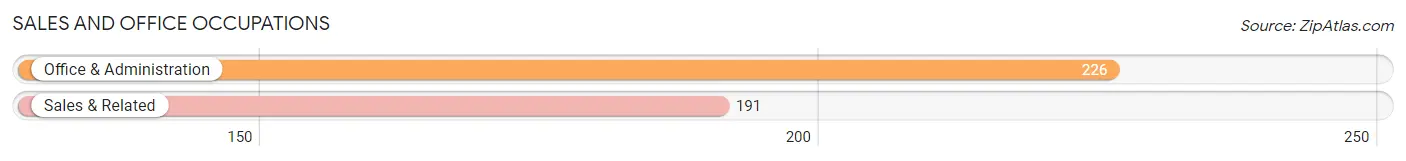
Sales and Office Occupations
The most common Sales and Office occupations in Rainsville are Office & Administration (226 | 8.8%), and Sales & Related (191 | 7.4%).
Sales and Office Occupations by Sex
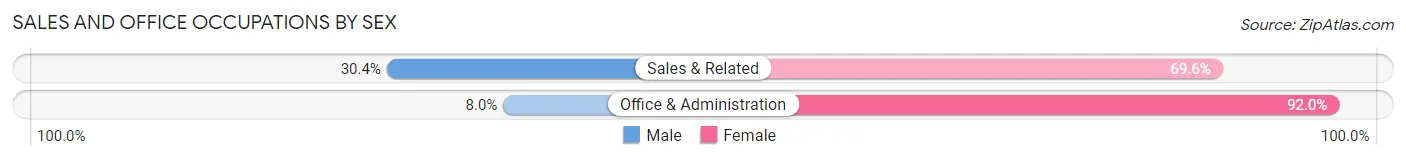
| Occupation | Male | Female |
| Sales & Related | 58 (30.4%) | 133 (69.6%) |
| Office & Administration | 18 (8.0%) | 208 (92.0%) |
| Total (Category) | 76 (18.2%) | 341 (81.8%) |
| Total (Overall) | 1,470 (57.3%) | 1,097 (42.7%) |
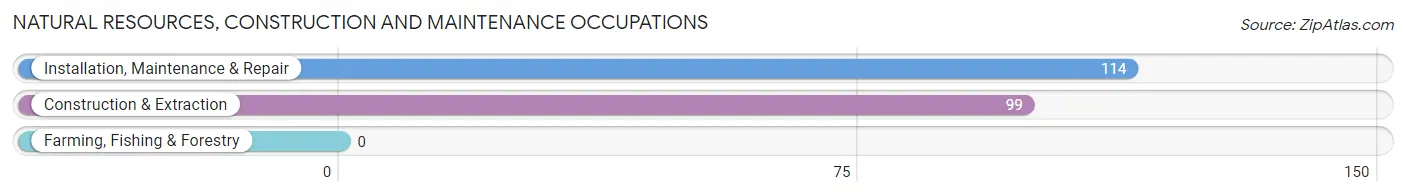
Natural Resources, Construction and Maintenance Occupations
The most common Natural Resources, Construction and Maintenance occupations in Rainsville are Installation, Maintenance & Repair (114 | 4.4%), and Construction & Extraction (99 | 3.9%).
Natural Resources, Construction and Maintenance Occupations by Sex
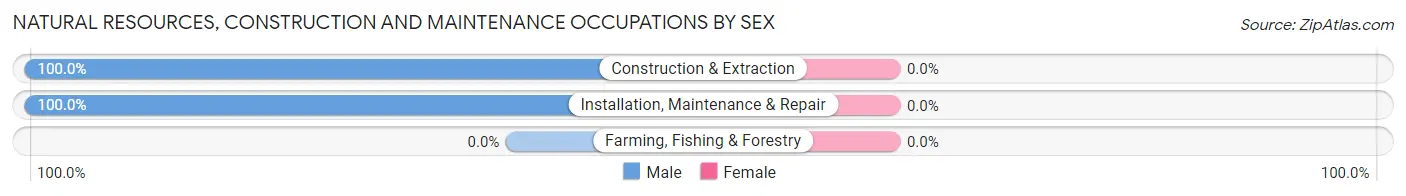
| Occupation | Male | Female |
| Farming, Fishing & Forestry | 0 (0.0%) | 0 (0.0%) |
| Construction & Extraction | 99 (100.0%) | 0 (0.0%) |
| Installation, Maintenance & Repair | 114 (100.0%) | 0 (0.0%) |
| Total (Category) | 213 (100.0%) | 0 (0.0%) |
| Total (Overall) | 1,470 (57.3%) | 1,097 (42.7%) |
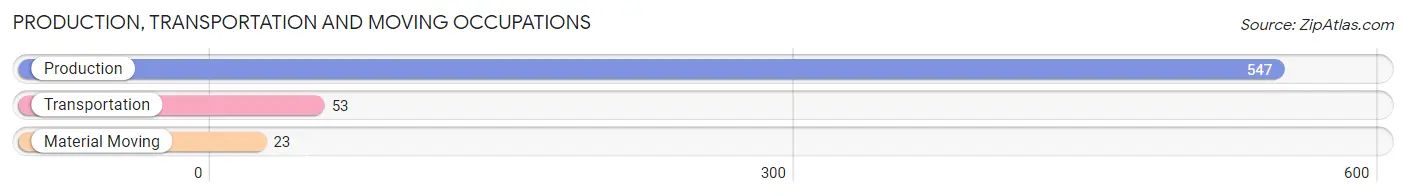
Production, Transportation and Moving Occupations
The most common Production, Transportation and Moving occupations in Rainsville are Production (547 | 21.3%), Transportation (53 | 2.1%), and Material Moving (23 | 0.9%).
Production, Transportation and Moving Occupations by Sex
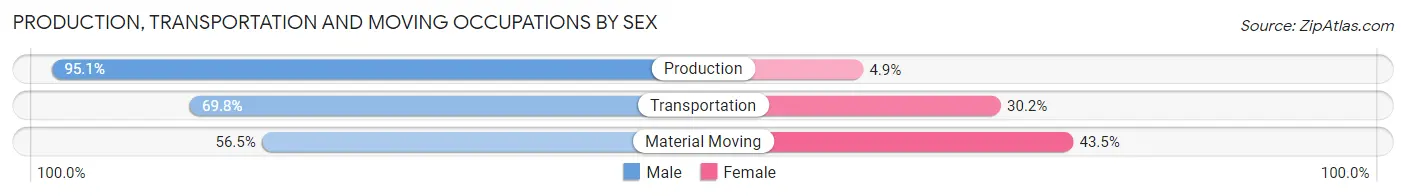
| Occupation | Male | Female |
| Production | 520 (95.1%) | 27 (4.9%) |
| Transportation | 37 (69.8%) | 16 (30.2%) |
| Material Moving | 13 (56.5%) | 10 (43.5%) |
| Total (Category) | 570 (91.5%) | 53 (8.5%) |
| Total (Overall) | 1,470 (57.3%) | 1,097 (42.7%) |
Employment Industries by Sex in Rainsville
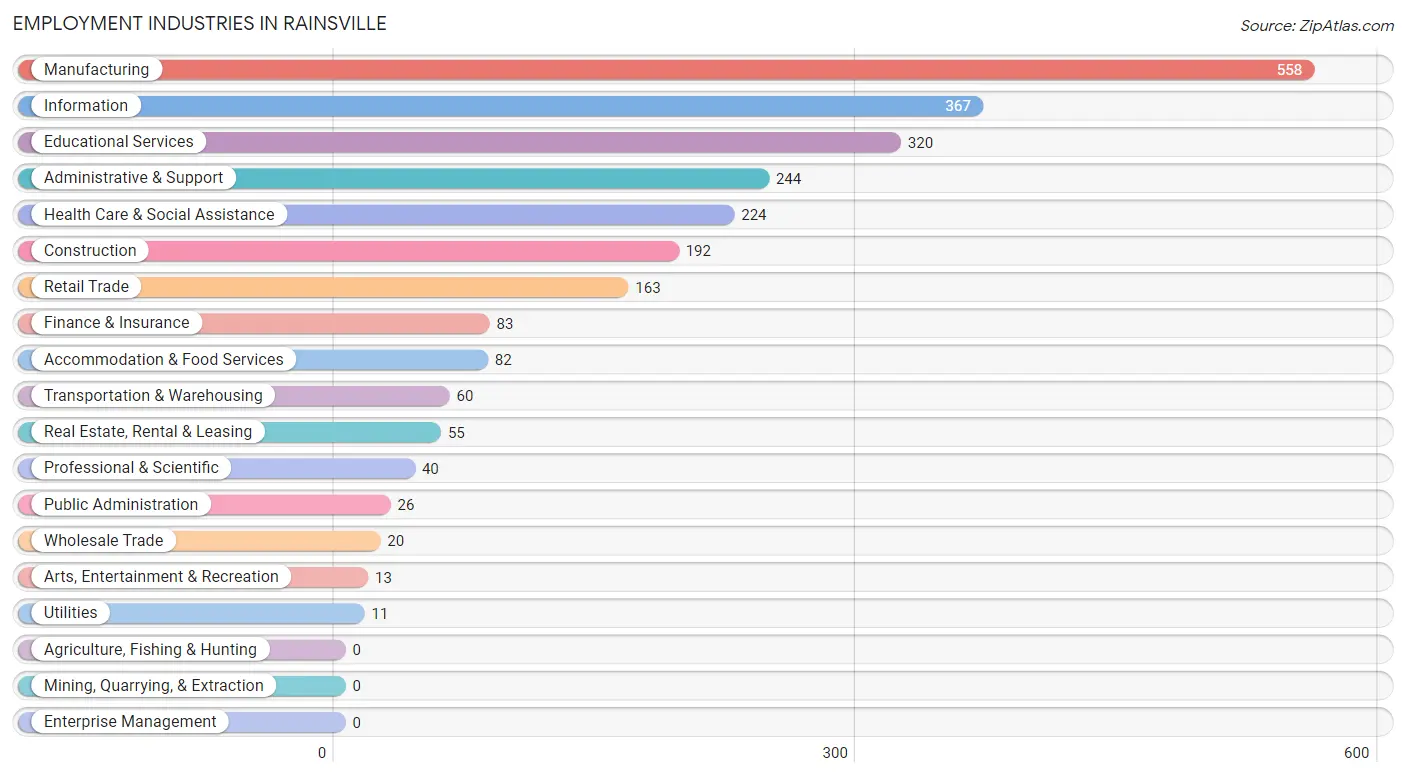
Employment Industries in Rainsville
The major employment industries in Rainsville include Manufacturing (558 | 21.7%), Information (367 | 14.3%), Educational Services (320 | 12.5%), Administrative & Support (244 | 9.5%), and Health Care & Social Assistance (224 | 8.7%).
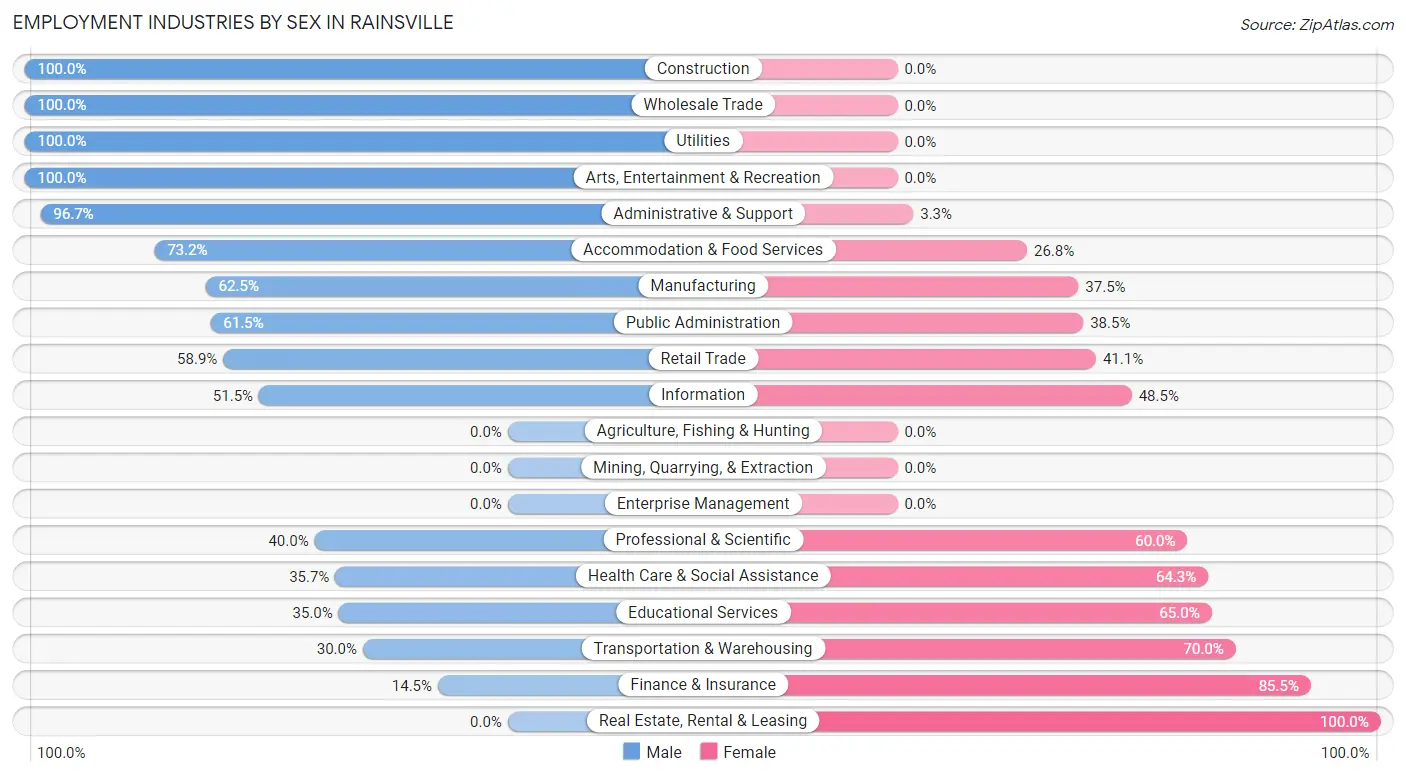
Employment Industries by Sex in Rainsville
The Rainsville industries that see more men than women are Construction (100.0%), Wholesale Trade (100.0%), and Utilities (100.0%), whereas the industries that tend to have a higher number of women are Real Estate, Rental & Leasing (100.0%), Finance & Insurance (85.5%), and Transportation & Warehousing (70.0%).
| Industry | Male | Female |
| Agriculture, Fishing & Hunting | 0 (0.0%) | 0 (0.0%) |
| Mining, Quarrying, & Extraction | 0 (0.0%) | 0 (0.0%) |
| Construction | 192 (100.0%) | 0 (0.0%) |
| Manufacturing | 349 (62.5%) | 209 (37.5%) |
| Wholesale Trade | 20 (100.0%) | 0 (0.0%) |
| Retail Trade | 96 (58.9%) | 67 (41.1%) |
| Transportation & Warehousing | 18 (30.0%) | 42 (70.0%) |
| Utilities | 11 (100.0%) | 0 (0.0%) |
| Information | 189 (51.5%) | 178 (48.5%) |
| Finance & Insurance | 12 (14.5%) | 71 (85.5%) |
| Real Estate, Rental & Leasing | 0 (0.0%) | 55 (100.0%) |
| Professional & Scientific | 16 (40.0%) | 24 (60.0%) |
| Enterprise Management | 0 (0.0%) | 0 (0.0%) |
| Administrative & Support | 236 (96.7%) | 8 (3.3%) |
| Educational Services | 112 (35.0%) | 208 (65.0%) |
| Health Care & Social Assistance | 80 (35.7%) | 144 (64.3%) |
| Arts, Entertainment & Recreation | 13 (100.0%) | 0 (0.0%) |
| Accommodation & Food Services | 60 (73.2%) | 22 (26.8%) |
| Public Administration | 16 (61.5%) | 10 (38.5%) |
| Total | 1,470 (57.3%) | 1,097 (42.7%) |
Education in Rainsville
School Enrollment in Rainsville
The most common levels of schooling among the 1,101 students in Rainsville are high school (344 | 31.2%), middle school (207 | 18.8%), and college / undergraduate (163 | 14.8%).
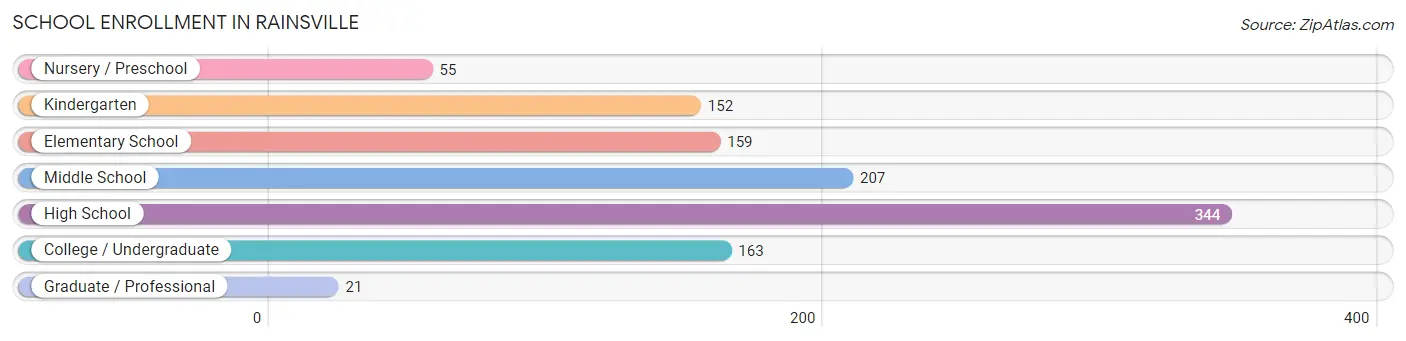
| School Level | # Students | % Students |
| Nursery / Preschool | 55 | 5.0% |
| Kindergarten | 152 | 13.8% |
| Elementary School | 159 | 14.4% |
| Middle School | 207 | 18.8% |
| High School | 344 | 31.2% |
| College / Undergraduate | 163 | 14.8% |
| Graduate / Professional | 21 | 1.9% |
| Total | 1,101 | 100.0% |
School Enrollment by Age by Funding Source in Rainsville
Out of a total of 1,101 students who are enrolled in schools in Rainsville, 63 (5.7%) attend a private institution, while the remaining 1,038 (94.3%) are enrolled in public schools. The age group of 5 to 9 year old has the highest likelihood of being enrolled in private schools, with 45 (15.1% in the age bracket) enrolled. Conversely, the age group of 3 to 4 year olds has the lowest likelihood of being enrolled in a private school, with 55 (100.0% in the age bracket) attending a public institution.
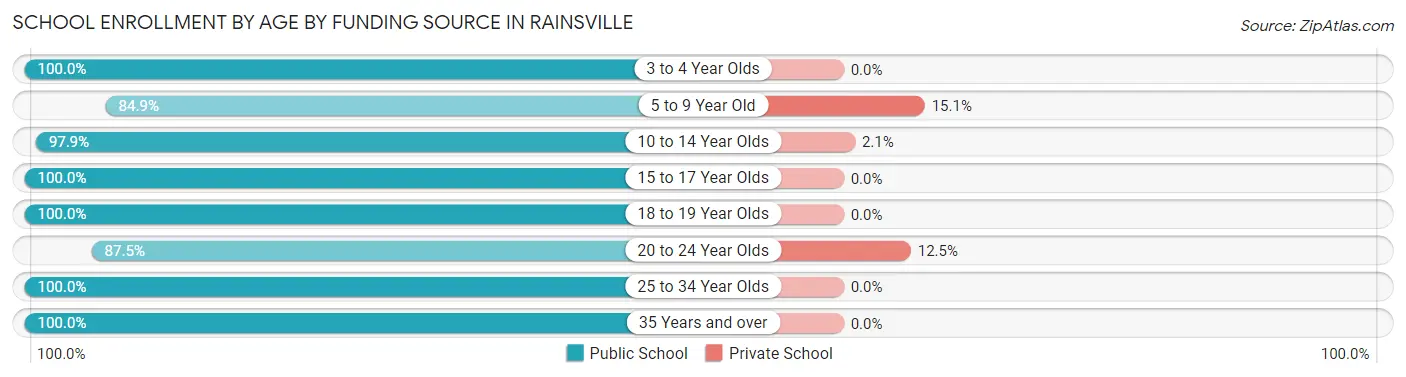
| Age Bracket | Public School | Private School |
| 3 to 4 Year Olds | 55 (100.0%) | 0 (0.0%) |
| 5 to 9 Year Old | 253 (84.9%) | 45 (15.1%) |
| 10 to 14 Year Olds | 325 (97.9%) | 7 (2.1%) |
| 15 to 17 Year Olds | 197 (100.0%) | 0 (0.0%) |
| 18 to 19 Year Olds | 108 (100.0%) | 0 (0.0%) |
| 20 to 24 Year Olds | 77 (87.5%) | 11 (12.5%) |
| 25 to 34 Year Olds | 10 (100.0%) | 0 (0.0%) |
| 35 Years and over | 13 (100.0%) | 0 (0.0%) |
| Total | 1,038 (94.3%) | 63 (5.7%) |
Educational Attainment by Field of Study in Rainsville
Education (339 | 35.0%), business (233 | 24.0%), psychology (218 | 22.5%), science & technology (99 | 10.2%), and social sciences (23 | 2.4%) are the most common fields of study among 969 individuals in Rainsville who have obtained a bachelor's degree or higher.
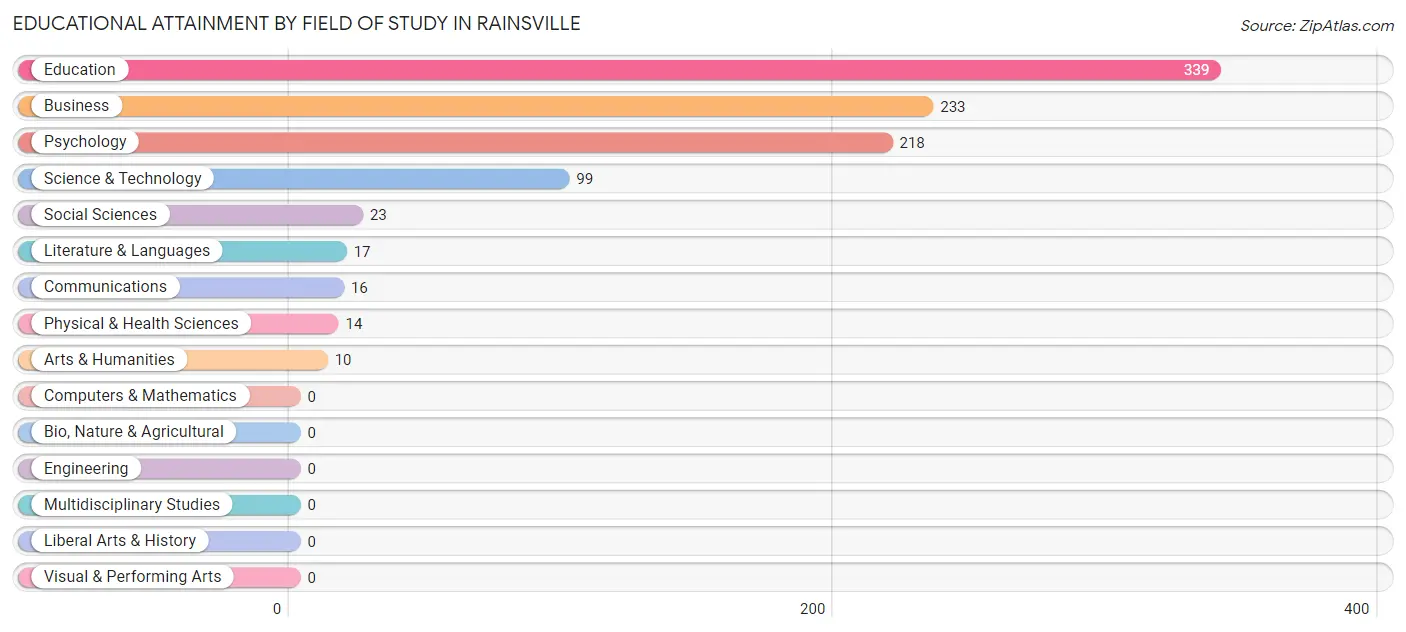
| Field of Study | # Graduates | % Graduates |
| Computers & Mathematics | 0 | 0.0% |
| Bio, Nature & Agricultural | 0 | 0.0% |
| Physical & Health Sciences | 14 | 1.4% |
| Psychology | 218 | 22.5% |
| Social Sciences | 23 | 2.4% |
| Engineering | 0 | 0.0% |
| Multidisciplinary Studies | 0 | 0.0% |
| Science & Technology | 99 | 10.2% |
| Business | 233 | 24.0% |
| Education | 339 | 35.0% |
| Literature & Languages | 17 | 1.8% |
| Liberal Arts & History | 0 | 0.0% |
| Visual & Performing Arts | 0 | 0.0% |
| Communications | 16 | 1.7% |
| Arts & Humanities | 10 | 1.0% |
| Total | 969 | 100.0% |
Transportation & Commute in Rainsville
Vehicle Availability by Sex in Rainsville
The most prevalent vehicle ownership categories in Rainsville are males with 2 vehicles (581, accounting for 40.0%) and females with 2 vehicles (554, making up 53.0%).
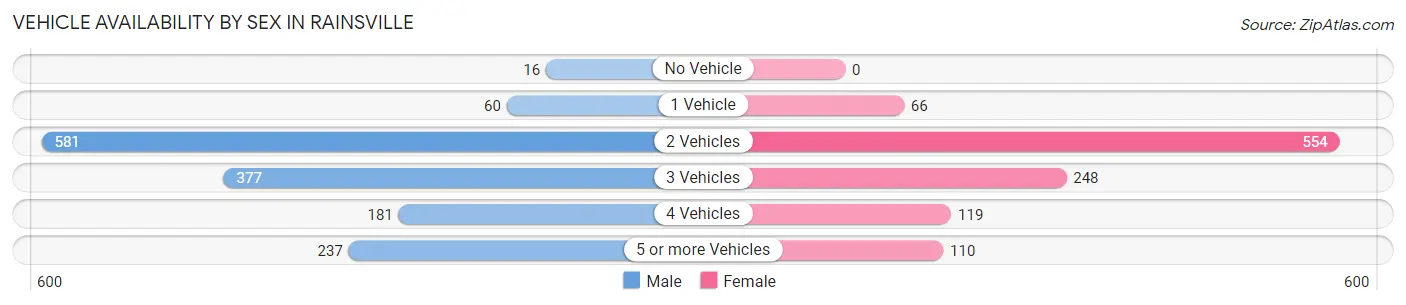
| Vehicles Available | Male | Female |
| No Vehicle | 16 (1.1%) | 0 (0.0%) |
| 1 Vehicle | 60 (4.1%) | 66 (6.0%) |
| 2 Vehicles | 581 (40.0%) | 554 (50.5%) |
| 3 Vehicles | 377 (26.0%) | 248 (22.6%) |
| 4 Vehicles | 181 (12.5%) | 119 (10.8%) |
| 5 or more Vehicles | 237 (16.3%) | 110 (10.0%) |
| Total | 1,452 (100.0%) | 1,097 (100.0%) |
Commute Time in Rainsville
The most frequently occuring commute durations in Rainsville are 5 to 9 minutes (716 commuters, 29.3%), 15 to 19 minutes (565 commuters, 23.2%), and 30 to 34 minutes (229 commuters, 9.4%).
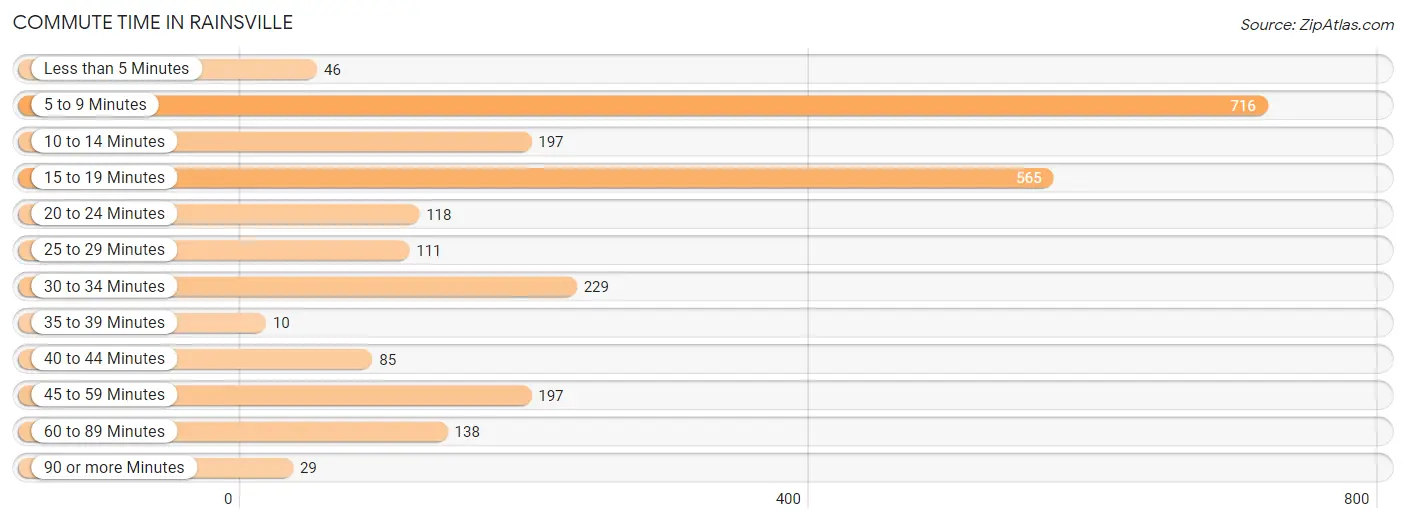
| Commute Time | # Commuters | % Commuters |
| Less than 5 Minutes | 46 | 1.9% |
| 5 to 9 Minutes | 716 | 29.3% |
| 10 to 14 Minutes | 197 | 8.1% |
| 15 to 19 Minutes | 565 | 23.2% |
| 20 to 24 Minutes | 118 | 4.8% |
| 25 to 29 Minutes | 111 | 4.5% |
| 30 to 34 Minutes | 229 | 9.4% |
| 35 to 39 Minutes | 10 | 0.4% |
| 40 to 44 Minutes | 85 | 3.5% |
| 45 to 59 Minutes | 197 | 8.1% |
| 60 to 89 Minutes | 138 | 5.7% |
| 90 or more Minutes | 29 | 1.2% |
Commute Time by Sex in Rainsville
The most common commute times in Rainsville are 5 to 9 minutes (385 commuters, 28.0%) for males and 5 to 9 minutes (331 commuters, 31.0%) for females.
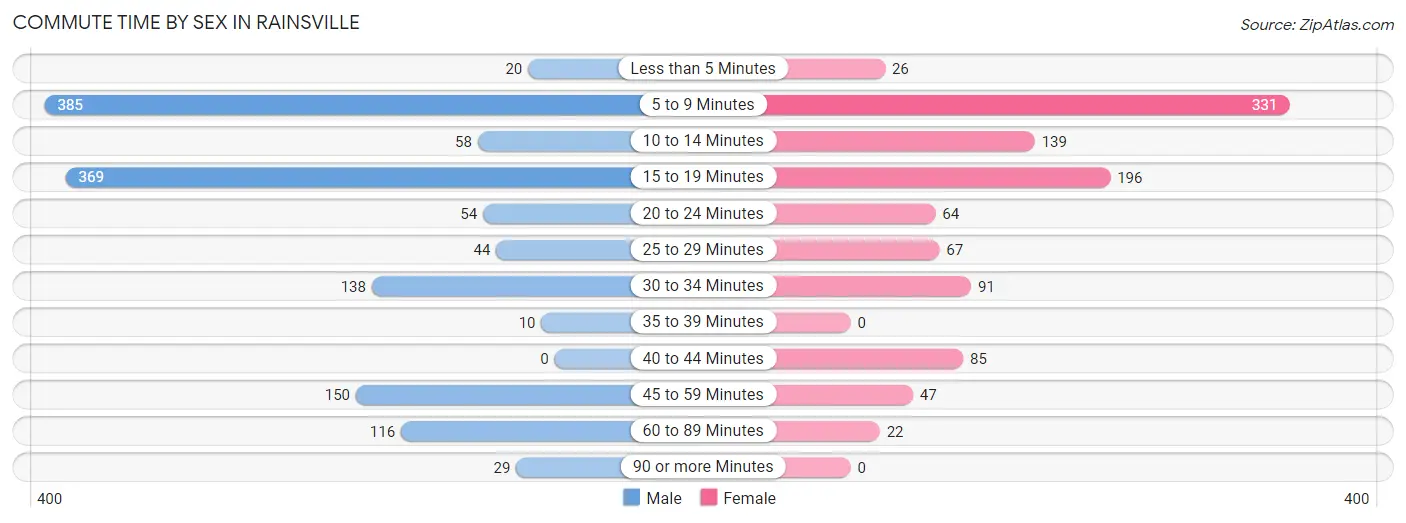
| Commute Time | Male | Female |
| Less than 5 Minutes | 20 (1.5%) | 26 (2.4%) |
| 5 to 9 Minutes | 385 (28.0%) | 331 (31.0%) |
| 10 to 14 Minutes | 58 (4.2%) | 139 (13.0%) |
| 15 to 19 Minutes | 369 (26.9%) | 196 (18.3%) |
| 20 to 24 Minutes | 54 (3.9%) | 64 (6.0%) |
| 25 to 29 Minutes | 44 (3.2%) | 67 (6.3%) |
| 30 to 34 Minutes | 138 (10.1%) | 91 (8.5%) |
| 35 to 39 Minutes | 10 (0.7%) | 0 (0.0%) |
| 40 to 44 Minutes | 0 (0.0%) | 85 (8.0%) |
| 45 to 59 Minutes | 150 (10.9%) | 47 (4.4%) |
| 60 to 89 Minutes | 116 (8.5%) | 22 (2.1%) |
| 90 or more Minutes | 29 (2.1%) | 0 (0.0%) |
Time of Departure to Work by Sex in Rainsville
The most frequent times of departure to work in Rainsville are 7:00 AM to 7:29 AM (371, 27.0%) for males and 7:00 AM to 7:29 AM (267, 25.0%) for females.
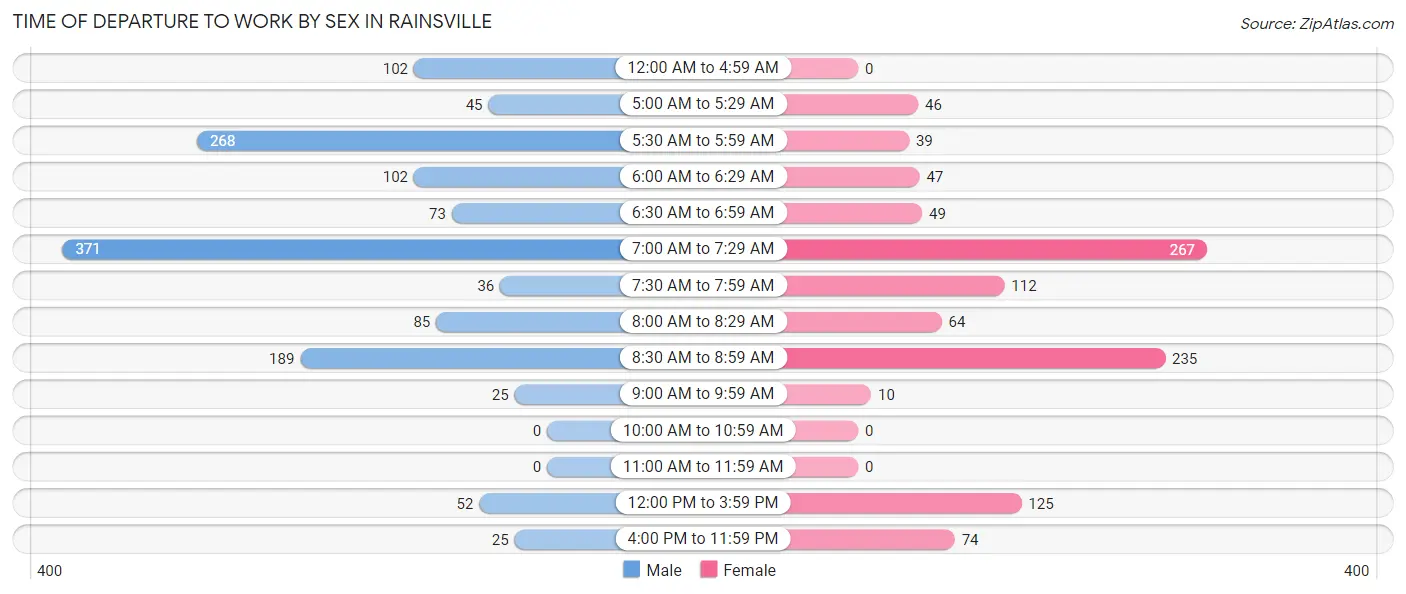
| Time of Departure | Male | Female |
| 12:00 AM to 4:59 AM | 102 (7.4%) | 0 (0.0%) |
| 5:00 AM to 5:29 AM | 45 (3.3%) | 46 (4.3%) |
| 5:30 AM to 5:59 AM | 268 (19.5%) | 39 (3.6%) |
| 6:00 AM to 6:29 AM | 102 (7.4%) | 47 (4.4%) |
| 6:30 AM to 6:59 AM | 73 (5.3%) | 49 (4.6%) |
| 7:00 AM to 7:29 AM | 371 (27.0%) | 267 (25.0%) |
| 7:30 AM to 7:59 AM | 36 (2.6%) | 112 (10.5%) |
| 8:00 AM to 8:29 AM | 85 (6.2%) | 64 (6.0%) |
| 8:30 AM to 8:59 AM | 189 (13.8%) | 235 (22.0%) |
| 9:00 AM to 9:59 AM | 25 (1.8%) | 10 (0.9%) |
| 10:00 AM to 10:59 AM | 0 (0.0%) | 0 (0.0%) |
| 11:00 AM to 11:59 AM | 0 (0.0%) | 0 (0.0%) |
| 12:00 PM to 3:59 PM | 52 (3.8%) | 125 (11.7%) |
| 4:00 PM to 11:59 PM | 25 (1.8%) | 74 (6.9%) |
| Total | 1,373 (100.0%) | 1,068 (100.0%) |
Housing Occupancy in Rainsville
Occupancy by Ownership in Rainsville
Of the total 2,182 dwellings in Rainsville, owner-occupied units account for 1,778 (81.5%), while renter-occupied units make up 404 (18.5%).
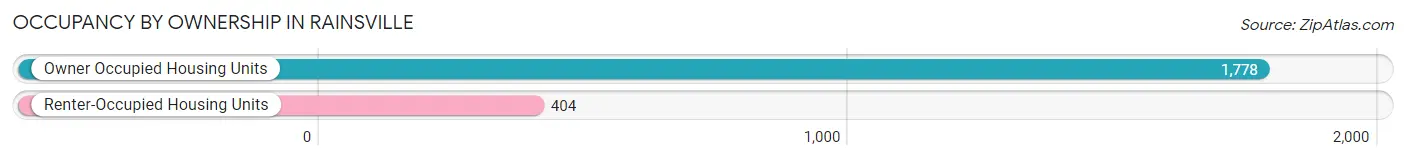
| Occupancy | # Housing Units | % Housing Units |
| Owner Occupied Housing Units | 1,778 | 81.5% |
| Renter-Occupied Housing Units | 404 | 18.5% |
| Total Occupied Housing Units | 2,182 | 100.0% |
Occupancy by Household Size in Rainsville
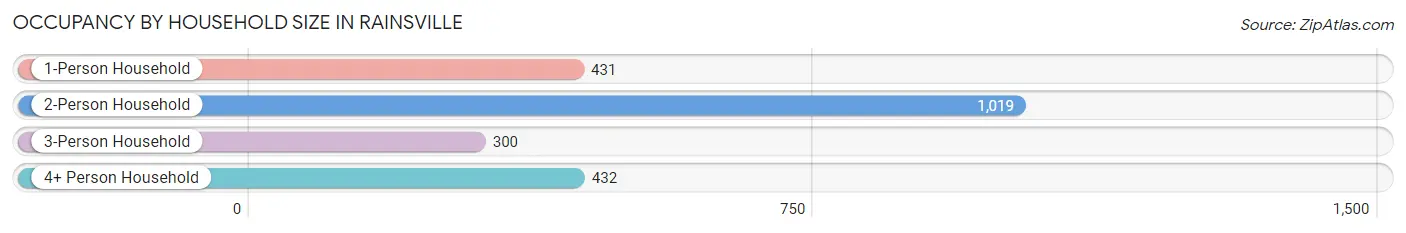
| Household Size | # Housing Units | % Housing Units |
| 1-Person Household | 431 | 19.8% |
| 2-Person Household | 1,019 | 46.7% |
| 3-Person Household | 300 | 13.8% |
| 4+ Person Household | 432 | 19.8% |
| Total Housing Units | 2,182 | 100.0% |
Occupancy by Ownership by Household Size in Rainsville
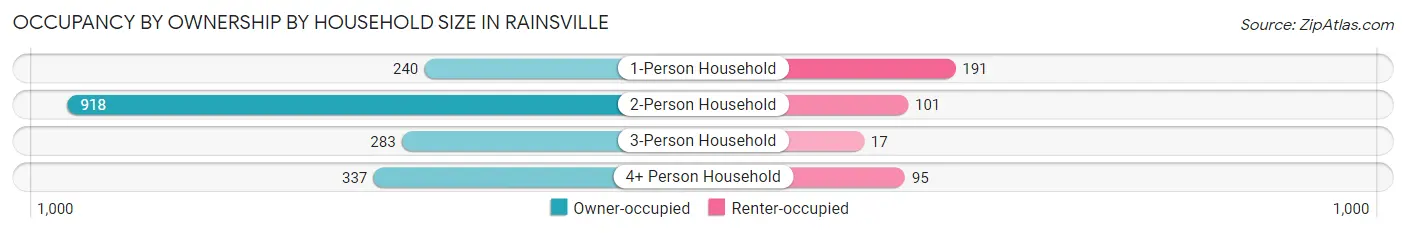
| Household Size | Owner-occupied | Renter-occupied |
| 1-Person Household | 240 (55.7%) | 191 (44.3%) |
| 2-Person Household | 918 (90.1%) | 101 (9.9%) |
| 3-Person Household | 283 (94.3%) | 17 (5.7%) |
| 4+ Person Household | 337 (78.0%) | 95 (22.0%) |
| Total Housing Units | 1,778 (81.5%) | 404 (18.5%) |
Occupancy by Educational Attainment in Rainsville
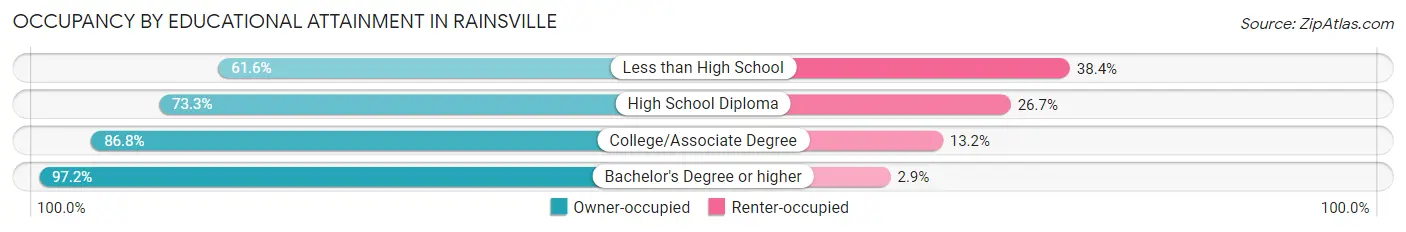
| Household Size | Owner-occupied | Renter-occupied |
| Less than High School | 303 (61.6%) | 189 (38.4%) |
| High School Diploma | 272 (73.3%) | 99 (26.7%) |
| College/Associate Degree | 657 (86.8%) | 100 (13.2%) |
| Bachelor's Degree or higher | 546 (97.2%) | 16 (2.9%) |
Occupancy by Age of Householder in Rainsville
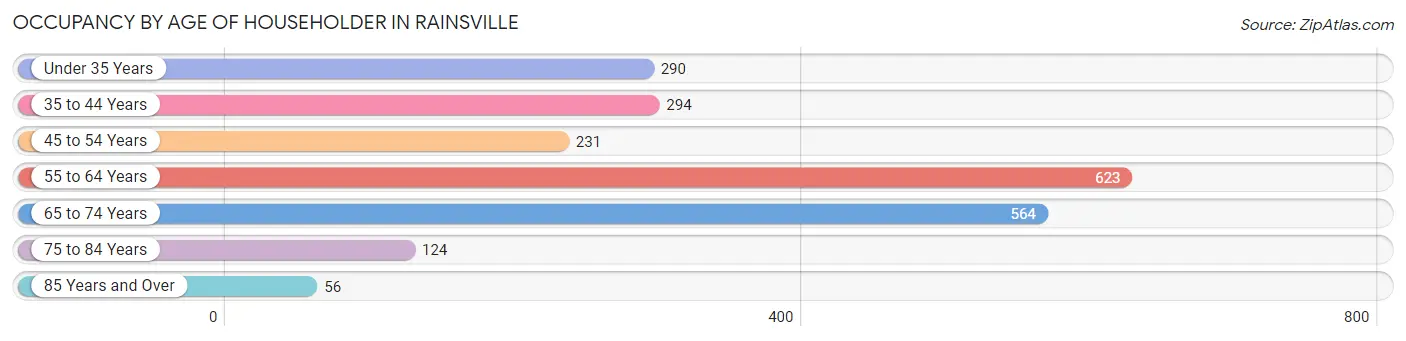
| Age Bracket | # Households | % Households |
| Under 35 Years | 290 | 13.3% |
| 35 to 44 Years | 294 | 13.5% |
| 45 to 54 Years | 231 | 10.6% |
| 55 to 64 Years | 623 | 28.5% |
| 65 to 74 Years | 564 | 25.9% |
| 75 to 84 Years | 124 | 5.7% |
| 85 Years and Over | 56 | 2.6% |
| Total | 2,182 | 100.0% |
Housing Finances in Rainsville
Median Income by Occupancy in Rainsville
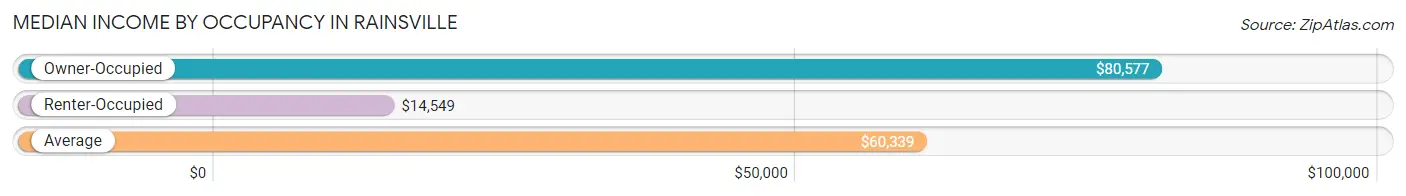
| Occupancy Type | # Households | Median Income |
| Owner-Occupied | 1,778 (81.5%) | $80,577 |
| Renter-Occupied | 404 (18.5%) | $14,549 |
| Average | 2,182 (100.0%) | $60,339 |
Occupancy by Householder Income Bracket in Rainsville
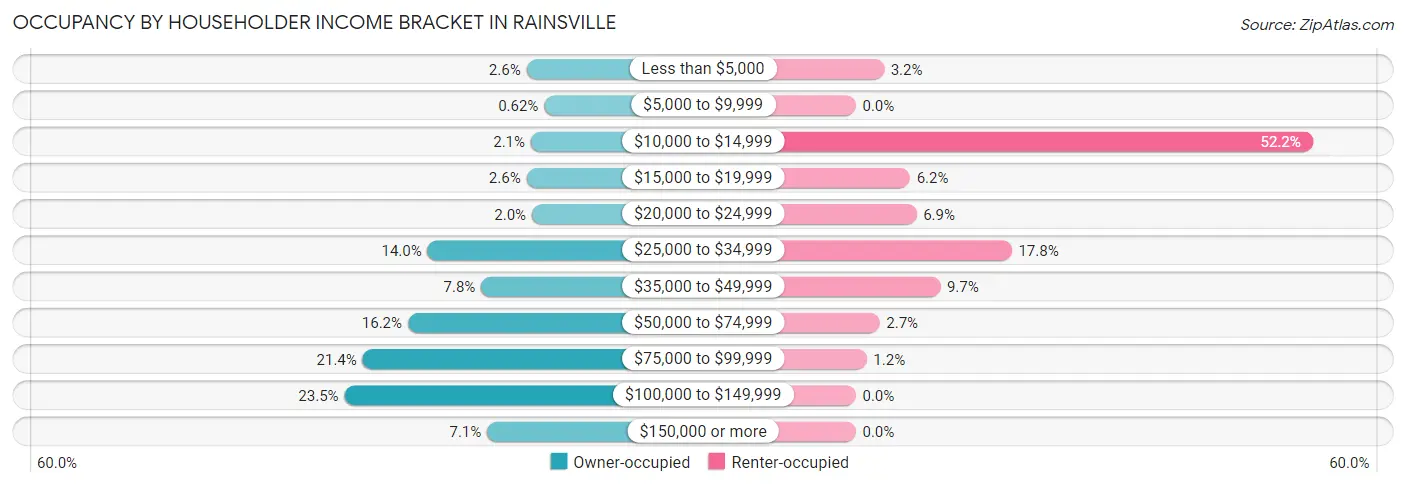
| Income Bracket | Owner-occupied | Renter-occupied |
| Less than $5,000 | 47 (2.6%) | 13 (3.2%) |
| $5,000 to $9,999 | 11 (0.6%) | 0 (0.0%) |
| $10,000 to $14,999 | 38 (2.1%) | 211 (52.2%) |
| $15,000 to $19,999 | 47 (2.6%) | 25 (6.2%) |
| $20,000 to $24,999 | 36 (2.0%) | 28 (6.9%) |
| $25,000 to $34,999 | 248 (14.0%) | 72 (17.8%) |
| $35,000 to $49,999 | 139 (7.8%) | 39 (9.7%) |
| $50,000 to $74,999 | 288 (16.2%) | 11 (2.7%) |
| $75,000 to $99,999 | 380 (21.4%) | 5 (1.2%) |
| $100,000 to $149,999 | 417 (23.4%) | 0 (0.0%) |
| $150,000 or more | 127 (7.1%) | 0 (0.0%) |
| Total | 1,778 (100.0%) | 404 (100.0%) |
Monthly Housing Cost Tiers in Rainsville
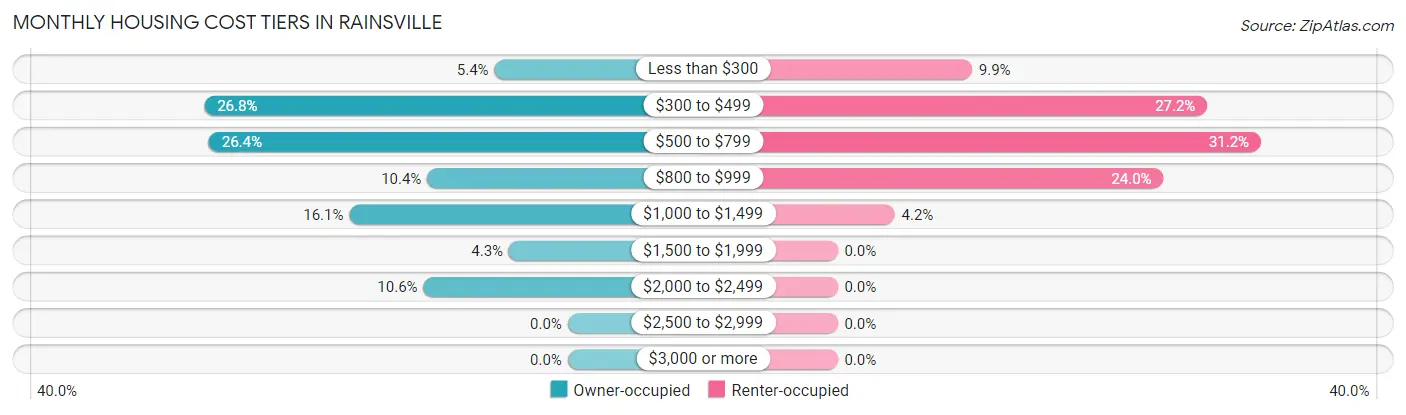
| Monthly Cost | Owner-occupied | Renter-occupied |
| Less than $300 | 96 (5.4%) | 40 (9.9%) |
| $300 to $499 | 476 (26.8%) | 110 (27.2%) |
| $500 to $799 | 470 (26.4%) | 126 (31.2%) |
| $800 to $999 | 184 (10.3%) | 97 (24.0%) |
| $1,000 to $1,499 | 286 (16.1%) | 17 (4.2%) |
| $1,500 to $1,999 | 77 (4.3%) | 0 (0.0%) |
| $2,000 to $2,499 | 189 (10.6%) | 0 (0.0%) |
| $2,500 to $2,999 | 0 (0.0%) | 0 (0.0%) |
| $3,000 or more | 0 (0.0%) | 0 (0.0%) |
| Total | 1,778 (100.0%) | 404 (100.0%) |
Physical Housing Characteristics in Rainsville
Housing Structures in Rainsville
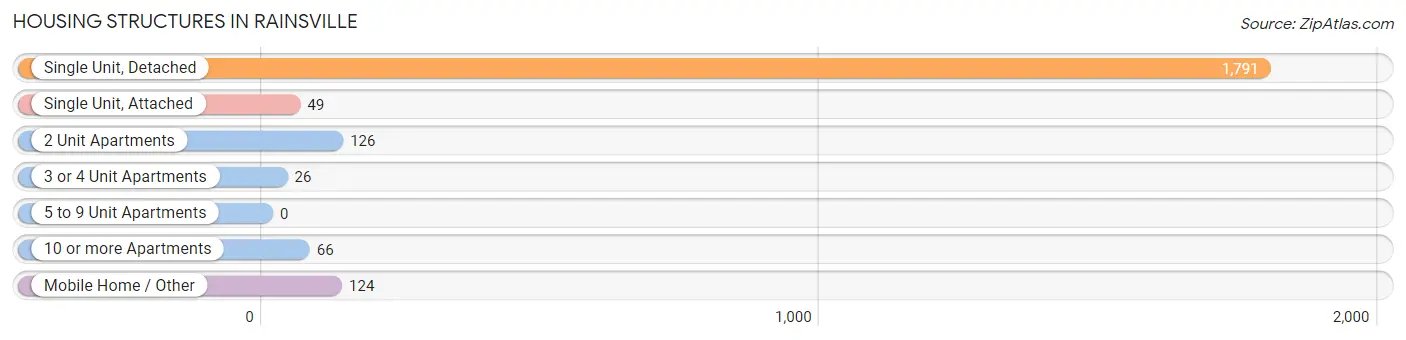
| Structure Type | # Housing Units | % Housing Units |
| Single Unit, Detached | 1,791 | 82.1% |
| Single Unit, Attached | 49 | 2.2% |
| 2 Unit Apartments | 126 | 5.8% |
| 3 or 4 Unit Apartments | 26 | 1.2% |
| 5 to 9 Unit Apartments | 0 | 0.0% |
| 10 or more Apartments | 66 | 3.0% |
| Mobile Home / Other | 124 | 5.7% |
| Total | 2,182 | 100.0% |
Housing Structures by Occupancy in Rainsville
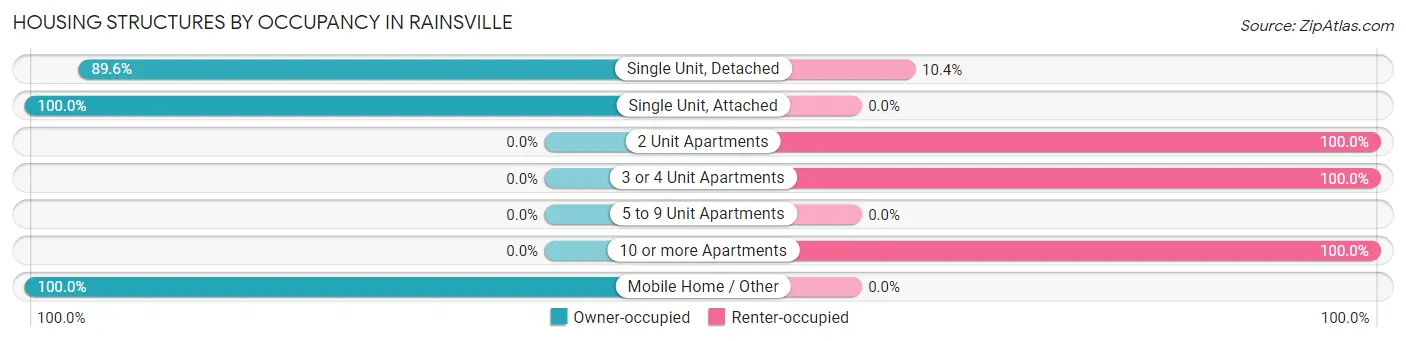
| Structure Type | Owner-occupied | Renter-occupied |
| Single Unit, Detached | 1,605 (89.6%) | 186 (10.4%) |
| Single Unit, Attached | 49 (100.0%) | 0 (0.0%) |
| 2 Unit Apartments | 0 (0.0%) | 126 (100.0%) |
| 3 or 4 Unit Apartments | 0 (0.0%) | 26 (100.0%) |
| 5 to 9 Unit Apartments | 0 (0.0%) | 0 (0.0%) |
| 10 or more Apartments | 0 (0.0%) | 66 (100.0%) |
| Mobile Home / Other | 124 (100.0%) | 0 (0.0%) |
| Total | 1,778 (81.5%) | 404 (18.5%) |
Housing Structures by Number of Rooms in Rainsville
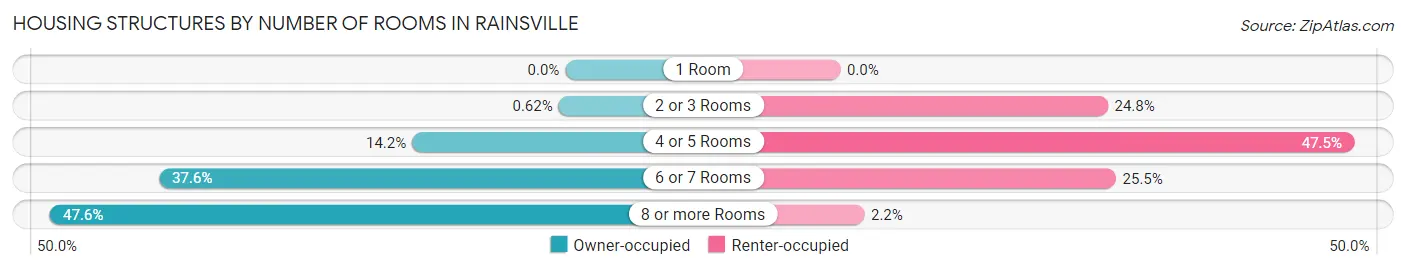
| Number of Rooms | Owner-occupied | Renter-occupied |
| 1 Room | 0 (0.0%) | 0 (0.0%) |
| 2 or 3 Rooms | 11 (0.6%) | 100 (24.7%) |
| 4 or 5 Rooms | 252 (14.2%) | 192 (47.5%) |
| 6 or 7 Rooms | 668 (37.6%) | 103 (25.5%) |
| 8 or more Rooms | 847 (47.6%) | 9 (2.2%) |
| Total | 1,778 (100.0%) | 404 (100.0%) |
Housing Structure by Heating Type in Rainsville
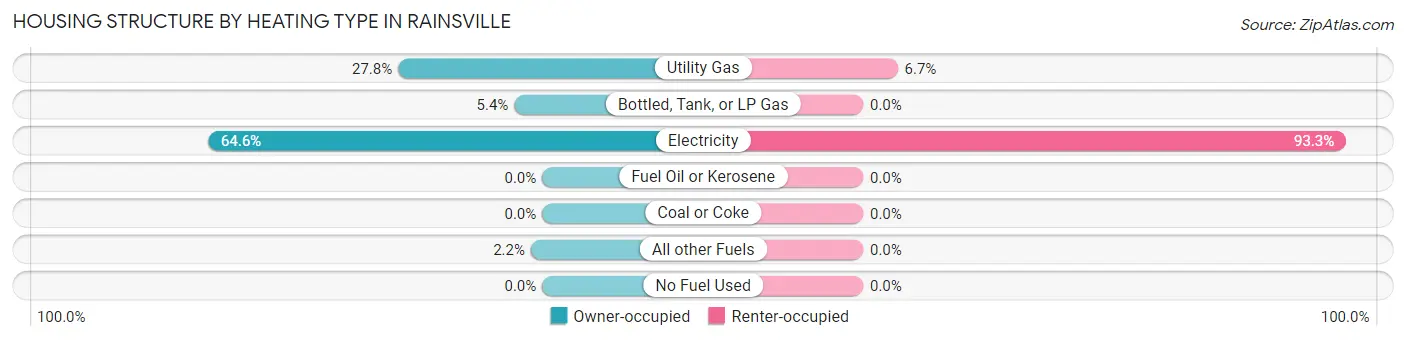
| Heating Type | Owner-occupied | Renter-occupied |
| Utility Gas | 495 (27.8%) | 27 (6.7%) |
| Bottled, Tank, or LP Gas | 96 (5.4%) | 0 (0.0%) |
| Electricity | 1,148 (64.6%) | 377 (93.3%) |
| Fuel Oil or Kerosene | 0 (0.0%) | 0 (0.0%) |
| Coal or Coke | 0 (0.0%) | 0 (0.0%) |
| All other Fuels | 39 (2.2%) | 0 (0.0%) |
| No Fuel Used | 0 (0.0%) | 0 (0.0%) |
| Total | 1,778 (100.0%) | 404 (100.0%) |
Household Vehicle Usage in Rainsville
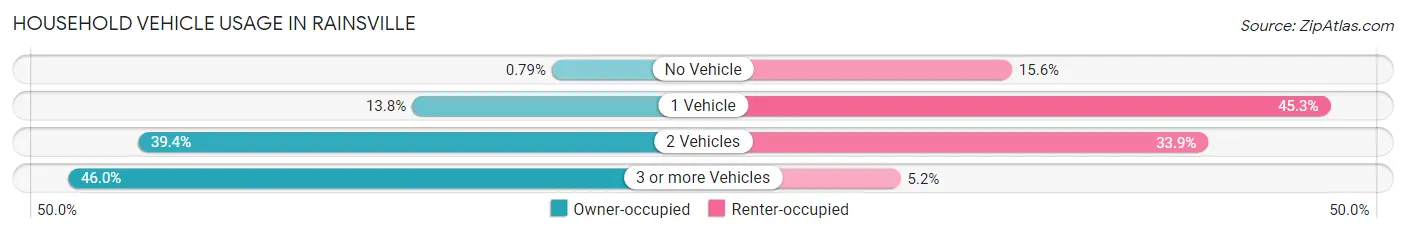
| Vehicles per Household | Owner-occupied | Renter-occupied |
| No Vehicle | 14 (0.8%) | 63 (15.6%) |
| 1 Vehicle | 246 (13.8%) | 183 (45.3%) |
| 2 Vehicles | 701 (39.4%) | 137 (33.9%) |
| 3 or more Vehicles | 817 (46.0%) | 21 (5.2%) |
| Total | 1,778 (100.0%) | 404 (100.0%) |
Real Estate & Mortgages in Rainsville
Real Estate and Mortgage Overview in Rainsville
| Characteristic | Without Mortgage | With Mortgage |
| Housing Units | 913 | 865 |
| Median Property Value | $191,700 | $171,900 |
| Median Household Income | $67,557 | $54 |
| Monthly Housing Costs | $393 | $0 |
| Real Estate Taxes | $547 | $88 |
Property Value by Mortgage Status in Rainsville
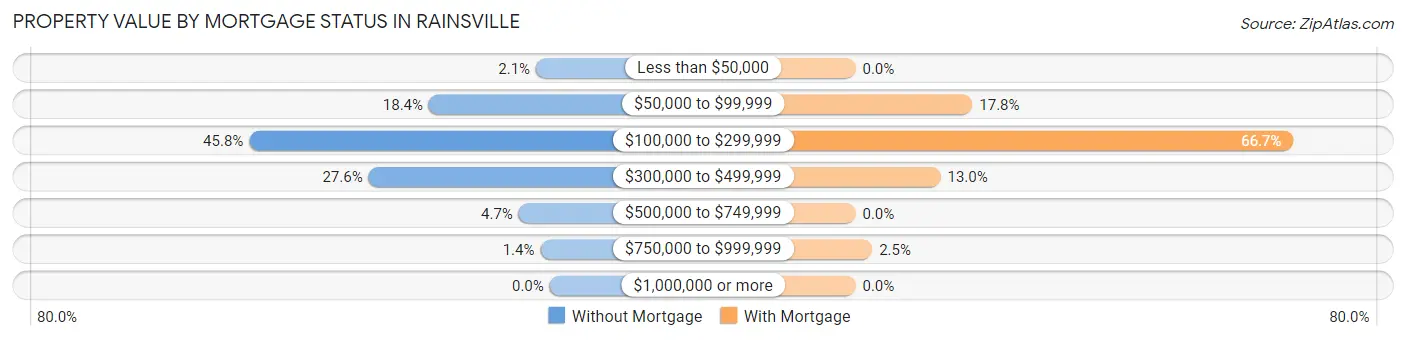
| Property Value | Without Mortgage | With Mortgage |
| Less than $50,000 | 19 (2.1%) | 0 (0.0%) |
| $50,000 to $99,999 | 168 (18.4%) | 154 (17.8%) |
| $100,000 to $299,999 | 418 (45.8%) | 577 (66.7%) |
| $300,000 to $499,999 | 252 (27.6%) | 112 (13.0%) |
| $500,000 to $749,999 | 43 (4.7%) | 0 (0.0%) |
| $750,000 to $999,999 | 13 (1.4%) | 22 (2.5%) |
| $1,000,000 or more | 0 (0.0%) | 0 (0.0%) |
| Total | 913 (100.0%) | 865 (100.0%) |
Household Income by Mortgage Status in Rainsville
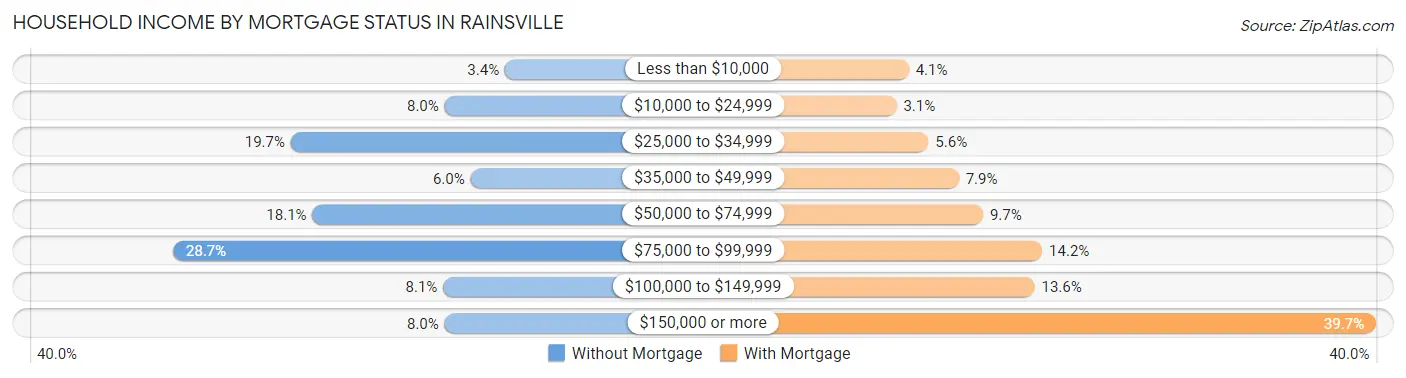
| Household Income | Without Mortgage | With Mortgage |
| Less than $10,000 | 31 (3.4%) | 35 (4.1%) |
| $10,000 to $24,999 | 73 (8.0%) | 27 (3.1%) |
| $25,000 to $34,999 | 180 (19.7%) | 48 (5.6%) |
| $35,000 to $49,999 | 55 (6.0%) | 68 (7.9%) |
| $50,000 to $74,999 | 165 (18.1%) | 84 (9.7%) |
| $75,000 to $99,999 | 262 (28.7%) | 123 (14.2%) |
| $100,000 to $149,999 | 74 (8.1%) | 118 (13.6%) |
| $150,000 or more | 73 (8.0%) | 343 (39.7%) |
| Total | 913 (100.0%) | 865 (100.0%) |
Property Value to Household Income Ratio in Rainsville
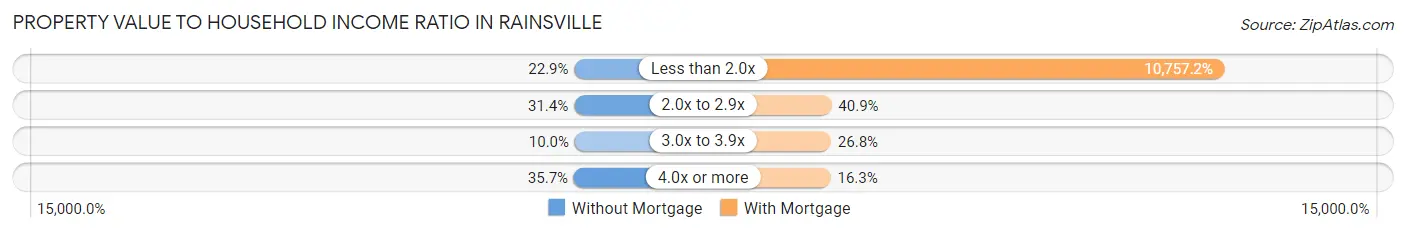
| Value-to-Income Ratio | Without Mortgage | With Mortgage |
| Less than 2.0x | 209 (22.9%) | 93,050 (10,757.2%) |
| 2.0x to 2.9x | 287 (31.4%) | 354 (40.9%) |
| 3.0x to 3.9x | 91 (10.0%) | 232 (26.8%) |
| 4.0x or more | 326 (35.7%) | 141 (16.3%) |
| Total | 913 (100.0%) | 865 (100.0%) |
Real Estate Taxes by Mortgage Status in Rainsville
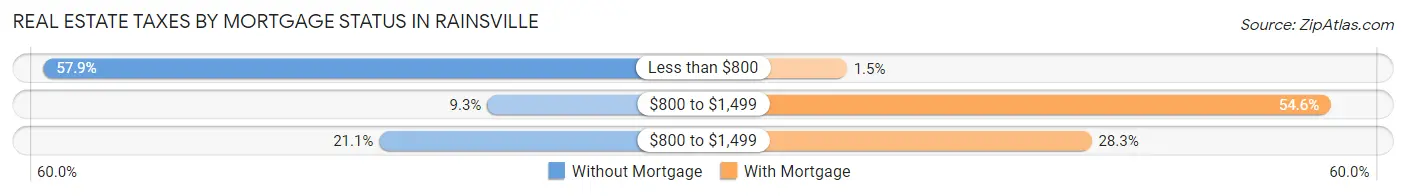
| Property Taxes | Without Mortgage | With Mortgage |
| Less than $800 | 529 (57.9%) | 13 (1.5%) |
| $800 to $1,499 | 85 (9.3%) | 472 (54.6%) |
| $800 to $1,499 | 193 (21.1%) | 245 (28.3%) |
| Total | 913 (100.0%) | 865 (100.0%) |
Health & Disability in Rainsville
Health Insurance Coverage by Age in Rainsville
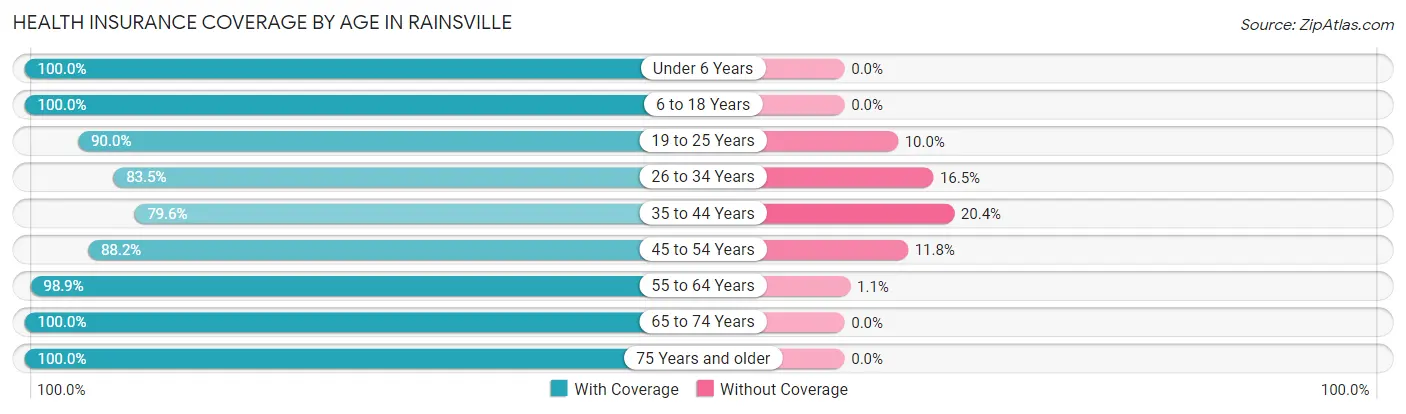
| Age Bracket | With Coverage | Without Coverage |
| Under 6 Years | 519 (100.0%) | 0 (0.0%) |
| 6 to 18 Years | 769 (100.0%) | 0 (0.0%) |
| 19 to 25 Years | 434 (90.0%) | 48 (10.0%) |
| 26 to 34 Years | 500 (83.5%) | 99 (16.5%) |
| 35 to 44 Years | 327 (79.6%) | 84 (20.4%) |
| 45 to 54 Years | 485 (88.2%) | 65 (11.8%) |
| 55 to 64 Years | 1,003 (98.9%) | 11 (1.1%) |
| 65 to 74 Years | 921 (100.0%) | 0 (0.0%) |
| 75 Years and older | 280 (100.0%) | 0 (0.0%) |
| Total | 5,238 (94.5%) | 307 (5.5%) |
Health Insurance Coverage by Citizenship Status in Rainsville
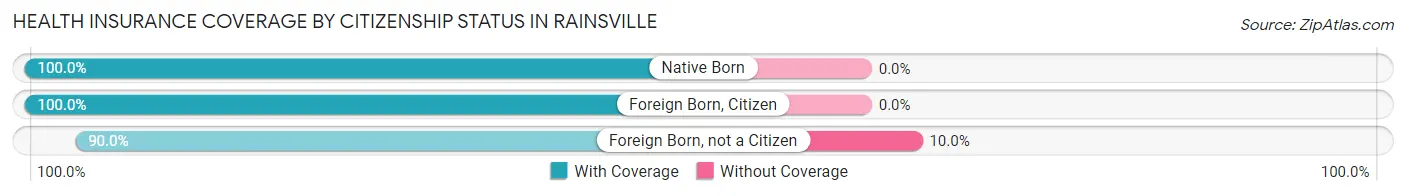
| Citizenship Status | With Coverage | Without Coverage |
| Native Born | 519 (100.0%) | 0 (0.0%) |
| Foreign Born, Citizen | 769 (100.0%) | 0 (0.0%) |
| Foreign Born, not a Citizen | 434 (90.0%) | 48 (10.0%) |
Health Insurance Coverage by Household Income in Rainsville
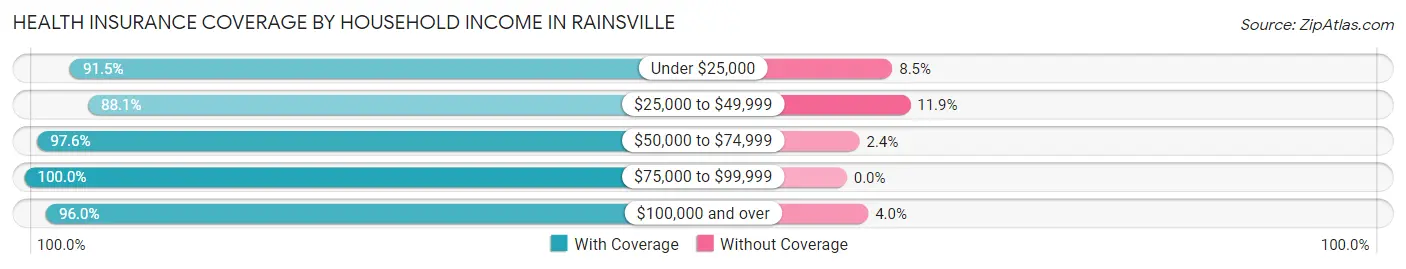
| Household Income | With Coverage | Without Coverage |
| Under $25,000 | 902 (91.5%) | 84 (8.5%) |
| $25,000 to $49,999 | 985 (88.1%) | 133 (11.9%) |
| $50,000 to $74,999 | 613 (97.6%) | 15 (2.4%) |
| $75,000 to $99,999 | 948 (100.0%) | 0 (0.0%) |
| $100,000 and over | 1,790 (96.0%) | 75 (4.0%) |
Public vs Private Health Insurance Coverage by Age in Rainsville
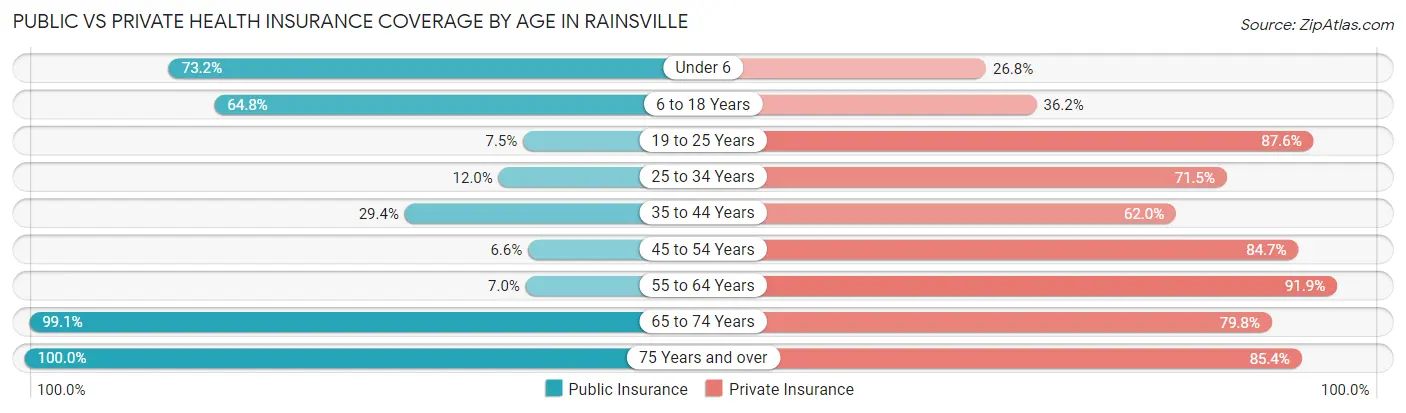
| Age Bracket | Public Insurance | Private Insurance |
| Under 6 | 380 (73.2%) | 139 (26.8%) |
| 6 to 18 Years | 498 (64.8%) | 278 (36.1%) |
| 19 to 25 Years | 36 (7.5%) | 422 (87.5%) |
| 25 to 34 Years | 72 (12.0%) | 428 (71.5%) |
| 35 to 44 Years | 121 (29.4%) | 255 (62.0%) |
| 45 to 54 Years | 36 (6.6%) | 466 (84.7%) |
| 55 to 64 Years | 71 (7.0%) | 932 (91.9%) |
| 65 to 74 Years | 913 (99.1%) | 735 (79.8%) |
| 75 Years and over | 280 (100.0%) | 239 (85.4%) |
| Total | 2,407 (43.4%) | 3,894 (70.2%) |
Disability Status by Sex by Age in Rainsville
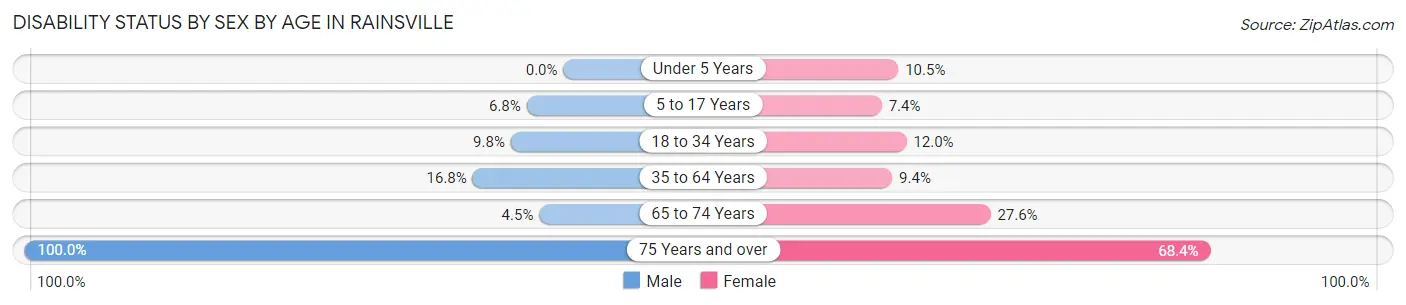
| Age Bracket | Male | Female |
| Under 5 Years | 0 (0.0%) | 22 (10.5%) |
| 5 to 17 Years | 38 (6.8%) | 20 (7.4%) |
| 18 to 34 Years | 72 (9.8%) | 48 (12.0%) |
| 35 to 64 Years | 147 (16.8%) | 103 (9.3%) |
| 65 to 74 Years | 23 (4.5%) | 112 (27.6%) |
| 75 Years and over | 147 (100.0%) | 91 (68.4%) |
Disability Class by Sex by Age in Rainsville
Disability Class: Hearing Difficulty
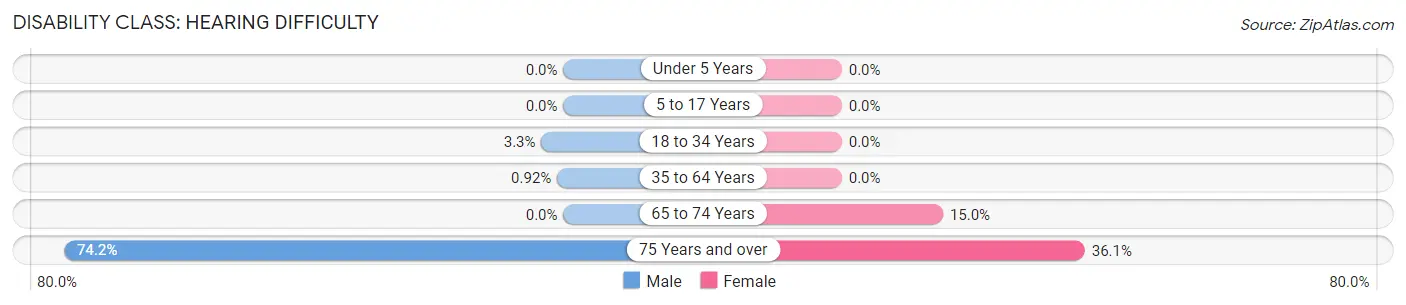
| Age Bracket | Male | Female |
| Under 5 Years | 0 (0.0%) | 0 (0.0%) |
| 5 to 17 Years | 0 (0.0%) | 0 (0.0%) |
| 18 to 34 Years | 24 (3.3%) | 0 (0.0%) |
| 35 to 64 Years | 8 (0.9%) | 0 (0.0%) |
| 65 to 74 Years | 0 (0.0%) | 61 (15.0%) |
| 75 Years and over | 109 (74.2%) | 48 (36.1%) |
Disability Class: Vision Difficulty
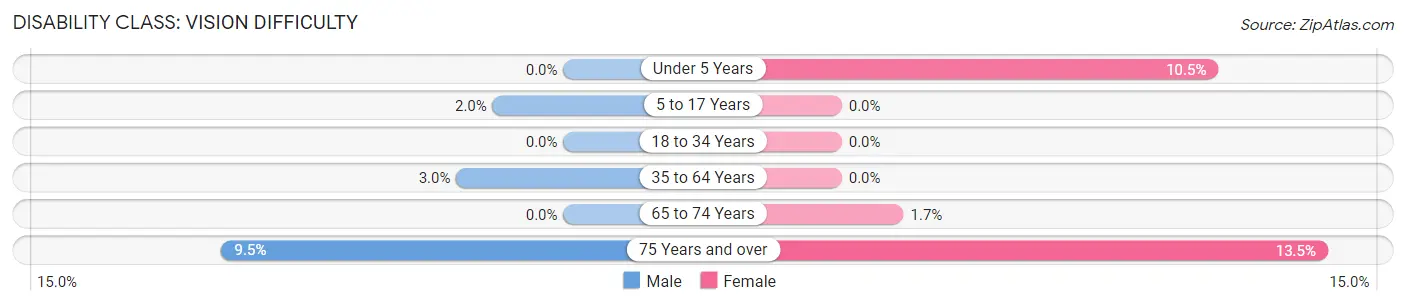
| Age Bracket | Male | Female |
| Under 5 Years | 0 (0.0%) | 22 (10.5%) |
| 5 to 17 Years | 11 (2.0%) | 0 (0.0%) |
| 18 to 34 Years | 0 (0.0%) | 0 (0.0%) |
| 35 to 64 Years | 26 (3.0%) | 0 (0.0%) |
| 65 to 74 Years | 0 (0.0%) | 7 (1.7%) |
| 75 Years and over | 14 (9.5%) | 18 (13.5%) |
Disability Class: Cognitive Difficulty
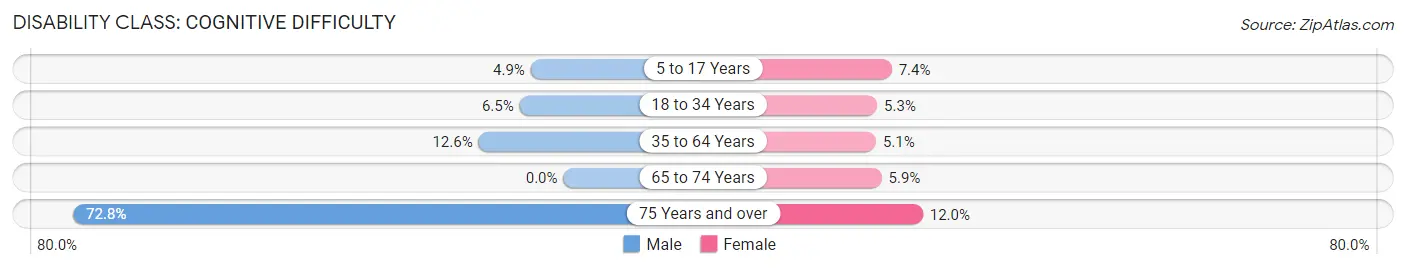
| Age Bracket | Male | Female |
| 5 to 17 Years | 27 (4.9%) | 20 (7.4%) |
| 18 to 34 Years | 48 (6.5%) | 21 (5.2%) |
| 35 to 64 Years | 110 (12.6%) | 56 (5.1%) |
| 65 to 74 Years | 0 (0.0%) | 24 (5.9%) |
| 75 Years and over | 107 (72.8%) | 16 (12.0%) |
Disability Class: Ambulatory Difficulty
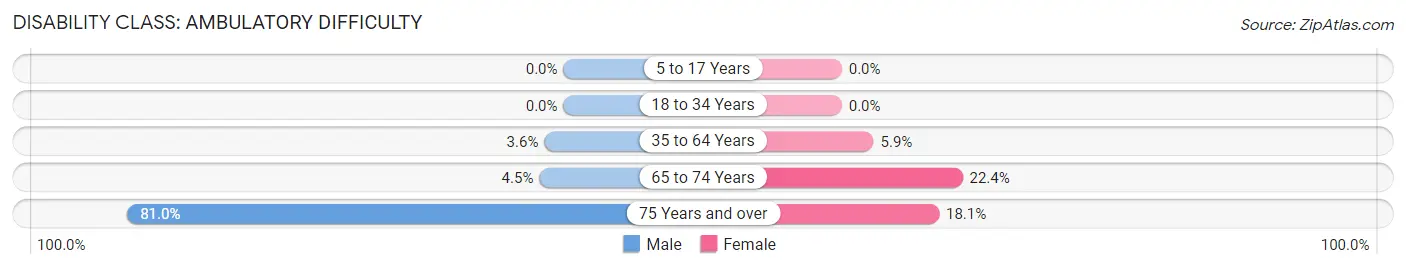
| Age Bracket | Male | Female |
| 5 to 17 Years | 0 (0.0%) | 0 (0.0%) |
| 18 to 34 Years | 0 (0.0%) | 0 (0.0%) |
| 35 to 64 Years | 31 (3.5%) | 65 (5.9%) |
| 65 to 74 Years | 23 (4.5%) | 91 (22.4%) |
| 75 Years and over | 119 (80.9%) | 24 (18.0%) |
Disability Class: Self-Care Difficulty
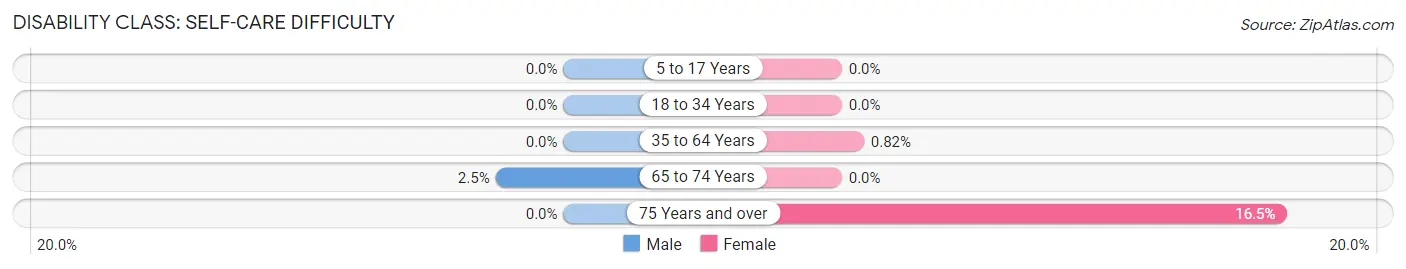
| Age Bracket | Male | Female |
| 5 to 17 Years | 0 (0.0%) | 0 (0.0%) |
| 18 to 34 Years | 0 (0.0%) | 0 (0.0%) |
| 35 to 64 Years | 0 (0.0%) | 9 (0.8%) |
| 65 to 74 Years | 13 (2.5%) | 0 (0.0%) |
| 75 Years and over | 0 (0.0%) | 22 (16.5%) |
Technology Access in Rainsville
Computing Device Access in Rainsville
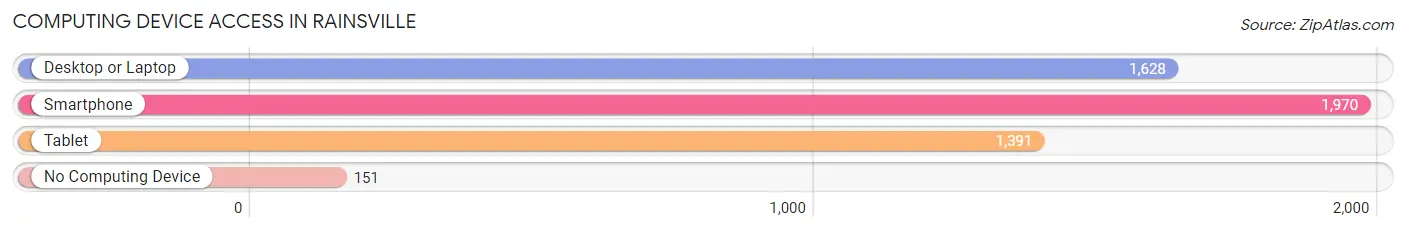
| Device Type | # Households | % Households |
| Desktop or Laptop | 1,628 | 74.6% |
| Smartphone | 1,970 | 90.3% |
| Tablet | 1,391 | 63.7% |
| No Computing Device | 151 | 6.9% |
| Total | 2,182 | 100.0% |
Internet Access in Rainsville
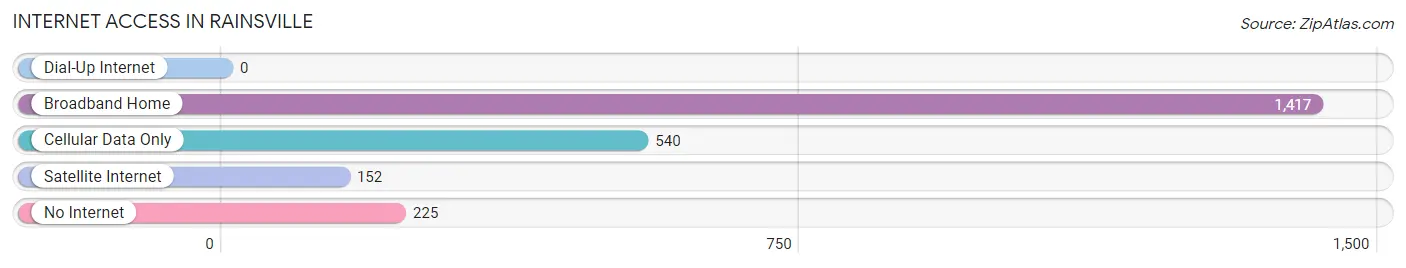
| Internet Type | # Households | % Households |
| Dial-Up Internet | 0 | 0.0% |
| Broadband Home | 1,417 | 64.9% |
| Cellular Data Only | 540 | 24.7% |
| Satellite Internet | 152 | 7.0% |
| No Internet | 225 | 10.3% |
| Total | 2,182 | 100.0% |
Rainsville Summary
Rainsville is a city located in DeKalb County, Alabama, United States. It is situated in the foothills of the Appalachian Mountains and is part of the greater Chattanooga metropolitan area. The city was incorporated in 1891 and has a population of 5,812 as of the 2010 census.
History
Rainsville was founded in 1891 by William Rains, a local farmer and businessman. The city was named after him and was incorporated in 1891. The city was originally a small farming community, but it began to grow in the early 20th century when the railroad came through the area. The railroad brought new industry and jobs to the area, and the population began to grow.
In the 1950s, the city began to experience a period of rapid growth. This was due to the development of the nearby Lookout Mountain Parkway, which provided easy access to Chattanooga and other nearby cities. The city also benefited from the growth of the nearby Fort Payne area, which was experiencing a boom in the textile industry.
Geography
Rainsville is located in the foothills of the Appalachian Mountains in northeastern Alabama. It is situated in the valley of the Little River, which flows through the city. The city is located about 25 miles northeast of Chattanooga, Tennessee, and about 75 miles southwest of Knoxville, Tennessee.
The city has a total area of 8.2 square miles, all of which is land. The city is located at an elevation of 1,068 feet above sea level.
Economy
Rainsville's economy is largely based on manufacturing and agriculture. The city is home to several manufacturing plants, including a plant that produces automotive parts and a plant that produces plastic products. The city is also home to several agricultural businesses, including a poultry processing plant and a feed mill.
The city is also home to several retail businesses, including a Walmart Supercenter, a Lowe's Home Improvement store, and several restaurants.
Demographics
As of the 2010 census, the population of Rainsville was 5,812. The racial makeup of the city was 92.3% White, 4.3% African American, 0.4% Native American, 0.7% Asian, 0.1% Pacific Islander, 0.7% from other races, and 1.5% from two or more races. Hispanic or Latino of any race were 2.2% of the population.
The median household income in Rainsville was $35,945, and the median family income was $41,944. The per capita income for the city was $17,845. About 17.2% of families and 20.2% of the population were below the poverty line, including 28.2% of those under age 18 and 11.2% of those age 65 or over.
Common Questions
What is Per Capita Income in Rainsville?
Per Capita income in Rainsville is $27,308.
What is the Median Family Income in Rainsville?
Median Family Income in Rainsville is $80,353.
What is the Median Household income in Rainsville?
Median Household Income in Rainsville is $60,339.
What is Income or Wage Gap in Rainsville?
Income or Wage Gap in Rainsville is 41.2%.
Women in Rainsville earn 58.8 cents for every dollar earned by a man.
What is Inequality or Gini Index in Rainsville?
Inequality or Gini Index in Rainsville is 0.39.
What is the Total Population of Rainsville?
Total Population of Rainsville is 5,545.
What is the Total Male Population of Rainsville?
Total Male Population of Rainsville is 3,024.
What is the Total Female Population of Rainsville?
Total Female Population of Rainsville is 2,521.
What is the Ratio of Males per 100 Females in Rainsville?
There are 119.95 Males per 100 Females in Rainsville.
What is the Ratio of Females per 100 Males in Rainsville?
There are 83.37 Females per 100 Males in Rainsville.
What is the Median Population Age in Rainsville?
Median Population Age in Rainsville is 44.9 Years.
What is the Average Family Size in Rainsville
Average Family Size in Rainsville is 2.9 People.
What is the Average Household Size in Rainsville
Average Household Size in Rainsville is 2.5 People.
How Large is the Labor Force in Rainsville?
There are 2,597 People in the Labor Forcein in Rainsville.
What is the Percentage of People in the Labor Force in Rainsville?
58.0% of People are in the Labor Force in Rainsville.
What is the Unemployment Rate in Rainsville?
Unemployment Rate in Rainsville is 1.2%.