Pine Apple, AL Map & Demographics
Pine Apple Map
Pine Apple Overview
$27,002
PER CAPITA INCOME
$41,071
AVG FAMILY INCOME
$41,369
AVG HOUSEHOLD INCOME
0.39
INEQUALITY / GINI INDEX
162
TOTAL POPULATION
83
MALE POPULATION
79
FEMALE POPULATION
105.06
MALES / 100 FEMALES
95.18
FEMALES / 100 MALES
63.0
MEDIAN AGE
1.9
AVG FAMILY SIZE
1.9
AVG HOUSEHOLD SIZE
48
LABOR FORCE [ PEOPLE ]
30.8%
PERCENT IN LABOR FORCE
Pine Apple Zip Codes
Pine Apple Area Codes
Income in Pine Apple
Income Overview in Pine Apple
Per Capita Income in Pine Apple is $27,002, while median incomes of families and households are $41,071 and $41,369 respectively.
| Characteristic | Number | Measure |
| Per Capita Income | 162 | $27,002 |
| Median Family Income | 70 | $41,071 |
| Mean Family Income | 70 | $51,813 |
| Median Household Income | 83 | $41,369 |
| Mean Household Income | 83 | $50,260 |
| Income Deficit | 70 | $0 |
| Wage / Income Gap (%) | 162 | 0.00% |
| Wage / Income Gap ($) | 162 | 100.00¢ per $1 |
| Gini / Inequality Index | 162 | 0.39 |
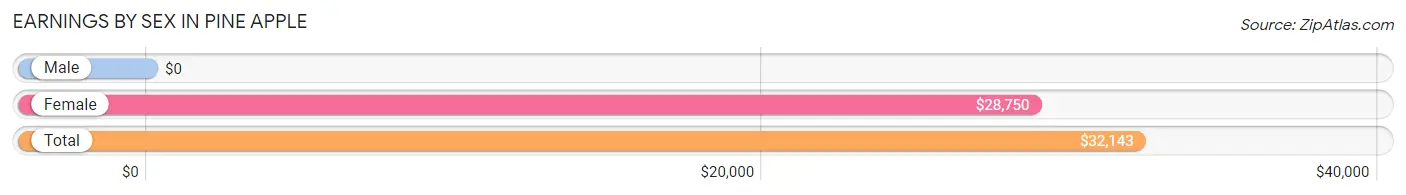
Earnings by Sex in Pine Apple
| Sex | Number | Average Earnings |
| Male | 28 (58.3%) | $0 |
| Female | 20 (41.7%) | $28,750 |
| Total | 48 (100.0%) | $32,143 |
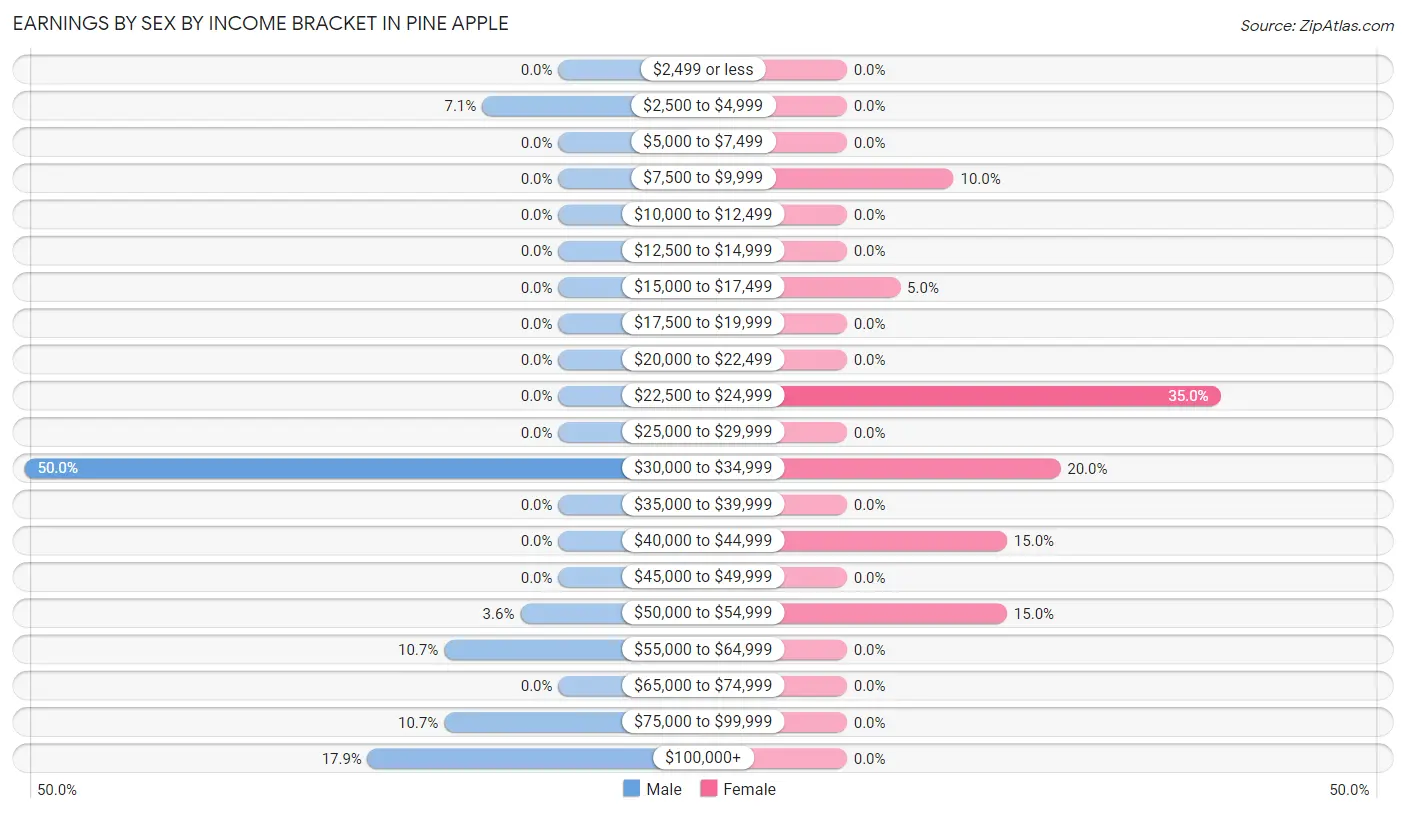
Earnings by Sex by Income Bracket in Pine Apple
The most common earnings brackets in Pine Apple are $30,000 to $34,999 for men (14 | 50.0%) and $22,500 to $24,999 for women (7 | 35.0%).
| Income | Male | Female |
| $2,499 or less | 0 (0.0%) | 0 (0.0%) |
| $2,500 to $4,999 | 2 (7.1%) | 0 (0.0%) |
| $5,000 to $7,499 | 0 (0.0%) | 0 (0.0%) |
| $7,500 to $9,999 | 0 (0.0%) | 2 (10.0%) |
| $10,000 to $12,499 | 0 (0.0%) | 0 (0.0%) |
| $12,500 to $14,999 | 0 (0.0%) | 0 (0.0%) |
| $15,000 to $17,499 | 0 (0.0%) | 1 (5.0%) |
| $17,500 to $19,999 | 0 (0.0%) | 0 (0.0%) |
| $20,000 to $22,499 | 0 (0.0%) | 0 (0.0%) |
| $22,500 to $24,999 | 0 (0.0%) | 7 (35.0%) |
| $25,000 to $29,999 | 0 (0.0%) | 0 (0.0%) |
| $30,000 to $34,999 | 14 (50.0%) | 4 (20.0%) |
| $35,000 to $39,999 | 0 (0.0%) | 0 (0.0%) |
| $40,000 to $44,999 | 0 (0.0%) | 3 (15.0%) |
| $45,000 to $49,999 | 0 (0.0%) | 0 (0.0%) |
| $50,000 to $54,999 | 1 (3.6%) | 3 (15.0%) |
| $55,000 to $64,999 | 3 (10.7%) | 0 (0.0%) |
| $65,000 to $74,999 | 0 (0.0%) | 0 (0.0%) |
| $75,000 to $99,999 | 3 (10.7%) | 0 (0.0%) |
| $100,000+ | 5 (17.9%) | 0 (0.0%) |
| Total | 28 (100.0%) | 20 (100.0%) |
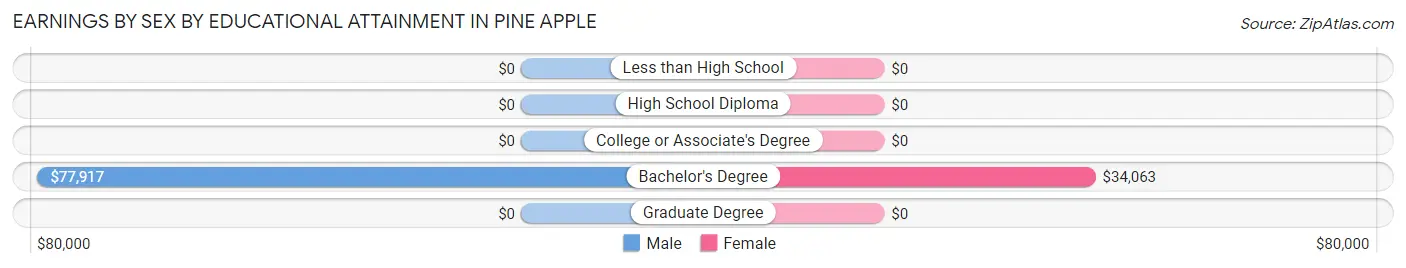
Earnings by Sex by Educational Attainment in Pine Apple
| Educational Attainment | Male Income | Female Income |
| Less than High School | - | - |
| High School Diploma | - | - |
| College or Associate's Degree | - | - |
| Bachelor's Degree | $77,917 | $34,063 |
| Graduate Degree | - | - |
| Total | - | - |
Family Income in Pine Apple
Family Income Brackets in Pine Apple
According to the Pine Apple family income data, there are 26 families falling into the $35,000 to $49,999 income range, which is the most common income bracket and makes up 37.1% of all families.
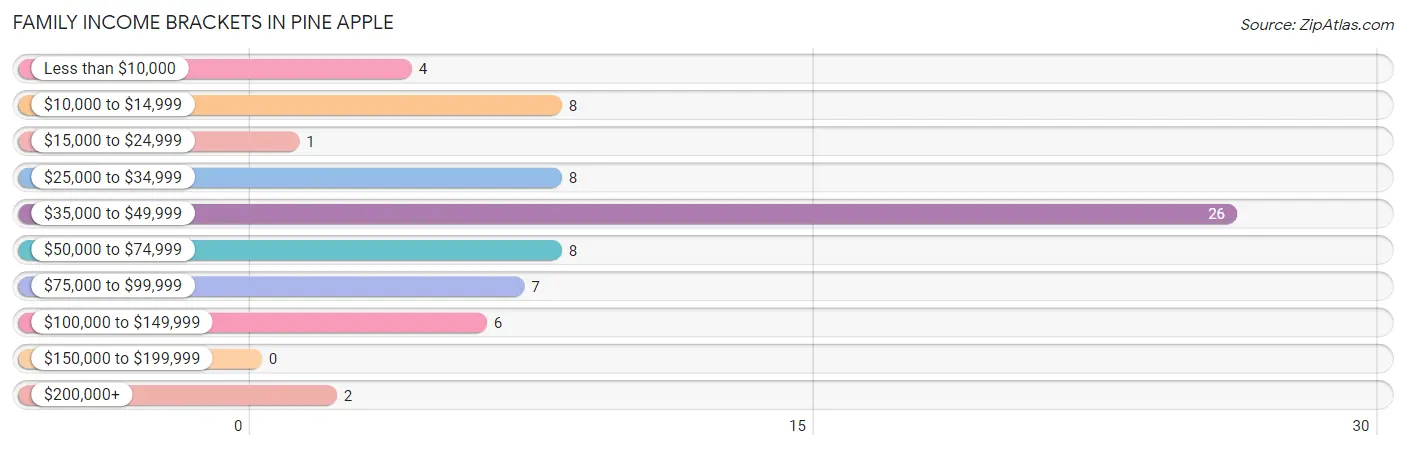
| Income Bracket | # Families | % Families |
| Less than $10,000 | 4 | 5.7% |
| $10,000 to $14,999 | 8 | 11.4% |
| $15,000 to $24,999 | 1 | 1.4% |
| $25,000 to $34,999 | 8 | 11.4% |
| $35,000 to $49,999 | 26 | 37.1% |
| $50,000 to $74,999 | 8 | 11.4% |
| $75,000 to $99,999 | 7 | 10.0% |
| $100,000 to $149,999 | 6 | 8.6% |
| $150,000 to $199,999 | 0 | 0.0% |
| $200,000+ | 2 | 2.9% |
Family Income by Famaliy Size in Pine Apple
2-person families (60 | 85.7%) account for the highest median family income in Pine Apple with $41,071 per family, while 2-person families (60 | 85.7%) have the highest median income of $20,536 per family member.
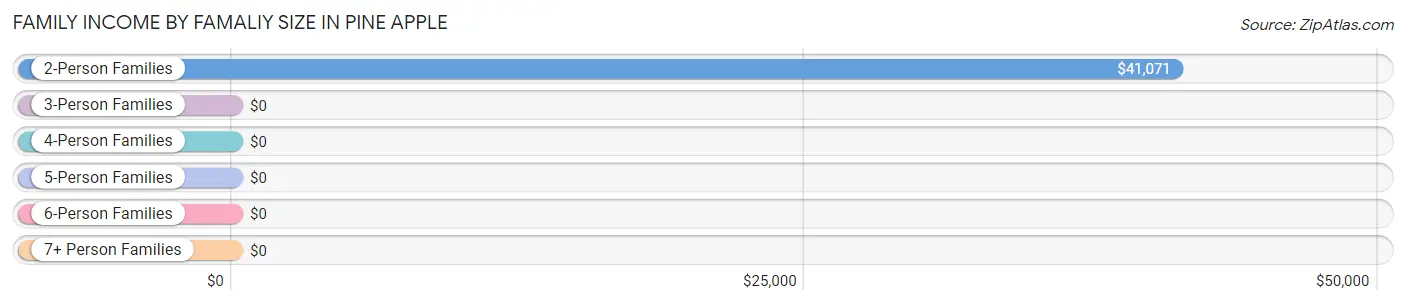
| Income Bracket | # Families | Median Income |
| 2-Person Families | 60 (85.7%) | $41,071 |
| 3-Person Families | 7 (10.0%) | $0 |
| 4-Person Families | 3 (4.3%) | $0 |
| 5-Person Families | 0 (0.0%) | $0 |
| 6-Person Families | 0 (0.0%) | $0 |
| 7+ Person Families | 0 (0.0%) | $0 |
| Total | 70 (100.0%) | $41,071 |
Family Income by Number of Earners in Pine Apple
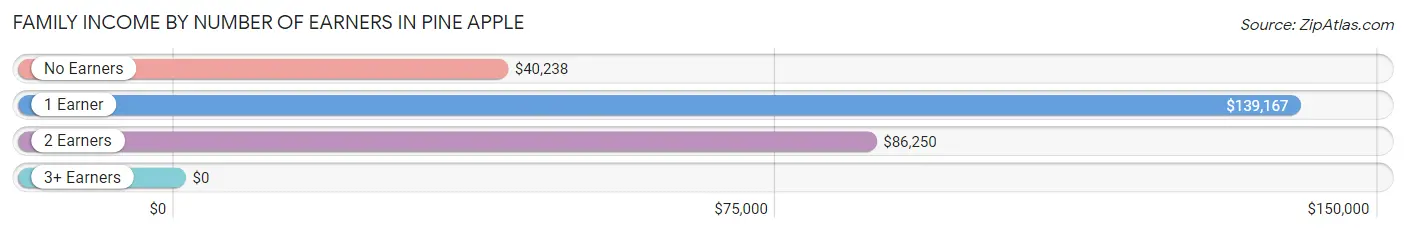
| Number of Earners | # Families | Median Income |
| No Earners | 56 (80.0%) | $40,238 |
| 1 Earner | 6 (8.6%) | $139,167 |
| 2 Earners | 8 (11.4%) | $86,250 |
| 3+ Earners | 0 (0.0%) | $0 |
| Total | 70 (100.0%) | $41,071 |
Household Income in Pine Apple
Household Income Brackets in Pine Apple
With 26 households falling in the category, the $35,000 to $49,999 income range is the most frequent in Pine Apple, accounting for 31.3% of all households.
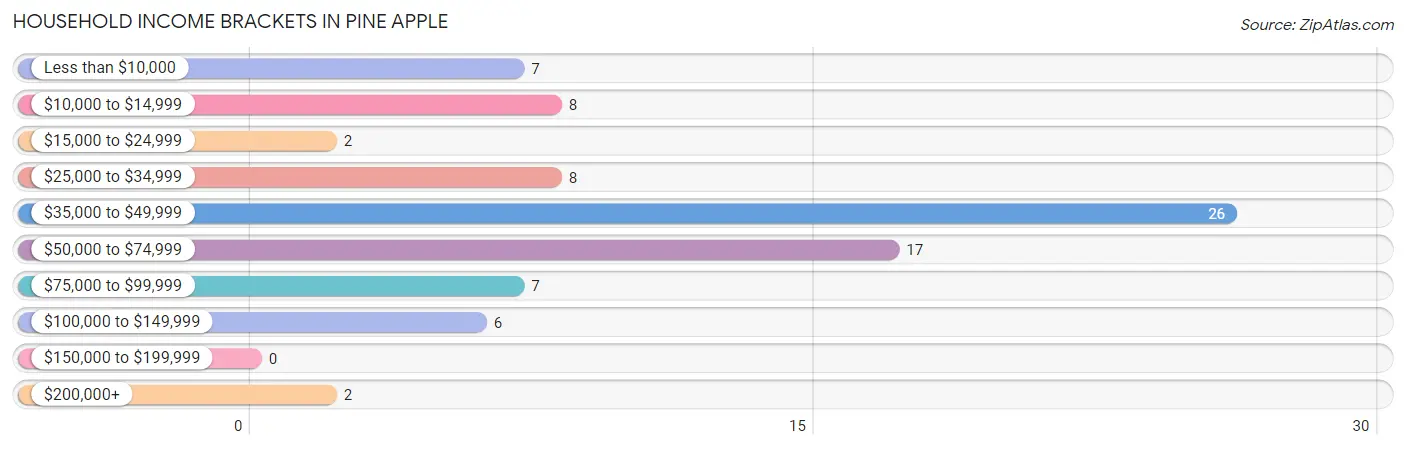
| Income Bracket | # Households | % Households |
| Less than $10,000 | 7 | 8.4% |
| $10,000 to $14,999 | 8 | 9.6% |
| $15,000 to $24,999 | 2 | 2.4% |
| $25,000 to $34,999 | 8 | 9.6% |
| $35,000 to $49,999 | 26 | 31.3% |
| $50,000 to $74,999 | 17 | 20.5% |
| $75,000 to $99,999 | 7 | 8.4% |
| $100,000 to $149,999 | 6 | 7.2% |
| $150,000 to $199,999 | 0 | 0.0% |
| $200,000+ | 2 | 2.4% |
Household Income by Householder Age in Pine Apple
The median household income in Pine Apple is $41,369, with the highest median household income of $53,333 found in the 25 to 44 years age bracket for the primary householder. A total of 10 households (12.0%) fall into this category.
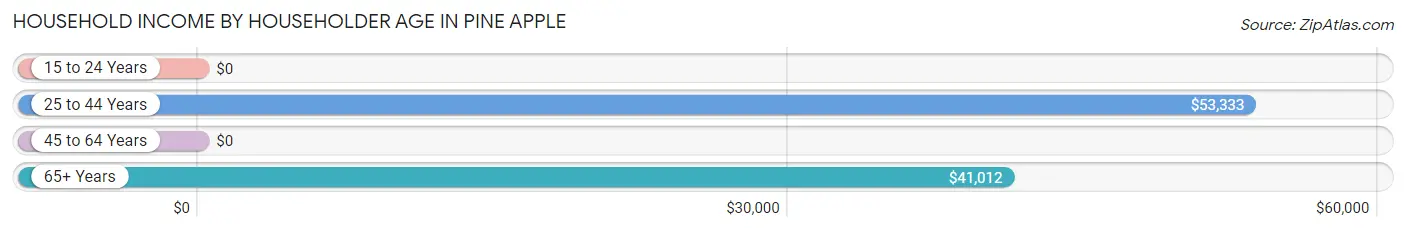
| Income Bracket | # Households | Median Income |
| 15 to 24 Years | 0 (0.0%) | $0 |
| 25 to 44 Years | 10 (12.0%) | $53,333 |
| 45 to 64 Years | 28 (33.7%) | $0 |
| 65+ Years | 45 (54.2%) | $41,012 |
| Total | 83 (100.0%) | $41,369 |
Poverty in Pine Apple
Income Below Poverty by Sex and Age in Pine Apple
With 9.6% poverty level for males and 16.5% for females among the residents of Pine Apple, 6 to 11 year old males and 55 to 64 year old females are the most vulnerable to poverty, with 4 males (80.0%) and 8 females (44.4%) in their respective age groups living below the poverty level.
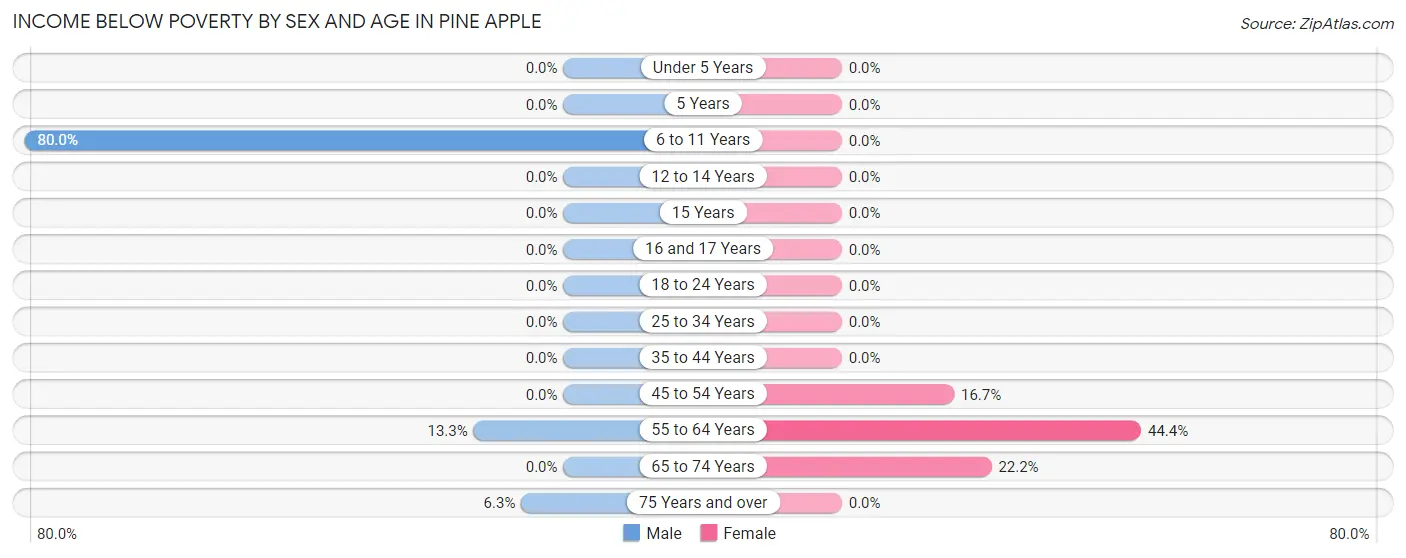
| Age Bracket | Male | Female |
| Under 5 Years | 0 (0.0%) | 0 (0.0%) |
| 5 Years | 0 (0.0%) | 0 (0.0%) |
| 6 to 11 Years | 4 (80.0%) | 0 (0.0%) |
| 12 to 14 Years | 0 (0.0%) | 0 (0.0%) |
| 15 Years | 0 (0.0%) | 0 (0.0%) |
| 16 and 17 Years | 0 (0.0%) | 0 (0.0%) |
| 18 to 24 Years | 0 (0.0%) | 0 (0.0%) |
| 25 to 34 Years | 0 (0.0%) | 0 (0.0%) |
| 35 to 44 Years | 0 (0.0%) | 0 (0.0%) |
| 45 to 54 Years | 0 (0.0%) | 1 (16.7%) |
| 55 to 64 Years | 2 (13.3%) | 8 (44.4%) |
| 65 to 74 Years | 0 (0.0%) | 4 (22.2%) |
| 75 Years and over | 2 (6.2%) | 0 (0.0%) |
| Total | 8 (9.6%) | 13 (16.5%) |
Income Above Poverty by Sex and Age in Pine Apple
According to the poverty statistics in Pine Apple, males aged 12 to 14 years and females aged 16 and 17 years are the age groups that are most secure financially, with 100.0% of males and 100.0% of females in these age groups living above the poverty line.
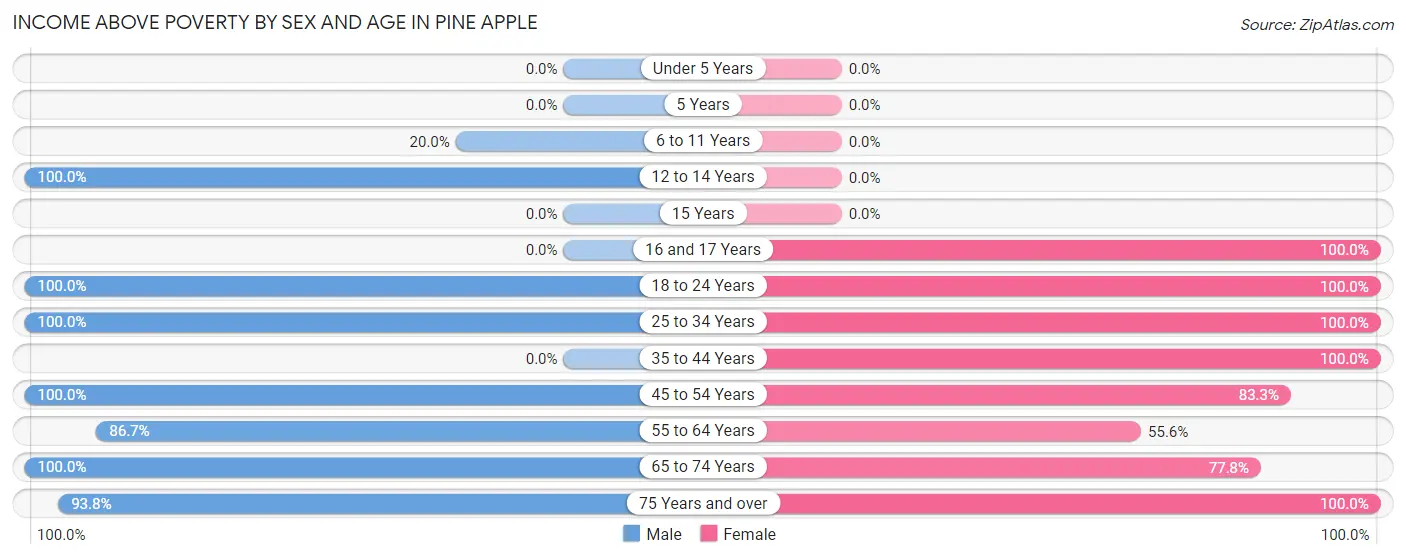
| Age Bracket | Male | Female |
| Under 5 Years | 0 (0.0%) | 0 (0.0%) |
| 5 Years | 0 (0.0%) | 0 (0.0%) |
| 6 to 11 Years | 1 (20.0%) | 0 (0.0%) |
| 12 to 14 Years | 1 (100.0%) | 0 (0.0%) |
| 15 Years | 0 (0.0%) | 0 (0.0%) |
| 16 and 17 Years | 0 (0.0%) | 2 (100.0%) |
| 18 to 24 Years | 1 (100.0%) | 7 (100.0%) |
| 25 to 34 Years | 15 (100.0%) | 7 (100.0%) |
| 35 to 44 Years | 0 (0.0%) | 5 (100.0%) |
| 45 to 54 Years | 5 (100.0%) | 5 (83.3%) |
| 55 to 64 Years | 13 (86.7%) | 10 (55.6%) |
| 65 to 74 Years | 9 (100.0%) | 14 (77.8%) |
| 75 Years and over | 30 (93.8%) | 16 (100.0%) |
| Total | 75 (90.4%) | 66 (83.5%) |
Income Below Poverty Among Married-Couple Families in Pine Apple
The poverty statistics for married-couple families in Pine Apple show that 6.8% or 4 of the total 59 families live below the poverty line. Families with no children have the highest poverty rate of 7.1%, comprising of 4 families. On the other hand, families with 1 or 2 children have the lowest poverty rate of 0.0%, which includes 0 families.
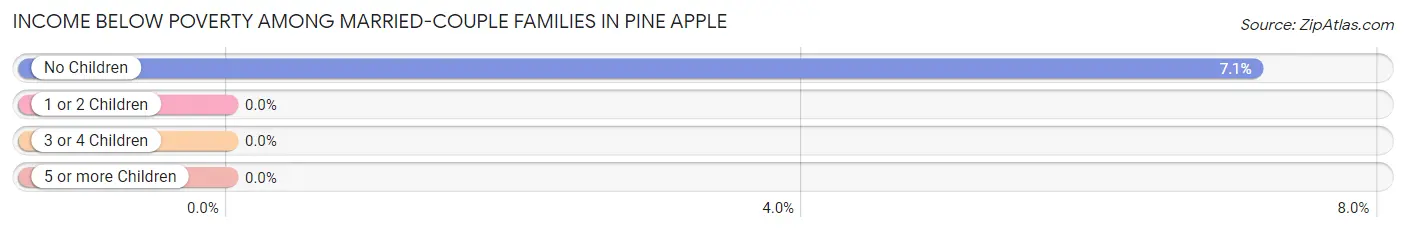
| Children | Above Poverty | Below Poverty |
| No Children | 52 (92.9%) | 4 (7.1%) |
| 1 or 2 Children | 3 (100.0%) | 0 (0.0%) |
| 3 or 4 Children | 0 (0.0%) | 0 (0.0%) |
| 5 or more Children | 0 (0.0%) | 0 (0.0%) |
| Total | 55 (93.2%) | 4 (6.8%) |
Income Below Poverty Among Single-Parent Households in Pine Apple
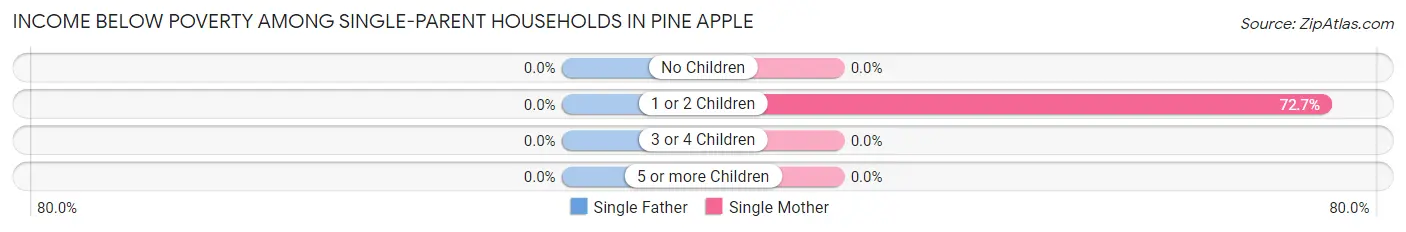
| Children | Single Father | Single Mother |
| No Children | 0 (0.0%) | 0 (0.0%) |
| 1 or 2 Children | 0 (0.0%) | 8 (72.7%) |
| 3 or 4 Children | 0 (0.0%) | 0 (0.0%) |
| 5 or more Children | 0 (0.0%) | 0 (0.0%) |
| Total | 0 (0.0%) | 8 (72.7%) |
Income Below Poverty Among Married-Couple vs Single-Parent Households in Pine Apple
The poverty data for Pine Apple shows that 4 of the married-couple family households (6.8%) and 8 of the single-parent households (72.7%) are living below the poverty level. Within the married-couple family households, those with no children have the highest poverty rate, with 4 households (7.1%) falling below the poverty line. Among the single-parent households, those with 1 or 2 children have the highest poverty rate, with 8 household (72.7%) living below poverty.
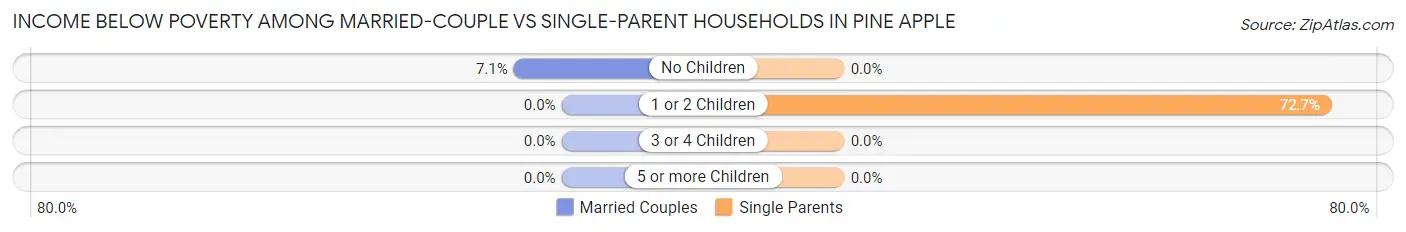
| Children | Married-Couple Families | Single-Parent Households |
| No Children | 4 (7.1%) | 0 (0.0%) |
| 1 or 2 Children | 0 (0.0%) | 8 (72.7%) |
| 3 or 4 Children | 0 (0.0%) | 0 (0.0%) |
| 5 or more Children | 0 (0.0%) | 0 (0.0%) |
| Total | 4 (6.8%) | 8 (72.7%) |
Race in Pine Apple
The most populous races in Pine Apple are White / Caucasian (131 | 80.9%), and Black / African American (31 | 19.1%).
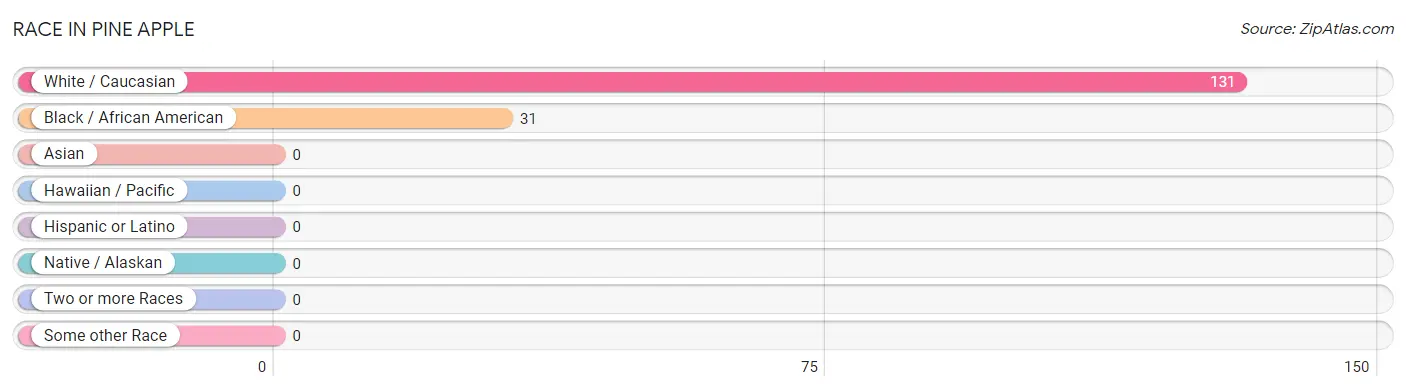
| Race | # Population | % Population |
| Asian | 0 | 0.0% |
| Black / African American | 31 | 19.1% |
| Hawaiian / Pacific | 0 | 0.0% |
| Hispanic or Latino | 0 | 0.0% |
| Native / Alaskan | 0 | 0.0% |
| White / Caucasian | 131 | 80.9% |
| Two or more Races | 0 | 0.0% |
| Some other Race | 0 | 0.0% |
| Total | 162 | 100.0% |
Ancestry in Pine Apple
The most populous ancestries reported in Pine Apple are American (64 | 39.5%), German (15 | 9.3%), Scotch-Irish (12 | 7.4%), English (8 | 4.9%), and French (6 | 3.7%), together accounting for 64.8% of all Pine Apple residents.
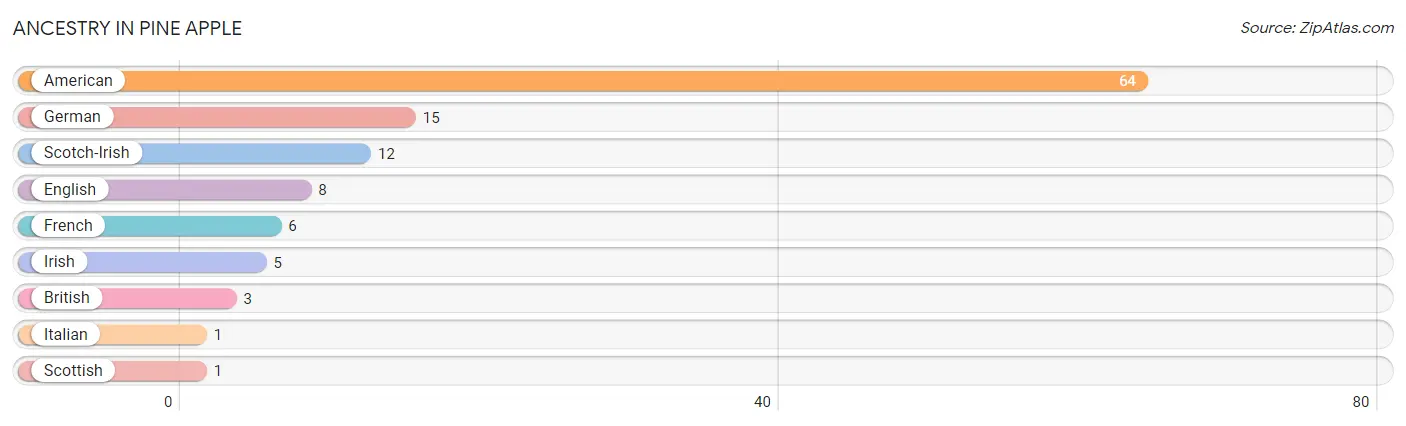
| Ancestry | # Population | % Population |
| American | 64 | 39.5% |
| British | 3 | 1.8% |
| English | 8 | 4.9% |
| French | 6 | 3.7% |
| German | 15 | 9.3% |
| Irish | 5 | 3.1% |
| Italian | 1 | 0.6% |
| Scotch-Irish | 12 | 7.4% |
| Scottish | 1 | 0.6% | View All 9 Rows |
Immigrants in Pine Apple

| Immigration Origin | # Population | % Population | View All 0 Rows |
Sex and Age in Pine Apple
Sex and Age in Pine Apple
The most populous age groups in Pine Apple are 75 to 79 Years (24 | 28.9%) for men and 60 to 64 Years (15 | 19.0%) for women.
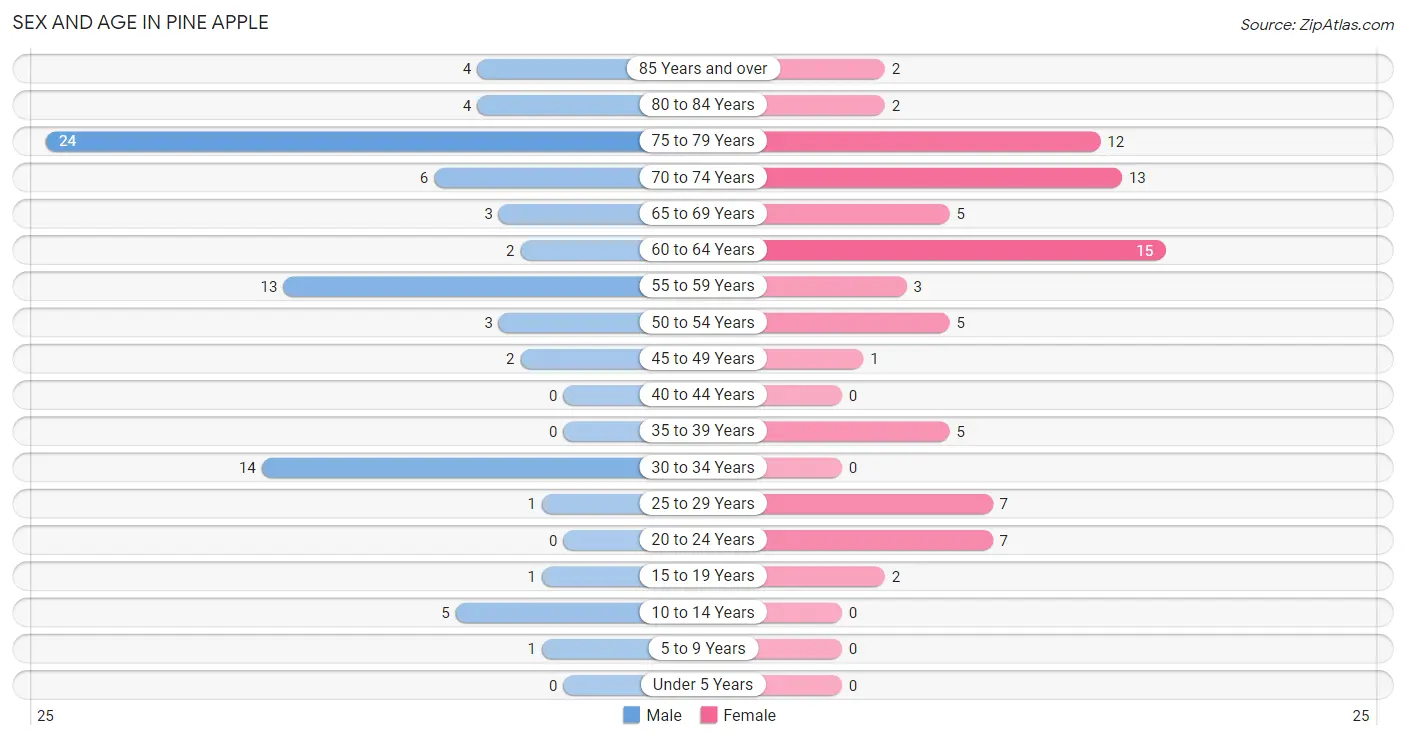
| Age Bracket | Male | Female |
| Under 5 Years | 0 (0.0%) | 0 (0.0%) |
| 5 to 9 Years | 1 (1.2%) | 0 (0.0%) |
| 10 to 14 Years | 5 (6.0%) | 0 (0.0%) |
| 15 to 19 Years | 1 (1.2%) | 2 (2.5%) |
| 20 to 24 Years | 0 (0.0%) | 7 (8.9%) |
| 25 to 29 Years | 1 (1.2%) | 7 (8.9%) |
| 30 to 34 Years | 14 (16.9%) | 0 (0.0%) |
| 35 to 39 Years | 0 (0.0%) | 5 (6.3%) |
| 40 to 44 Years | 0 (0.0%) | 0 (0.0%) |
| 45 to 49 Years | 2 (2.4%) | 1 (1.3%) |
| 50 to 54 Years | 3 (3.6%) | 5 (6.3%) |
| 55 to 59 Years | 13 (15.7%) | 3 (3.8%) |
| 60 to 64 Years | 2 (2.4%) | 15 (19.0%) |
| 65 to 69 Years | 3 (3.6%) | 5 (6.3%) |
| 70 to 74 Years | 6 (7.2%) | 13 (16.5%) |
| 75 to 79 Years | 24 (28.9%) | 12 (15.2%) |
| 80 to 84 Years | 4 (4.8%) | 2 (2.5%) |
| 85 Years and over | 4 (4.8%) | 2 (2.5%) |
| Total | 83 (100.0%) | 79 (100.0%) |
Families and Households in Pine Apple
Median Family Size in Pine Apple
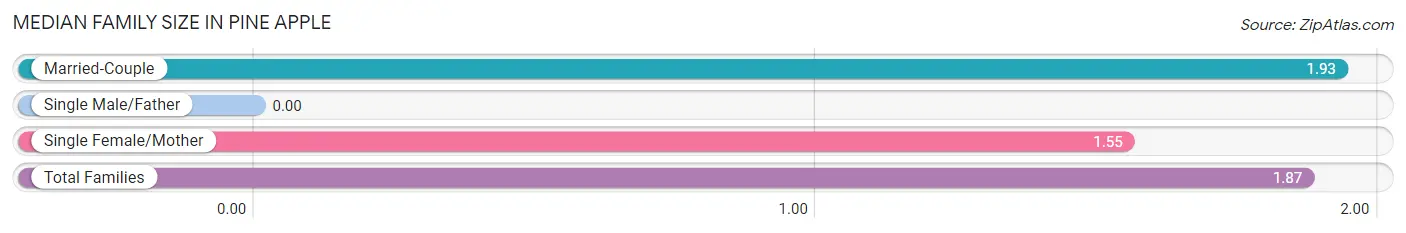
| Family Type | # Families | Family Size |
| Married-Couple | 59 (84.3%) | 1.93 |
| Single Male/Father | 0 (0.0%) | - |
| Single Female/Mother | 11 (15.7%) | 1.55 |
| Total Families | 70 (100.0%) | 1.87 |
Median Household Size in Pine Apple
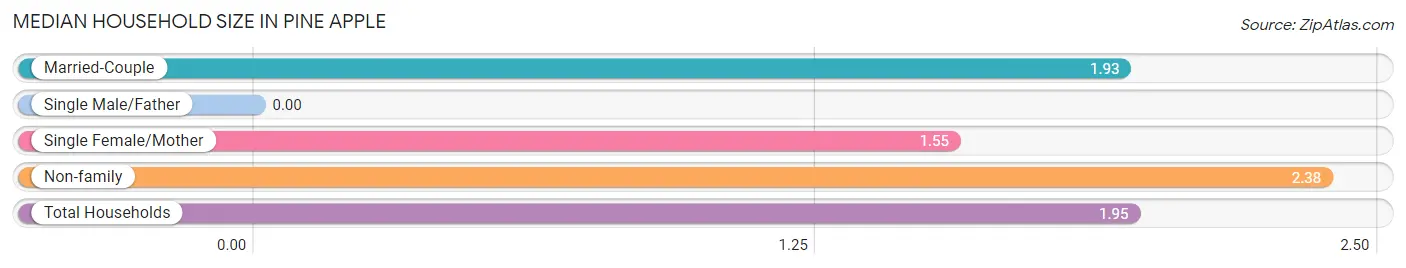
| Household Type | # Households | Household Size |
| Married-Couple | 59 (71.1%) | 1.93 |
| Single Male/Father | 0 (0.0%) | - |
| Single Female/Mother | 11 (13.3%) | 1.55 |
| Non-family | 13 (15.7%) | 2.38 |
| Total Households | 83 (100.0%) | 1.95 |
Household Size by Marriage Status in Pine Apple
Out of a total of 83 households in Pine Apple, 70 (84.3%) are family households, while 13 (15.7%) are nonfamily households. The most numerous type of family households are 2-person households, comprising 60, and the most common type of nonfamily households are 2-person households, comprising 9.
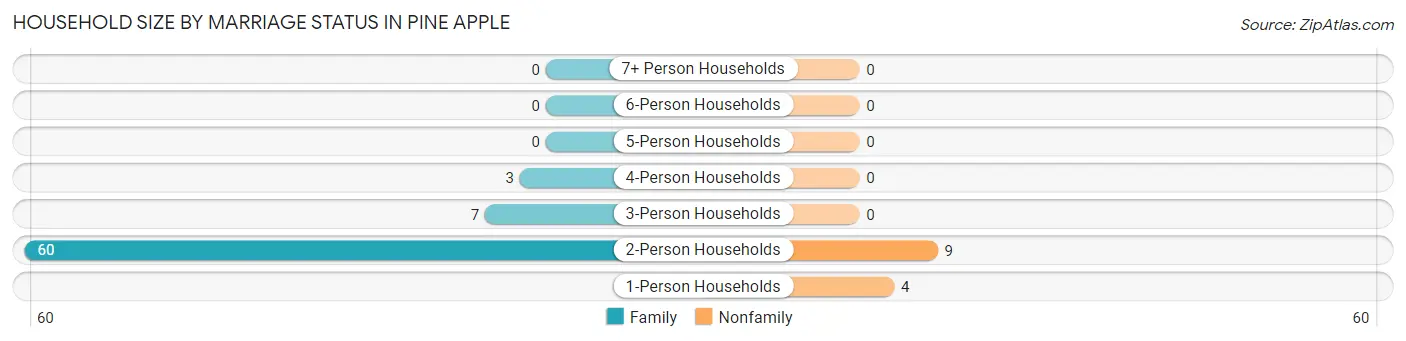
| Household Size | Family Households | Nonfamily Households |
| 1-Person Households | - | 4 (4.8%) |
| 2-Person Households | 60 (72.3%) | 9 (10.8%) |
| 3-Person Households | 7 (8.4%) | 0 (0.0%) |
| 4-Person Households | 3 (3.6%) | 0 (0.0%) |
| 5-Person Households | 0 (0.0%) | 0 (0.0%) |
| 6-Person Households | 0 (0.0%) | 0 (0.0%) |
| 7+ Person Households | 0 (0.0%) | 0 (0.0%) |
| Total | 70 (84.3%) | 13 (15.7%) |
Female Fertility in Pine Apple
Fertility by Age in Pine Apple
| Age Bracket | Women with Births | Births / 1,000 Women |
| 15 to 19 years | 0 (0.0%) | 0.0 |
| 20 to 34 years | 0 (0.0%) | 0.0 |
| 35 to 50 years | 0 (0.0%) | 0.0 |
| Total | 0 (0.0%) | 0.0 |
Fertility by Age by Marriage Status in Pine Apple
| Age Bracket | Married | Unmarried |
| 15 to 19 years | 0 (0.0%) | 0 (0.0%) |
| 20 to 34 years | 0 (0.0%) | 0 (0.0%) |
| 35 to 50 years | 0 (0.0%) | 0 (0.0%) |
| Total | 0 (0.0%) | 0 (0.0%) |
Fertility by Education in Pine Apple
| Educational Attainment | Women with Births | Births / 1,000 Women |
| Less than High School | 0 (0.0%) | 0.0 |
| High School Diploma | 0 (0.0%) | 0.0 |
| College or Associate's Degree | 0 (0.0%) | 0.0 |
| Bachelor's Degree | 0 (0.0%) | 0.0 |
| Graduate Degree | 0 (0.0%) | 0.0 |
| Total | 0 (0.0%) | 0.0 |
Fertility by Education by Marriage Status in Pine Apple
| Educational Attainment | Married | Unmarried |
| Less than High School | 0 (0.0%) | 0 (0.0%) |
| High School Diploma | 0 (0.0%) | 0 (0.0%) |
| College or Associate's Degree | 0 (0.0%) | 0 (0.0%) |
| Bachelor's Degree | 0 (0.0%) | 0 (0.0%) |
| Graduate Degree | 0 (0.0%) | 0 (0.0%) |
| Total | 0 (0.0%) | 0 (0.0%) |
Employment Characteristics in Pine Apple
Employment by Class of Employer in Pine Apple
Among the 48 employed individuals in Pine Apple, private company employees (32 | 66.7%), self-employed (not incorporated) (9 | 18.8%), and local government employees (6 | 12.5%) make up the most common classes of employment.
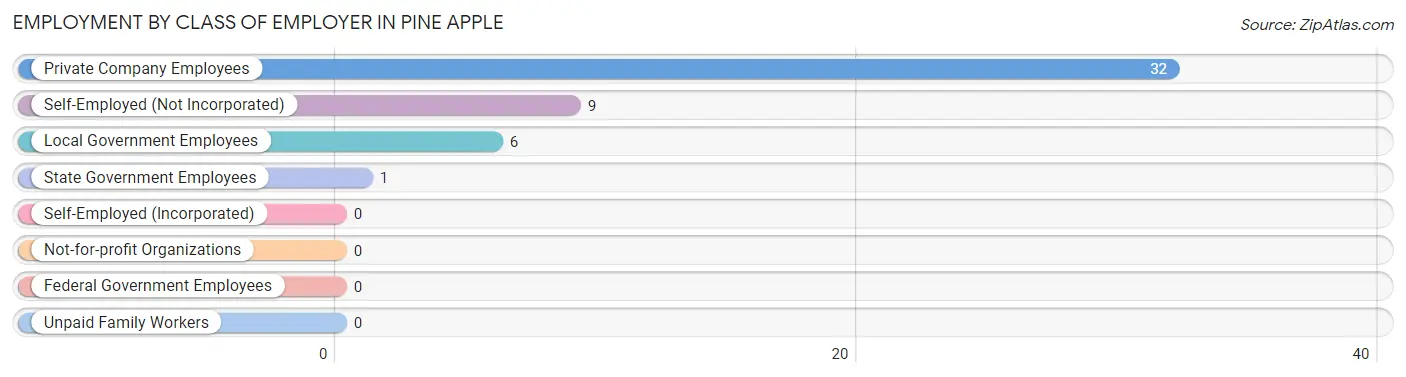
| Employer Class | # Employees | % Employees |
| Private Company Employees | 32 | 66.7% |
| Self-Employed (Incorporated) | 0 | 0.0% |
| Self-Employed (Not Incorporated) | 9 | 18.8% |
| Not-for-profit Organizations | 0 | 0.0% |
| Local Government Employees | 6 | 12.5% |
| State Government Employees | 1 | 2.1% |
| Federal Government Employees | 0 | 0.0% |
| Unpaid Family Workers | 0 | 0.0% |
| Total | 48 | 100.0% |
Employment Status by Age in Pine Apple
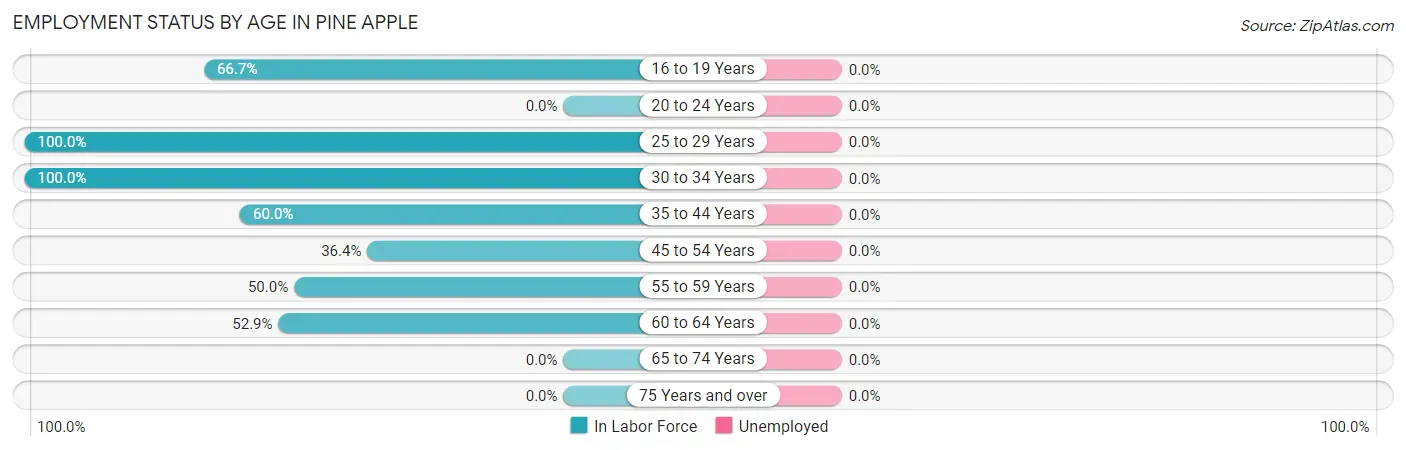
| Age Bracket | In Labor Force | Unemployed |
| 16 to 19 Years | 2 (66.7%) | 0 (0.0%) |
| 20 to 24 Years | 0 (0.0%) | 0 (0.0%) |
| 25 to 29 Years | 8 (100.0%) | 0 (0.0%) |
| 30 to 34 Years | 14 (100.0%) | 0 (0.0%) |
| 35 to 44 Years | 3 (60.0%) | 0 (0.0%) |
| 45 to 54 Years | 4 (36.4%) | 0 (0.0%) |
| 55 to 59 Years | 8 (50.0%) | 0 (0.0%) |
| 60 to 64 Years | 9 (52.9%) | 0 (0.0%) |
| 65 to 74 Years | 0 (0.0%) | 0 (0.0%) |
| 75 Years and over | 0 (0.0%) | 0 (0.0%) |
| Total | 48 (30.8%) | 0 (0.0%) |
Employment Status by Educational Attainment in Pine Apple
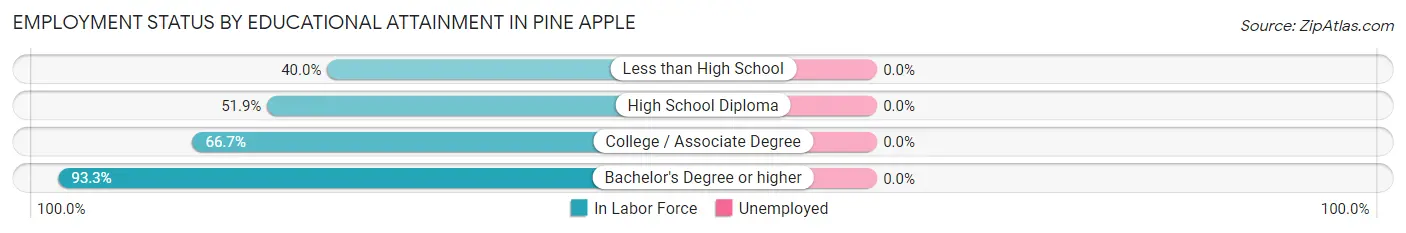
| Educational Attainment | In Labor Force | Unemployed |
| Less than High School | 2 (40.0%) | 0 (0.0%) |
| High School Diploma | 14 (51.9%) | 0 (0.0%) |
| College / Associate Degree | 16 (66.7%) | 0 (0.0%) |
| Bachelor's Degree or higher | 14 (93.3%) | 0 (0.0%) |
| Total | 46 (64.8%) | 0 (0.0%) |
Employment Occupations by Sex in Pine Apple
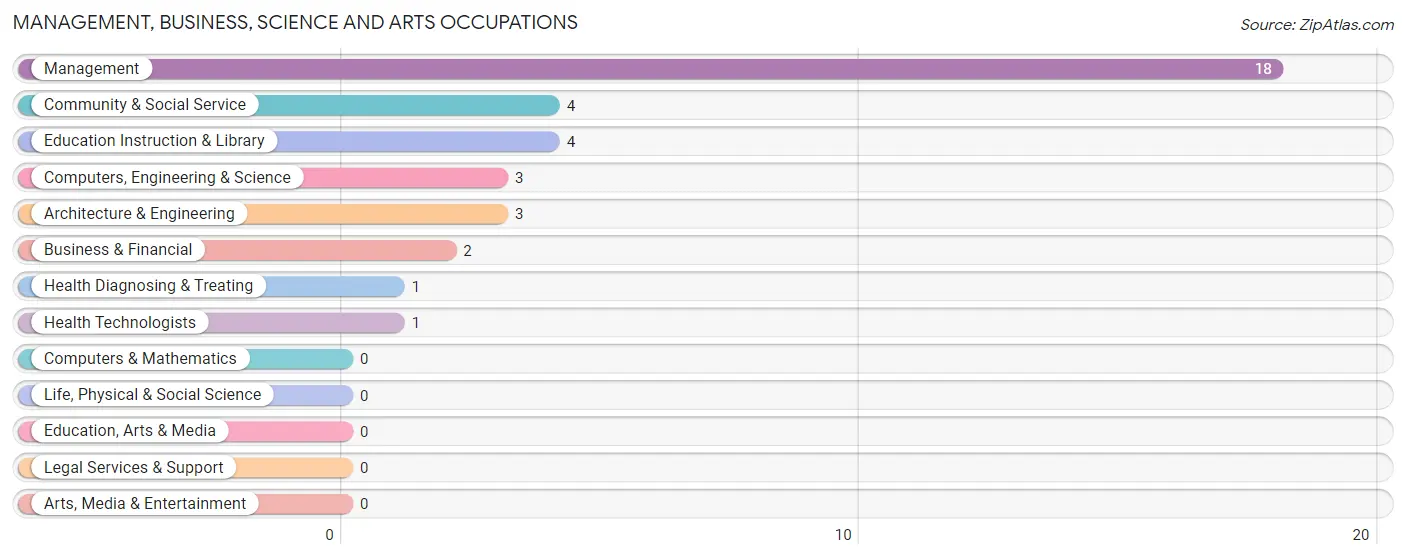
Management, Business, Science and Arts Occupations
The most common Management, Business, Science and Arts occupations in Pine Apple are Management (18 | 37.5%), Community & Social Service (4 | 8.3%), Education Instruction & Library (4 | 8.3%), Computers, Engineering & Science (3 | 6.2%), and Architecture & Engineering (3 | 6.2%).
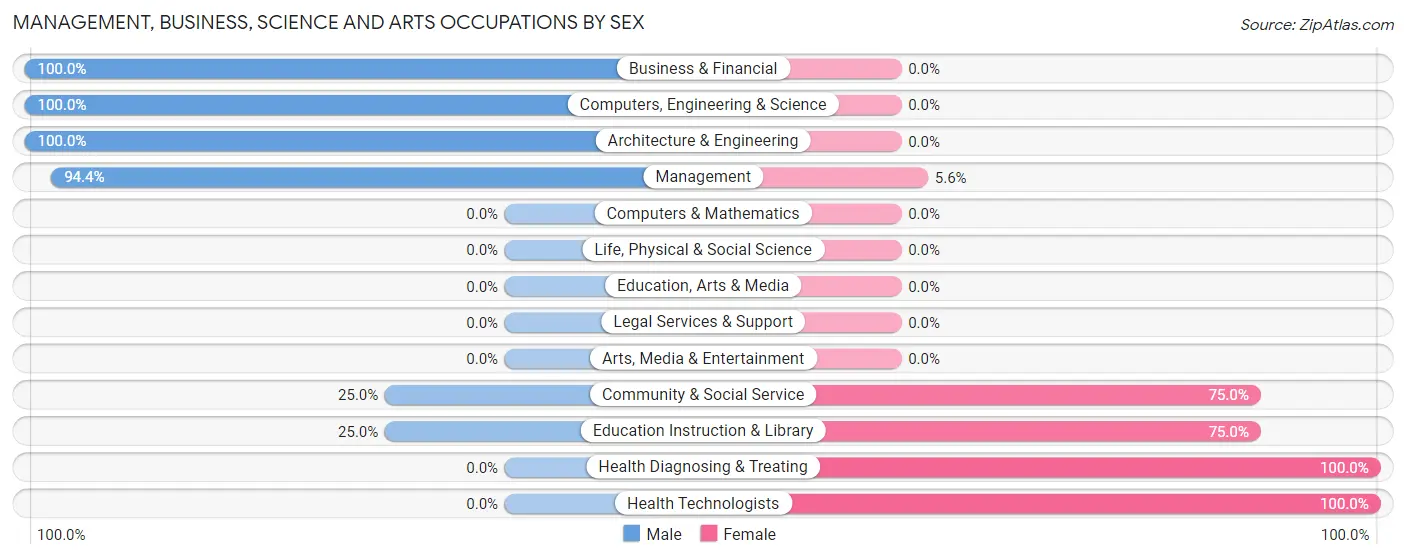
Management, Business, Science and Arts Occupations by Sex
Within the Management, Business, Science and Arts occupations in Pine Apple, the most male-oriented occupations are Business & Financial (100.0%), Computers, Engineering & Science (100.0%), and Architecture & Engineering (100.0%), while the most female-oriented occupations are Health Diagnosing & Treating (100.0%), Health Technologists (100.0%), and Community & Social Service (75.0%).
| Occupation | Male | Female |
| Management | 17 (94.4%) | 1 (5.6%) |
| Business & Financial | 2 (100.0%) | 0 (0.0%) |
| Computers, Engineering & Science | 3 (100.0%) | 0 (0.0%) |
| Computers & Mathematics | 0 (0.0%) | 0 (0.0%) |
| Architecture & Engineering | 3 (100.0%) | 0 (0.0%) |
| Life, Physical & Social Science | 0 (0.0%) | 0 (0.0%) |
| Community & Social Service | 1 (25.0%) | 3 (75.0%) |
| Education, Arts & Media | 0 (0.0%) | 0 (0.0%) |
| Legal Services & Support | 0 (0.0%) | 0 (0.0%) |
| Education Instruction & Library | 1 (25.0%) | 3 (75.0%) |
| Arts, Media & Entertainment | 0 (0.0%) | 0 (0.0%) |
| Health Diagnosing & Treating | 0 (0.0%) | 1 (100.0%) |
| Health Technologists | 0 (0.0%) | 1 (100.0%) |
| Total (Category) | 23 (82.1%) | 5 (17.9%) |
| Total (Overall) | 28 (58.3%) | 20 (41.7%) |
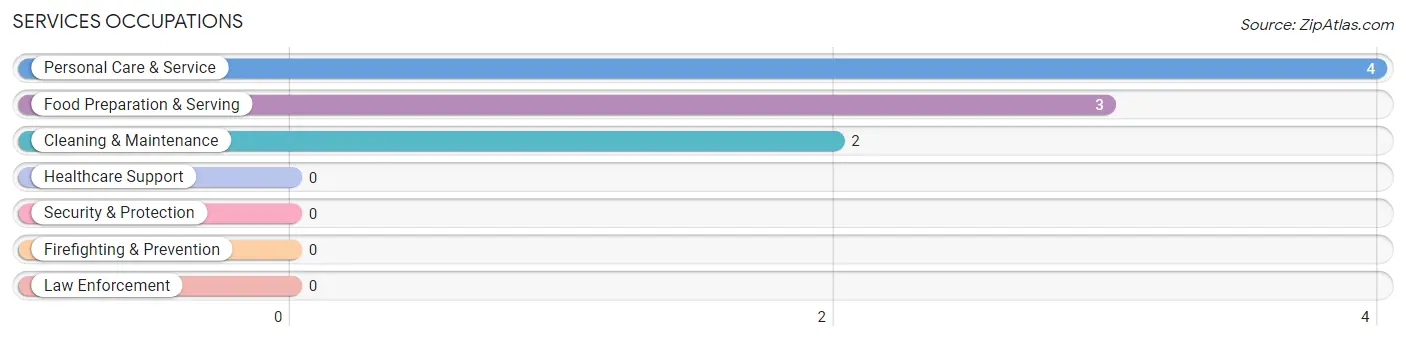
Services Occupations
The most common Services occupations in Pine Apple are Personal Care & Service (4 | 8.3%), Food Preparation & Serving (3 | 6.2%), and Cleaning & Maintenance (2 | 4.2%).
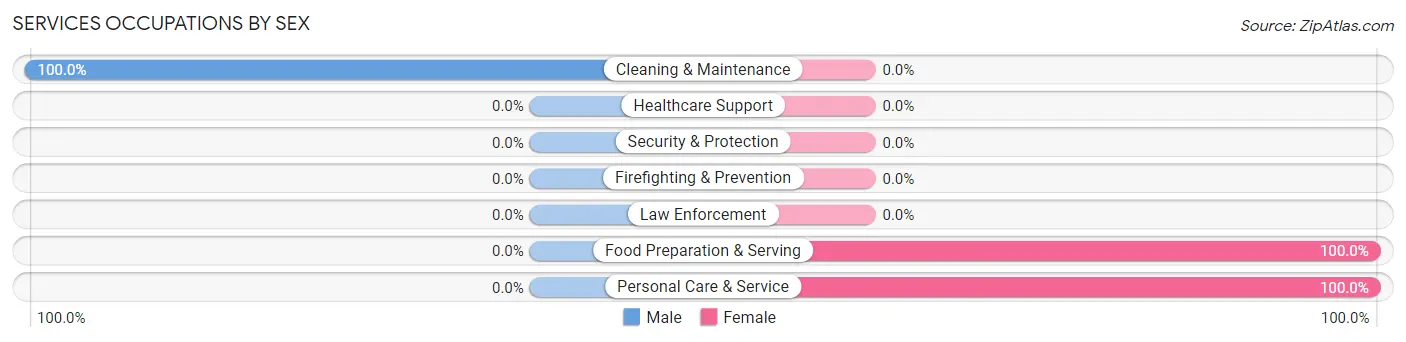
Services Occupations by Sex
| Occupation | Male | Female |
| Healthcare Support | 0 (0.0%) | 0 (0.0%) |
| Security & Protection | 0 (0.0%) | 0 (0.0%) |
| Firefighting & Prevention | 0 (0.0%) | 0 (0.0%) |
| Law Enforcement | 0 (0.0%) | 0 (0.0%) |
| Food Preparation & Serving | 0 (0.0%) | 3 (100.0%) |
| Cleaning & Maintenance | 2 (100.0%) | 0 (0.0%) |
| Personal Care & Service | 0 (0.0%) | 4 (100.0%) |
| Total (Category) | 2 (22.2%) | 7 (77.8%) |
| Total (Overall) | 28 (58.3%) | 20 (41.7%) |
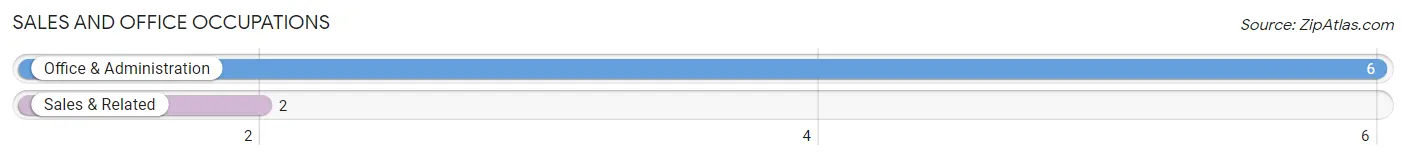
Sales and Office Occupations
The most common Sales and Office occupations in Pine Apple are Office & Administration (6 | 12.5%), and Sales & Related (2 | 4.2%).
Sales and Office Occupations by Sex
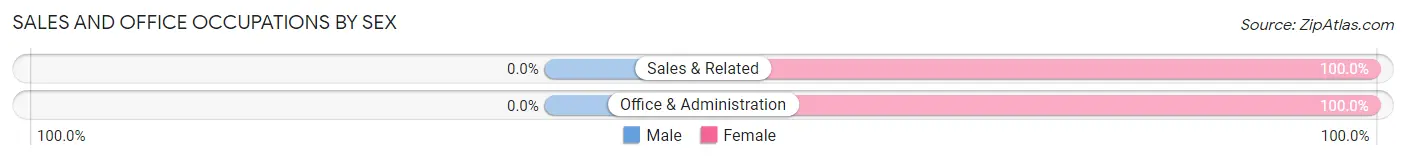
| Occupation | Male | Female |
| Sales & Related | 0 (0.0%) | 2 (100.0%) |
| Office & Administration | 0 (0.0%) | 6 (100.0%) |
| Total (Category) | 0 (0.0%) | 8 (100.0%) |
| Total (Overall) | 28 (58.3%) | 20 (41.7%) |
Natural Resources, Construction and Maintenance Occupations
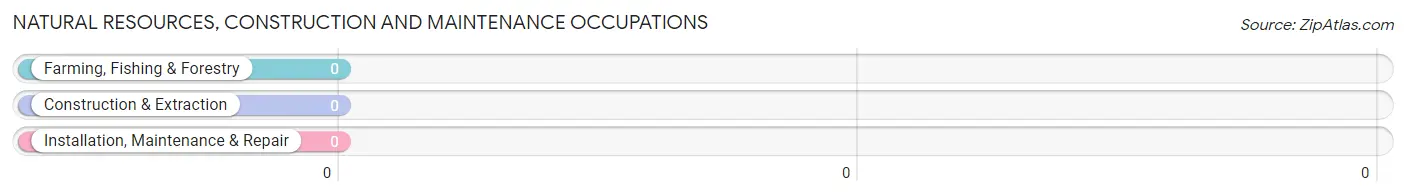
Natural Resources, Construction and Maintenance Occupations by Sex
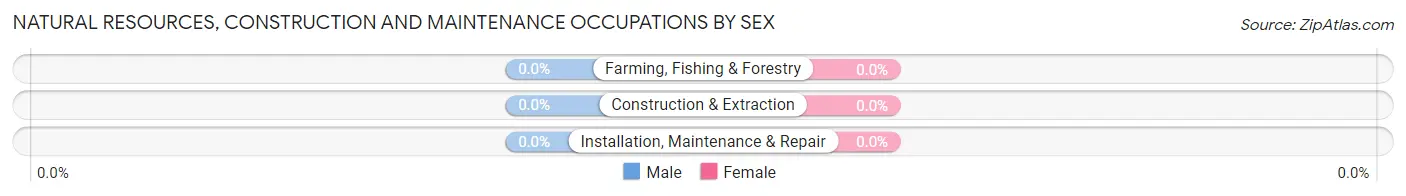
| Occupation | Male | Female |
| Farming, Fishing & Forestry | 0 (0.0%) | 0 (0.0%) |
| Construction & Extraction | 0 (0.0%) | 0 (0.0%) |
| Installation, Maintenance & Repair | 0 (0.0%) | 0 (0.0%) |
| Total (Category) | 0 (0.0%) | 0 (0.0%) |
| Total (Overall) | 28 (58.3%) | 20 (41.7%) |
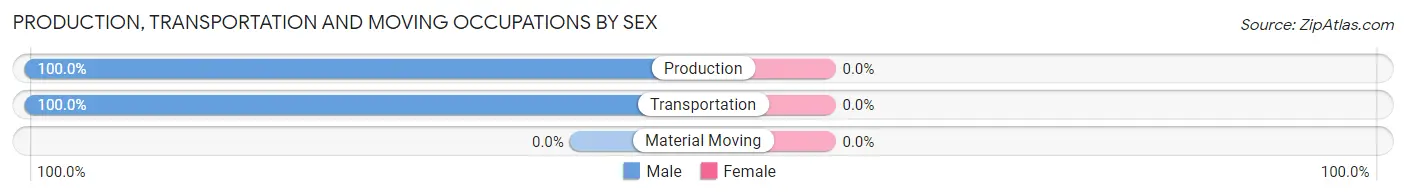
Production, Transportation and Moving Occupations
The most common Production, Transportation and Moving occupations in Pine Apple are Transportation (2 | 4.2%), and Production (1 | 2.1%).
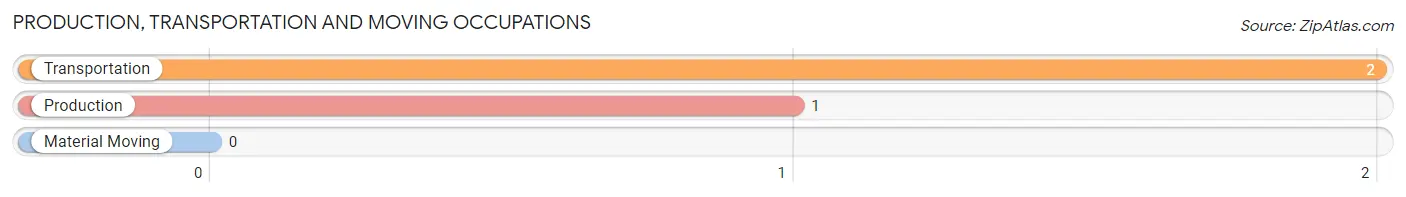
Production, Transportation and Moving Occupations by Sex
| Occupation | Male | Female |
| Production | 1 (100.0%) | 0 (0.0%) |
| Transportation | 2 (100.0%) | 0 (0.0%) |
| Material Moving | 0 (0.0%) | 0 (0.0%) |
| Total (Category) | 3 (100.0%) | 0 (0.0%) |
| Total (Overall) | 28 (58.3%) | 20 (41.7%) |
Employment Industries by Sex in Pine Apple
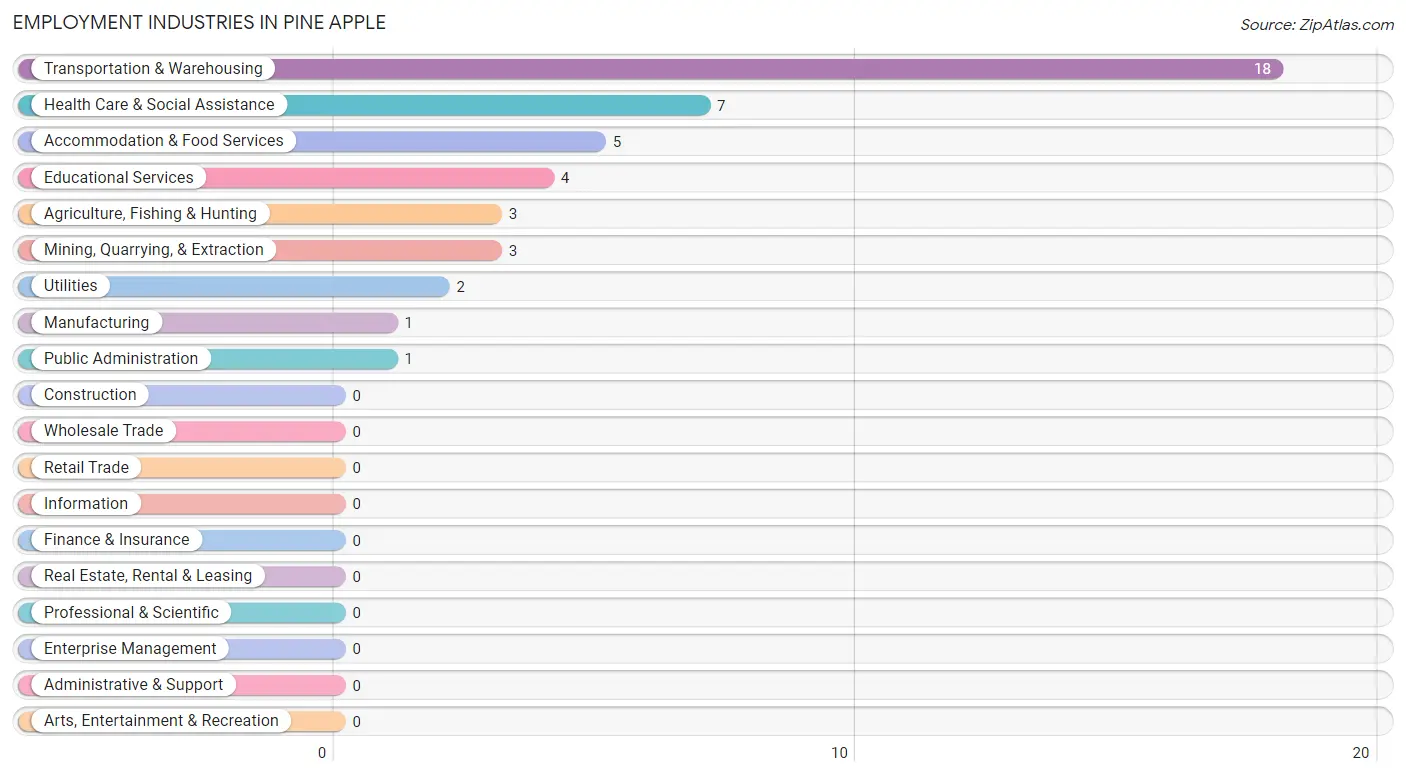
Employment Industries in Pine Apple
The major employment industries in Pine Apple include Transportation & Warehousing (18 | 37.5%), Health Care & Social Assistance (7 | 14.6%), Accommodation & Food Services (5 | 10.4%), Educational Services (4 | 8.3%), and Agriculture, Fishing & Hunting (3 | 6.2%).
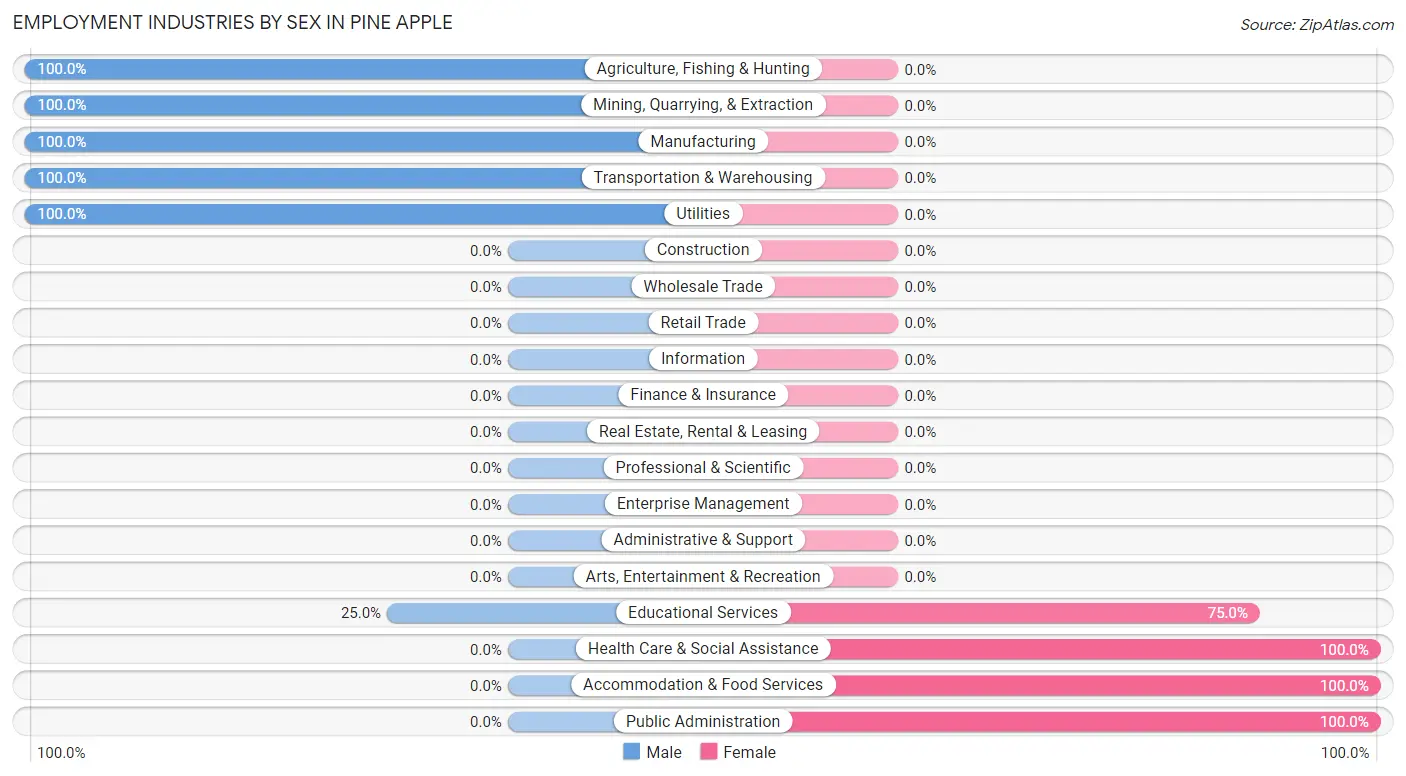
Employment Industries by Sex in Pine Apple
The Pine Apple industries that see more men than women are Agriculture, Fishing & Hunting (100.0%), Mining, Quarrying, & Extraction (100.0%), and Manufacturing (100.0%), whereas the industries that tend to have a higher number of women are Health Care & Social Assistance (100.0%), Accommodation & Food Services (100.0%), and Public Administration (100.0%).
| Industry | Male | Female |
| Agriculture, Fishing & Hunting | 3 (100.0%) | 0 (0.0%) |
| Mining, Quarrying, & Extraction | 3 (100.0%) | 0 (0.0%) |
| Construction | 0 (0.0%) | 0 (0.0%) |
| Manufacturing | 1 (100.0%) | 0 (0.0%) |
| Wholesale Trade | 0 (0.0%) | 0 (0.0%) |
| Retail Trade | 0 (0.0%) | 0 (0.0%) |
| Transportation & Warehousing | 18 (100.0%) | 0 (0.0%) |
| Utilities | 2 (100.0%) | 0 (0.0%) |
| Information | 0 (0.0%) | 0 (0.0%) |
| Finance & Insurance | 0 (0.0%) | 0 (0.0%) |
| Real Estate, Rental & Leasing | 0 (0.0%) | 0 (0.0%) |
| Professional & Scientific | 0 (0.0%) | 0 (0.0%) |
| Enterprise Management | 0 (0.0%) | 0 (0.0%) |
| Administrative & Support | 0 (0.0%) | 0 (0.0%) |
| Educational Services | 1 (25.0%) | 3 (75.0%) |
| Health Care & Social Assistance | 0 (0.0%) | 7 (100.0%) |
| Arts, Entertainment & Recreation | 0 (0.0%) | 0 (0.0%) |
| Accommodation & Food Services | 0 (0.0%) | 5 (100.0%) |
| Public Administration | 0 (0.0%) | 1 (100.0%) |
| Total | 28 (58.3%) | 20 (41.7%) |
Education in Pine Apple
School Enrollment in Pine Apple
The most common levels of schooling among the 17 students in Pine Apple are college / undergraduate (7 | 41.2%), elementary school (4 | 23.5%), and high school (3 | 17.6%).
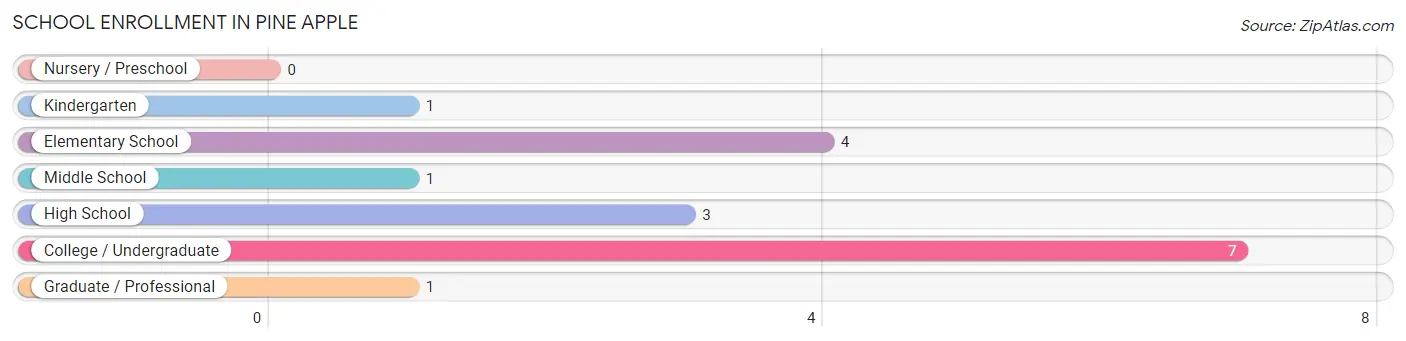
| School Level | # Students | % Students |
| Nursery / Preschool | 0 | 0.0% |
| Kindergarten | 1 | 5.9% |
| Elementary School | 4 | 23.5% |
| Middle School | 1 | 5.9% |
| High School | 3 | 17.6% |
| College / Undergraduate | 7 | 41.2% |
| Graduate / Professional | 1 | 5.9% |
| Total | 17 | 100.0% |
School Enrollment by Age by Funding Source in Pine Apple
Out of a total of 17 students who are enrolled in schools in Pine Apple, 2 (11.8%) attend a private institution, while the remaining 15 (88.2%) are enrolled in public schools. The age group of 5 to 9 year old has the highest likelihood of being enrolled in private schools, with 1 (100.0% in the age bracket) enrolled. Conversely, the age group of 15 to 17 year olds has the lowest likelihood of being enrolled in a private school, with 2 (100.0% in the age bracket) attending a public institution.
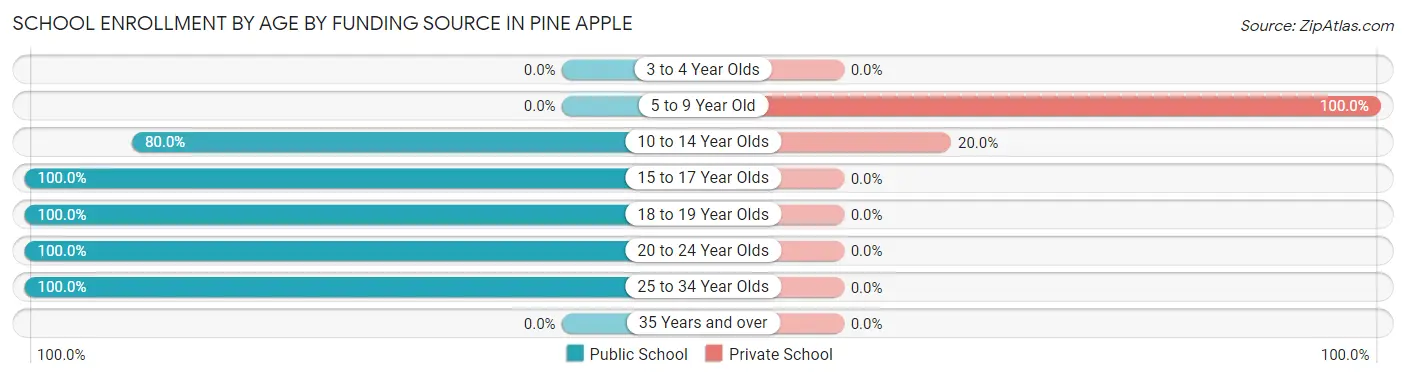
| Age Bracket | Public School | Private School |
| 3 to 4 Year Olds | 0 (0.0%) | 0 (0.0%) |
| 5 to 9 Year Old | 0 (0.0%) | 1 (100.0%) |
| 10 to 14 Year Olds | 4 (80.0%) | 1 (20.0%) |
| 15 to 17 Year Olds | 2 (100.0%) | 0 (0.0%) |
| 18 to 19 Year Olds | 1 (100.0%) | 0 (0.0%) |
| 20 to 24 Year Olds | 7 (100.0%) | 0 (0.0%) |
| 25 to 34 Year Olds | 1 (100.0%) | 0 (0.0%) |
| 35 Years and over | 0 (0.0%) | 0 (0.0%) |
| Total | 15 (88.2%) | 2 (11.8%) |
Educational Attainment by Field of Study in Pine Apple
Education (12 | 41.4%), bio, nature & agricultural (7 | 24.1%), psychology (4 | 13.8%), science & technology (3 | 10.3%), and business (2 | 6.9%) are the most common fields of study among 29 individuals in Pine Apple who have obtained a bachelor's degree or higher.
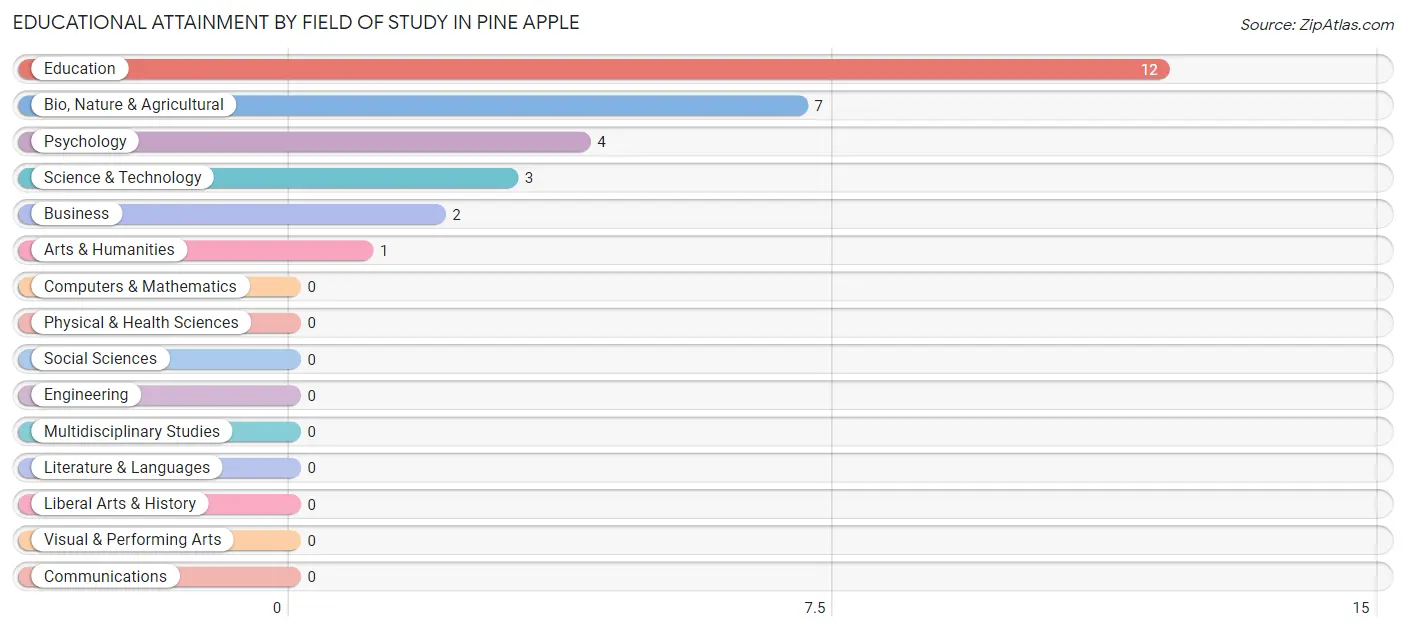
| Field of Study | # Graduates | % Graduates |
| Computers & Mathematics | 0 | 0.0% |
| Bio, Nature & Agricultural | 7 | 24.1% |
| Physical & Health Sciences | 0 | 0.0% |
| Psychology | 4 | 13.8% |
| Social Sciences | 0 | 0.0% |
| Engineering | 0 | 0.0% |
| Multidisciplinary Studies | 0 | 0.0% |
| Science & Technology | 3 | 10.3% |
| Business | 2 | 6.9% |
| Education | 12 | 41.4% |
| Literature & Languages | 0 | 0.0% |
| Liberal Arts & History | 0 | 0.0% |
| Visual & Performing Arts | 0 | 0.0% |
| Communications | 0 | 0.0% |
| Arts & Humanities | 1 | 3.5% |
| Total | 29 | 100.0% |
Transportation & Commute in Pine Apple
Vehicle Availability by Sex in Pine Apple
The most prevalent vehicle ownership categories in Pine Apple are males with 2 vehicles (25, accounting for 89.3%) and females with 2 vehicles (11, making up 125.0%).
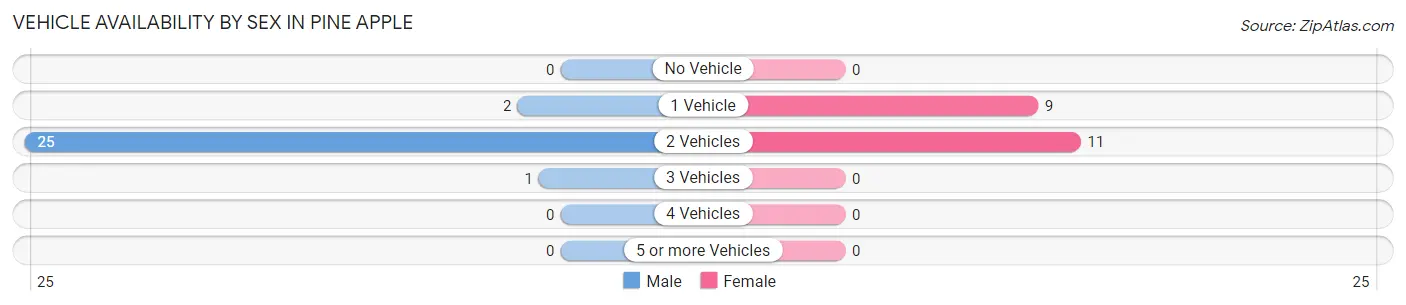
| Vehicles Available | Male | Female |
| No Vehicle | 0 (0.0%) | 0 (0.0%) |
| 1 Vehicle | 2 (7.1%) | 9 (45.0%) |
| 2 Vehicles | 25 (89.3%) | 11 (55.0%) |
| 3 Vehicles | 1 (3.6%) | 0 (0.0%) |
| 4 Vehicles | 0 (0.0%) | 0 (0.0%) |
| 5 or more Vehicles | 0 (0.0%) | 0 (0.0%) |
| Total | 28 (100.0%) | 20 (100.0%) |
Commute Time in Pine Apple
The most frequently occuring commute durations in Pine Apple are 5 to 9 minutes (16 commuters, 33.3%), 60 to 89 minutes (10 commuters, 20.8%), and 30 to 34 minutes (9 commuters, 18.8%).
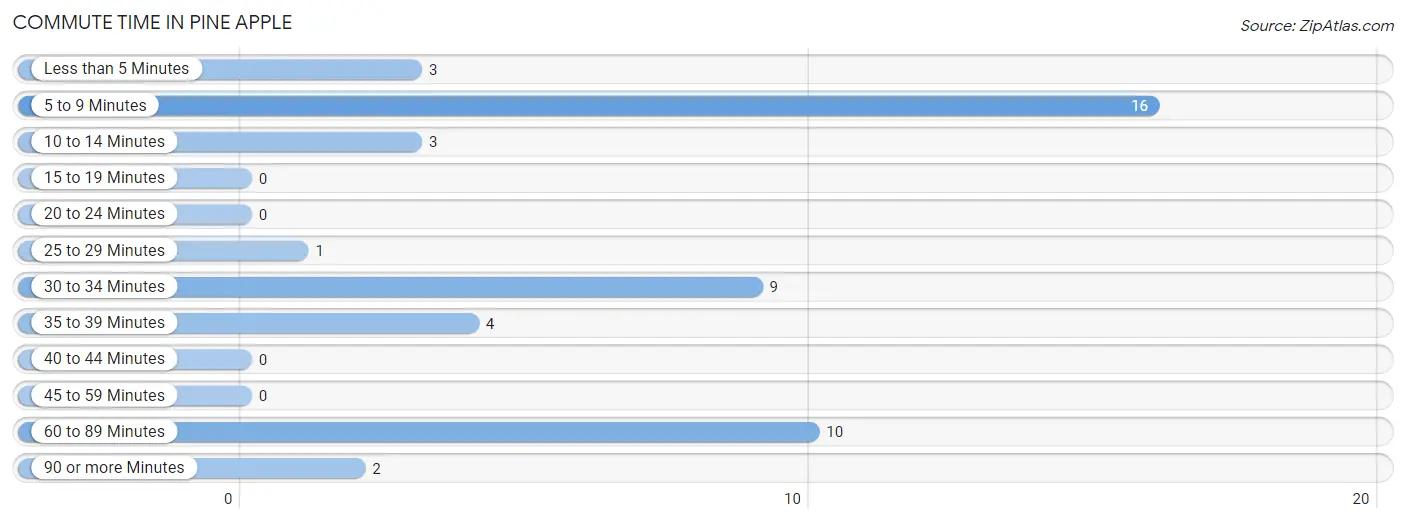
| Commute Time | # Commuters | % Commuters |
| Less than 5 Minutes | 3 | 6.2% |
| 5 to 9 Minutes | 16 | 33.3% |
| 10 to 14 Minutes | 3 | 6.2% |
| 15 to 19 Minutes | 0 | 0.0% |
| 20 to 24 Minutes | 0 | 0.0% |
| 25 to 29 Minutes | 1 | 2.1% |
| 30 to 34 Minutes | 9 | 18.8% |
| 35 to 39 Minutes | 4 | 8.3% |
| 40 to 44 Minutes | 0 | 0.0% |
| 45 to 59 Minutes | 0 | 0.0% |
| 60 to 89 Minutes | 10 | 20.8% |
| 90 or more Minutes | 2 | 4.2% |
Commute Time by Sex in Pine Apple
The most common commute times in Pine Apple are 5 to 9 minutes (16 commuters, 57.1%) for males and 60 to 89 minutes (10 commuters, 50.0%) for females.
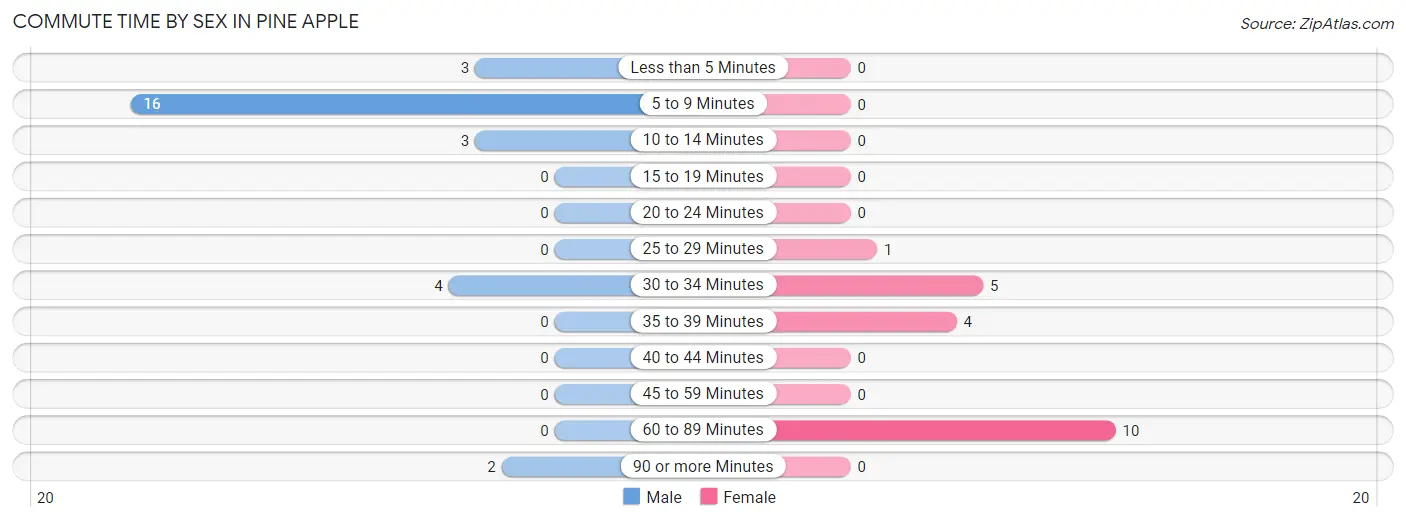
| Commute Time | Male | Female |
| Less than 5 Minutes | 3 (10.7%) | 0 (0.0%) |
| 5 to 9 Minutes | 16 (57.1%) | 0 (0.0%) |
| 10 to 14 Minutes | 3 (10.7%) | 0 (0.0%) |
| 15 to 19 Minutes | 0 (0.0%) | 0 (0.0%) |
| 20 to 24 Minutes | 0 (0.0%) | 0 (0.0%) |
| 25 to 29 Minutes | 0 (0.0%) | 1 (5.0%) |
| 30 to 34 Minutes | 4 (14.3%) | 5 (25.0%) |
| 35 to 39 Minutes | 0 (0.0%) | 4 (20.0%) |
| 40 to 44 Minutes | 0 (0.0%) | 0 (0.0%) |
| 45 to 59 Minutes | 0 (0.0%) | 0 (0.0%) |
| 60 to 89 Minutes | 0 (0.0%) | 10 (50.0%) |
| 90 or more Minutes | 2 (7.1%) | 0 (0.0%) |
Time of Departure to Work by Sex in Pine Apple
The most frequent times of departure to work in Pine Apple are 7:00 AM to 7:29 AM (16, 57.1%) for males and 7:00 AM to 7:29 AM (6, 30.0%) for females.
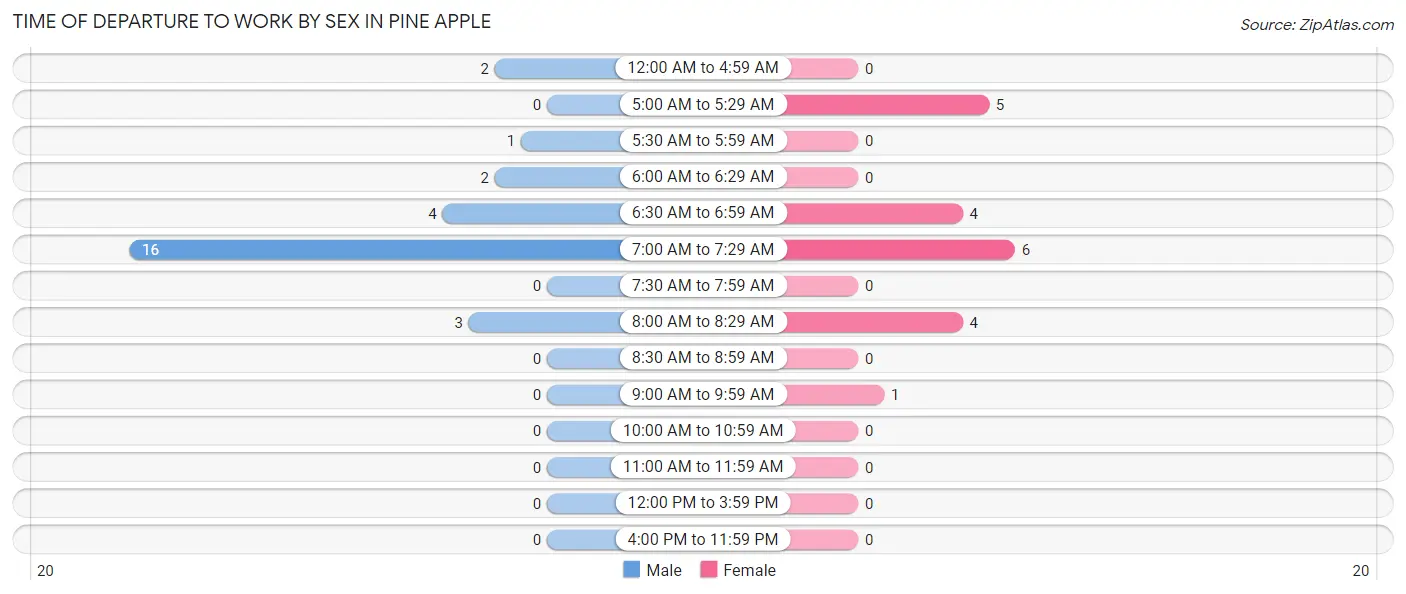
| Time of Departure | Male | Female |
| 12:00 AM to 4:59 AM | 2 (7.1%) | 0 (0.0%) |
| 5:00 AM to 5:29 AM | 0 (0.0%) | 5 (25.0%) |
| 5:30 AM to 5:59 AM | 1 (3.6%) | 0 (0.0%) |
| 6:00 AM to 6:29 AM | 2 (7.1%) | 0 (0.0%) |
| 6:30 AM to 6:59 AM | 4 (14.3%) | 4 (20.0%) |
| 7:00 AM to 7:29 AM | 16 (57.1%) | 6 (30.0%) |
| 7:30 AM to 7:59 AM | 0 (0.0%) | 0 (0.0%) |
| 8:00 AM to 8:29 AM | 3 (10.7%) | 4 (20.0%) |
| 8:30 AM to 8:59 AM | 0 (0.0%) | 0 (0.0%) |
| 9:00 AM to 9:59 AM | 0 (0.0%) | 1 (5.0%) |
| 10:00 AM to 10:59 AM | 0 (0.0%) | 0 (0.0%) |
| 11:00 AM to 11:59 AM | 0 (0.0%) | 0 (0.0%) |
| 12:00 PM to 3:59 PM | 0 (0.0%) | 0 (0.0%) |
| 4:00 PM to 11:59 PM | 0 (0.0%) | 0 (0.0%) |
| Total | 28 (100.0%) | 20 (100.0%) |
Housing Occupancy in Pine Apple
Occupancy by Ownership in Pine Apple
Of the total 83 dwellings in Pine Apple, owner-occupied units account for 77 (92.8%), while renter-occupied units make up 6 (7.2%).
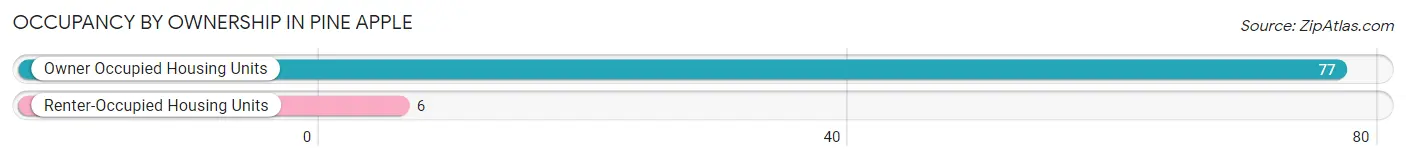
| Occupancy | # Housing Units | % Housing Units |
| Owner Occupied Housing Units | 77 | 92.8% |
| Renter-Occupied Housing Units | 6 | 7.2% |
| Total Occupied Housing Units | 83 | 100.0% |
Occupancy by Household Size in Pine Apple
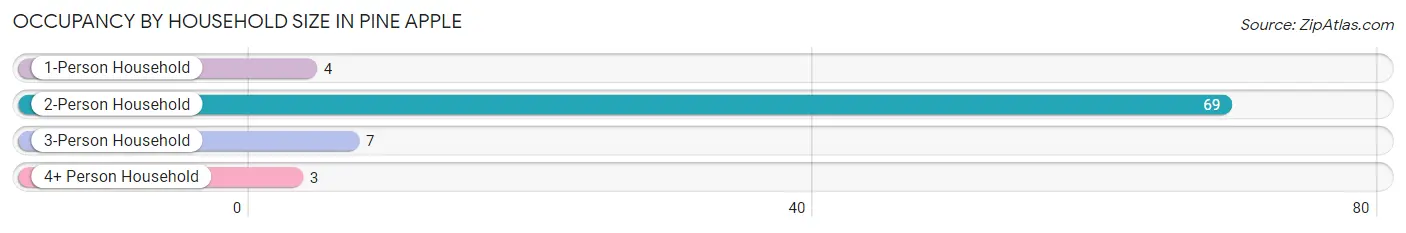
| Household Size | # Housing Units | % Housing Units |
| 1-Person Household | 4 | 4.8% |
| 2-Person Household | 69 | 83.1% |
| 3-Person Household | 7 | 8.4% |
| 4+ Person Household | 3 | 3.6% |
| Total Housing Units | 83 | 100.0% |
Occupancy by Ownership by Household Size in Pine Apple
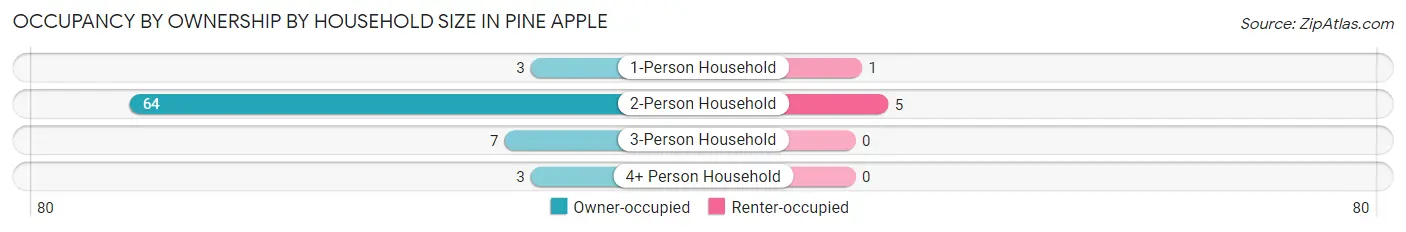
| Household Size | Owner-occupied | Renter-occupied |
| 1-Person Household | 3 (75.0%) | 1 (25.0%) |
| 2-Person Household | 64 (92.7%) | 5 (7.2%) |
| 3-Person Household | 7 (100.0%) | 0 (0.0%) |
| 4+ Person Household | 3 (100.0%) | 0 (0.0%) |
| Total Housing Units | 77 (92.8%) | 6 (7.2%) |
Occupancy by Educational Attainment in Pine Apple
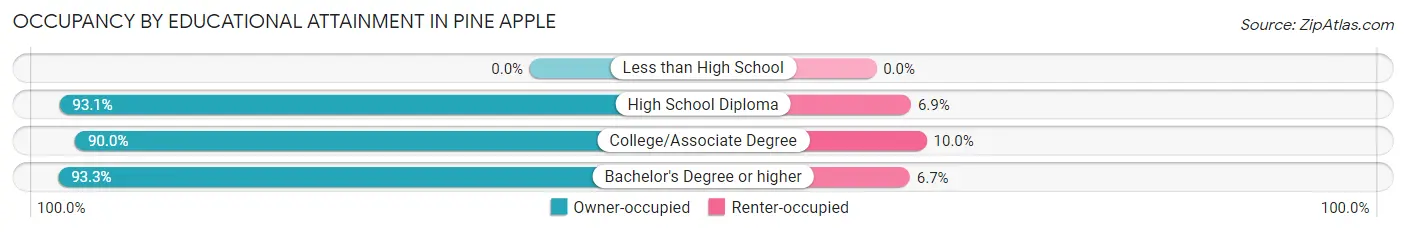
| Household Size | Owner-occupied | Renter-occupied |
| Less than High School | 0 (0.0%) | 0 (0.0%) |
| High School Diploma | 54 (93.1%) | 4 (6.9%) |
| College/Associate Degree | 9 (90.0%) | 1 (10.0%) |
| Bachelor's Degree or higher | 14 (93.3%) | 1 (6.7%) |
Occupancy by Age of Householder in Pine Apple
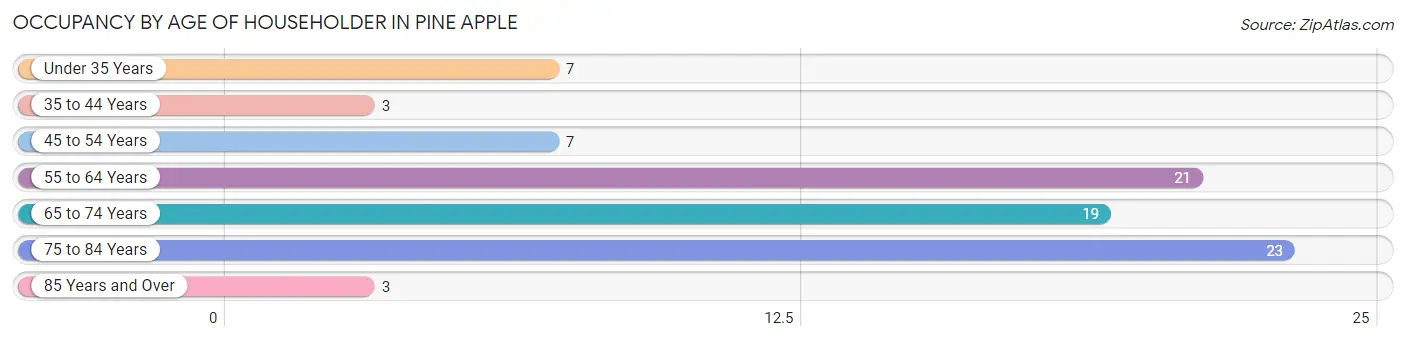
| Age Bracket | # Households | % Households |
| Under 35 Years | 7 | 8.4% |
| 35 to 44 Years | 3 | 3.6% |
| 45 to 54 Years | 7 | 8.4% |
| 55 to 64 Years | 21 | 25.3% |
| 65 to 74 Years | 19 | 22.9% |
| 75 to 84 Years | 23 | 27.7% |
| 85 Years and Over | 3 | 3.6% |
| Total | 83 | 100.0% |
Housing Finances in Pine Apple
Median Income by Occupancy in Pine Apple
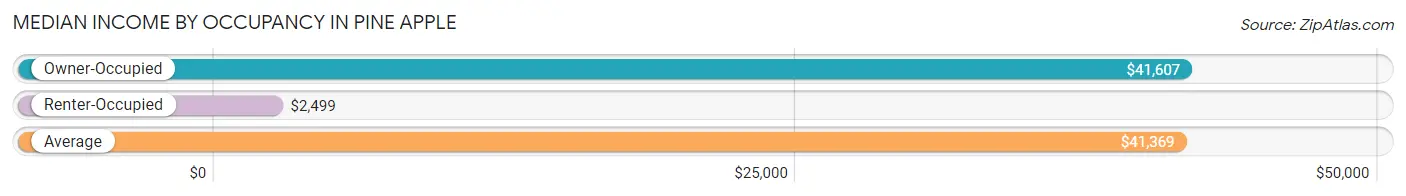
| Occupancy Type | # Households | Median Income |
| Owner-Occupied | 77 (92.8%) | $41,607 |
| Renter-Occupied | 6 (7.2%) | $2,499 |
| Average | 83 (100.0%) | $41,369 |
Occupancy by Householder Income Bracket in Pine Apple
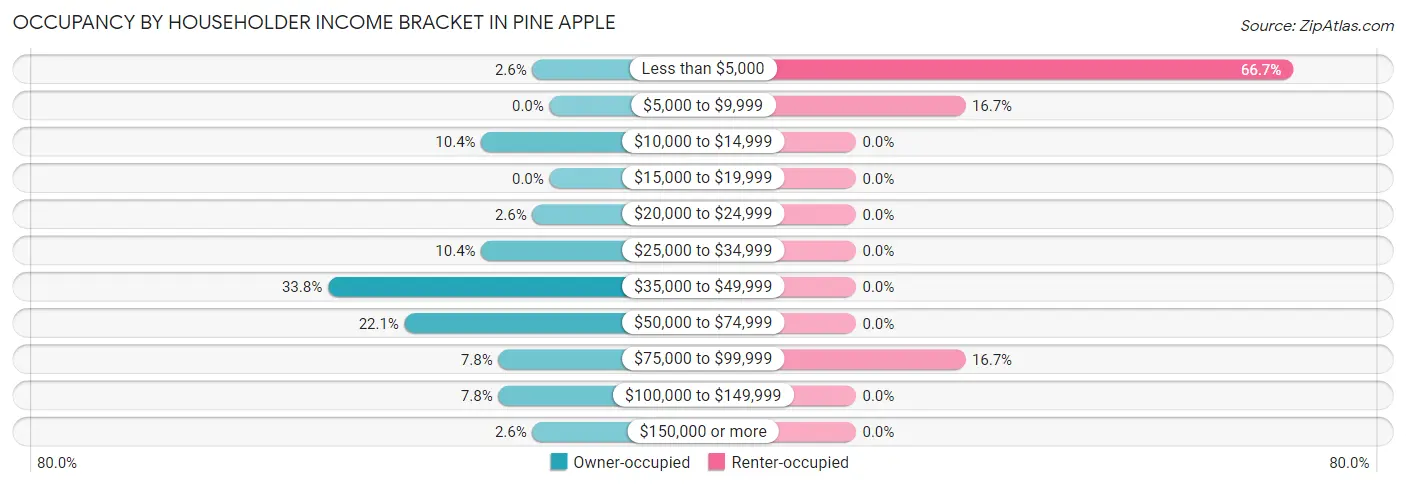
| Income Bracket | Owner-occupied | Renter-occupied |
| Less than $5,000 | 2 (2.6%) | 4 (66.7%) |
| $5,000 to $9,999 | 0 (0.0%) | 1 (16.7%) |
| $10,000 to $14,999 | 8 (10.4%) | 0 (0.0%) |
| $15,000 to $19,999 | 0 (0.0%) | 0 (0.0%) |
| $20,000 to $24,999 | 2 (2.6%) | 0 (0.0%) |
| $25,000 to $34,999 | 8 (10.4%) | 0 (0.0%) |
| $35,000 to $49,999 | 26 (33.8%) | 0 (0.0%) |
| $50,000 to $74,999 | 17 (22.1%) | 0 (0.0%) |
| $75,000 to $99,999 | 6 (7.8%) | 1 (16.7%) |
| $100,000 to $149,999 | 6 (7.8%) | 0 (0.0%) |
| $150,000 or more | 2 (2.6%) | 0 (0.0%) |
| Total | 77 (100.0%) | 6 (100.0%) |
Monthly Housing Cost Tiers in Pine Apple
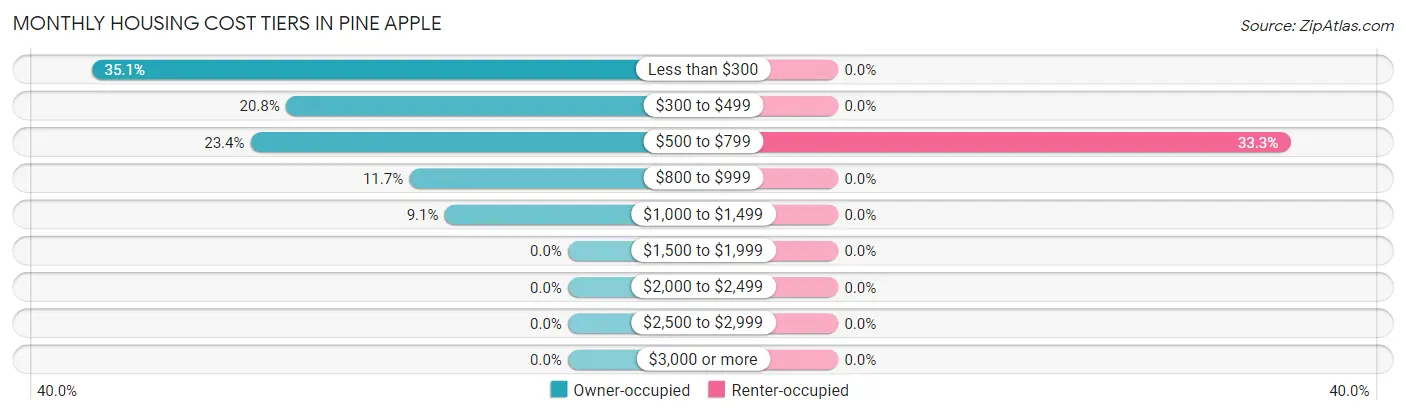
| Monthly Cost | Owner-occupied | Renter-occupied |
| Less than $300 | 27 (35.1%) | 0 (0.0%) |
| $300 to $499 | 16 (20.8%) | 0 (0.0%) |
| $500 to $799 | 18 (23.4%) | 2 (33.3%) |
| $800 to $999 | 9 (11.7%) | 0 (0.0%) |
| $1,000 to $1,499 | 7 (9.1%) | 0 (0.0%) |
| $1,500 to $1,999 | 0 (0.0%) | 0 (0.0%) |
| $2,000 to $2,499 | 0 (0.0%) | 0 (0.0%) |
| $2,500 to $2,999 | 0 (0.0%) | 0 (0.0%) |
| $3,000 or more | 0 (0.0%) | 0 (0.0%) |
| Total | 77 (100.0%) | 6 (100.0%) |
Physical Housing Characteristics in Pine Apple
Housing Structures in Pine Apple
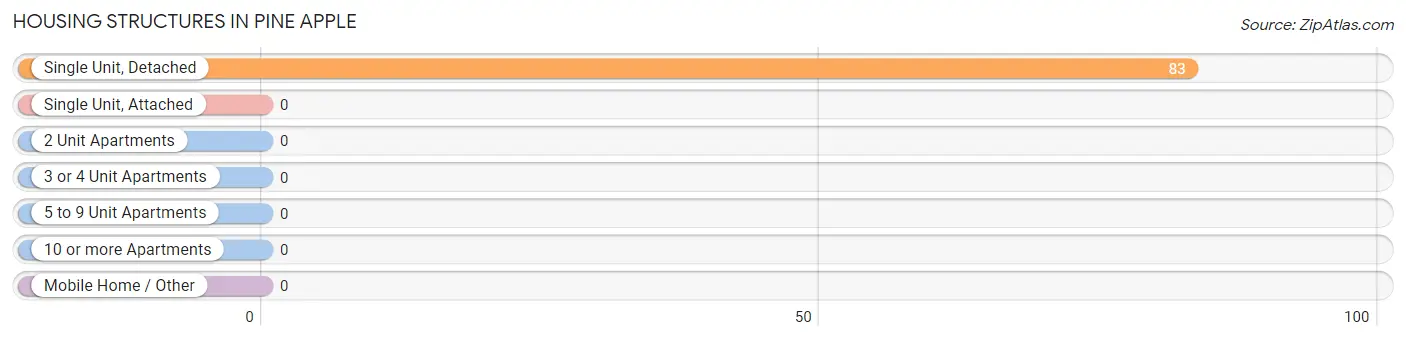
| Structure Type | # Housing Units | % Housing Units |
| Single Unit, Detached | 83 | 100.0% |
| Single Unit, Attached | 0 | 0.0% |
| 2 Unit Apartments | 0 | 0.0% |
| 3 or 4 Unit Apartments | 0 | 0.0% |
| 5 to 9 Unit Apartments | 0 | 0.0% |
| 10 or more Apartments | 0 | 0.0% |
| Mobile Home / Other | 0 | 0.0% |
| Total | 83 | 100.0% |
Housing Structures by Occupancy in Pine Apple
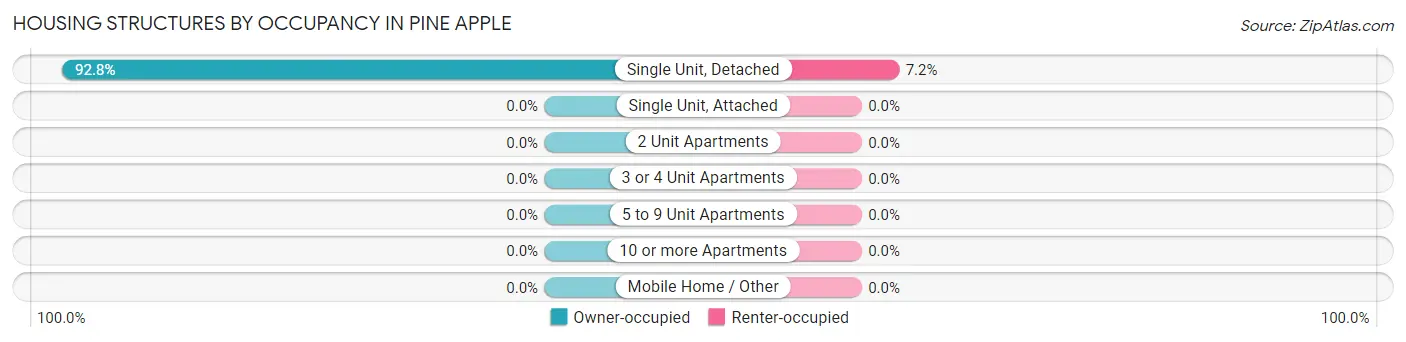
| Structure Type | Owner-occupied | Renter-occupied |
| Single Unit, Detached | 77 (92.8%) | 6 (7.2%) |
| Single Unit, Attached | 0 (0.0%) | 0 (0.0%) |
| 2 Unit Apartments | 0 (0.0%) | 0 (0.0%) |
| 3 or 4 Unit Apartments | 0 (0.0%) | 0 (0.0%) |
| 5 to 9 Unit Apartments | 0 (0.0%) | 0 (0.0%) |
| 10 or more Apartments | 0 (0.0%) | 0 (0.0%) |
| Mobile Home / Other | 0 (0.0%) | 0 (0.0%) |
| Total | 77 (92.8%) | 6 (7.2%) |
Housing Structures by Number of Rooms in Pine Apple
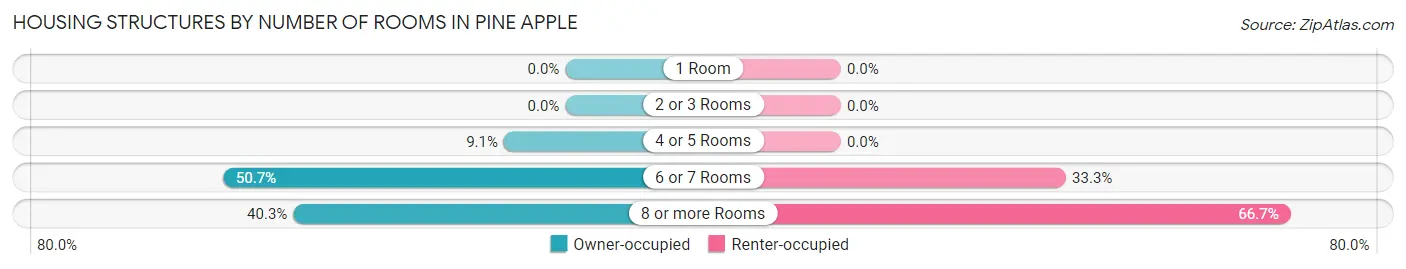
| Number of Rooms | Owner-occupied | Renter-occupied |
| 1 Room | 0 (0.0%) | 0 (0.0%) |
| 2 or 3 Rooms | 0 (0.0%) | 0 (0.0%) |
| 4 or 5 Rooms | 7 (9.1%) | 0 (0.0%) |
| 6 or 7 Rooms | 39 (50.6%) | 2 (33.3%) |
| 8 or more Rooms | 31 (40.3%) | 4 (66.7%) |
| Total | 77 (100.0%) | 6 (100.0%) |
Housing Structure by Heating Type in Pine Apple
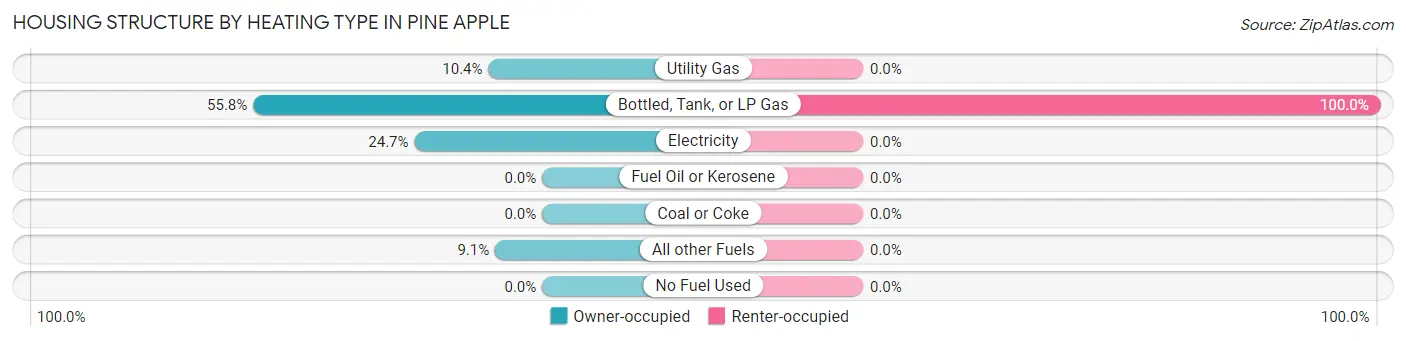
| Heating Type | Owner-occupied | Renter-occupied |
| Utility Gas | 8 (10.4%) | 0 (0.0%) |
| Bottled, Tank, or LP Gas | 43 (55.8%) | 6 (100.0%) |
| Electricity | 19 (24.7%) | 0 (0.0%) |
| Fuel Oil or Kerosene | 0 (0.0%) | 0 (0.0%) |
| Coal or Coke | 0 (0.0%) | 0 (0.0%) |
| All other Fuels | 7 (9.1%) | 0 (0.0%) |
| No Fuel Used | 0 (0.0%) | 0 (0.0%) |
| Total | 77 (100.0%) | 6 (100.0%) |
Household Vehicle Usage in Pine Apple
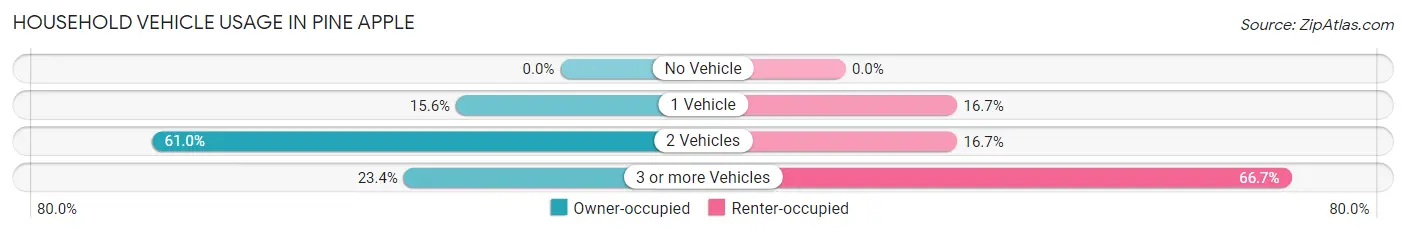
| Vehicles per Household | Owner-occupied | Renter-occupied |
| No Vehicle | 0 (0.0%) | 0 (0.0%) |
| 1 Vehicle | 12 (15.6%) | 1 (16.7%) |
| 2 Vehicles | 47 (61.0%) | 1 (16.7%) |
| 3 or more Vehicles | 18 (23.4%) | 4 (66.7%) |
| Total | 77 (100.0%) | 6 (100.0%) |
Real Estate & Mortgages in Pine Apple
Real Estate and Mortgage Overview in Pine Apple
| Characteristic | Without Mortgage | With Mortgage |
| Housing Units | 64 | 13 |
| Median Property Value | $99,000 | $112,500 |
| Median Household Income | $40,833 | $2 |
| Monthly Housing Costs | $415 | $0 |
| Real Estate Taxes | $199 | $0 |
Property Value by Mortgage Status in Pine Apple
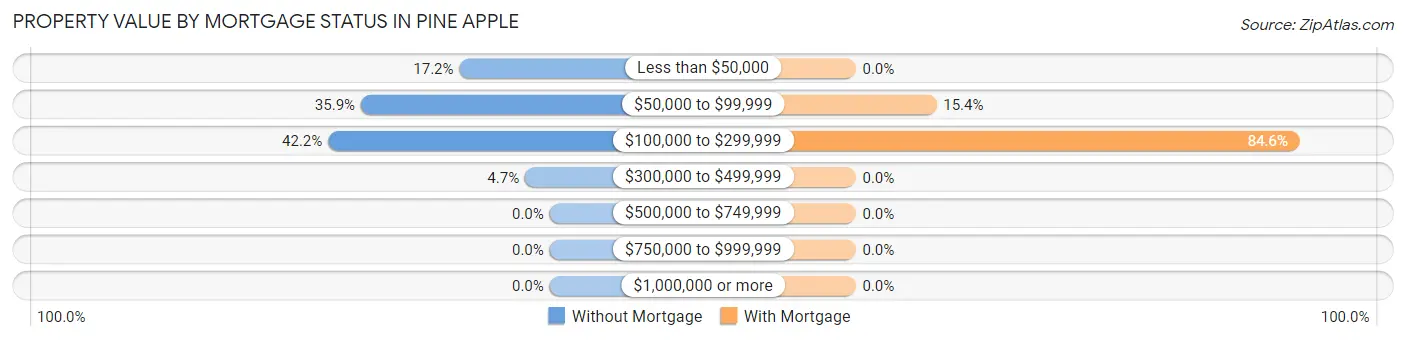
| Property Value | Without Mortgage | With Mortgage |
| Less than $50,000 | 11 (17.2%) | 0 (0.0%) |
| $50,000 to $99,999 | 23 (35.9%) | 2 (15.4%) |
| $100,000 to $299,999 | 27 (42.2%) | 11 (84.6%) |
| $300,000 to $499,999 | 3 (4.7%) | 0 (0.0%) |
| $500,000 to $749,999 | 0 (0.0%) | 0 (0.0%) |
| $750,000 to $999,999 | 0 (0.0%) | 0 (0.0%) |
| $1,000,000 or more | 0 (0.0%) | 0 (0.0%) |
| Total | 64 (100.0%) | 13 (100.0%) |
Household Income by Mortgage Status in Pine Apple
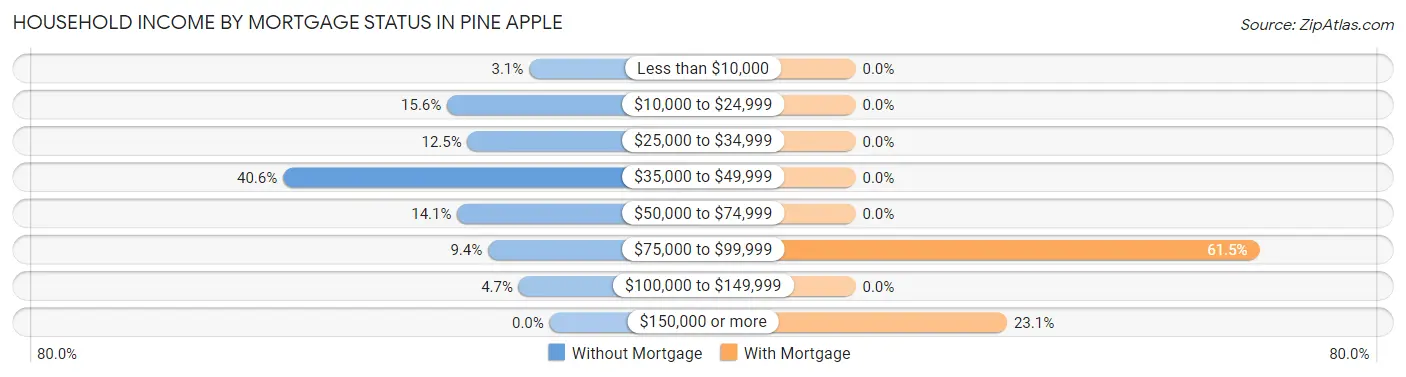
| Household Income | Without Mortgage | With Mortgage |
| Less than $10,000 | 2 (3.1%) | 0 (0.0%) |
| $10,000 to $24,999 | 10 (15.6%) | 0 (0.0%) |
| $25,000 to $34,999 | 8 (12.5%) | 0 (0.0%) |
| $35,000 to $49,999 | 26 (40.6%) | 0 (0.0%) |
| $50,000 to $74,999 | 9 (14.1%) | 0 (0.0%) |
| $75,000 to $99,999 | 6 (9.4%) | 8 (61.5%) |
| $100,000 to $149,999 | 3 (4.7%) | 0 (0.0%) |
| $150,000 or more | 0 (0.0%) | 3 (23.1%) |
| Total | 64 (100.0%) | 13 (100.0%) |
Property Value to Household Income Ratio in Pine Apple
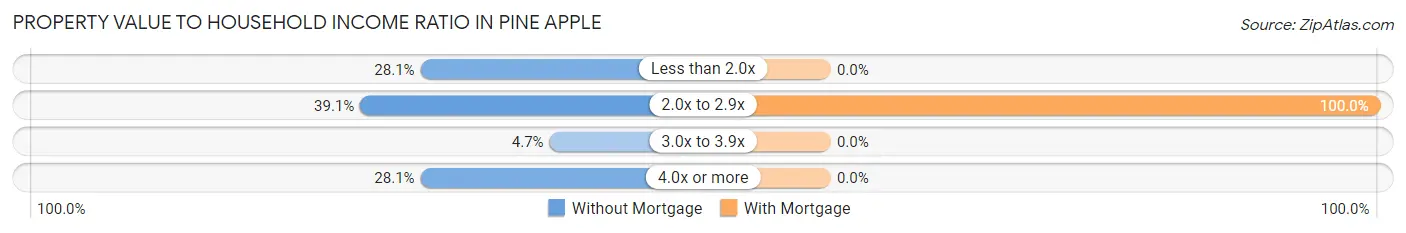
| Value-to-Income Ratio | Without Mortgage | With Mortgage |
| Less than 2.0x | 18 (28.1%) | 0 (0.0%) |
| 2.0x to 2.9x | 25 (39.1%) | 13 (100.0%) |
| 3.0x to 3.9x | 3 (4.7%) | 0 (0.0%) |
| 4.0x or more | 18 (28.1%) | 0 (0.0%) |
| Total | 64 (100.0%) | 13 (100.0%) |
Real Estate Taxes by Mortgage Status in Pine Apple
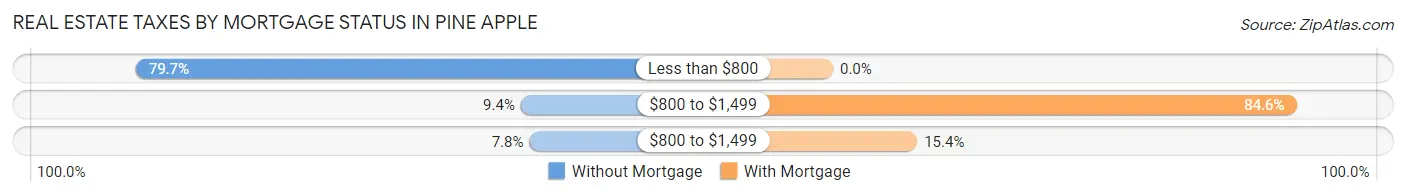
| Property Taxes | Without Mortgage | With Mortgage |
| Less than $800 | 51 (79.7%) | 0 (0.0%) |
| $800 to $1,499 | 6 (9.4%) | 11 (84.6%) |
| $800 to $1,499 | 5 (7.8%) | 2 (15.4%) |
| Total | 64 (100.0%) | 13 (100.0%) |
Health & Disability in Pine Apple
Health Insurance Coverage by Age in Pine Apple
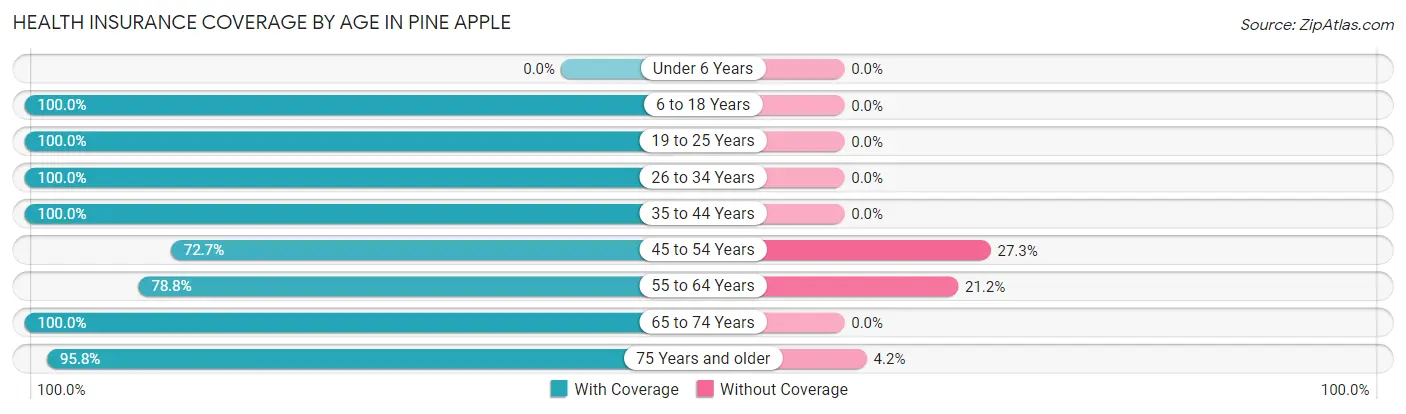
| Age Bracket | With Coverage | Without Coverage |
| Under 6 Years | 0 (0.0%) | 0 (0.0%) |
| 6 to 18 Years | 9 (100.0%) | 0 (0.0%) |
| 19 to 25 Years | 7 (100.0%) | 0 (0.0%) |
| 26 to 34 Years | 22 (100.0%) | 0 (0.0%) |
| 35 to 44 Years | 5 (100.0%) | 0 (0.0%) |
| 45 to 54 Years | 8 (72.7%) | 3 (27.3%) |
| 55 to 64 Years | 26 (78.8%) | 7 (21.2%) |
| 65 to 74 Years | 27 (100.0%) | 0 (0.0%) |
| 75 Years and older | 46 (95.8%) | 2 (4.2%) |
| Total | 150 (92.6%) | 12 (7.4%) |
Health Insurance Coverage by Citizenship Status in Pine Apple
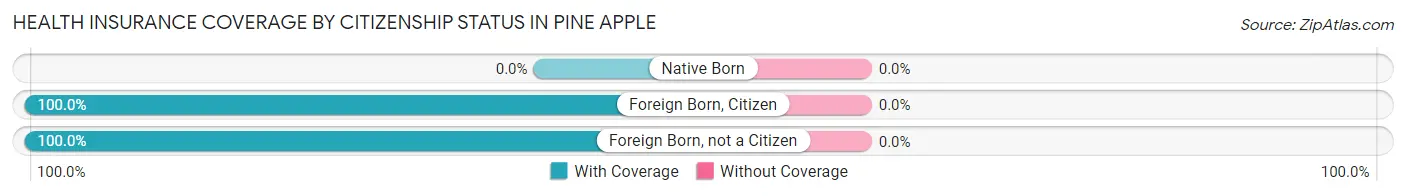
| Citizenship Status | With Coverage | Without Coverage |
| Native Born | 0 (0.0%) | 0 (0.0%) |
| Foreign Born, Citizen | 9 (100.0%) | 0 (0.0%) |
| Foreign Born, not a Citizen | 7 (100.0%) | 0 (0.0%) |
Health Insurance Coverage by Household Income in Pine Apple
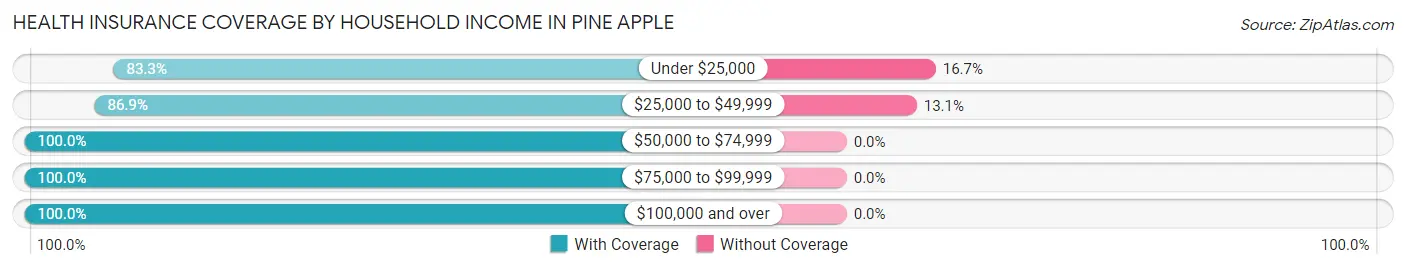
| Household Income | With Coverage | Without Coverage |
| Under $25,000 | 20 (83.3%) | 4 (16.7%) |
| $25,000 to $49,999 | 53 (86.9%) | 8 (13.1%) |
| $50,000 to $74,999 | 41 (100.0%) | 0 (0.0%) |
| $75,000 to $99,999 | 20 (100.0%) | 0 (0.0%) |
| $100,000 and over | 16 (100.0%) | 0 (0.0%) |
Public vs Private Health Insurance Coverage by Age in Pine Apple
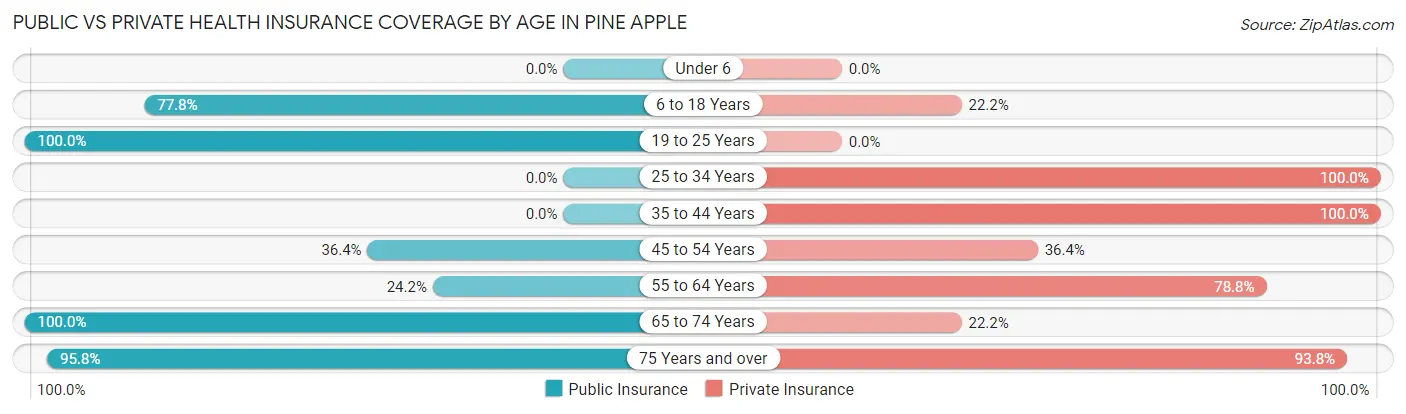
| Age Bracket | Public Insurance | Private Insurance |
| Under 6 | 0 (0.0%) | 0 (0.0%) |
| 6 to 18 Years | 7 (77.8%) | 2 (22.2%) |
| 19 to 25 Years | 7 (100.0%) | 0 (0.0%) |
| 25 to 34 Years | 0 (0.0%) | 22 (100.0%) |
| 35 to 44 Years | 0 (0.0%) | 5 (100.0%) |
| 45 to 54 Years | 4 (36.4%) | 4 (36.4%) |
| 55 to 64 Years | 8 (24.2%) | 26 (78.8%) |
| 65 to 74 Years | 27 (100.0%) | 6 (22.2%) |
| 75 Years and over | 46 (95.8%) | 45 (93.8%) |
| Total | 99 (61.1%) | 110 (67.9%) |
Disability Status by Sex by Age in Pine Apple
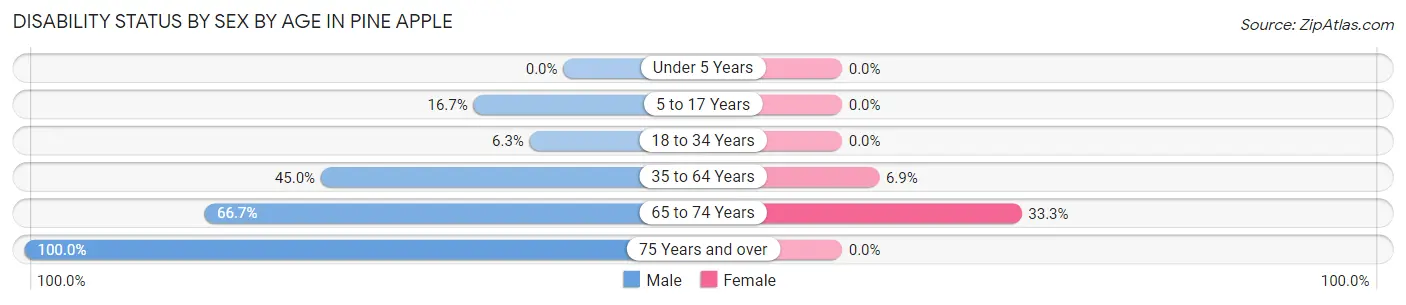
| Age Bracket | Male | Female |
| Under 5 Years | 0 (0.0%) | 0 (0.0%) |
| 5 to 17 Years | 1 (16.7%) | 0 (0.0%) |
| 18 to 34 Years | 1 (6.2%) | 0 (0.0%) |
| 35 to 64 Years | 9 (45.0%) | 2 (6.9%) |
| 65 to 74 Years | 6 (66.7%) | 6 (33.3%) |
| 75 Years and over | 32 (100.0%) | 0 (0.0%) |
Disability Class by Sex by Age in Pine Apple
Disability Class: Hearing Difficulty
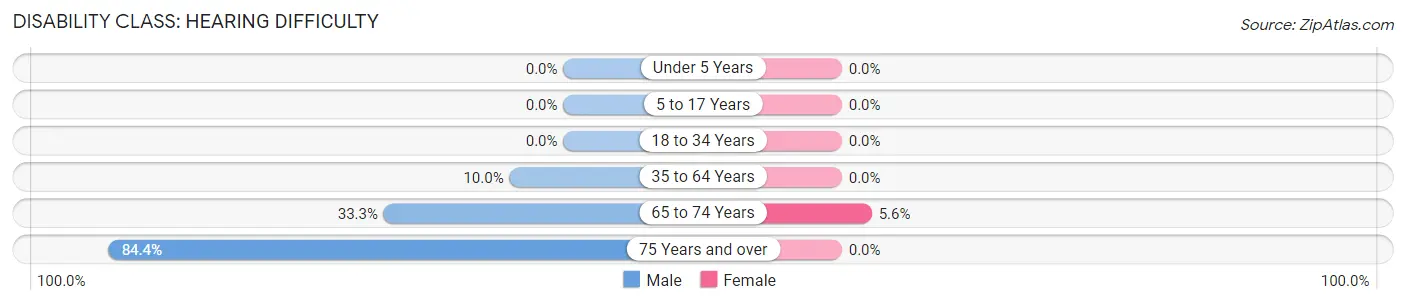
| Age Bracket | Male | Female |
| Under 5 Years | 0 (0.0%) | 0 (0.0%) |
| 5 to 17 Years | 0 (0.0%) | 0 (0.0%) |
| 18 to 34 Years | 0 (0.0%) | 0 (0.0%) |
| 35 to 64 Years | 2 (10.0%) | 0 (0.0%) |
| 65 to 74 Years | 3 (33.3%) | 1 (5.6%) |
| 75 Years and over | 27 (84.4%) | 0 (0.0%) |
Disability Class: Vision Difficulty
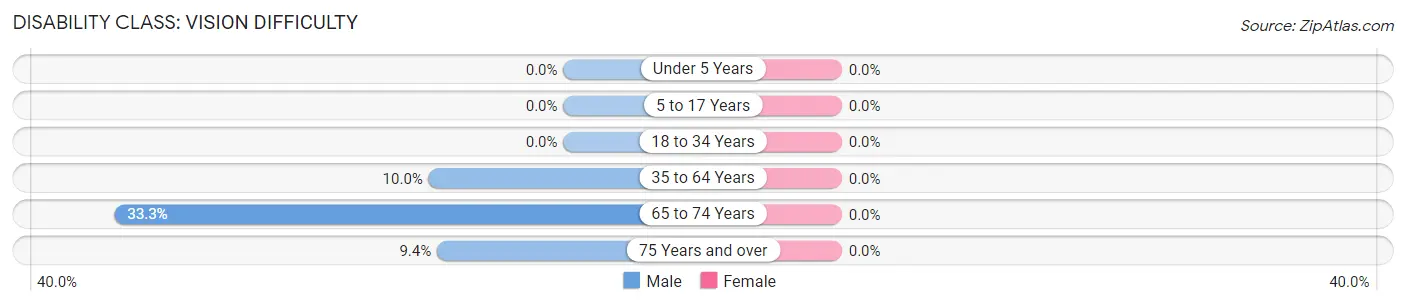
| Age Bracket | Male | Female |
| Under 5 Years | 0 (0.0%) | 0 (0.0%) |
| 5 to 17 Years | 0 (0.0%) | 0 (0.0%) |
| 18 to 34 Years | 0 (0.0%) | 0 (0.0%) |
| 35 to 64 Years | 2 (10.0%) | 0 (0.0%) |
| 65 to 74 Years | 3 (33.3%) | 0 (0.0%) |
| 75 Years and over | 3 (9.4%) | 0 (0.0%) |
Disability Class: Cognitive Difficulty
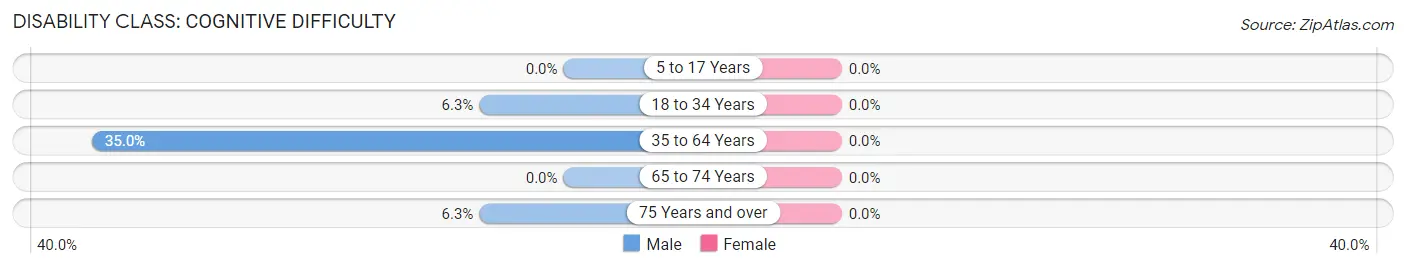
| Age Bracket | Male | Female |
| 5 to 17 Years | 0 (0.0%) | 0 (0.0%) |
| 18 to 34 Years | 1 (6.2%) | 0 (0.0%) |
| 35 to 64 Years | 7 (35.0%) | 0 (0.0%) |
| 65 to 74 Years | 0 (0.0%) | 0 (0.0%) |
| 75 Years and over | 2 (6.2%) | 0 (0.0%) |
Disability Class: Ambulatory Difficulty
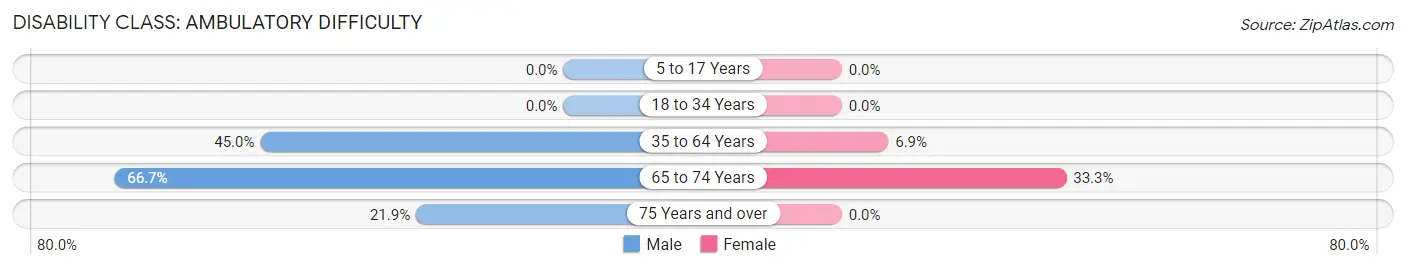
| Age Bracket | Male | Female |
| 5 to 17 Years | 0 (0.0%) | 0 (0.0%) |
| 18 to 34 Years | 0 (0.0%) | 0 (0.0%) |
| 35 to 64 Years | 9 (45.0%) | 2 (6.9%) |
| 65 to 74 Years | 6 (66.7%) | 6 (33.3%) |
| 75 Years and over | 7 (21.9%) | 0 (0.0%) |
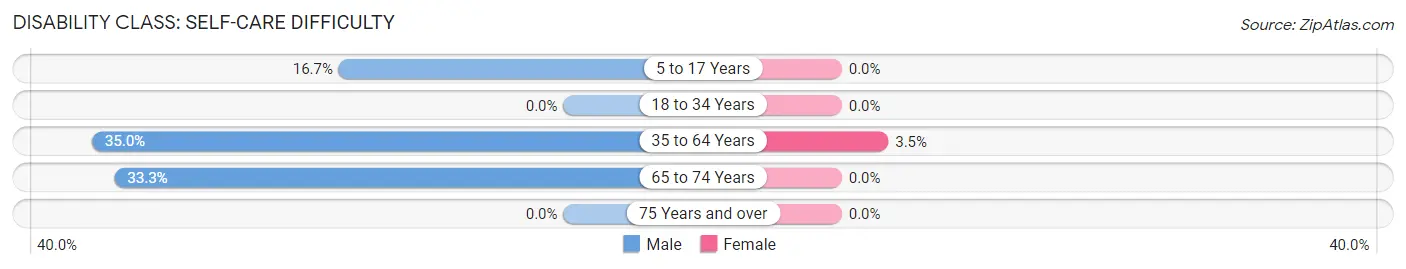
Disability Class: Self-Care Difficulty
| Age Bracket | Male | Female |
| 5 to 17 Years | 1 (16.7%) | 0 (0.0%) |
| 18 to 34 Years | 0 (0.0%) | 0 (0.0%) |
| 35 to 64 Years | 7 (35.0%) | 1 (3.5%) |
| 65 to 74 Years | 3 (33.3%) | 0 (0.0%) |
| 75 Years and over | 0 (0.0%) | 0 (0.0%) |
Technology Access in Pine Apple
Computing Device Access in Pine Apple
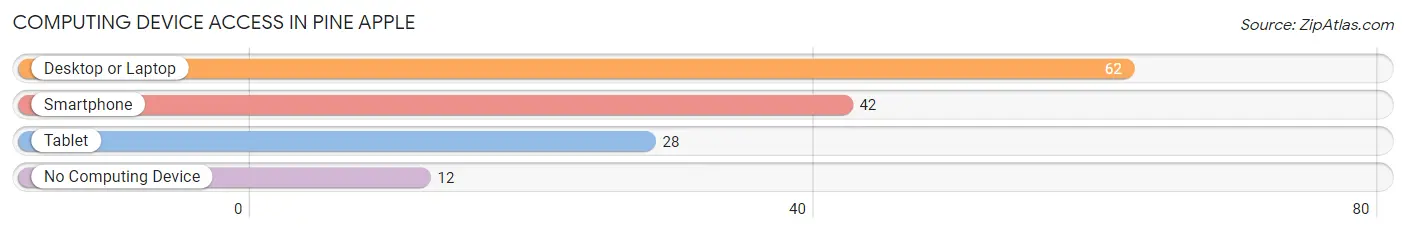
| Device Type | # Households | % Households |
| Desktop or Laptop | 62 | 74.7% |
| Smartphone | 42 | 50.6% |
| Tablet | 28 | 33.7% |
| No Computing Device | 12 | 14.5% |
| Total | 83 | 100.0% |
Internet Access in Pine Apple
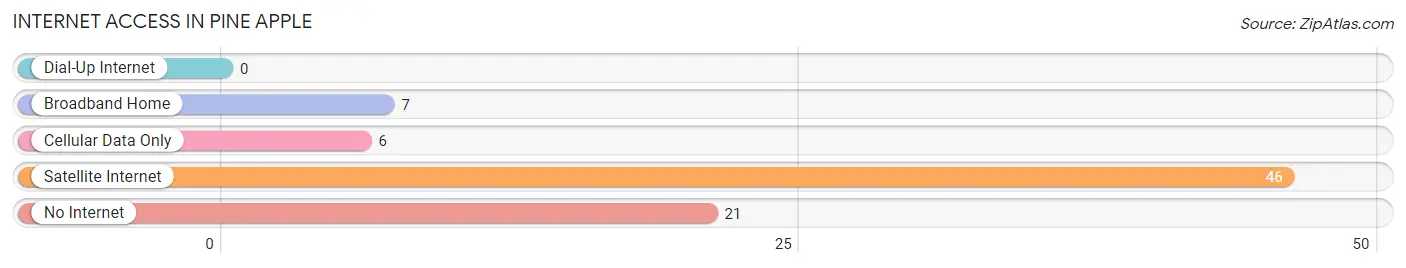
| Internet Type | # Households | % Households |
| Dial-Up Internet | 0 | 0.0% |
| Broadband Home | 7 | 8.4% |
| Cellular Data Only | 6 | 7.2% |
| Satellite Internet | 46 | 55.4% |
| No Internet | 21 | 25.3% |
| Total | 83 | 100.0% |
Pine Apple Summary
Pine Apple is a small town located in Wilcox County, Alabama. It is situated in the southwestern part of the state, approximately 40 miles south of Montgomery. The town has a population of 1,072 people, according to the 2010 census.
Geography
Pine Apple is located in the southwestern part of Wilcox County, Alabama. It is situated at the intersection of U.S. Route 80 and Alabama State Route 10. The town is located in the Coastal Plain region of the state, and is surrounded by rolling hills and forests. The town is located approximately 40 miles south of Montgomery, the state capital.
Climate
Pine Apple has a humid subtropical climate, with hot, humid summers and mild winters. The average annual temperature is around 68°F, with an average high of around 90°F in the summer and an average low of around 40°F in the winter. The town receives an average of around 50 inches of precipitation per year, with most of it falling in the summer months.
Demographics
According to the 2010 census, Pine Apple had a population of 1,072 people. The racial makeup of the town was 79.2% White, 19.2% African American, 0.3% Native American, 0.2% Asian, 0.1% Pacific Islander, and 0.9% from other races. Hispanic or Latino of any race were 1.2% of the population.
Economy
Pine Apple is a small, rural town, and the economy is largely based on agriculture. The town is home to several farms, which produce a variety of crops, including cotton, corn, soybeans, and peanuts. The town also has a few small businesses, including a grocery store, a hardware store, and a few restaurants.
History
Pine Apple was founded in 1845 by a group of settlers from Georgia. The town was named after the abundance of pine trees in the area. The town grew slowly over the years, and by the early 1900s, it had become a thriving agricultural community. The town was incorporated in 1908, and the first mayor was elected in 1909.
In the early 20th century, Pine Apple was a major producer of cotton, and the town had several cotton gins and warehouses. The town also had a number of small businesses, including a grocery store, a hardware store, and a few restaurants.
In the late 20th century, the town began to decline as the cotton industry declined and many of the businesses closed. However, the town has seen a resurgence in recent years, with the opening of several new businesses and the restoration of some of the historic buildings.
Common Questions
What is Per Capita Income in Pine Apple?
Per Capita income in Pine Apple is $27,002.
What is the Median Family Income in Pine Apple?
Median Family Income in Pine Apple is $41,071.
What is the Median Household income in Pine Apple?
Median Household Income in Pine Apple is $41,369.
What is Inequality or Gini Index in Pine Apple?
Inequality or Gini Index in Pine Apple is 0.39.
What is the Total Population of Pine Apple?
Total Population of Pine Apple is 162.
What is the Total Male Population of Pine Apple?
Total Male Population of Pine Apple is 83.
What is the Total Female Population of Pine Apple?
Total Female Population of Pine Apple is 79.
What is the Ratio of Males per 100 Females in Pine Apple?
There are 105.06 Males per 100 Females in Pine Apple.
What is the Ratio of Females per 100 Males in Pine Apple?
There are 95.18 Females per 100 Males in Pine Apple.
What is the Median Population Age in Pine Apple?
Median Population Age in Pine Apple is 63.0 Years.
What is the Average Family Size in Pine Apple
Average Family Size in Pine Apple is 1.9 People.
What is the Average Household Size in Pine Apple
Average Household Size in Pine Apple is 1.9 People.
How Large is the Labor Force in Pine Apple?
There are 48 People in the Labor Forcein in Pine Apple.
What is the Percentage of People in the Labor Force in Pine Apple?
30.8% of People are in the Labor Force in Pine Apple.