Paint Rock, AL Map & Demographics
Paint Rock Map
Paint Rock Overview
$44,357
PER CAPITA INCOME
$57,500
AVG FAMILY INCOME
$59,583
AVG HOUSEHOLD INCOME
39.3%
WAGE / INCOME GAP [ % ]
60.7¢/ $1
WAGE / INCOME GAP [ $ ]
0.55
INEQUALITY / GINI INDEX
208
TOTAL POPULATION
109
MALE POPULATION
99
FEMALE POPULATION
110.10
MALES / 100 FEMALES
90.83
FEMALES / 100 MALES
42.3
MEDIAN AGE
3.6
AVG FAMILY SIZE
3.0
AVG HOUSEHOLD SIZE
103
LABOR FORCE [ PEOPLE ]
60.6%
PERCENT IN LABOR FORCE
4.0%
UNEMPLOYMENT RATE
Paint Rock Zip Codes
Paint Rock Area Codes
Income in Paint Rock
Income Overview in Paint Rock
Per Capita Income in Paint Rock is $44,357, while median incomes of families and households are $57,500 and $59,583 respectively.
| Characteristic | Number | Measure |
| Per Capita Income | 208 | $44,357 |
| Median Family Income | 48 | $57,500 |
| Mean Family Income | 48 | $70,148 |
| Median Household Income | 70 | $59,583 |
| Mean Household Income | 70 | $104,301 |
| Income Deficit | 48 | $0 |
| Wage / Income Gap (%) | 208 | 39.26% |
| Wage / Income Gap ($) | 208 | 60.74¢ per $1 |
| Gini / Inequality Index | 208 | 0.55 |
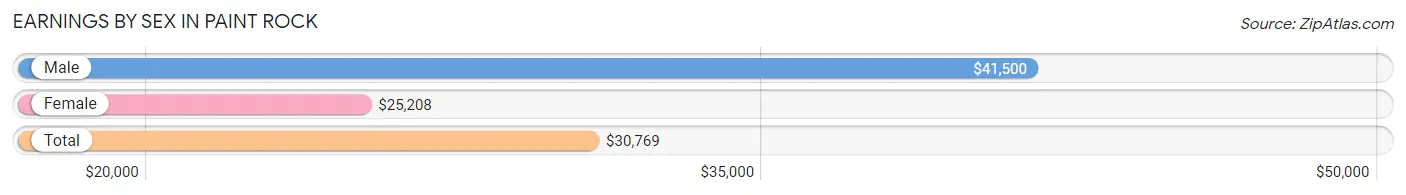
Earnings by Sex in Paint Rock
Average Earnings in Paint Rock are $30,769, $41,500 for men and $25,208 for women, a difference of 39.3%.
| Sex | Number | Average Earnings |
| Male | 70 (61.4%) | $41,500 |
| Female | 44 (38.6%) | $25,208 |
| Total | 114 (100.0%) | $30,769 |
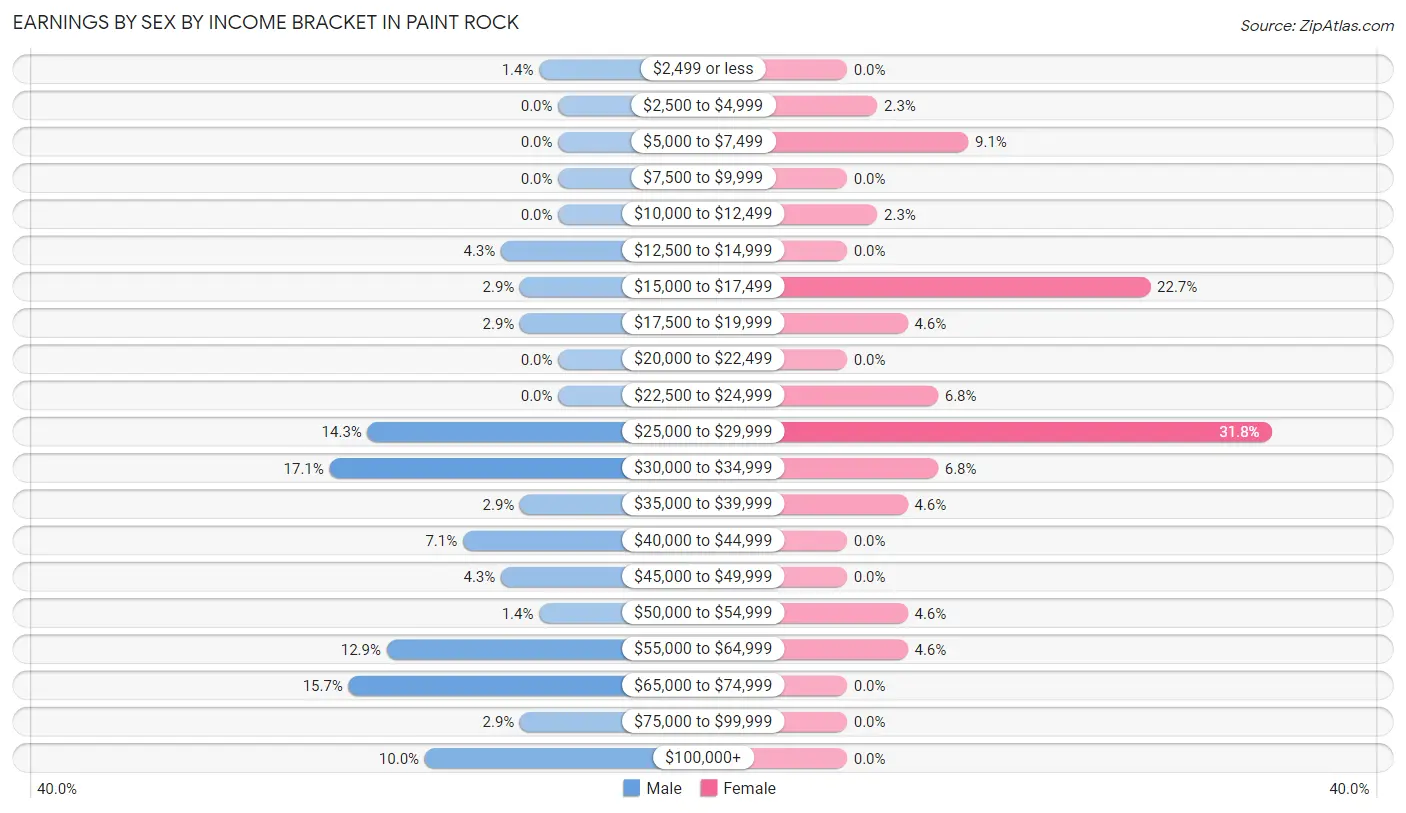
Earnings by Sex by Income Bracket in Paint Rock
The most common earnings brackets in Paint Rock are $30,000 to $34,999 for men (12 | 17.1%) and $25,000 to $29,999 for women (14 | 31.8%).
| Income | Male | Female |
| $2,499 or less | 1 (1.4%) | 0 (0.0%) |
| $2,500 to $4,999 | 0 (0.0%) | 1 (2.3%) |
| $5,000 to $7,499 | 0 (0.0%) | 4 (9.1%) |
| $7,500 to $9,999 | 0 (0.0%) | 0 (0.0%) |
| $10,000 to $12,499 | 0 (0.0%) | 1 (2.3%) |
| $12,500 to $14,999 | 3 (4.3%) | 0 (0.0%) |
| $15,000 to $17,499 | 2 (2.9%) | 10 (22.7%) |
| $17,500 to $19,999 | 2 (2.9%) | 2 (4.5%) |
| $20,000 to $22,499 | 0 (0.0%) | 0 (0.0%) |
| $22,500 to $24,999 | 0 (0.0%) | 3 (6.8%) |
| $25,000 to $29,999 | 10 (14.3%) | 14 (31.8%) |
| $30,000 to $34,999 | 12 (17.1%) | 3 (6.8%) |
| $35,000 to $39,999 | 2 (2.9%) | 2 (4.5%) |
| $40,000 to $44,999 | 5 (7.1%) | 0 (0.0%) |
| $45,000 to $49,999 | 3 (4.3%) | 0 (0.0%) |
| $50,000 to $54,999 | 1 (1.4%) | 2 (4.5%) |
| $55,000 to $64,999 | 9 (12.9%) | 2 (4.5%) |
| $65,000 to $74,999 | 11 (15.7%) | 0 (0.0%) |
| $75,000 to $99,999 | 2 (2.9%) | 0 (0.0%) |
| $100,000+ | 7 (10.0%) | 0 (0.0%) |
| Total | 70 (100.0%) | 44 (100.0%) |
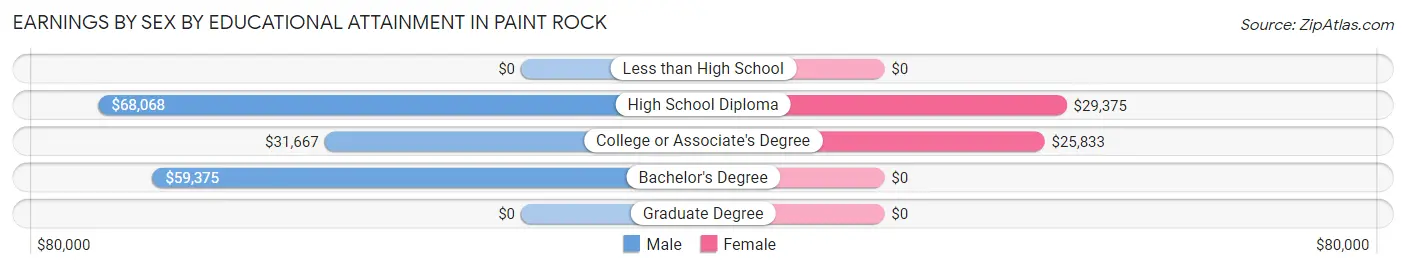
Earnings by Sex by Educational Attainment in Paint Rock
Average earnings in Paint Rock are $58,250 for men and $26,042 for women, a difference of 55.3%. Men with an educational attainment of high school diploma enjoy the highest average annual earnings of $68,068, while those with college or associate's degree education earn the least with $31,667. Women with an educational attainment of high school diploma earn the most with the average annual earnings of $29,375, while those with college or associate's degree education have the smallest earnings of $25,833.
| Educational Attainment | Male Income | Female Income |
| Less than High School | - | - |
| High School Diploma | $68,068 | $29,375 |
| College or Associate's Degree | $31,667 | $25,833 |
| Bachelor's Degree | $59,375 | $0 |
| Graduate Degree | - | - |
| Total | $58,250 | $26,042 |
Family Income in Paint Rock
Family Income Brackets in Paint Rock
According to the Paint Rock family income data, there are 12 families falling into the $50,000 to $74,999 income range, which is the most common income bracket and makes up 25.0% of all families.
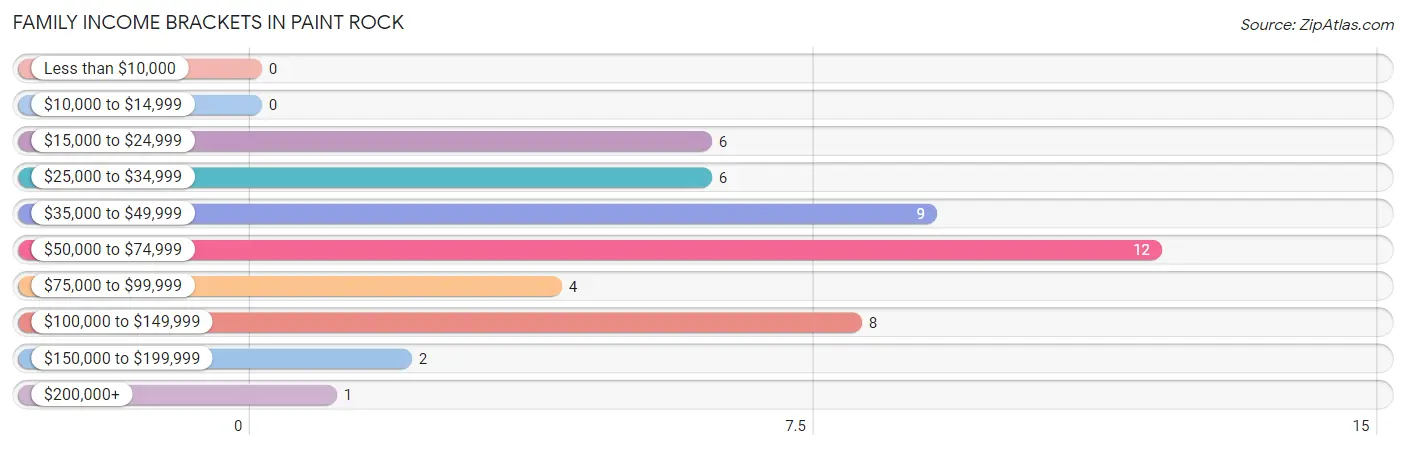
| Income Bracket | # Families | % Families |
| Less than $10,000 | 0 | 0.0% |
| $10,000 to $14,999 | 0 | 0.0% |
| $15,000 to $24,999 | 6 | 12.5% |
| $25,000 to $34,999 | 6 | 12.5% |
| $35,000 to $49,999 | 9 | 18.8% |
| $50,000 to $74,999 | 12 | 25.0% |
| $75,000 to $99,999 | 4 | 8.3% |
| $100,000 to $149,999 | 8 | 16.7% |
| $150,000 to $199,999 | 2 | 4.2% |
| $200,000+ | 1 | 2.1% |
Family Income by Famaliy Size in Paint Rock
3-person families (4 | 8.3%) account for the highest median family income in Paint Rock with $106,250 per family, while 3-person families (4 | 8.3%) have the highest median income of $35,417 per family member.
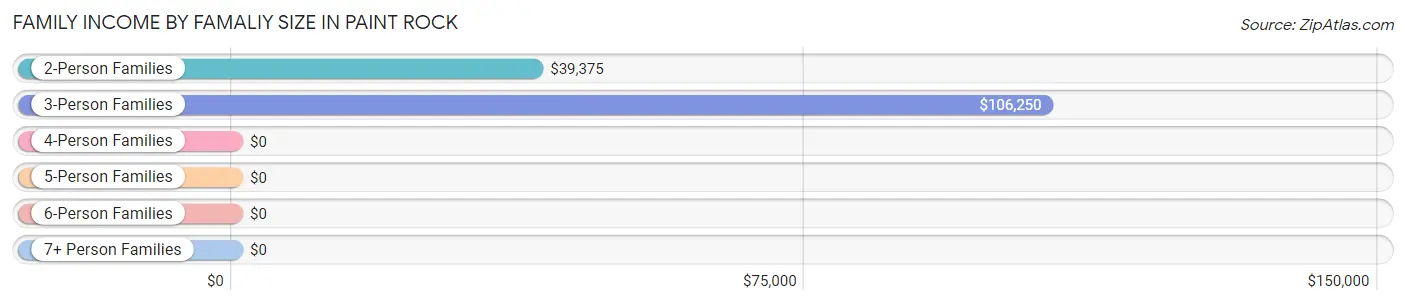
| Income Bracket | # Families | Median Income |
| 2-Person Families | 25 (52.1%) | $39,375 |
| 3-Person Families | 4 (8.3%) | $106,250 |
| 4-Person Families | 7 (14.6%) | $0 |
| 5-Person Families | 12 (25.0%) | $0 |
| 6-Person Families | 0 (0.0%) | $0 |
| 7+ Person Families | 0 (0.0%) | $0 |
| Total | 48 (100.0%) | $57,500 |
Family Income by Number of Earners in Paint Rock
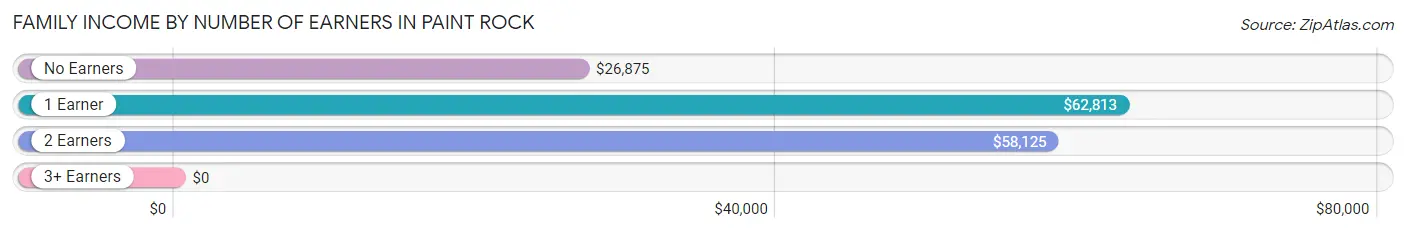
| Number of Earners | # Families | Median Income |
| No Earners | 13 (27.1%) | $26,875 |
| 1 Earner | 17 (35.4%) | $62,813 |
| 2 Earners | 11 (22.9%) | $58,125 |
| 3+ Earners | 7 (14.6%) | $0 |
| Total | 48 (100.0%) | $57,500 |
Household Income in Paint Rock
Household Income Brackets in Paint Rock
With 16 households falling in the category, the $50,000 to $74,999 income range is the most frequent in Paint Rock, accounting for 22.9% of all households. In contrast, only 1 households (1.4%) fall into the less than $10,000 income bracket, making it the least populous group.
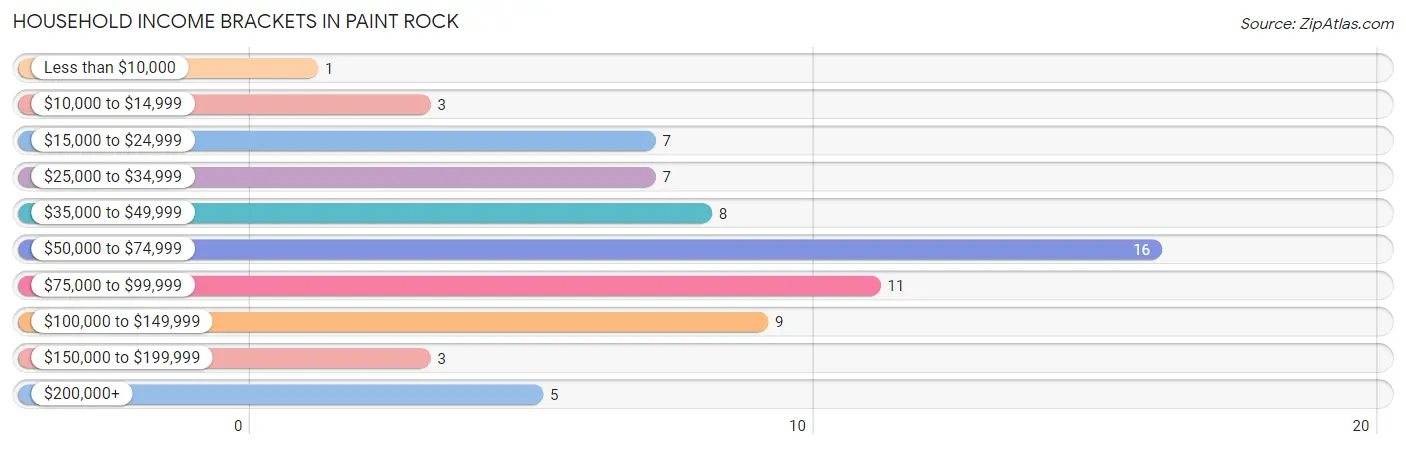
| Income Bracket | # Households | % Households |
| Less than $10,000 | 1 | 1.4% |
| $10,000 to $14,999 | 3 | 4.3% |
| $15,000 to $24,999 | 7 | 10.0% |
| $25,000 to $34,999 | 7 | 10.0% |
| $35,000 to $49,999 | 8 | 11.4% |
| $50,000 to $74,999 | 16 | 22.9% |
| $75,000 to $99,999 | 11 | 15.7% |
| $100,000 to $149,999 | 9 | 12.9% |
| $150,000 to $199,999 | 3 | 4.3% |
| $200,000+ | 5 | 7.1% |
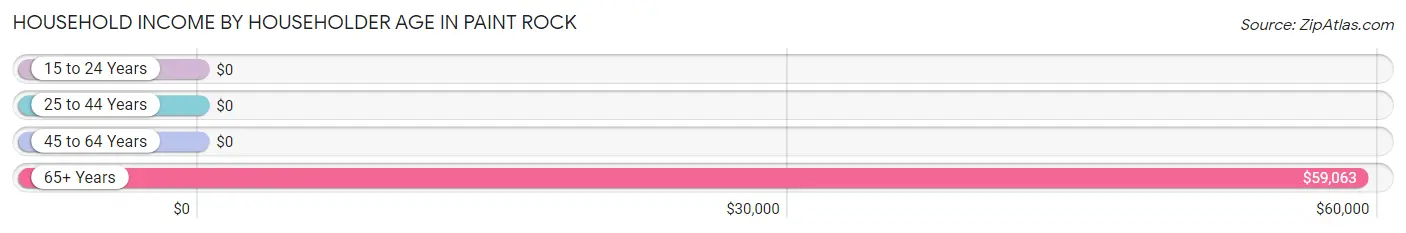
Household Income by Householder Age in Paint Rock
The median household income in Paint Rock is $59,583, with the highest median household income of $59,063 found in the 65+ years age bracket for the primary householder. A total of 25 households (35.7%) fall into this category. Meanwhile, the 15 to 24 years age bracket for the primary householder has the lowest median household income of $0, with 5 households (7.1%) in this group.
| Income Bracket | # Households | Median Income |
| 15 to 24 Years | 5 (7.1%) | $0 |
| 25 to 44 Years | 10 (14.3%) | $0 |
| 45 to 64 Years | 30 (42.9%) | $0 |
| 65+ Years | 25 (35.7%) | $59,063 |
| Total | 70 (100.0%) | $59,583 |
Poverty in Paint Rock
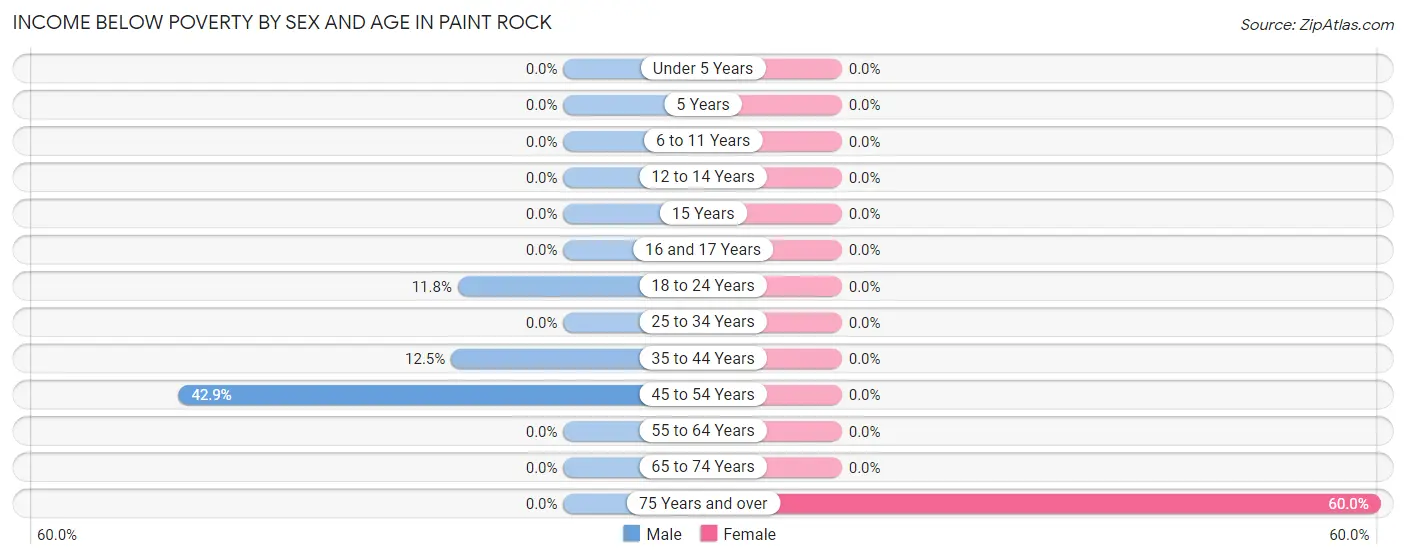
Income Below Poverty by Sex and Age in Paint Rock
With 5.5% poverty level for males and 3.1% for females among the residents of Paint Rock, 45 to 54 year old males and 75 year old and over females are the most vulnerable to poverty, with 3 males (42.9%) and 3 females (60.0%) in their respective age groups living below the poverty level.
| Age Bracket | Male | Female |
| Under 5 Years | 0 (0.0%) | 0 (0.0%) |
| 5 Years | 0 (0.0%) | 0 (0.0%) |
| 6 to 11 Years | 0 (0.0%) | 0 (0.0%) |
| 12 to 14 Years | 0 (0.0%) | 0 (0.0%) |
| 15 Years | 0 (0.0%) | 0 (0.0%) |
| 16 and 17 Years | 0 (0.0%) | 0 (0.0%) |
| 18 to 24 Years | 2 (11.8%) | 0 (0.0%) |
| 25 to 34 Years | 0 (0.0%) | 0 (0.0%) |
| 35 to 44 Years | 1 (12.5%) | 0 (0.0%) |
| 45 to 54 Years | 3 (42.9%) | 0 (0.0%) |
| 55 to 64 Years | 0 (0.0%) | 0 (0.0%) |
| 65 to 74 Years | 0 (0.0%) | 0 (0.0%) |
| 75 Years and over | 0 (0.0%) | 3 (60.0%) |
| Total | 6 (5.5%) | 3 (3.1%) |
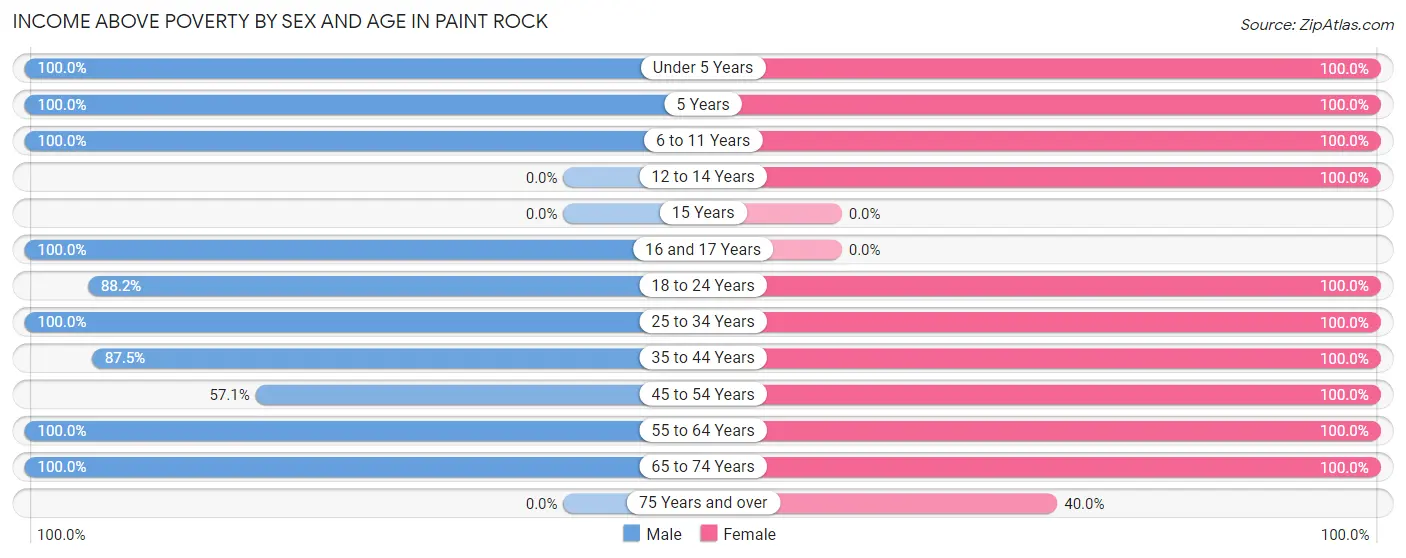
Income Above Poverty by Sex and Age in Paint Rock
According to the poverty statistics in Paint Rock, males aged under 5 years and females aged under 5 years are the age groups that are most secure financially, with 100.0% of males and 100.0% of females in these age groups living above the poverty line.
| Age Bracket | Male | Female |
| Under 5 Years | 3 (100.0%) | 11 (100.0%) |
| 5 Years | 6 (100.0%) | 2 (100.0%) |
| 6 to 11 Years | 9 (100.0%) | 3 (100.0%) |
| 12 to 14 Years | 0 (0.0%) | 2 (100.0%) |
| 15 Years | 0 (0.0%) | 0 (0.0%) |
| 16 and 17 Years | 1 (100.0%) | 0 (0.0%) |
| 18 to 24 Years | 15 (88.2%) | 14 (100.0%) |
| 25 to 34 Years | 13 (100.0%) | 2 (100.0%) |
| 35 to 44 Years | 7 (87.5%) | 21 (100.0%) |
| 45 to 54 Years | 4 (57.1%) | 4 (100.0%) |
| 55 to 64 Years | 23 (100.0%) | 25 (100.0%) |
| 65 to 74 Years | 22 (100.0%) | 8 (100.0%) |
| 75 Years and over | 0 (0.0%) | 2 (40.0%) |
| Total | 103 (94.5%) | 94 (96.9%) |
Income Below Poverty Among Married-Couple Families in Paint Rock
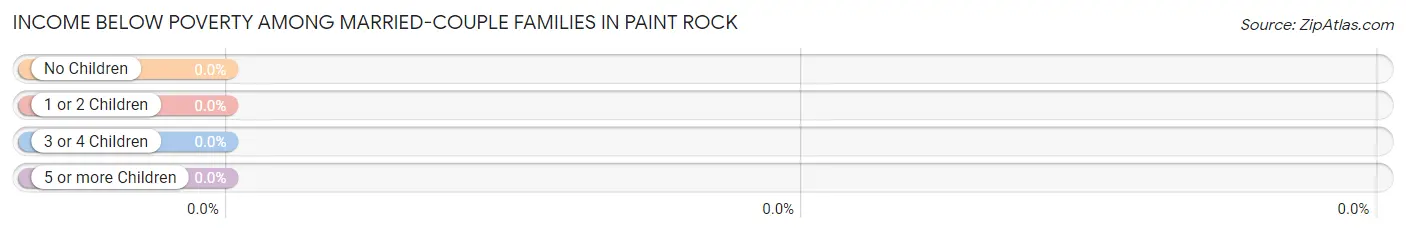
| Children | Above Poverty | Below Poverty |
| No Children | 26 (100.0%) | 0 (0.0%) |
| 1 or 2 Children | 8 (100.0%) | 0 (0.0%) |
| 3 or 4 Children | 7 (100.0%) | 0 (0.0%) |
| 5 or more Children | 0 (0.0%) | 0 (0.0%) |
| Total | 41 (100.0%) | 0 (0.0%) |
Income Below Poverty Among Single-Parent Households in Paint Rock
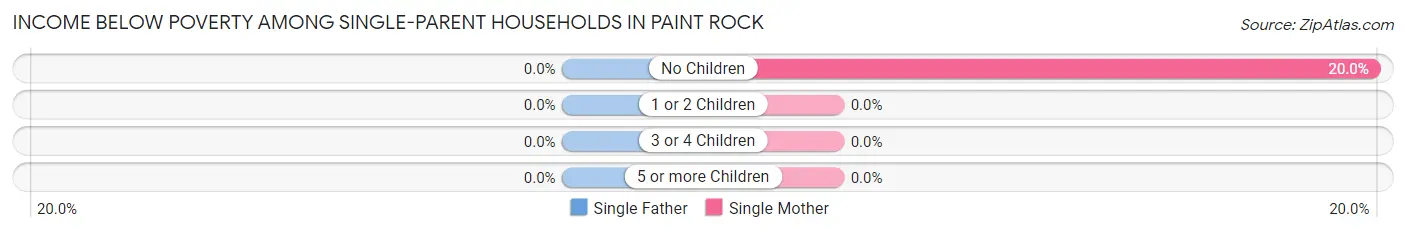
| Children | Single Father | Single Mother |
| No Children | 0 (0.0%) | 1 (20.0%) |
| 1 or 2 Children | 0 (0.0%) | 0 (0.0%) |
| 3 or 4 Children | 0 (0.0%) | 0 (0.0%) |
| 5 or more Children | 0 (0.0%) | 0 (0.0%) |
| Total | 0 (0.0%) | 1 (20.0%) |
Income Below Poverty Among Married-Couple vs Single-Parent Households in Paint Rock
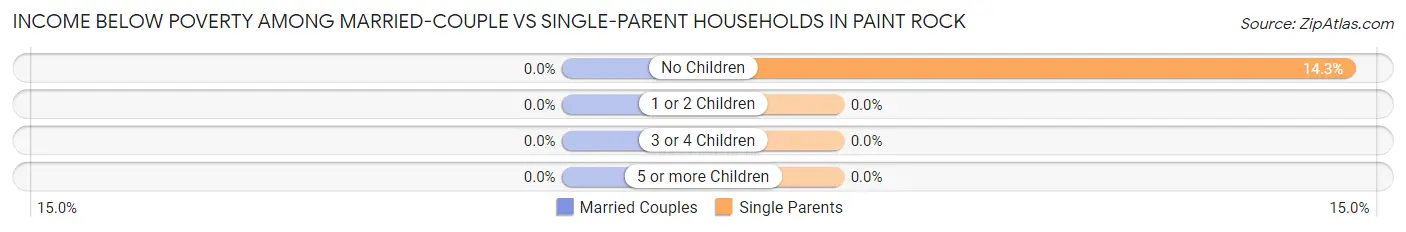
| Children | Married-Couple Families | Single-Parent Households |
| No Children | 0 (0.0%) | 1 (14.3%) |
| 1 or 2 Children | 0 (0.0%) | 0 (0.0%) |
| 3 or 4 Children | 0 (0.0%) | 0 (0.0%) |
| 5 or more Children | 0 (0.0%) | 0 (0.0%) |
| Total | 0 (0.0%) | 1 (14.3%) |
Race in Paint Rock
The most populous races in Paint Rock are White / Caucasian (196 | 94.2%), Two or more Races (7 | 3.4%), and Asian (4 | 1.9%).
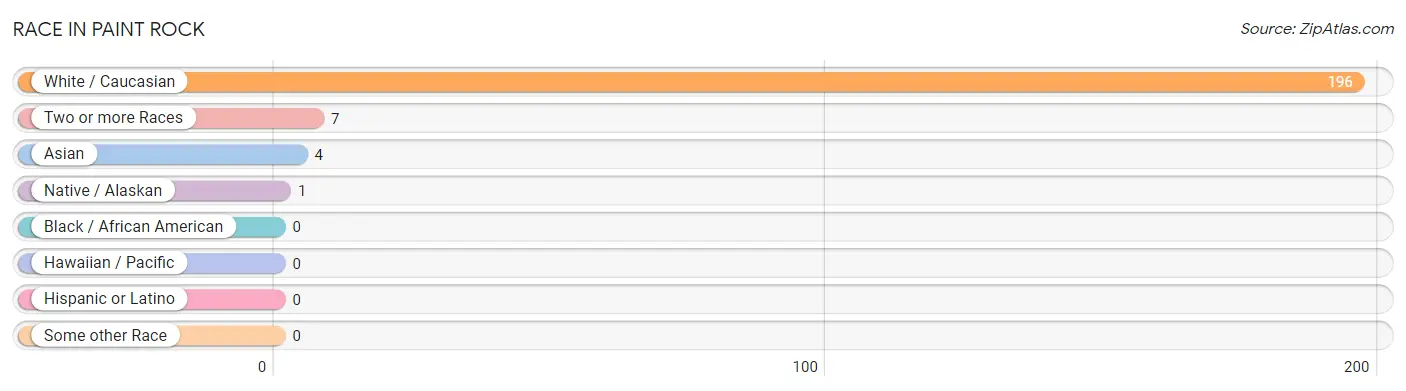
| Race | # Population | % Population |
| Asian | 4 | 1.9% |
| Black / African American | 0 | 0.0% |
| Hawaiian / Pacific | 0 | 0.0% |
| Hispanic or Latino | 0 | 0.0% |
| Native / Alaskan | 1 | 0.5% |
| White / Caucasian | 196 | 94.2% |
| Two or more Races | 7 | 3.4% |
| Some other Race | 0 | 0.0% |
| Total | 208 | 100.0% |
Ancestry in Paint Rock
The most populous ancestries reported in Paint Rock are German (40 | 19.2%), English (13 | 6.2%), American (11 | 5.3%), Scotch-Irish (10 | 4.8%), and Scottish (7 | 3.4%), together accounting for 39.0% of all Paint Rock residents.
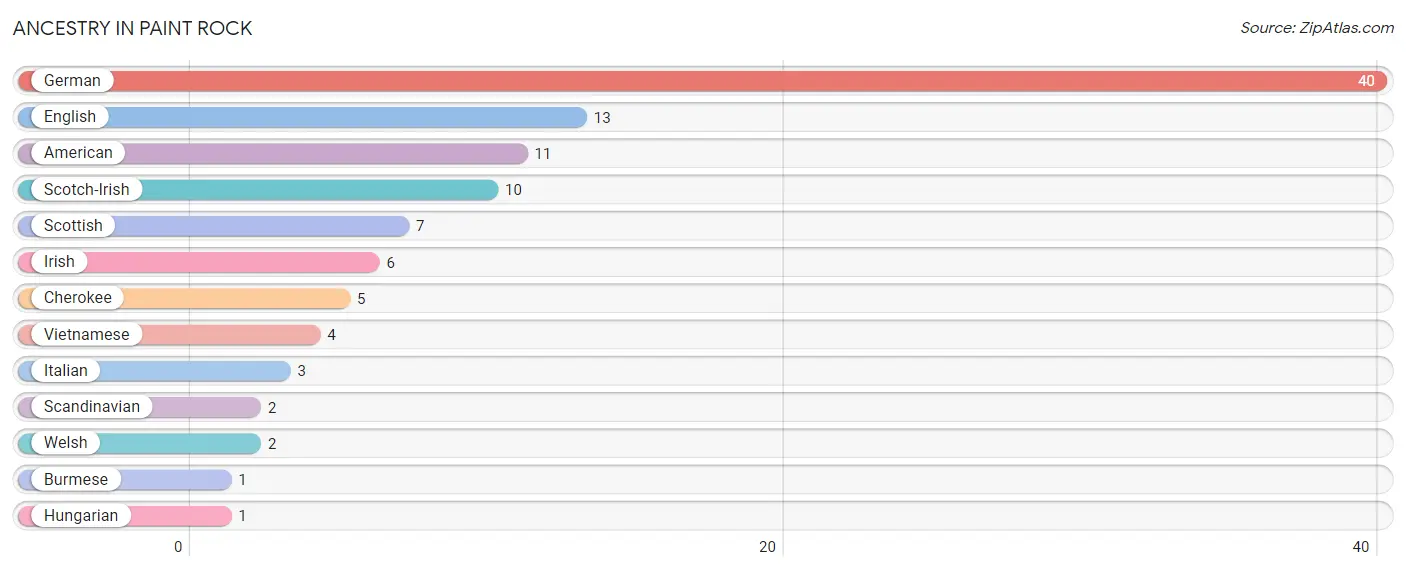
| Ancestry | # Population | % Population |
| American | 11 | 5.3% |
| Burmese | 1 | 0.5% |
| Cherokee | 5 | 2.4% |
| English | 13 | 6.2% |
| German | 40 | 19.2% |
| Hungarian | 1 | 0.5% |
| Irish | 6 | 2.9% |
| Italian | 3 | 1.4% |
| Scandinavian | 2 | 1.0% |
| Scotch-Irish | 10 | 4.8% |
| Scottish | 7 | 3.4% |
| Vietnamese | 4 | 1.9% |
| Welsh | 2 | 1.0% | View All 13 Rows |
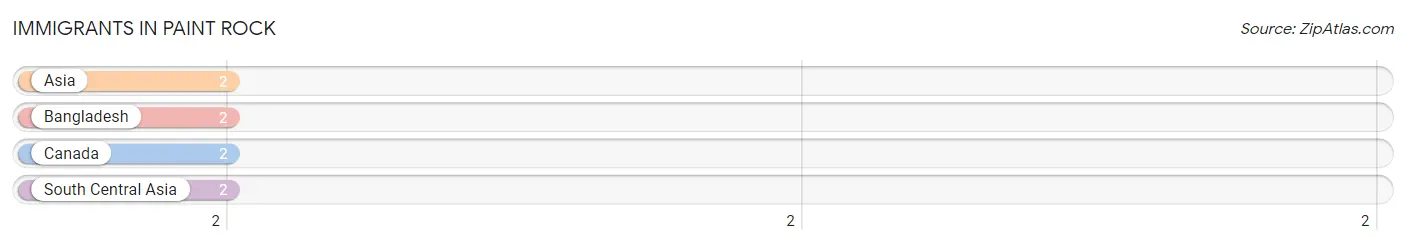
Immigrants in Paint Rock
The most numerous immigrant groups reported in Paint Rock came from Asia (2 | 1.0%), Bangladesh (2 | 1.0%), Canada (2 | 1.0%), and South Central Asia (2 | 1.0%), together accounting for 3.8% of all Paint Rock residents.
| Immigration Origin | # Population | % Population |
| Asia | 2 | 1.0% |
| Bangladesh | 2 | 1.0% |
| Canada | 2 | 1.0% |
| South Central Asia | 2 | 1.0% | View All 4 Rows |
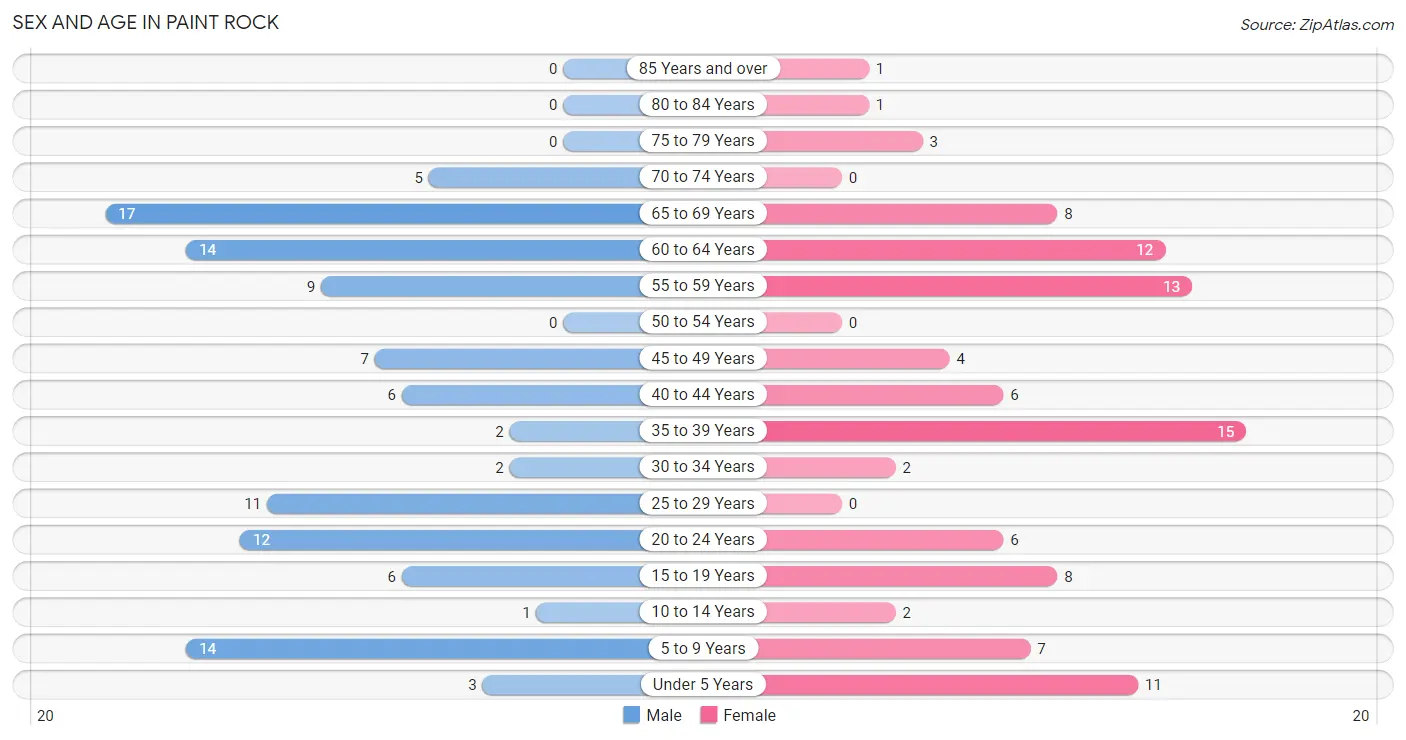
Sex and Age in Paint Rock
Sex and Age in Paint Rock
The most populous age groups in Paint Rock are 65 to 69 Years (17 | 15.6%) for men and 35 to 39 Years (15 | 15.1%) for women.
| Age Bracket | Male | Female |
| Under 5 Years | 3 (2.8%) | 11 (11.1%) |
| 5 to 9 Years | 14 (12.8%) | 7 (7.1%) |
| 10 to 14 Years | 1 (0.9%) | 2 (2.0%) |
| 15 to 19 Years | 6 (5.5%) | 8 (8.1%) |
| 20 to 24 Years | 12 (11.0%) | 6 (6.1%) |
| 25 to 29 Years | 11 (10.1%) | 0 (0.0%) |
| 30 to 34 Years | 2 (1.8%) | 2 (2.0%) |
| 35 to 39 Years | 2 (1.8%) | 15 (15.1%) |
| 40 to 44 Years | 6 (5.5%) | 6 (6.1%) |
| 45 to 49 Years | 7 (6.4%) | 4 (4.0%) |
| 50 to 54 Years | 0 (0.0%) | 0 (0.0%) |
| 55 to 59 Years | 9 (8.3%) | 13 (13.1%) |
| 60 to 64 Years | 14 (12.8%) | 12 (12.1%) |
| 65 to 69 Years | 17 (15.6%) | 8 (8.1%) |
| 70 to 74 Years | 5 (4.6%) | 0 (0.0%) |
| 75 to 79 Years | 0 (0.0%) | 3 (3.0%) |
| 80 to 84 Years | 0 (0.0%) | 1 (1.0%) |
| 85 Years and over | 0 (0.0%) | 1 (1.0%) |
| Total | 109 (100.0%) | 99 (100.0%) |
Families and Households in Paint Rock
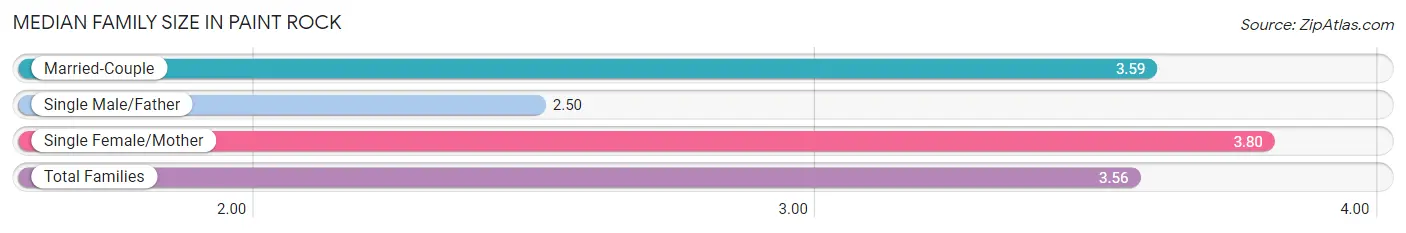
Median Family Size in Paint Rock
The median family size in Paint Rock is 3.56 persons per family, with single female/mother families (5 | 10.4%) accounting for the largest median family size of 3.8 persons per family. On the other hand, single male/father families (2 | 4.2%) represent the smallest median family size with 2.50 persons per family.
| Family Type | # Families | Family Size |
| Married-Couple | 41 (85.4%) | 3.59 |
| Single Male/Father | 2 (4.2%) | 2.50 |
| Single Female/Mother | 5 (10.4%) | 3.80 |
| Total Families | 48 (100.0%) | 3.56 |
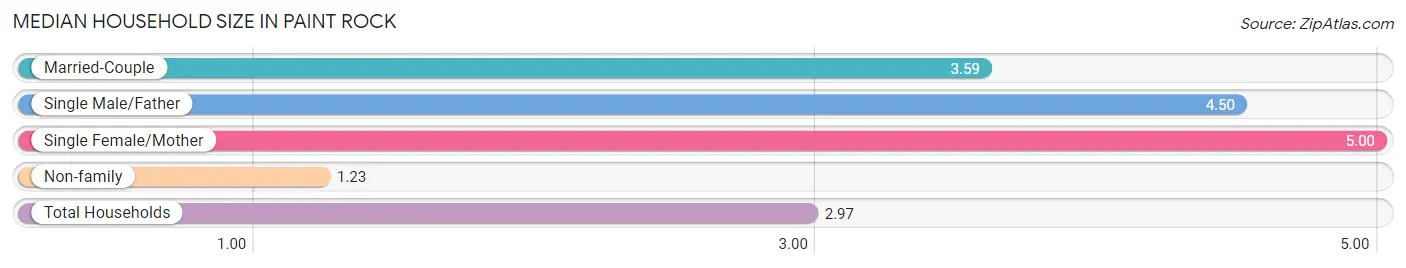
Median Household Size in Paint Rock
The median household size in Paint Rock is 2.97 persons per household, with single female/mother households (5 | 7.1%) accounting for the largest median household size of 5 persons per household. non-family households (22 | 31.4%) represent the smallest median household size with 1.23 persons per household.
| Household Type | # Households | Household Size |
| Married-Couple | 41 (58.6%) | 3.59 |
| Single Male/Father | 2 (2.9%) | 4.50 |
| Single Female/Mother | 5 (7.1%) | 5.00 |
| Non-family | 22 (31.4%) | 1.23 |
| Total Households | 70 (100.0%) | 2.97 |
Household Size by Marriage Status in Paint Rock
Out of a total of 70 households in Paint Rock, 48 (68.6%) are family households, while 22 (31.4%) are nonfamily households. The most numerous type of family households are 2-person households, comprising 22, and the most common type of nonfamily households are 1-person households, comprising 19.
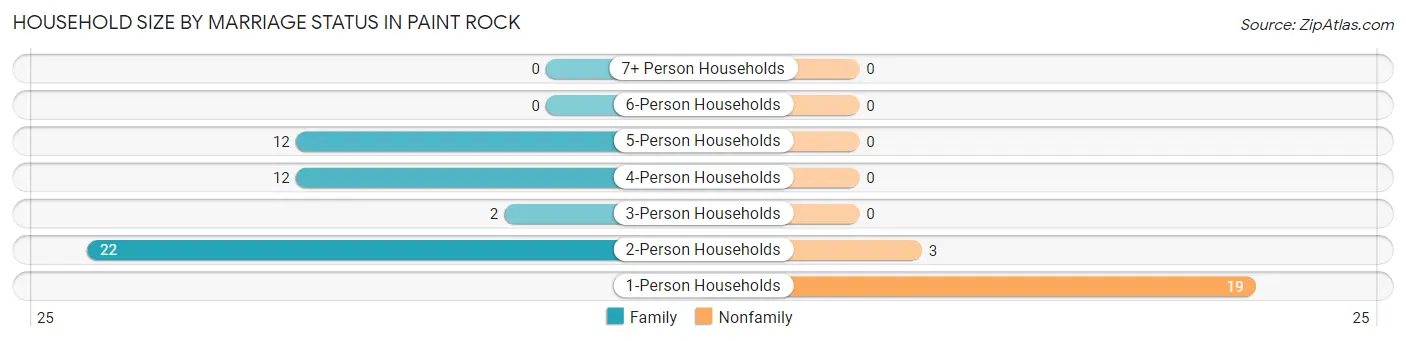
| Household Size | Family Households | Nonfamily Households |
| 1-Person Households | - | 19 (27.1%) |
| 2-Person Households | 22 (31.4%) | 3 (4.3%) |
| 3-Person Households | 2 (2.9%) | 0 (0.0%) |
| 4-Person Households | 12 (17.1%) | 0 (0.0%) |
| 5-Person Households | 12 (17.1%) | 0 (0.0%) |
| 6-Person Households | 0 (0.0%) | 0 (0.0%) |
| 7+ Person Households | 0 (0.0%) | 0 (0.0%) |
| Total | 48 (68.6%) | 22 (31.4%) |
Female Fertility in Paint Rock
Fertility by Age in Paint Rock
Average fertility rate in Paint Rock is 49.0 births per 1,000 women. Women in the age bracket of 20 to 34 years have the highest fertility rate with 250.0 births per 1,000 women. Women in the age bracket of 20 to 34 years acount for 100.0% of all women with births.
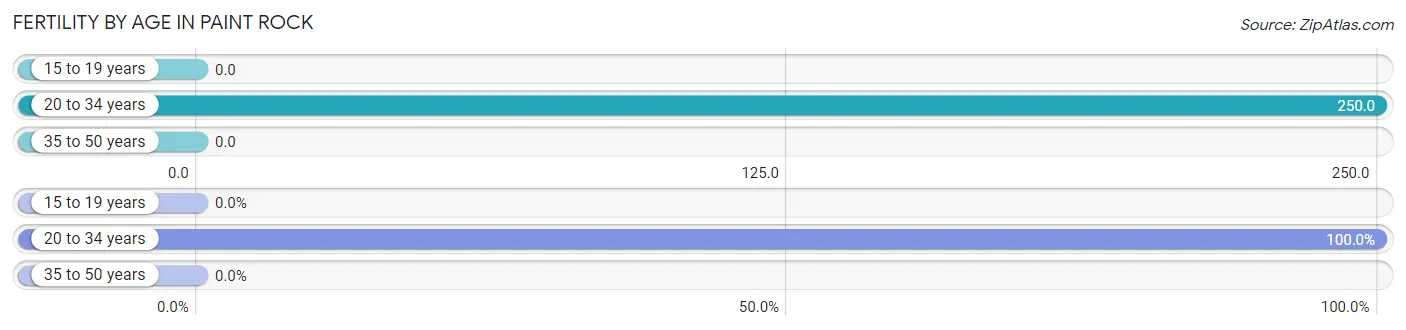
| Age Bracket | Women with Births | Births / 1,000 Women |
| 15 to 19 years | 0 (0.0%) | 0.0 |
| 20 to 34 years | 2 (100.0%) | 250.0 |
| 35 to 50 years | 0 (0.0%) | 0.0 |
| Total | 2 (100.0%) | 49.0 |
Fertility by Age by Marriage Status in Paint Rock
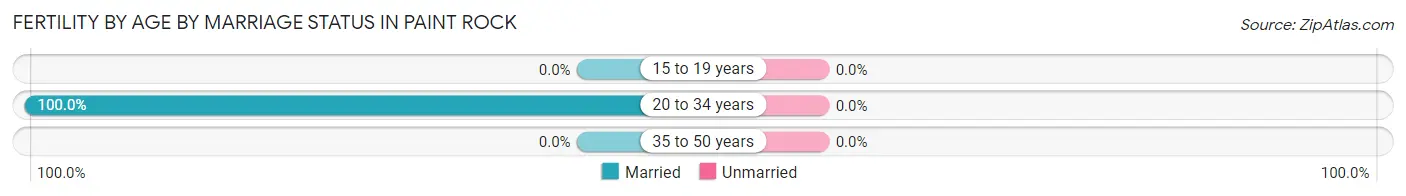
| Age Bracket | Married | Unmarried |
| 15 to 19 years | 0 (0.0%) | 0 (0.0%) |
| 20 to 34 years | 2 (100.0%) | 0 (0.0%) |
| 35 to 50 years | 0 (0.0%) | 0 (0.0%) |
| Total | 2 (100.0%) | 0 (0.0%) |
Fertility by Education in Paint Rock
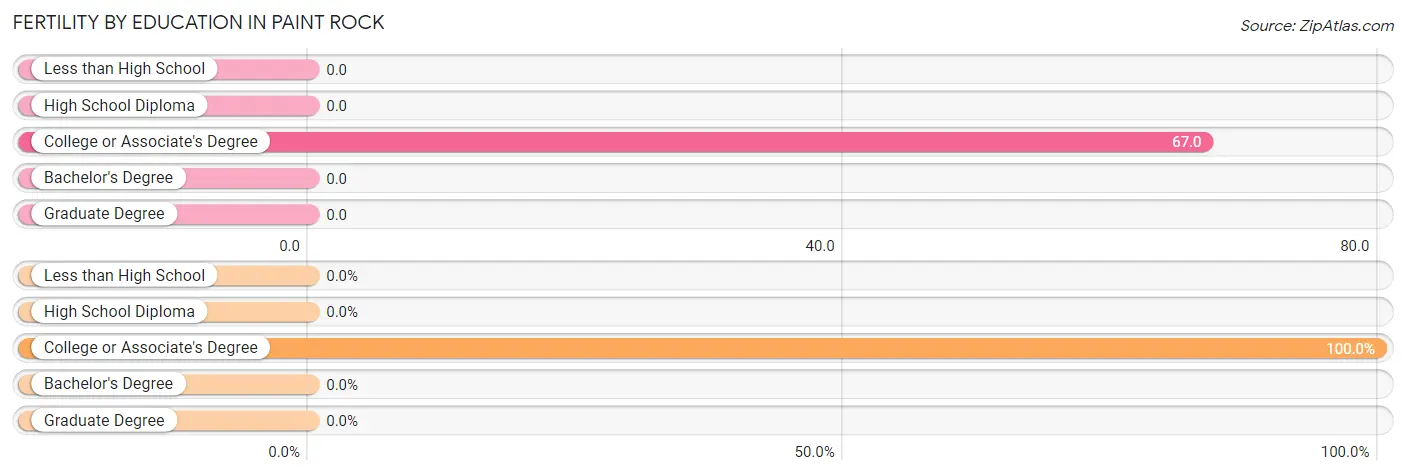
| Educational Attainment | Women with Births | Births / 1,000 Women |
| Less than High School | 0 (0.0%) | 0.0 |
| High School Diploma | 0 (0.0%) | 0.0 |
| College or Associate's Degree | 2 (100.0%) | 67.0 |
| Bachelor's Degree | 0 (0.0%) | 0.0 |
| Graduate Degree | 0 (0.0%) | 0.0 |
| Total | 2 (100.0%) | 49.0 |
Fertility by Education by Marriage Status in Paint Rock
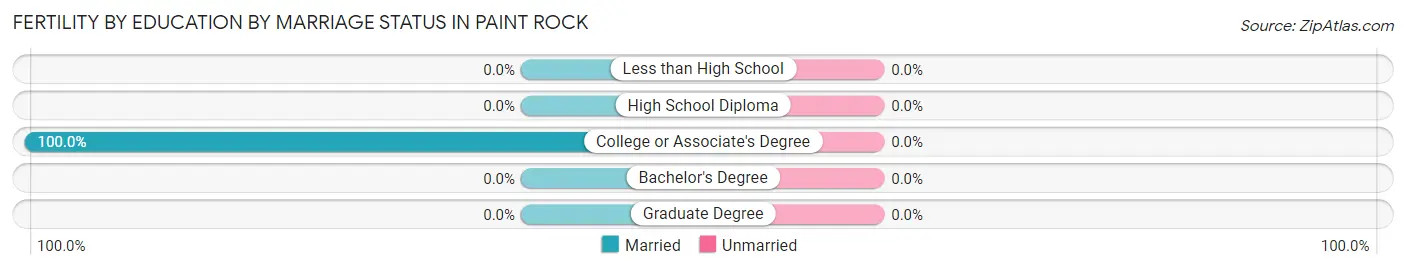
| Educational Attainment | Married | Unmarried |
| Less than High School | 0 (0.0%) | 0 (0.0%) |
| High School Diploma | 0 (0.0%) | 0 (0.0%) |
| College or Associate's Degree | 2 (100.0%) | 0 (0.0%) |
| Bachelor's Degree | 0 (0.0%) | 0 (0.0%) |
| Graduate Degree | 0 (0.0%) | 0 (0.0%) |
| Total | 2 (100.0%) | 0 (0.0%) |
Employment Characteristics in Paint Rock
Employment by Class of Employer in Paint Rock
Among the 96 employed individuals in Paint Rock, private company employees (65 | 67.7%), self-employed (not incorporated) (11 | 11.5%), and not-for-profit organizations (11 | 11.5%) make up the most common classes of employment.
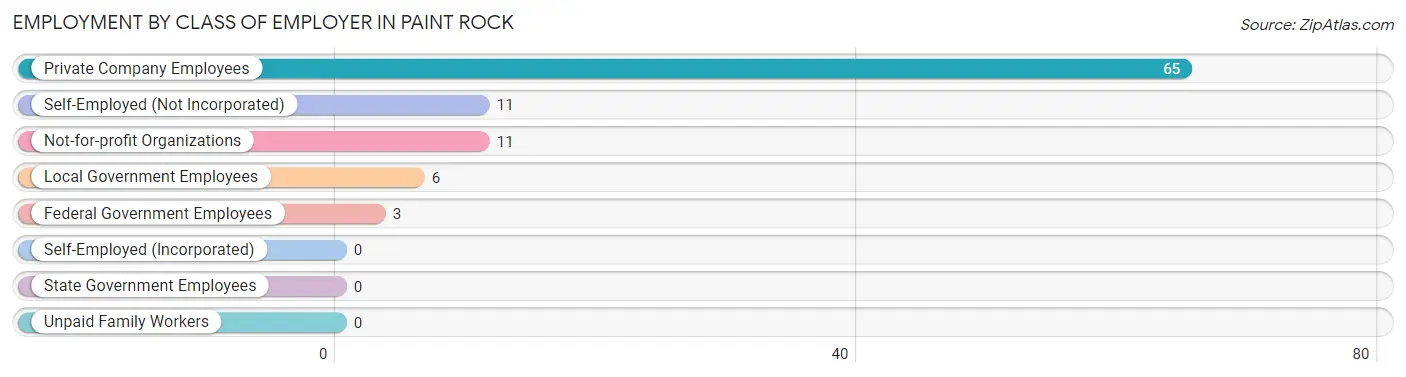
| Employer Class | # Employees | % Employees |
| Private Company Employees | 65 | 67.7% |
| Self-Employed (Incorporated) | 0 | 0.0% |
| Self-Employed (Not Incorporated) | 11 | 11.5% |
| Not-for-profit Organizations | 11 | 11.5% |
| Local Government Employees | 6 | 6.2% |
| State Government Employees | 0 | 0.0% |
| Federal Government Employees | 3 | 3.1% |
| Unpaid Family Workers | 0 | 0.0% |
| Total | 96 | 100.0% |
Employment Status by Age in Paint Rock
According to the labor force statistics for Paint Rock, out of the total population over 16 years of age (170), 60.6% or 103 individuals are in the labor force, with 4.0% or 4 of them unemployed. The age group with the highest labor force participation rate is 25 to 29 years, with 100.0% or 11 individuals in the labor force. Within the labor force, the 20 to 24 years age range has the highest percentage of unemployed individuals, with 16.7% or 2 of them being unemployed.
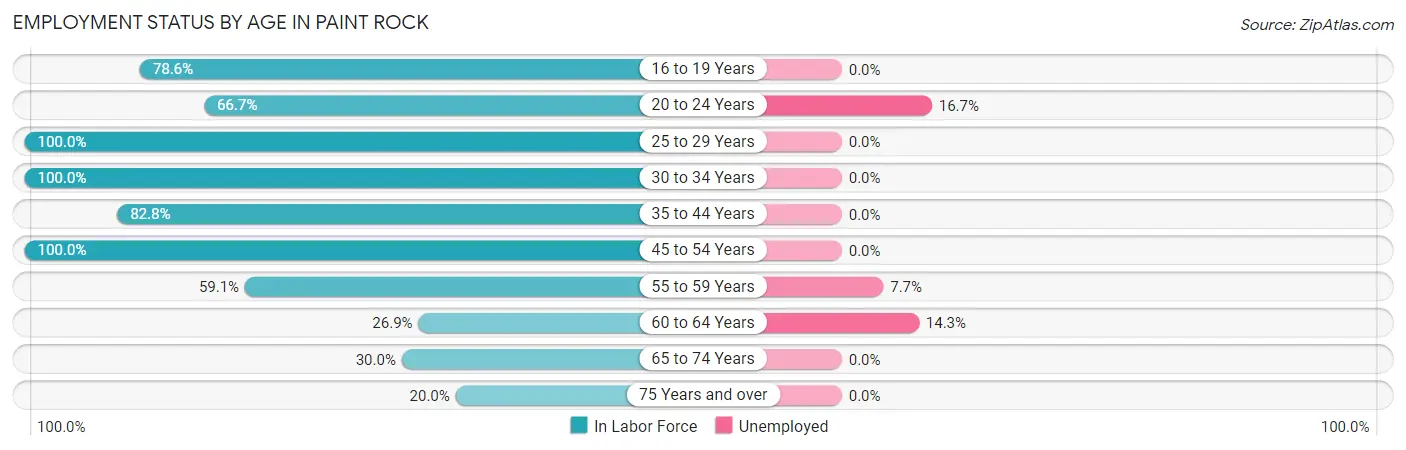
| Age Bracket | In Labor Force | Unemployed |
| 16 to 19 Years | 11 (78.6%) | 0 (0.0%) |
| 20 to 24 Years | 12 (66.7%) | 2 (16.7%) |
| 25 to 29 Years | 11 (100.0%) | 0 (0.0%) |
| 30 to 34 Years | 4 (100.0%) | 0 (0.0%) |
| 35 to 44 Years | 24 (82.8%) | 0 (0.0%) |
| 45 to 54 Years | 11 (100.0%) | 0 (0.0%) |
| 55 to 59 Years | 13 (59.1%) | 1 (7.7%) |
| 60 to 64 Years | 7 (26.9%) | 1 (14.3%) |
| 65 to 74 Years | 9 (30.0%) | 0 (0.0%) |
| 75 Years and over | 1 (20.0%) | 0 (0.0%) |
| Total | 103 (60.6%) | 4 (4.0%) |
Employment Status by Educational Attainment in Paint Rock
According to labor force statistics for Paint Rock, 68.0% of individuals (70) out of the total population between 25 and 64 years of age (103) are in the labor force, with 3.0% or 2 of them being unemployed. The group with the highest labor force participation rate are those with the educational attainment of bachelor's degree or higher, with 100.0% or 5 individuals in the labor force. Within the labor force, individuals with bachelor's degree or higher education have the highest percentage of unemployment, with 20.0% or 1 of them being unemployed.
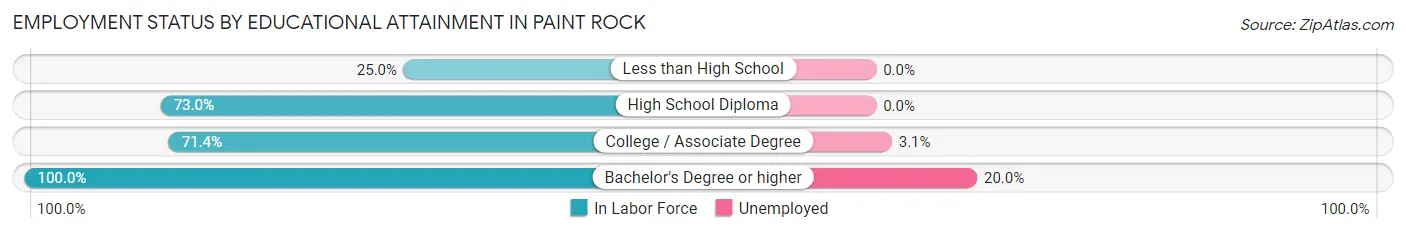
| Educational Attainment | In Labor Force | Unemployed |
| Less than High School | 3 (25.0%) | 0 (0.0%) |
| High School Diploma | 27 (73.0%) | 0 (0.0%) |
| College / Associate Degree | 35 (71.4%) | 2 (3.1%) |
| Bachelor's Degree or higher | 5 (100.0%) | 1 (20.0%) |
| Total | 70 (68.0%) | 3 (3.0%) |
Employment Occupations by Sex in Paint Rock
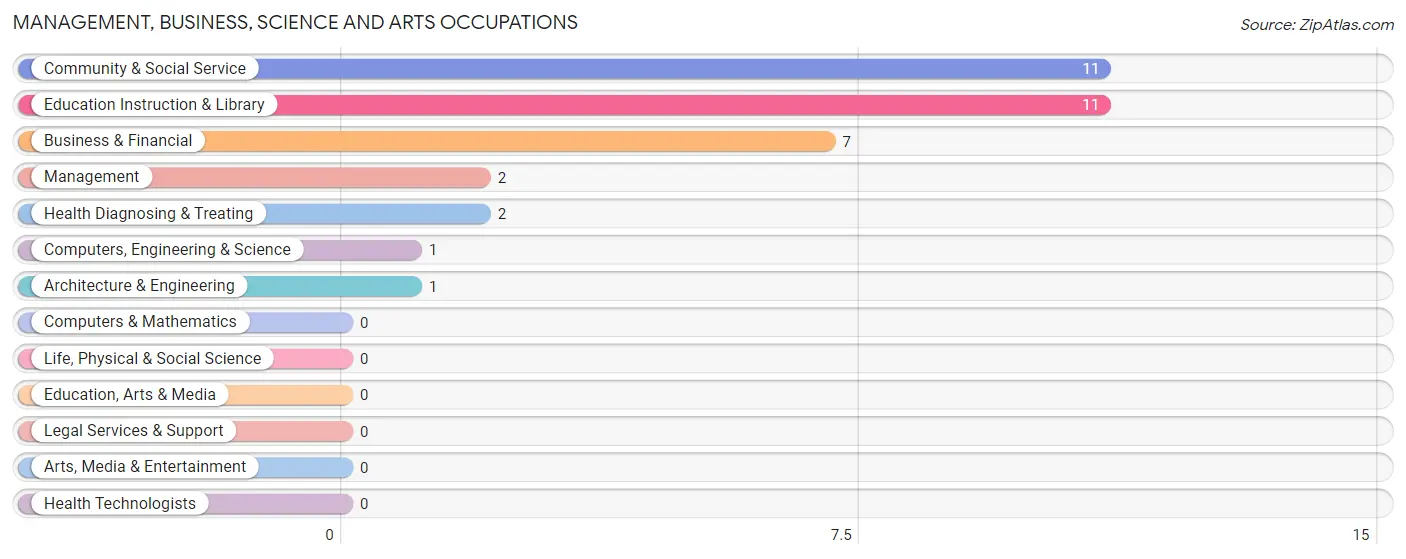
Management, Business, Science and Arts Occupations
The most common Management, Business, Science and Arts occupations in Paint Rock are Community & Social Service (11 | 11.5%), Education Instruction & Library (11 | 11.5%), Business & Financial (7 | 7.3%), Management (2 | 2.1%), and Health Diagnosing & Treating (2 | 2.1%).
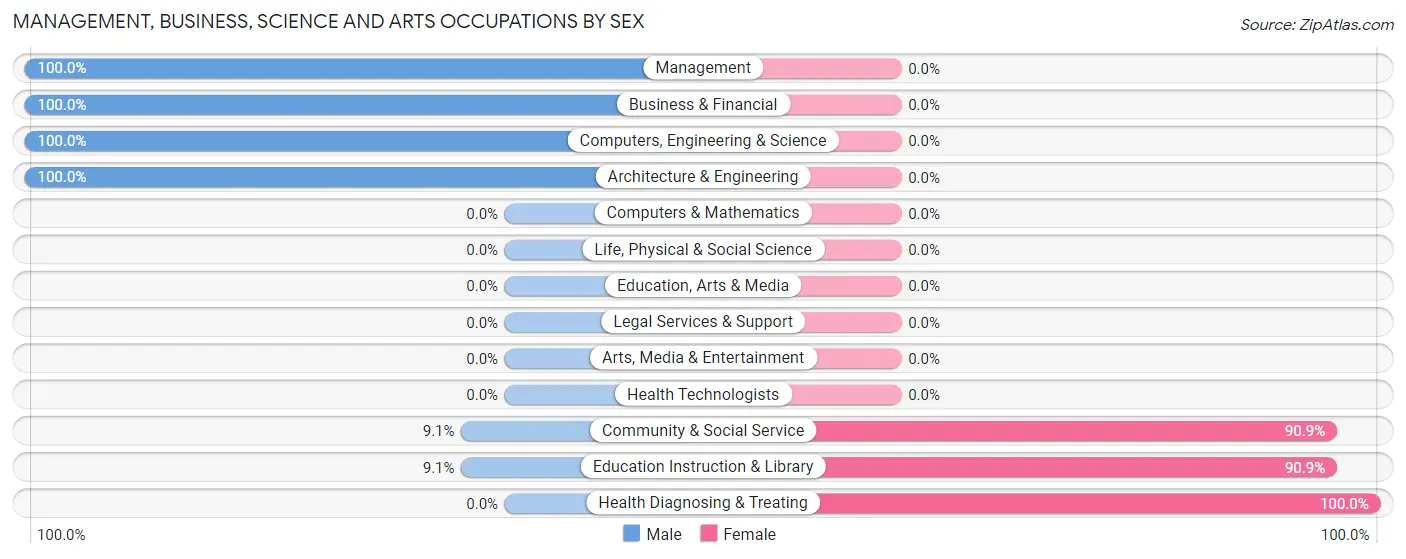
Management, Business, Science and Arts Occupations by Sex
Within the Management, Business, Science and Arts occupations in Paint Rock, the most male-oriented occupations are Management (100.0%), Business & Financial (100.0%), and Computers, Engineering & Science (100.0%), while the most female-oriented occupations are Health Diagnosing & Treating (100.0%), Community & Social Service (90.9%), and Education Instruction & Library (90.9%).
| Occupation | Male | Female |
| Management | 2 (100.0%) | 0 (0.0%) |
| Business & Financial | 7 (100.0%) | 0 (0.0%) |
| Computers, Engineering & Science | 1 (100.0%) | 0 (0.0%) |
| Computers & Mathematics | 0 (0.0%) | 0 (0.0%) |
| Architecture & Engineering | 1 (100.0%) | 0 (0.0%) |
| Life, Physical & Social Science | 0 (0.0%) | 0 (0.0%) |
| Community & Social Service | 1 (9.1%) | 10 (90.9%) |
| Education, Arts & Media | 0 (0.0%) | 0 (0.0%) |
| Legal Services & Support | 0 (0.0%) | 0 (0.0%) |
| Education Instruction & Library | 1 (9.1%) | 10 (90.9%) |
| Arts, Media & Entertainment | 0 (0.0%) | 0 (0.0%) |
| Health Diagnosing & Treating | 0 (0.0%) | 2 (100.0%) |
| Health Technologists | 0 (0.0%) | 0 (0.0%) |
| Total (Category) | 11 (47.8%) | 12 (52.2%) |
| Total (Overall) | 55 (57.3%) | 41 (42.7%) |
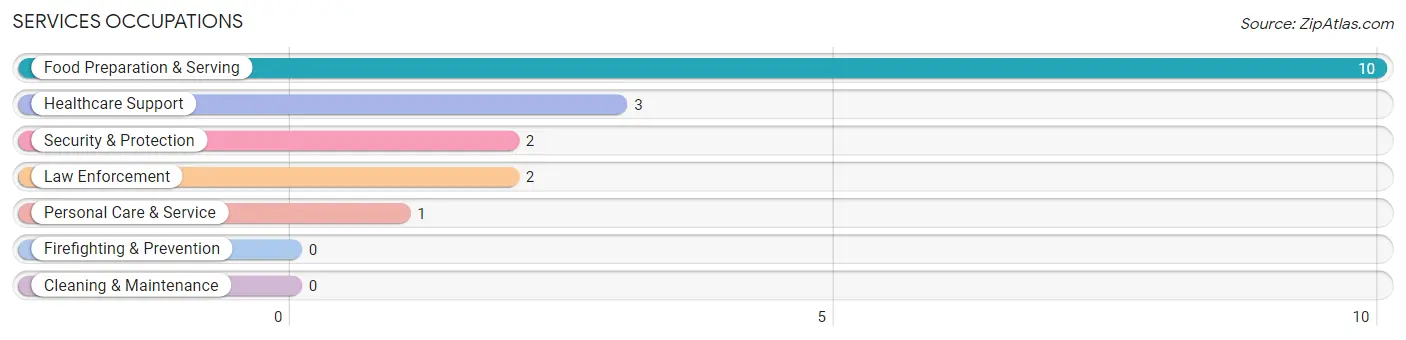
Services Occupations
The most common Services occupations in Paint Rock are Food Preparation & Serving (10 | 10.4%), Healthcare Support (3 | 3.1%), Security & Protection (2 | 2.1%), Law Enforcement (2 | 2.1%), and Personal Care & Service (1 | 1.0%).
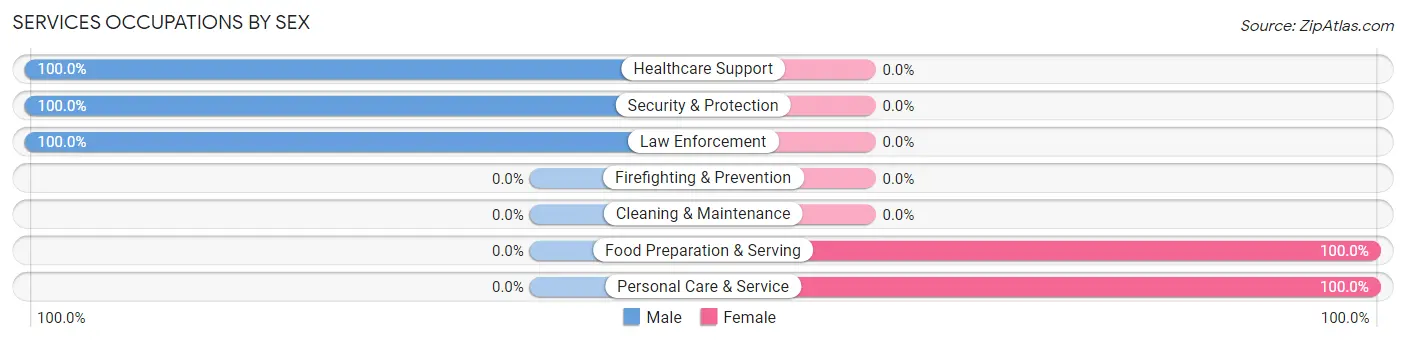
Services Occupations by Sex
Within the Services occupations in Paint Rock, the most male-oriented occupations are Healthcare Support (100.0%), Security & Protection (100.0%), and Law Enforcement (100.0%), while the most female-oriented occupations are Food Preparation & Serving (100.0%), and Personal Care & Service (100.0%).
| Occupation | Male | Female |
| Healthcare Support | 3 (100.0%) | 0 (0.0%) |
| Security & Protection | 2 (100.0%) | 0 (0.0%) |
| Firefighting & Prevention | 0 (0.0%) | 0 (0.0%) |
| Law Enforcement | 2 (100.0%) | 0 (0.0%) |
| Food Preparation & Serving | 0 (0.0%) | 10 (100.0%) |
| Cleaning & Maintenance | 0 (0.0%) | 0 (0.0%) |
| Personal Care & Service | 0 (0.0%) | 1 (100.0%) |
| Total (Category) | 5 (31.2%) | 11 (68.8%) |
| Total (Overall) | 55 (57.3%) | 41 (42.7%) |
Sales and Office Occupations
The most common Sales and Office occupations in Paint Rock are Office & Administration (8 | 8.3%), and Sales & Related (2 | 2.1%).
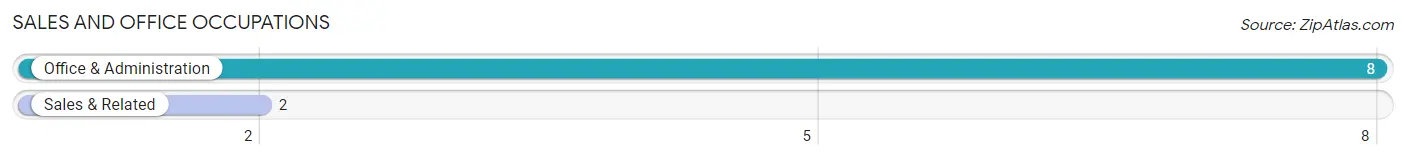
Sales and Office Occupations by Sex
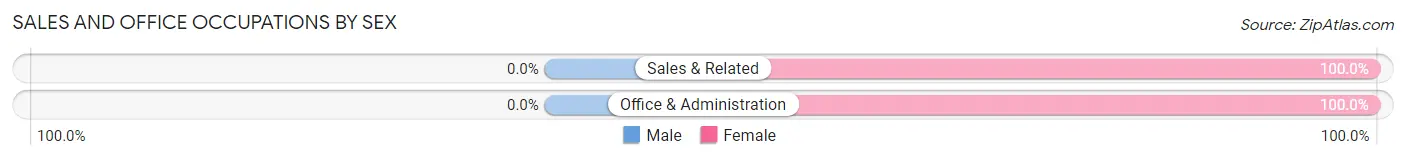
| Occupation | Male | Female |
| Sales & Related | 0 (0.0%) | 2 (100.0%) |
| Office & Administration | 0 (0.0%) | 8 (100.0%) |
| Total (Category) | 0 (0.0%) | 10 (100.0%) |
| Total (Overall) | 55 (57.3%) | 41 (42.7%) |
Natural Resources, Construction and Maintenance Occupations
The most common Natural Resources, Construction and Maintenance occupations in Paint Rock are , and Construction & Extraction (13 | 13.5%).
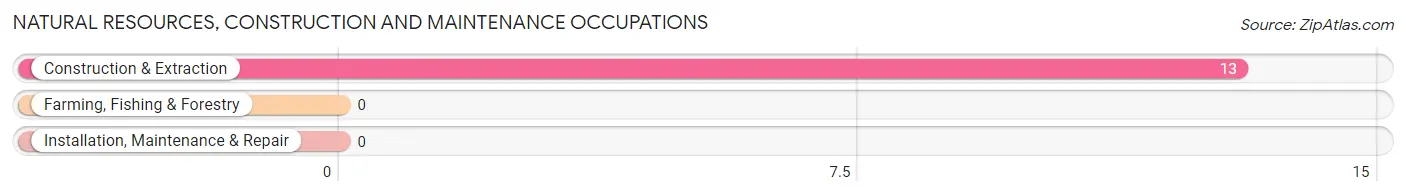
Natural Resources, Construction and Maintenance Occupations by Sex
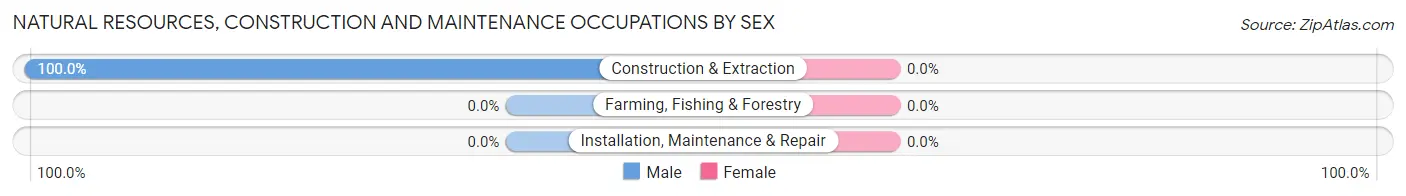
| Occupation | Male | Female |
| Farming, Fishing & Forestry | 0 (0.0%) | 0 (0.0%) |
| Construction & Extraction | 13 (100.0%) | 0 (0.0%) |
| Installation, Maintenance & Repair | 0 (0.0%) | 0 (0.0%) |
| Total (Category) | 13 (100.0%) | 0 (0.0%) |
| Total (Overall) | 55 (57.3%) | 41 (42.7%) |
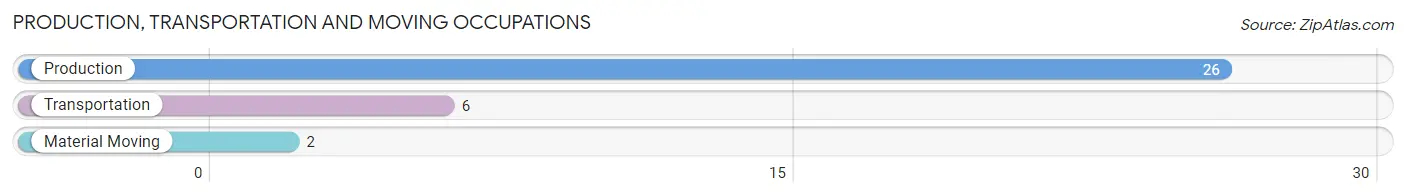
Production, Transportation and Moving Occupations
The most common Production, Transportation and Moving occupations in Paint Rock are Production (26 | 27.1%), Transportation (6 | 6.2%), and Material Moving (2 | 2.1%).
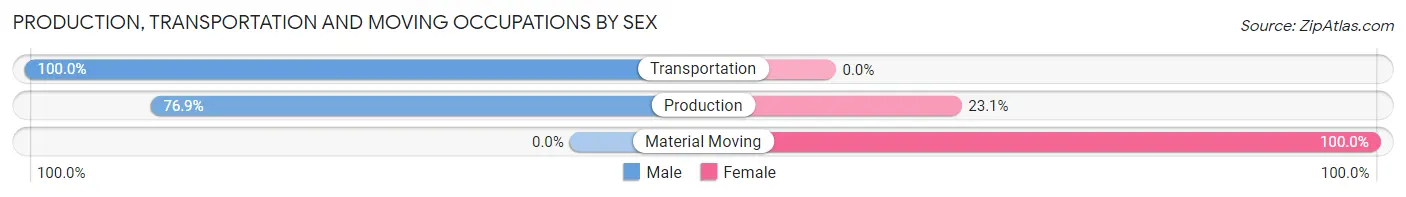
Production, Transportation and Moving Occupations by Sex
| Occupation | Male | Female |
| Production | 20 (76.9%) | 6 (23.1%) |
| Transportation | 6 (100.0%) | 0 (0.0%) |
| Material Moving | 0 (0.0%) | 2 (100.0%) |
| Total (Category) | 26 (76.5%) | 8 (23.5%) |
| Total (Overall) | 55 (57.3%) | 41 (42.7%) |
Employment Industries by Sex in Paint Rock
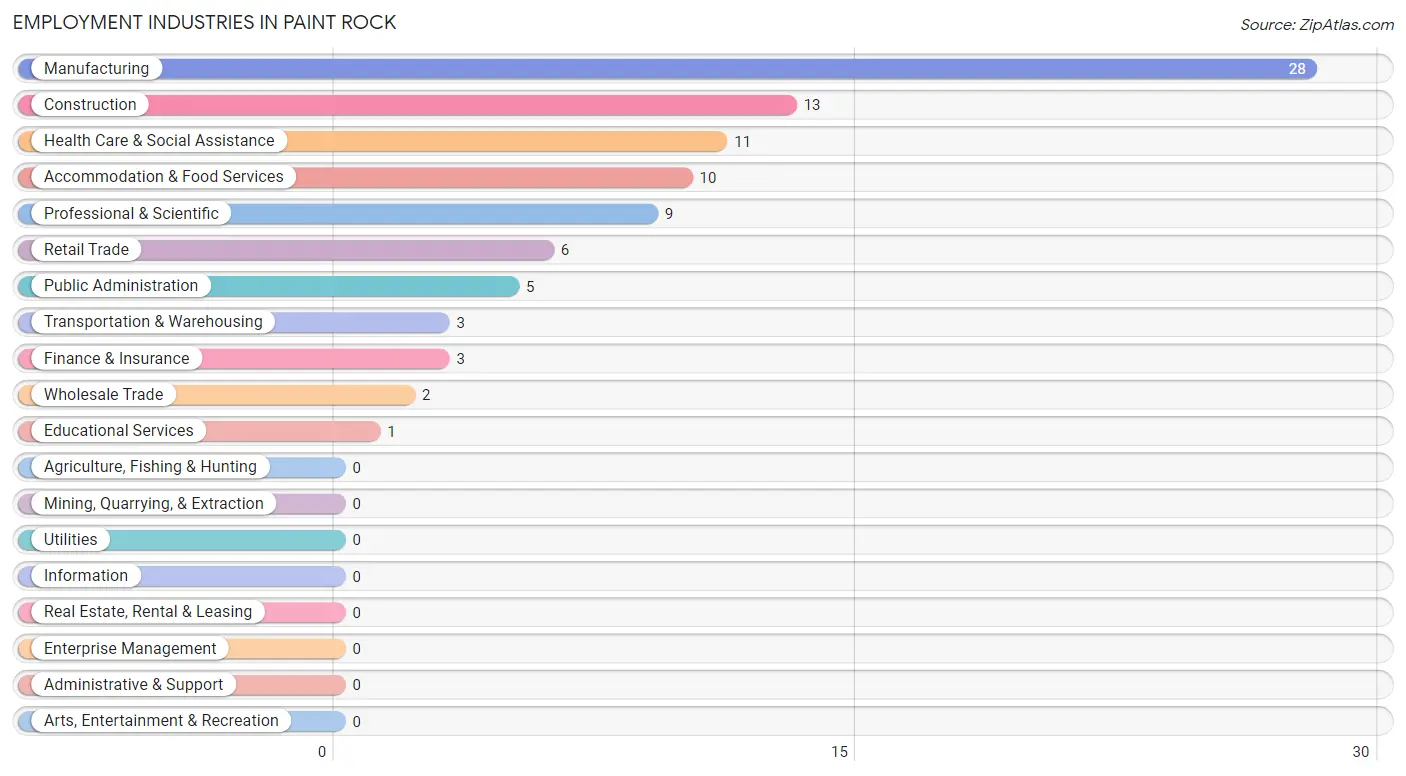
Employment Industries in Paint Rock
The major employment industries in Paint Rock include Manufacturing (28 | 29.2%), Construction (13 | 13.5%), Health Care & Social Assistance (11 | 11.5%), Accommodation & Food Services (10 | 10.4%), and Professional & Scientific (9 | 9.4%).
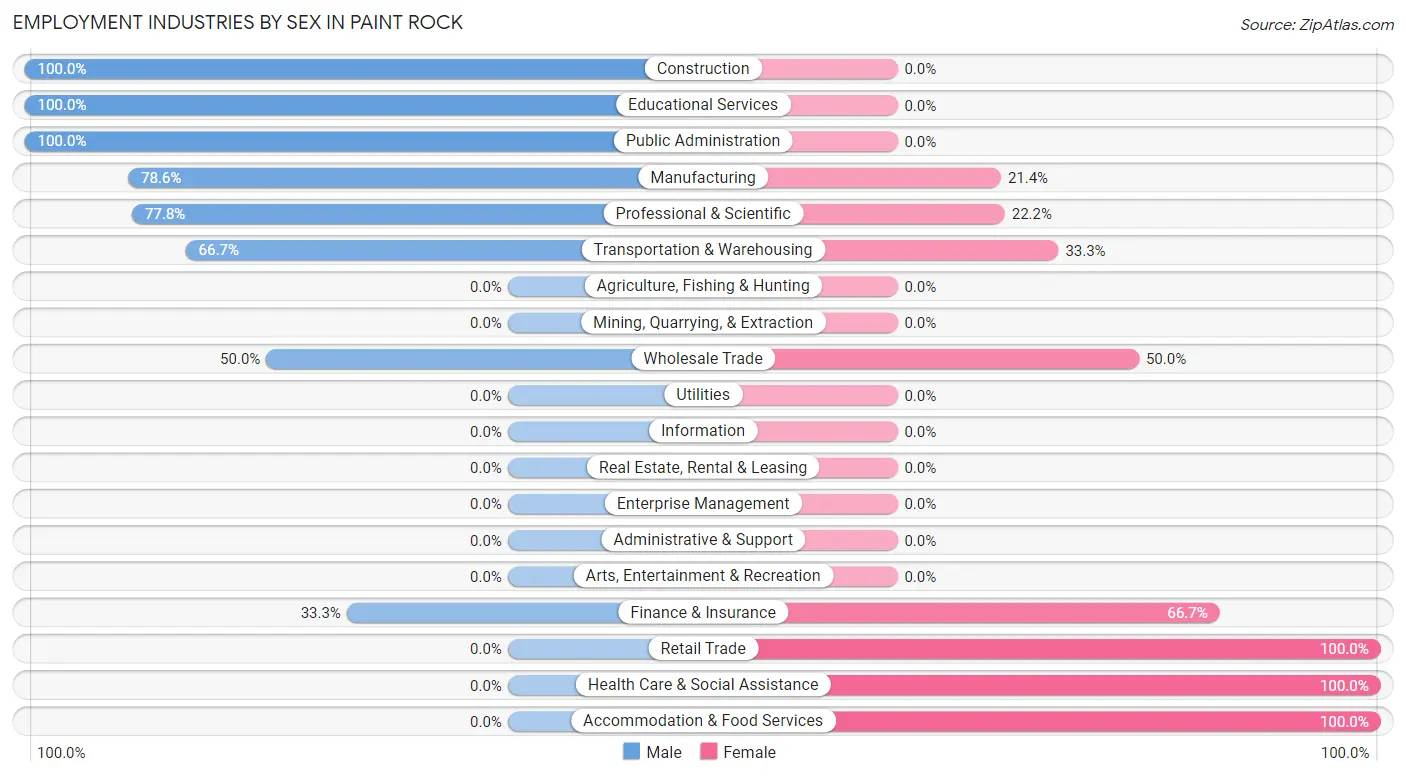
Employment Industries by Sex in Paint Rock
The Paint Rock industries that see more men than women are Construction (100.0%), Educational Services (100.0%), and Public Administration (100.0%), whereas the industries that tend to have a higher number of women are Retail Trade (100.0%), Health Care & Social Assistance (100.0%), and Accommodation & Food Services (100.0%).
| Industry | Male | Female |
| Agriculture, Fishing & Hunting | 0 (0.0%) | 0 (0.0%) |
| Mining, Quarrying, & Extraction | 0 (0.0%) | 0 (0.0%) |
| Construction | 13 (100.0%) | 0 (0.0%) |
| Manufacturing | 22 (78.6%) | 6 (21.4%) |
| Wholesale Trade | 1 (50.0%) | 1 (50.0%) |
| Retail Trade | 0 (0.0%) | 6 (100.0%) |
| Transportation & Warehousing | 2 (66.7%) | 1 (33.3%) |
| Utilities | 0 (0.0%) | 0 (0.0%) |
| Information | 0 (0.0%) | 0 (0.0%) |
| Finance & Insurance | 1 (33.3%) | 2 (66.7%) |
| Real Estate, Rental & Leasing | 0 (0.0%) | 0 (0.0%) |
| Professional & Scientific | 7 (77.8%) | 2 (22.2%) |
| Enterprise Management | 0 (0.0%) | 0 (0.0%) |
| Administrative & Support | 0 (0.0%) | 0 (0.0%) |
| Educational Services | 1 (100.0%) | 0 (0.0%) |
| Health Care & Social Assistance | 0 (0.0%) | 11 (100.0%) |
| Arts, Entertainment & Recreation | 0 (0.0%) | 0 (0.0%) |
| Accommodation & Food Services | 0 (0.0%) | 10 (100.0%) |
| Public Administration | 5 (100.0%) | 0 (0.0%) |
| Total | 55 (57.3%) | 41 (42.7%) |
Education in Paint Rock
School Enrollment in Paint Rock
The most common levels of schooling among the 28 students in Paint Rock are elementary school (12 | 42.9%), college / undergraduate (8 | 28.6%), and middle school (3 | 10.7%).
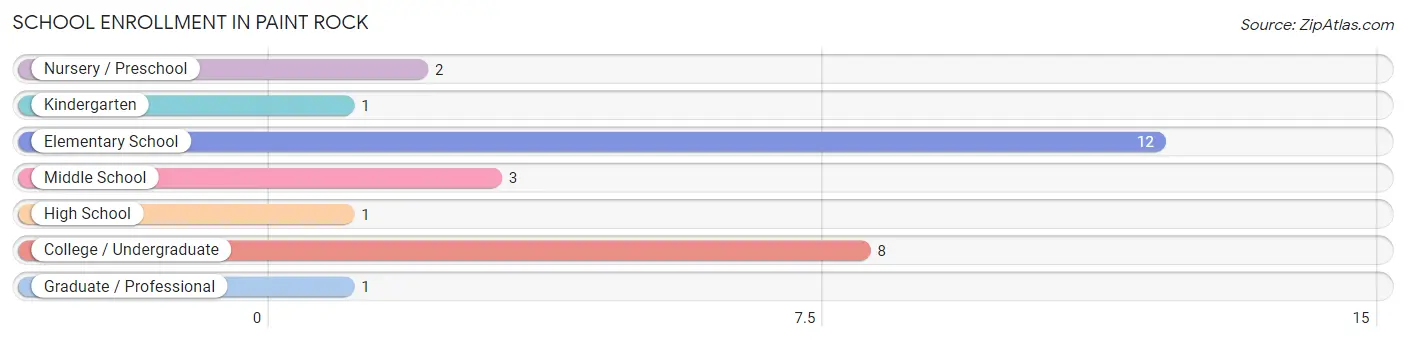
| School Level | # Students | % Students |
| Nursery / Preschool | 2 | 7.1% |
| Kindergarten | 1 | 3.6% |
| Elementary School | 12 | 42.9% |
| Middle School | 3 | 10.7% |
| High School | 1 | 3.6% |
| College / Undergraduate | 8 | 28.6% |
| Graduate / Professional | 1 | 3.6% |
| Total | 28 | 100.0% |
School Enrollment by Age by Funding Source in Paint Rock
Out of a total of 28 students who are enrolled in schools in Paint Rock, 4 (14.3%) attend a private institution, while the remaining 24 (85.7%) are enrolled in public schools. The age group of 5 to 9 year old has the highest likelihood of being enrolled in private schools, with 4 (26.7% in the age bracket) enrolled. Conversely, the age group of 10 to 14 year olds has the lowest likelihood of being enrolled in a private school, with 3 (100.0% in the age bracket) attending a public institution.
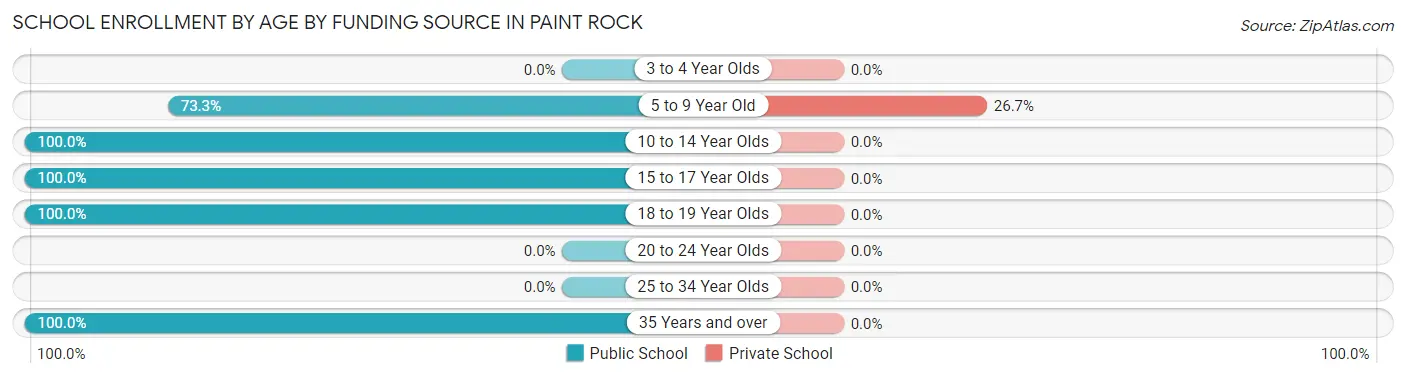
| Age Bracket | Public School | Private School |
| 3 to 4 Year Olds | 0 (0.0%) | 0 (0.0%) |
| 5 to 9 Year Old | 11 (73.3%) | 4 (26.7%) |
| 10 to 14 Year Olds | 3 (100.0%) | 0 (0.0%) |
| 15 to 17 Year Olds | 1 (100.0%) | 0 (0.0%) |
| 18 to 19 Year Olds | 8 (100.0%) | 0 (0.0%) |
| 20 to 24 Year Olds | 0 (0.0%) | 0 (0.0%) |
| 25 to 34 Year Olds | 0 (0.0%) | 0 (0.0%) |
| 35 Years and over | 1 (100.0%) | 0 (0.0%) |
| Total | 24 (85.7%) | 4 (14.3%) |
Educational Attainment by Field of Study in Paint Rock
Bio, nature & agricultural (4 | 33.3%), physical & health sciences (3 | 25.0%), engineering (2 | 16.7%), computers & mathematics (1 | 8.3%), and business (1 | 8.3%) are the most common fields of study among 12 individuals in Paint Rock who have obtained a bachelor's degree or higher.
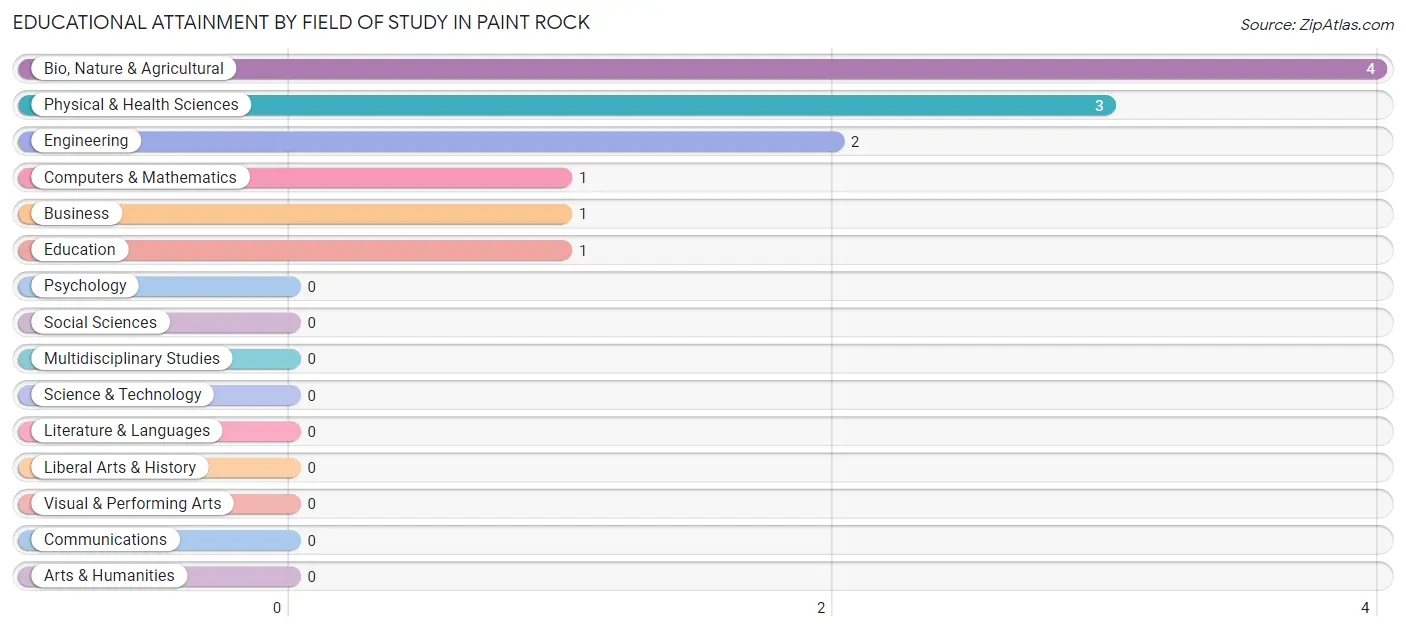
| Field of Study | # Graduates | % Graduates |
| Computers & Mathematics | 1 | 8.3% |
| Bio, Nature & Agricultural | 4 | 33.3% |
| Physical & Health Sciences | 3 | 25.0% |
| Psychology | 0 | 0.0% |
| Social Sciences | 0 | 0.0% |
| Engineering | 2 | 16.7% |
| Multidisciplinary Studies | 0 | 0.0% |
| Science & Technology | 0 | 0.0% |
| Business | 1 | 8.3% |
| Education | 1 | 8.3% |
| Literature & Languages | 0 | 0.0% |
| Liberal Arts & History | 0 | 0.0% |
| Visual & Performing Arts | 0 | 0.0% |
| Communications | 0 | 0.0% |
| Arts & Humanities | 0 | 0.0% |
| Total | 12 | 100.0% |
Transportation & Commute in Paint Rock
Vehicle Availability by Sex in Paint Rock
The most prevalent vehicle ownership categories in Paint Rock are males with 5 or more vehicles (27, accounting for 49.1%) and females with 5 or more vehicles (25, making up 65.8%).
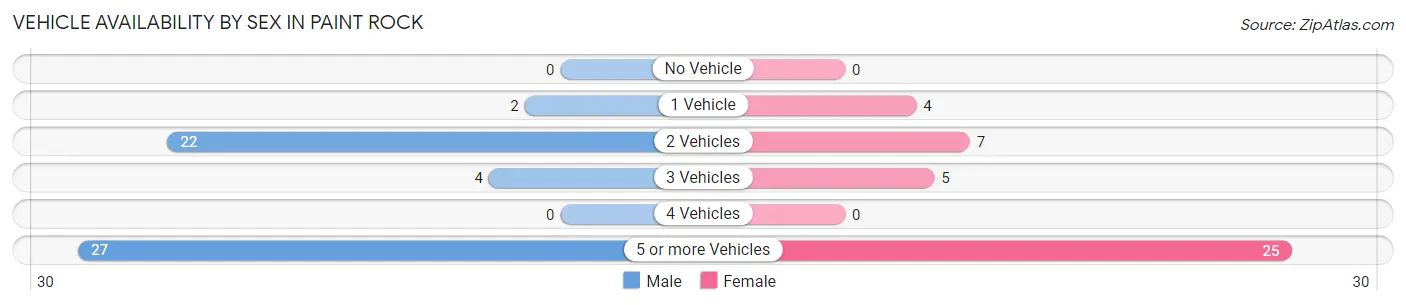
| Vehicles Available | Male | Female |
| No Vehicle | 0 (0.0%) | 0 (0.0%) |
| 1 Vehicle | 2 (3.6%) | 4 (9.8%) |
| 2 Vehicles | 22 (40.0%) | 7 (17.1%) |
| 3 Vehicles | 4 (7.3%) | 5 (12.2%) |
| 4 Vehicles | 0 (0.0%) | 0 (0.0%) |
| 5 or more Vehicles | 27 (49.1%) | 25 (61.0%) |
| Total | 55 (100.0%) | 41 (100.0%) |
Commute Time in Paint Rock
The most frequently occuring commute durations in Paint Rock are 60 to 89 minutes (24 commuters, 26.1%), 30 to 34 minutes (20 commuters, 21.7%), and 15 to 19 minutes (14 commuters, 15.2%).
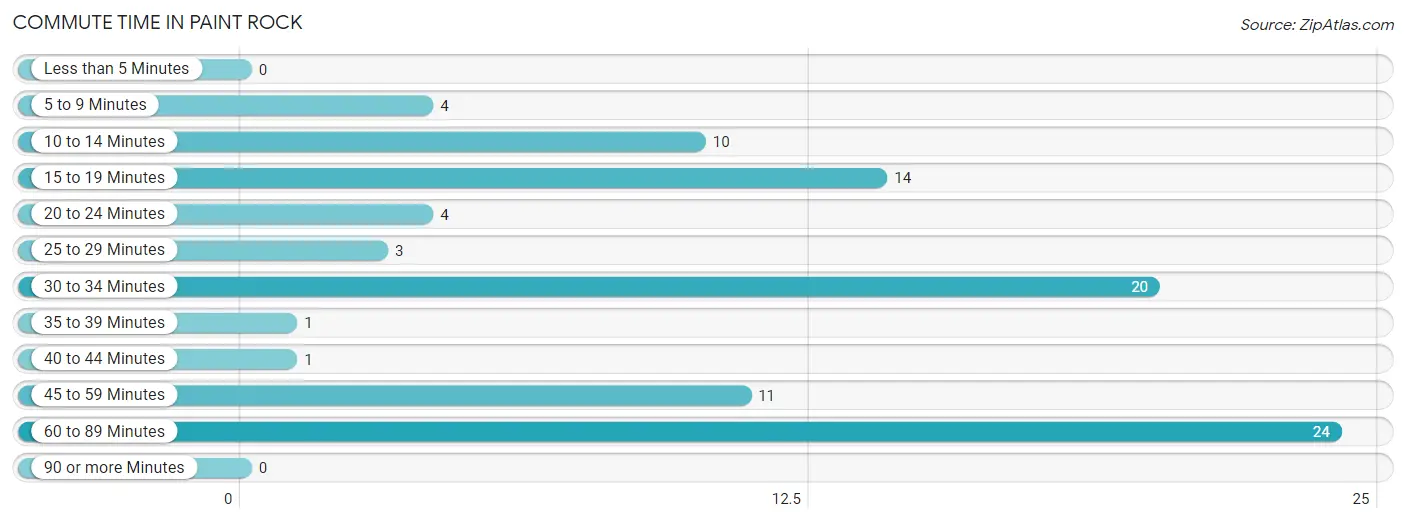
| Commute Time | # Commuters | % Commuters |
| Less than 5 Minutes | 0 | 0.0% |
| 5 to 9 Minutes | 4 | 4.3% |
| 10 to 14 Minutes | 10 | 10.9% |
| 15 to 19 Minutes | 14 | 15.2% |
| 20 to 24 Minutes | 4 | 4.3% |
| 25 to 29 Minutes | 3 | 3.3% |
| 30 to 34 Minutes | 20 | 21.7% |
| 35 to 39 Minutes | 1 | 1.1% |
| 40 to 44 Minutes | 1 | 1.1% |
| 45 to 59 Minutes | 11 | 12.0% |
| 60 to 89 Minutes | 24 | 26.1% |
| 90 or more Minutes | 0 | 0.0% |
Commute Time by Sex in Paint Rock
The most common commute times in Paint Rock are 60 to 89 minutes (22 commuters, 42.3%) for males and 30 to 34 minutes (15 commuters, 37.5%) for females.
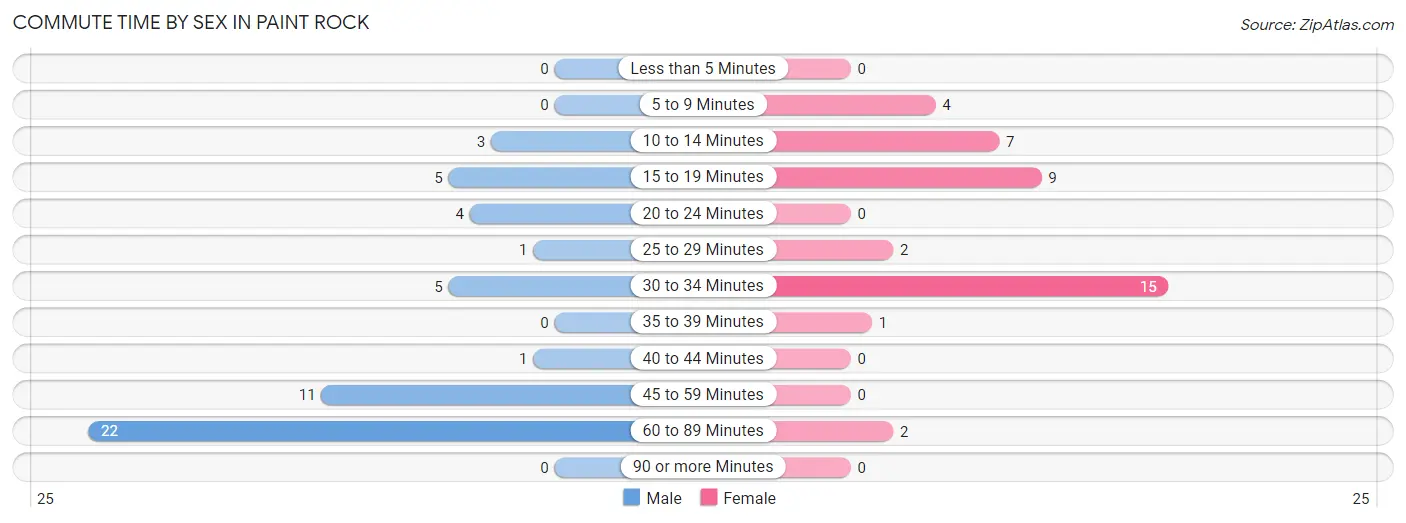
| Commute Time | Male | Female |
| Less than 5 Minutes | 0 (0.0%) | 0 (0.0%) |
| 5 to 9 Minutes | 0 (0.0%) | 4 (10.0%) |
| 10 to 14 Minutes | 3 (5.8%) | 7 (17.5%) |
| 15 to 19 Minutes | 5 (9.6%) | 9 (22.5%) |
| 20 to 24 Minutes | 4 (7.7%) | 0 (0.0%) |
| 25 to 29 Minutes | 1 (1.9%) | 2 (5.0%) |
| 30 to 34 Minutes | 5 (9.6%) | 15 (37.5%) |
| 35 to 39 Minutes | 0 (0.0%) | 1 (2.5%) |
| 40 to 44 Minutes | 1 (1.9%) | 0 (0.0%) |
| 45 to 59 Minutes | 11 (21.1%) | 0 (0.0%) |
| 60 to 89 Minutes | 22 (42.3%) | 2 (5.0%) |
| 90 or more Minutes | 0 (0.0%) | 0 (0.0%) |
Time of Departure to Work by Sex in Paint Rock
The most frequent times of departure to work in Paint Rock are 12:00 AM to 4:59 AM (15, 28.8%) for males and 5:00 AM to 5:29 AM (10, 25.0%) for females.
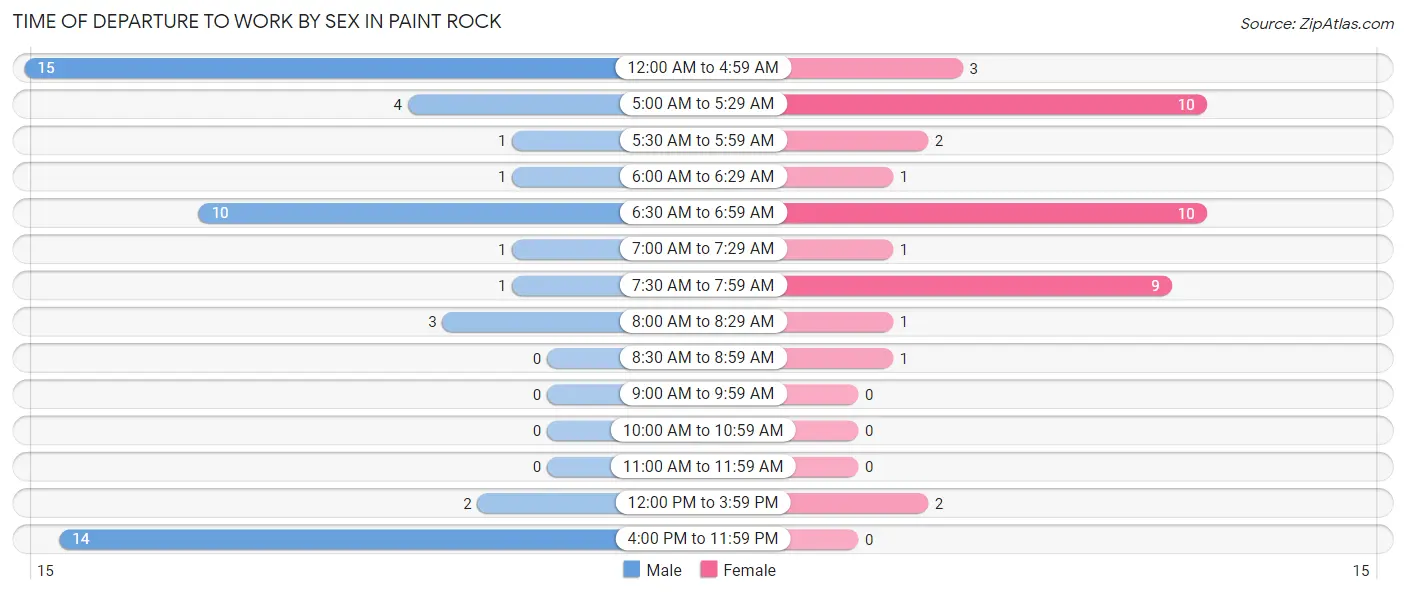
| Time of Departure | Male | Female |
| 12:00 AM to 4:59 AM | 15 (28.8%) | 3 (7.5%) |
| 5:00 AM to 5:29 AM | 4 (7.7%) | 10 (25.0%) |
| 5:30 AM to 5:59 AM | 1 (1.9%) | 2 (5.0%) |
| 6:00 AM to 6:29 AM | 1 (1.9%) | 1 (2.5%) |
| 6:30 AM to 6:59 AM | 10 (19.2%) | 10 (25.0%) |
| 7:00 AM to 7:29 AM | 1 (1.9%) | 1 (2.5%) |
| 7:30 AM to 7:59 AM | 1 (1.9%) | 9 (22.5%) |
| 8:00 AM to 8:29 AM | 3 (5.8%) | 1 (2.5%) |
| 8:30 AM to 8:59 AM | 0 (0.0%) | 1 (2.5%) |
| 9:00 AM to 9:59 AM | 0 (0.0%) | 0 (0.0%) |
| 10:00 AM to 10:59 AM | 0 (0.0%) | 0 (0.0%) |
| 11:00 AM to 11:59 AM | 0 (0.0%) | 0 (0.0%) |
| 12:00 PM to 3:59 PM | 2 (3.8%) | 2 (5.0%) |
| 4:00 PM to 11:59 PM | 14 (26.9%) | 0 (0.0%) |
| Total | 52 (100.0%) | 40 (100.0%) |
Housing Occupancy in Paint Rock
Occupancy by Ownership in Paint Rock
Of the total 70 dwellings in Paint Rock, owner-occupied units account for 65 (92.9%), while renter-occupied units make up 5 (7.1%).
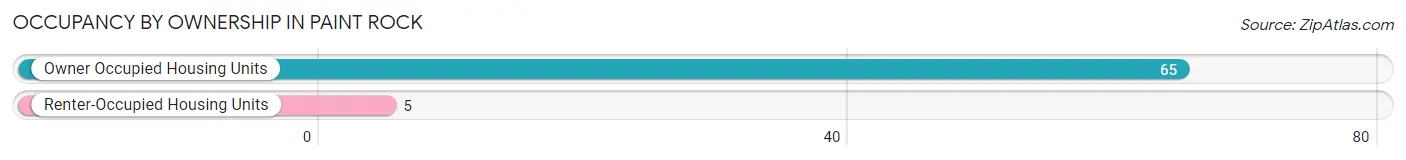
| Occupancy | # Housing Units | % Housing Units |
| Owner Occupied Housing Units | 65 | 92.9% |
| Renter-Occupied Housing Units | 5 | 7.1% |
| Total Occupied Housing Units | 70 | 100.0% |
Occupancy by Household Size in Paint Rock
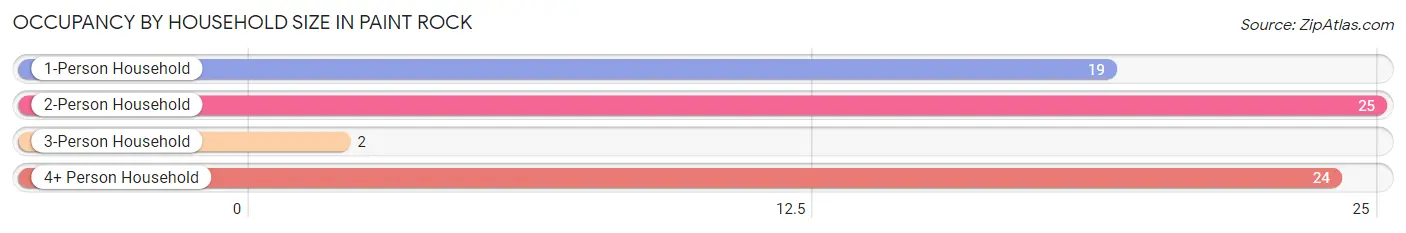
| Household Size | # Housing Units | % Housing Units |
| 1-Person Household | 19 | 27.1% |
| 2-Person Household | 25 | 35.7% |
| 3-Person Household | 2 | 2.9% |
| 4+ Person Household | 24 | 34.3% |
| Total Housing Units | 70 | 100.0% |
Occupancy by Ownership by Household Size in Paint Rock
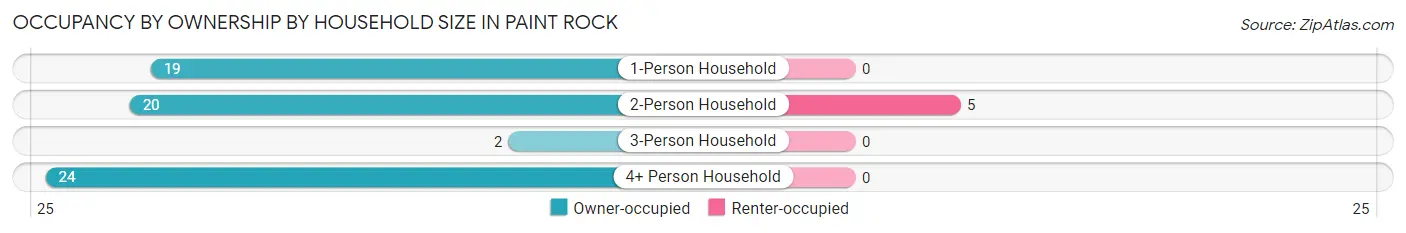
| Household Size | Owner-occupied | Renter-occupied |
| 1-Person Household | 19 (100.0%) | 0 (0.0%) |
| 2-Person Household | 20 (80.0%) | 5 (20.0%) |
| 3-Person Household | 2 (100.0%) | 0 (0.0%) |
| 4+ Person Household | 24 (100.0%) | 0 (0.0%) |
| Total Housing Units | 65 (92.9%) | 5 (7.1%) |
Occupancy by Educational Attainment in Paint Rock
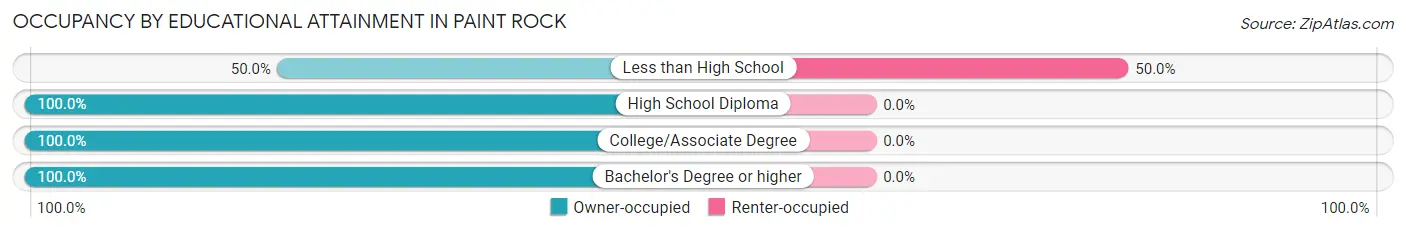
| Household Size | Owner-occupied | Renter-occupied |
| Less than High School | 5 (50.0%) | 5 (50.0%) |
| High School Diploma | 27 (100.0%) | 0 (0.0%) |
| College/Associate Degree | 28 (100.0%) | 0 (0.0%) |
| Bachelor's Degree or higher | 5 (100.0%) | 0 (0.0%) |
Occupancy by Age of Householder in Paint Rock
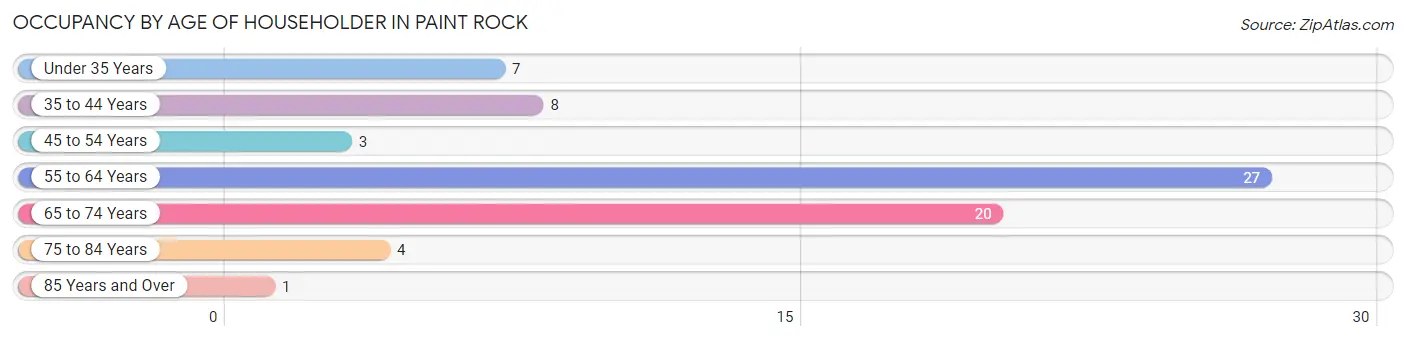
| Age Bracket | # Households | % Households |
| Under 35 Years | 7 | 10.0% |
| 35 to 44 Years | 8 | 11.4% |
| 45 to 54 Years | 3 | 4.3% |
| 55 to 64 Years | 27 | 38.6% |
| 65 to 74 Years | 20 | 28.6% |
| 75 to 84 Years | 4 | 5.7% |
| 85 Years and Over | 1 | 1.4% |
| Total | 70 | 100.0% |
Housing Finances in Paint Rock
Median Income by Occupancy in Paint Rock
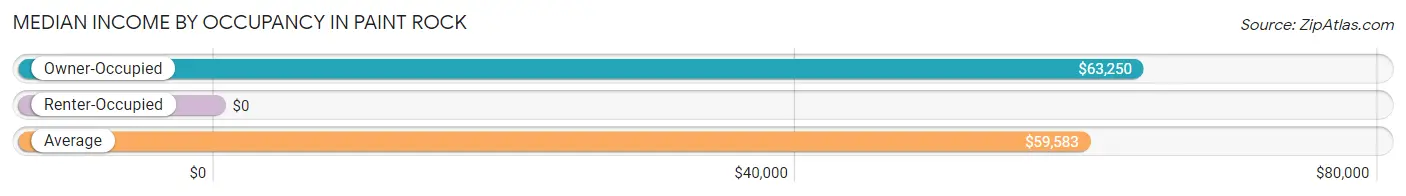
| Occupancy Type | # Households | Median Income |
| Owner-Occupied | 65 (92.9%) | $63,250 |
| Renter-Occupied | 5 (7.1%) | $0 |
| Average | 70 (100.0%) | $59,583 |
Occupancy by Householder Income Bracket in Paint Rock
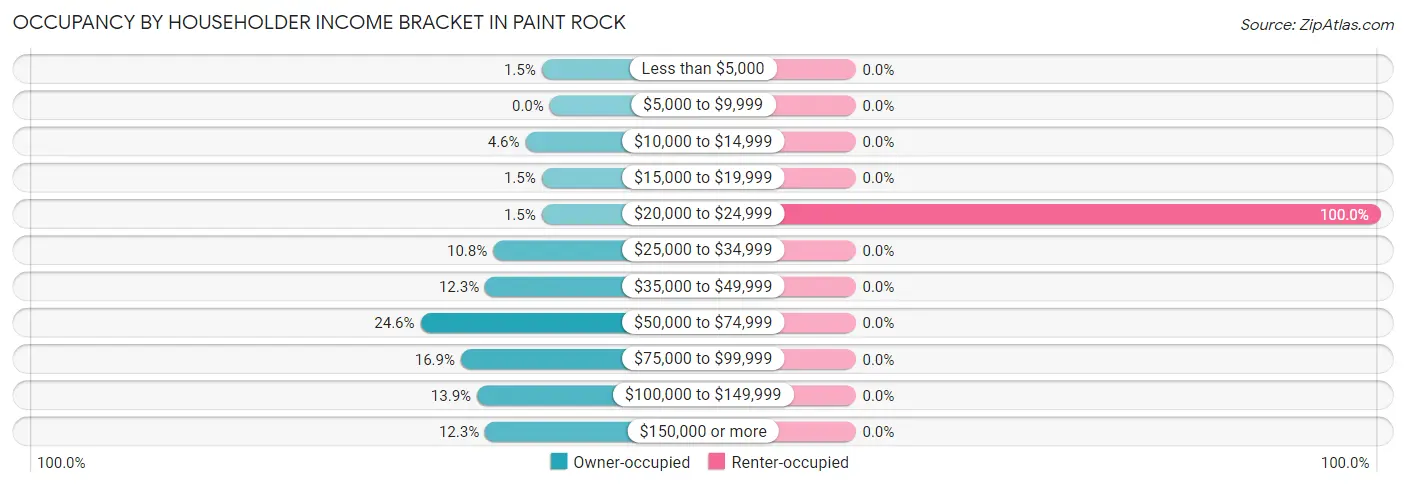
| Income Bracket | Owner-occupied | Renter-occupied |
| Less than $5,000 | 1 (1.5%) | 0 (0.0%) |
| $5,000 to $9,999 | 0 (0.0%) | 0 (0.0%) |
| $10,000 to $14,999 | 3 (4.6%) | 0 (0.0%) |
| $15,000 to $19,999 | 1 (1.5%) | 0 (0.0%) |
| $20,000 to $24,999 | 1 (1.5%) | 5 (100.0%) |
| $25,000 to $34,999 | 7 (10.8%) | 0 (0.0%) |
| $35,000 to $49,999 | 8 (12.3%) | 0 (0.0%) |
| $50,000 to $74,999 | 16 (24.6%) | 0 (0.0%) |
| $75,000 to $99,999 | 11 (16.9%) | 0 (0.0%) |
| $100,000 to $149,999 | 9 (13.9%) | 0 (0.0%) |
| $150,000 or more | 8 (12.3%) | 0 (0.0%) |
| Total | 65 (100.0%) | 5 (100.0%) |
Monthly Housing Cost Tiers in Paint Rock
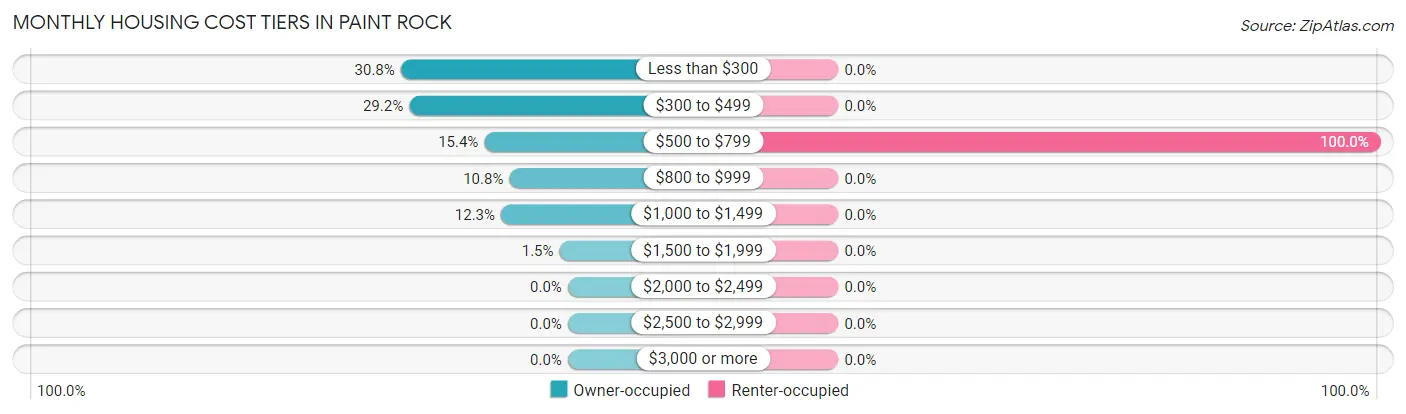
| Monthly Cost | Owner-occupied | Renter-occupied |
| Less than $300 | 20 (30.8%) | 0 (0.0%) |
| $300 to $499 | 19 (29.2%) | 0 (0.0%) |
| $500 to $799 | 10 (15.4%) | 5 (100.0%) |
| $800 to $999 | 7 (10.8%) | 0 (0.0%) |
| $1,000 to $1,499 | 8 (12.3%) | 0 (0.0%) |
| $1,500 to $1,999 | 1 (1.5%) | 0 (0.0%) |
| $2,000 to $2,499 | 0 (0.0%) | 0 (0.0%) |
| $2,500 to $2,999 | 0 (0.0%) | 0 (0.0%) |
| $3,000 or more | 0 (0.0%) | 0 (0.0%) |
| Total | 65 (100.0%) | 5 (100.0%) |
Physical Housing Characteristics in Paint Rock
Housing Structures in Paint Rock
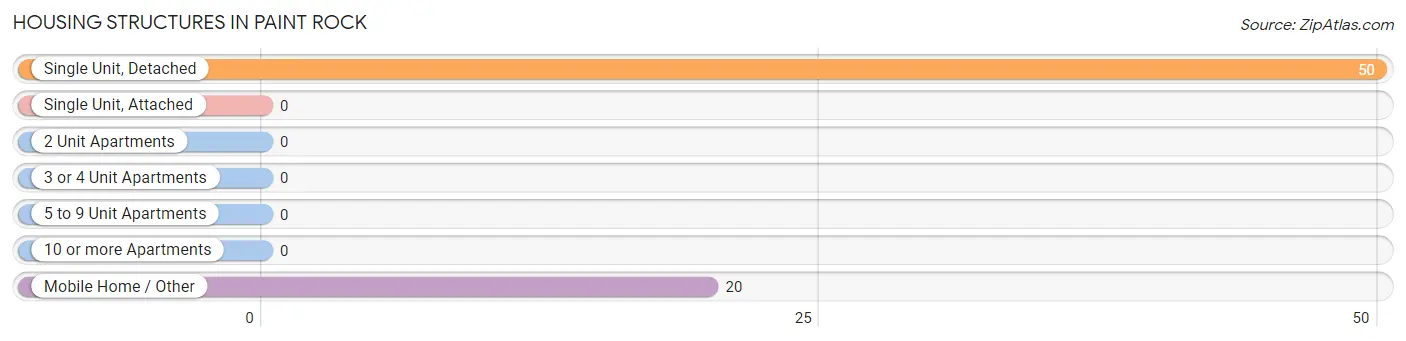
| Structure Type | # Housing Units | % Housing Units |
| Single Unit, Detached | 50 | 71.4% |
| Single Unit, Attached | 0 | 0.0% |
| 2 Unit Apartments | 0 | 0.0% |
| 3 or 4 Unit Apartments | 0 | 0.0% |
| 5 to 9 Unit Apartments | 0 | 0.0% |
| 10 or more Apartments | 0 | 0.0% |
| Mobile Home / Other | 20 | 28.6% |
| Total | 70 | 100.0% |
Housing Structures by Occupancy in Paint Rock
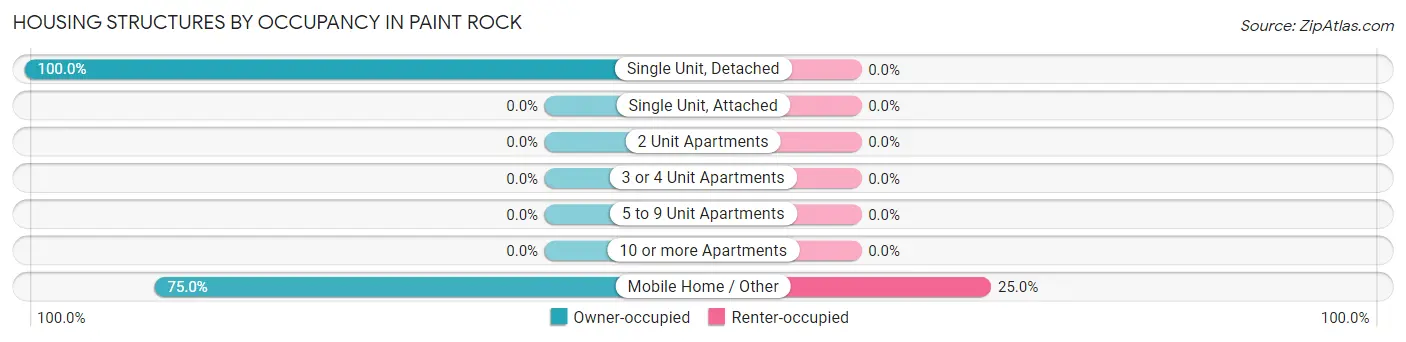
| Structure Type | Owner-occupied | Renter-occupied |
| Single Unit, Detached | 50 (100.0%) | 0 (0.0%) |
| Single Unit, Attached | 0 (0.0%) | 0 (0.0%) |
| 2 Unit Apartments | 0 (0.0%) | 0 (0.0%) |
| 3 or 4 Unit Apartments | 0 (0.0%) | 0 (0.0%) |
| 5 to 9 Unit Apartments | 0 (0.0%) | 0 (0.0%) |
| 10 or more Apartments | 0 (0.0%) | 0 (0.0%) |
| Mobile Home / Other | 15 (75.0%) | 5 (25.0%) |
| Total | 65 (92.9%) | 5 (7.1%) |
Housing Structures by Number of Rooms in Paint Rock
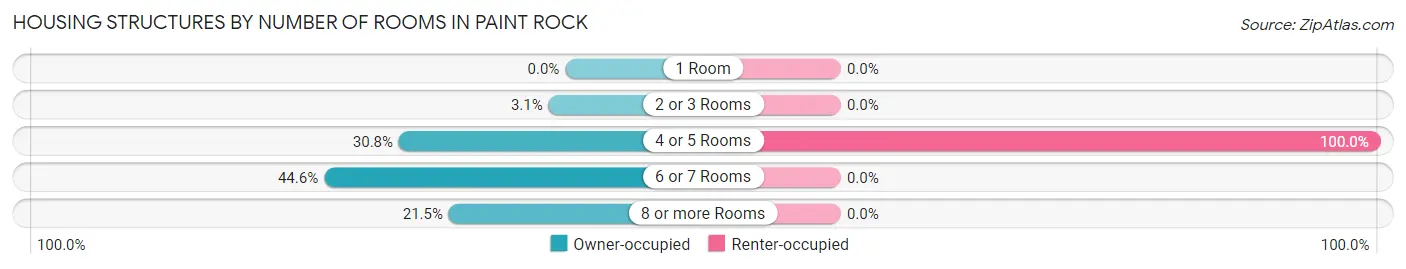
| Number of Rooms | Owner-occupied | Renter-occupied |
| 1 Room | 0 (0.0%) | 0 (0.0%) |
| 2 or 3 Rooms | 2 (3.1%) | 0 (0.0%) |
| 4 or 5 Rooms | 20 (30.8%) | 5 (100.0%) |
| 6 or 7 Rooms | 29 (44.6%) | 0 (0.0%) |
| 8 or more Rooms | 14 (21.5%) | 0 (0.0%) |
| Total | 65 (100.0%) | 5 (100.0%) |
Housing Structure by Heating Type in Paint Rock
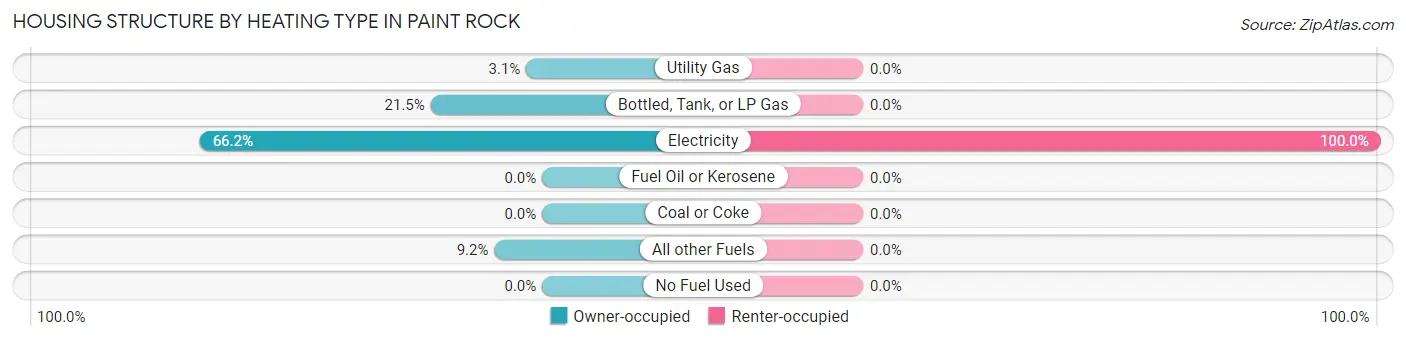
| Heating Type | Owner-occupied | Renter-occupied |
| Utility Gas | 2 (3.1%) | 0 (0.0%) |
| Bottled, Tank, or LP Gas | 14 (21.5%) | 0 (0.0%) |
| Electricity | 43 (66.1%) | 5 (100.0%) |
| Fuel Oil or Kerosene | 0 (0.0%) | 0 (0.0%) |
| Coal or Coke | 0 (0.0%) | 0 (0.0%) |
| All other Fuels | 6 (9.2%) | 0 (0.0%) |
| No Fuel Used | 0 (0.0%) | 0 (0.0%) |
| Total | 65 (100.0%) | 5 (100.0%) |
Household Vehicle Usage in Paint Rock
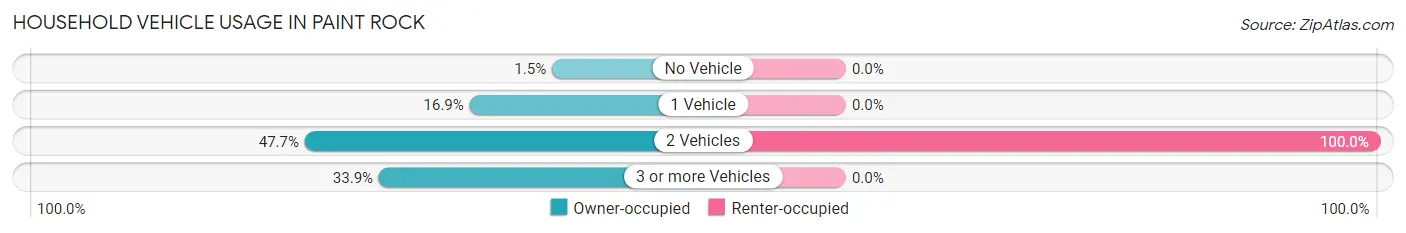
| Vehicles per Household | Owner-occupied | Renter-occupied |
| No Vehicle | 1 (1.5%) | 0 (0.0%) |
| 1 Vehicle | 11 (16.9%) | 0 (0.0%) |
| 2 Vehicles | 31 (47.7%) | 5 (100.0%) |
| 3 or more Vehicles | 22 (33.9%) | 0 (0.0%) |
| Total | 65 (100.0%) | 5 (100.0%) |
Real Estate & Mortgages in Paint Rock
Real Estate and Mortgage Overview in Paint Rock
| Characteristic | Without Mortgage | With Mortgage |
| Housing Units | 45 | 20 |
| Median Property Value | $54,300 | $86,700 |
| Median Household Income | $59,375 | $1 |
| Monthly Housing Costs | $316 | $0 |
| Real Estate Taxes | $199 | $2 |
Property Value by Mortgage Status in Paint Rock
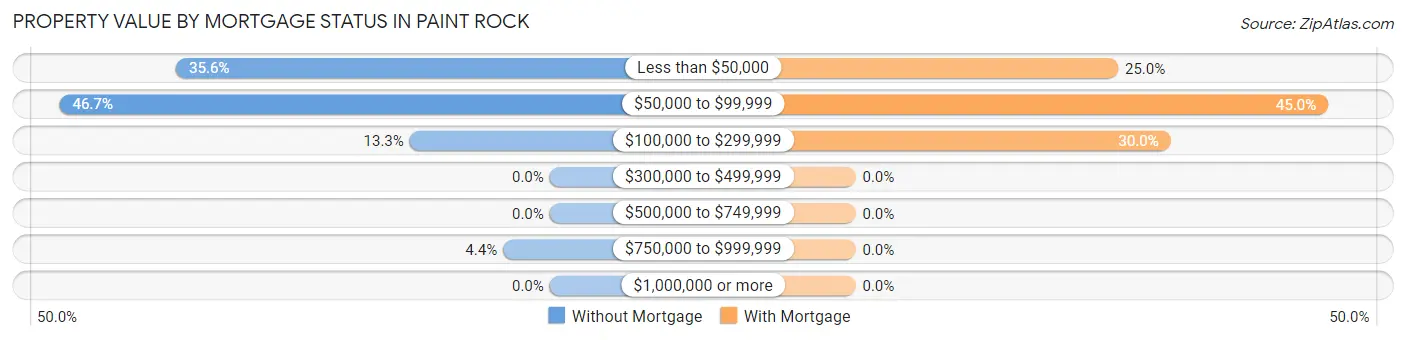
| Property Value | Without Mortgage | With Mortgage |
| Less than $50,000 | 16 (35.6%) | 5 (25.0%) |
| $50,000 to $99,999 | 21 (46.7%) | 9 (45.0%) |
| $100,000 to $299,999 | 6 (13.3%) | 6 (30.0%) |
| $300,000 to $499,999 | 0 (0.0%) | 0 (0.0%) |
| $500,000 to $749,999 | 0 (0.0%) | 0 (0.0%) |
| $750,000 to $999,999 | 2 (4.4%) | 0 (0.0%) |
| $1,000,000 or more | 0 (0.0%) | 0 (0.0%) |
| Total | 45 (100.0%) | 20 (100.0%) |
Household Income by Mortgage Status in Paint Rock
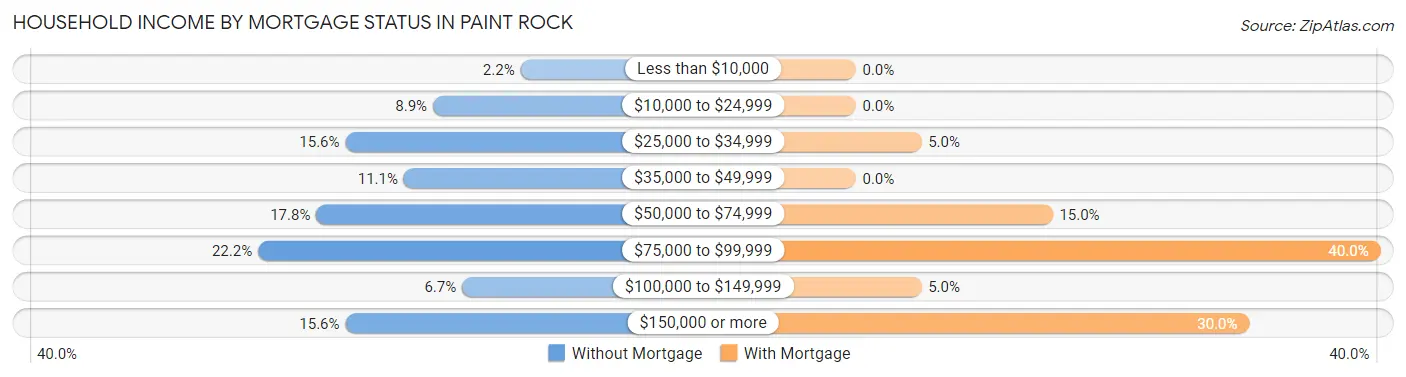
| Household Income | Without Mortgage | With Mortgage |
| Less than $10,000 | 1 (2.2%) | 0 (0.0%) |
| $10,000 to $24,999 | 4 (8.9%) | 0 (0.0%) |
| $25,000 to $34,999 | 7 (15.6%) | 1 (5.0%) |
| $35,000 to $49,999 | 5 (11.1%) | 0 (0.0%) |
| $50,000 to $74,999 | 8 (17.8%) | 3 (15.0%) |
| $75,000 to $99,999 | 10 (22.2%) | 8 (40.0%) |
| $100,000 to $149,999 | 3 (6.7%) | 1 (5.0%) |
| $150,000 or more | 7 (15.6%) | 6 (30.0%) |
| Total | 45 (100.0%) | 20 (100.0%) |
Property Value to Household Income Ratio in Paint Rock
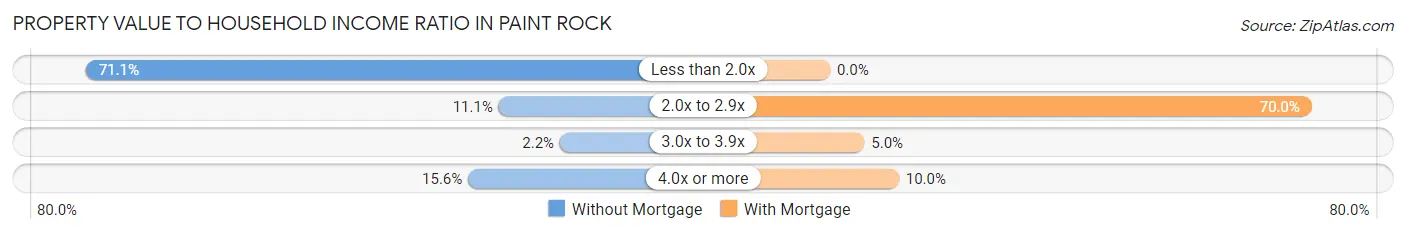
| Value-to-Income Ratio | Without Mortgage | With Mortgage |
| Less than 2.0x | 32 (71.1%) | 0 (0.0%) |
| 2.0x to 2.9x | 5 (11.1%) | 14 (70.0%) |
| 3.0x to 3.9x | 1 (2.2%) | 1 (5.0%) |
| 4.0x or more | 7 (15.6%) | 2 (10.0%) |
| Total | 45 (100.0%) | 20 (100.0%) |
Real Estate Taxes by Mortgage Status in Paint Rock
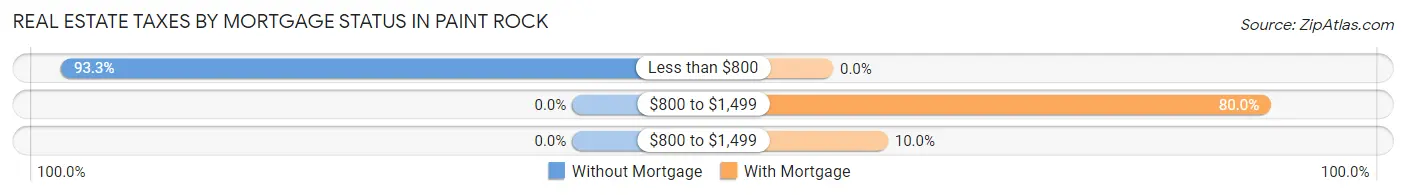
| Property Taxes | Without Mortgage | With Mortgage |
| Less than $800 | 42 (93.3%) | 0 (0.0%) |
| $800 to $1,499 | 0 (0.0%) | 16 (80.0%) |
| $800 to $1,499 | 0 (0.0%) | 2 (10.0%) |
| Total | 45 (100.0%) | 20 (100.0%) |
Health & Disability in Paint Rock
Health Insurance Coverage by Age in Paint Rock
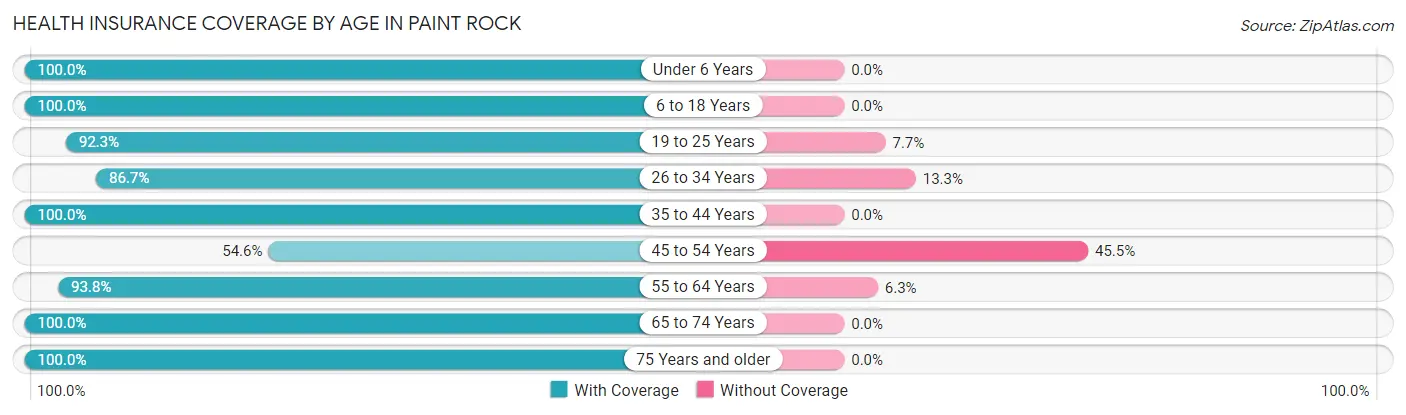
| Age Bracket | With Coverage | Without Coverage |
| Under 6 Years | 22 (100.0%) | 0 (0.0%) |
| 6 to 18 Years | 22 (100.0%) | 0 (0.0%) |
| 19 to 25 Years | 24 (92.3%) | 2 (7.7%) |
| 26 to 34 Years | 13 (86.7%) | 2 (13.3%) |
| 35 to 44 Years | 26 (100.0%) | 0 (0.0%) |
| 45 to 54 Years | 6 (54.5%) | 5 (45.5%) |
| 55 to 64 Years | 45 (93.8%) | 3 (6.2%) |
| 65 to 74 Years | 30 (100.0%) | 0 (0.0%) |
| 75 Years and older | 5 (100.0%) | 0 (0.0%) |
| Total | 193 (94.2%) | 12 (5.9%) |
Health Insurance Coverage by Citizenship Status in Paint Rock
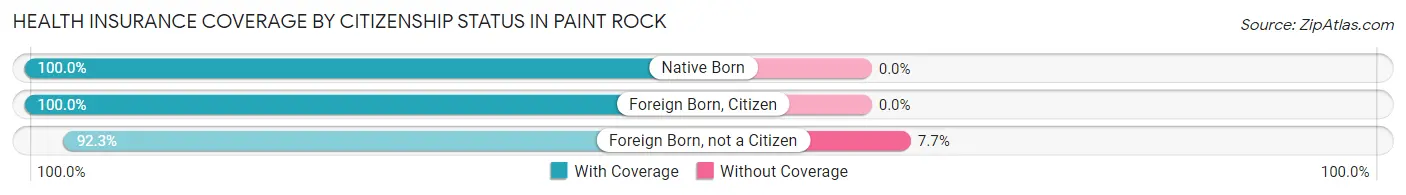
| Citizenship Status | With Coverage | Without Coverage |
| Native Born | 22 (100.0%) | 0 (0.0%) |
| Foreign Born, Citizen | 22 (100.0%) | 0 (0.0%) |
| Foreign Born, not a Citizen | 24 (92.3%) | 2 (7.7%) |
Health Insurance Coverage by Household Income in Paint Rock
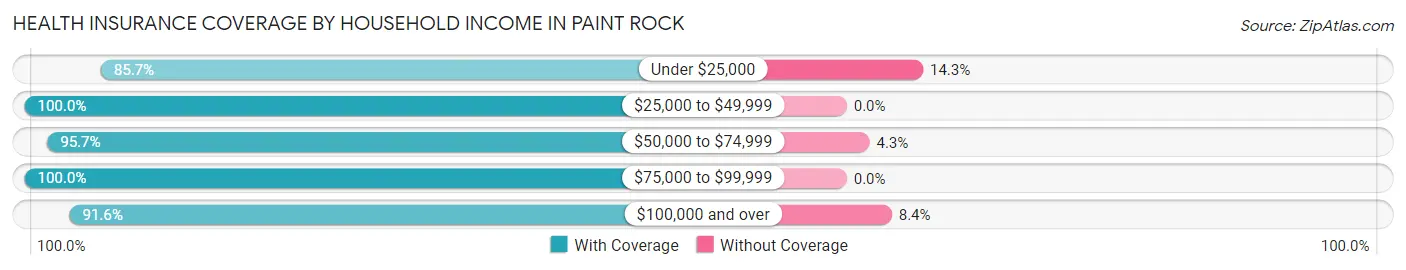
| Household Income | With Coverage | Without Coverage |
| Under $25,000 | 18 (85.7%) | 3 (14.3%) |
| $25,000 to $49,999 | 39 (100.0%) | 0 (0.0%) |
| $50,000 to $74,999 | 45 (95.7%) | 2 (4.3%) |
| $75,000 to $99,999 | 15 (100.0%) | 0 (0.0%) |
| $100,000 and over | 76 (91.6%) | 7 (8.4%) |
Public vs Private Health Insurance Coverage by Age in Paint Rock
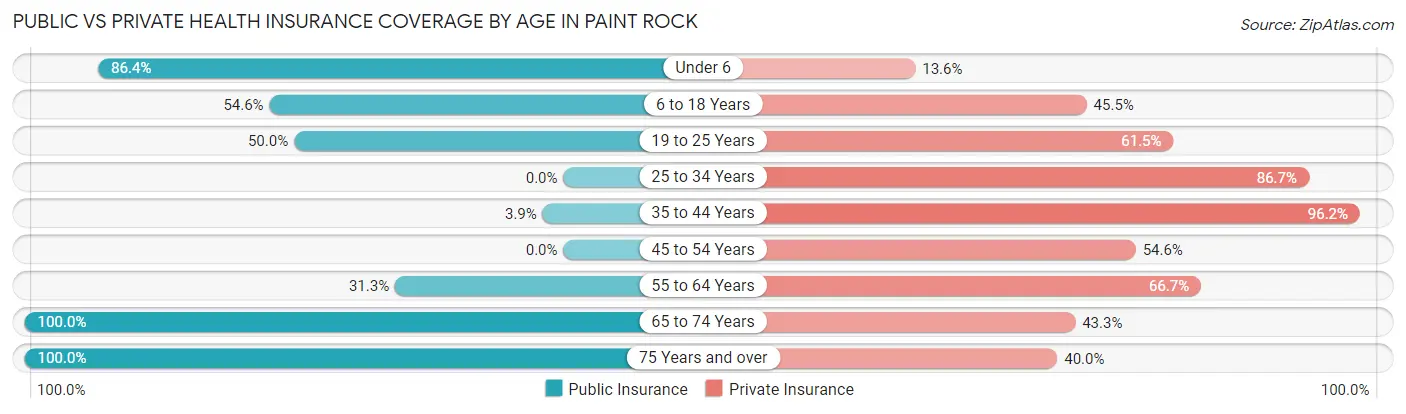
| Age Bracket | Public Insurance | Private Insurance |
| Under 6 | 19 (86.4%) | 3 (13.6%) |
| 6 to 18 Years | 12 (54.5%) | 10 (45.5%) |
| 19 to 25 Years | 13 (50.0%) | 16 (61.5%) |
| 25 to 34 Years | 0 (0.0%) | 13 (86.7%) |
| 35 to 44 Years | 1 (3.8%) | 25 (96.2%) |
| 45 to 54 Years | 0 (0.0%) | 6 (54.5%) |
| 55 to 64 Years | 15 (31.2%) | 32 (66.7%) |
| 65 to 74 Years | 30 (100.0%) | 13 (43.3%) |
| 75 Years and over | 5 (100.0%) | 2 (40.0%) |
| Total | 95 (46.3%) | 120 (58.5%) |
Disability Status by Sex by Age in Paint Rock
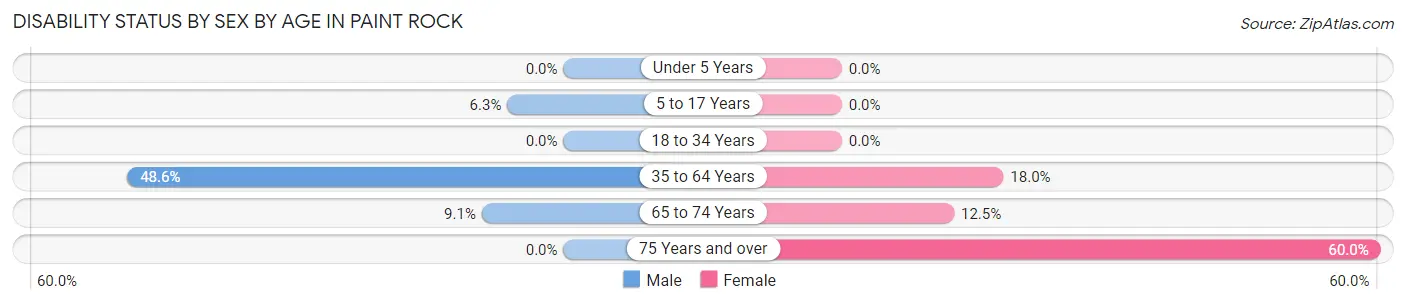
| Age Bracket | Male | Female |
| Under 5 Years | 0 (0.0%) | 0 (0.0%) |
| 5 to 17 Years | 1 (6.2%) | 0 (0.0%) |
| 18 to 34 Years | 0 (0.0%) | 0 (0.0%) |
| 35 to 64 Years | 17 (48.6%) | 9 (18.0%) |
| 65 to 74 Years | 2 (9.1%) | 1 (12.5%) |
| 75 Years and over | 0 (0.0%) | 3 (60.0%) |
Disability Class by Sex by Age in Paint Rock
Disability Class: Hearing Difficulty
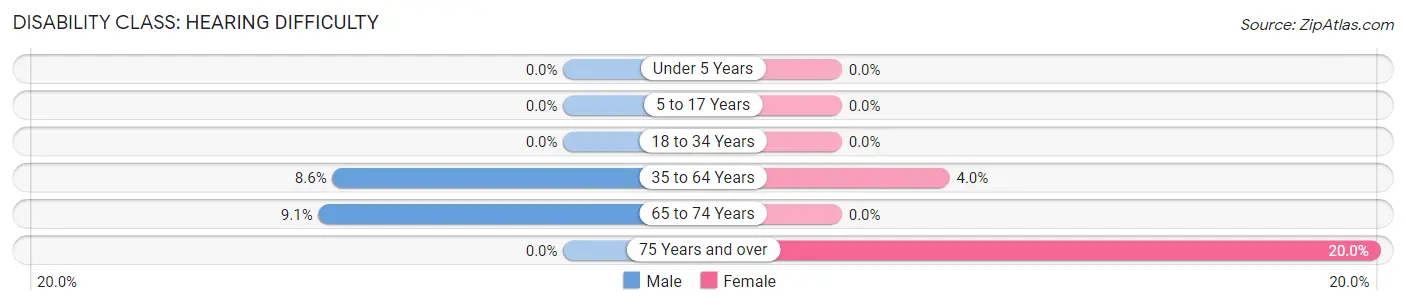
| Age Bracket | Male | Female |
| Under 5 Years | 0 (0.0%) | 0 (0.0%) |
| 5 to 17 Years | 0 (0.0%) | 0 (0.0%) |
| 18 to 34 Years | 0 (0.0%) | 0 (0.0%) |
| 35 to 64 Years | 3 (8.6%) | 2 (4.0%) |
| 65 to 74 Years | 2 (9.1%) | 0 (0.0%) |
| 75 Years and over | 0 (0.0%) | 1 (20.0%) |
Disability Class: Vision Difficulty
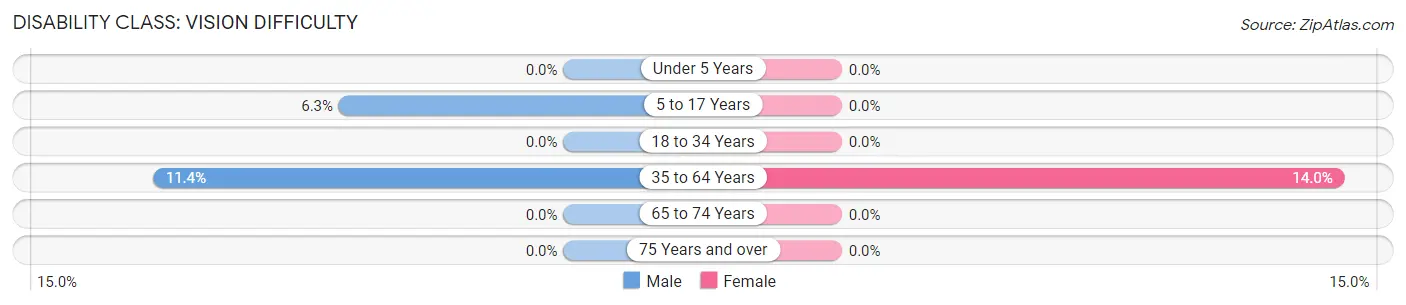
| Age Bracket | Male | Female |
| Under 5 Years | 0 (0.0%) | 0 (0.0%) |
| 5 to 17 Years | 1 (6.2%) | 0 (0.0%) |
| 18 to 34 Years | 0 (0.0%) | 0 (0.0%) |
| 35 to 64 Years | 4 (11.4%) | 7 (14.0%) |
| 65 to 74 Years | 0 (0.0%) | 0 (0.0%) |
| 75 Years and over | 0 (0.0%) | 0 (0.0%) |
Disability Class: Cognitive Difficulty
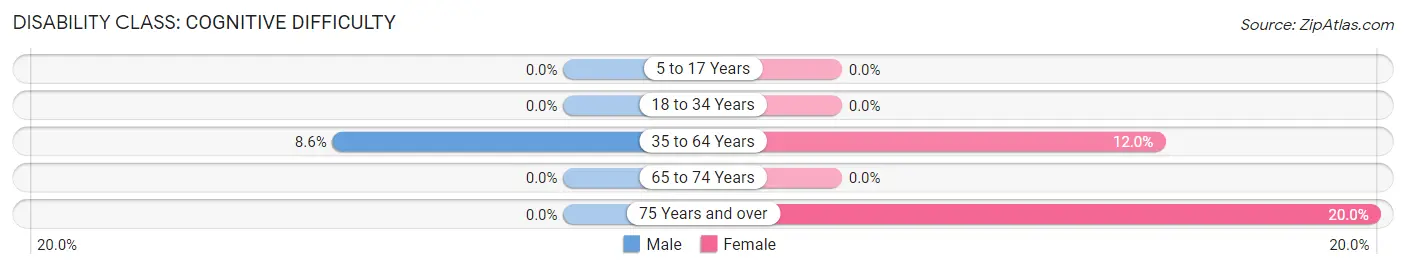
| Age Bracket | Male | Female |
| 5 to 17 Years | 0 (0.0%) | 0 (0.0%) |
| 18 to 34 Years | 0 (0.0%) | 0 (0.0%) |
| 35 to 64 Years | 3 (8.6%) | 6 (12.0%) |
| 65 to 74 Years | 0 (0.0%) | 0 (0.0%) |
| 75 Years and over | 0 (0.0%) | 1 (20.0%) |
Disability Class: Ambulatory Difficulty
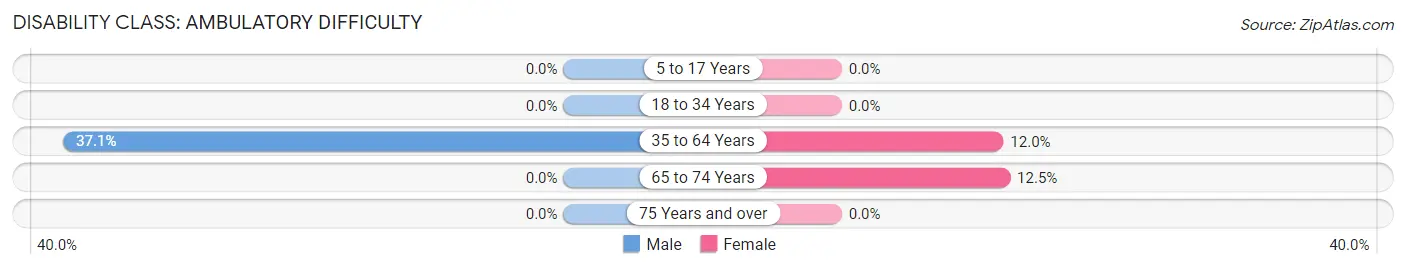
| Age Bracket | Male | Female |
| 5 to 17 Years | 0 (0.0%) | 0 (0.0%) |
| 18 to 34 Years | 0 (0.0%) | 0 (0.0%) |
| 35 to 64 Years | 13 (37.1%) | 6 (12.0%) |
| 65 to 74 Years | 0 (0.0%) | 1 (12.5%) |
| 75 Years and over | 0 (0.0%) | 0 (0.0%) |
Disability Class: Self-Care Difficulty

| Age Bracket | Male | Female |
| 5 to 17 Years | 0 (0.0%) | 0 (0.0%) |
| 18 to 34 Years | 0 (0.0%) | 0 (0.0%) |
| 35 to 64 Years | 3 (8.6%) | 6 (12.0%) |
| 65 to 74 Years | 0 (0.0%) | 0 (0.0%) |
| 75 Years and over | 0 (0.0%) | 0 (0.0%) |
Technology Access in Paint Rock
Computing Device Access in Paint Rock
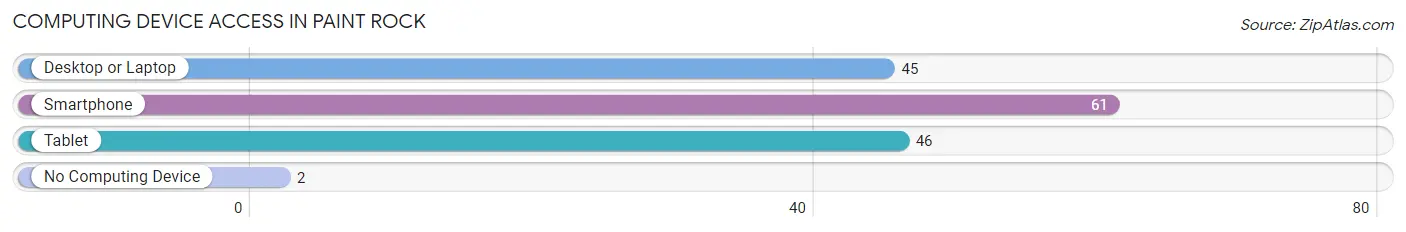
| Device Type | # Households | % Households |
| Desktop or Laptop | 45 | 64.3% |
| Smartphone | 61 | 87.1% |
| Tablet | 46 | 65.7% |
| No Computing Device | 2 | 2.9% |
| Total | 70 | 100.0% |
Internet Access in Paint Rock
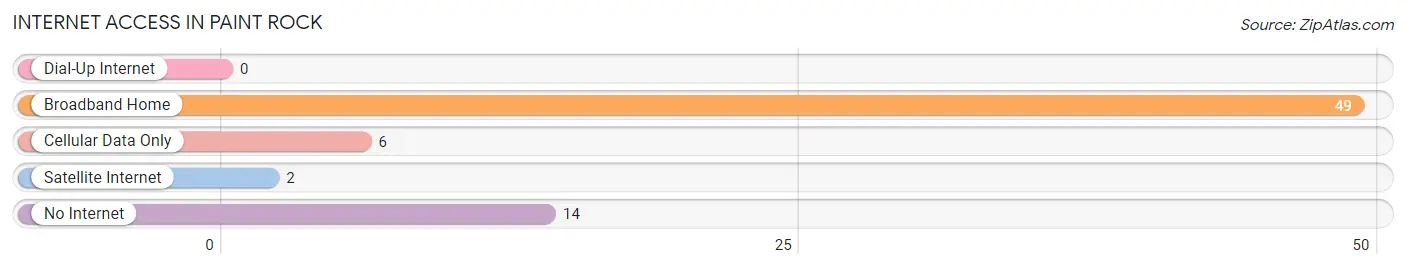
| Internet Type | # Households | % Households |
| Dial-Up Internet | 0 | 0.0% |
| Broadband Home | 49 | 70.0% |
| Cellular Data Only | 6 | 8.6% |
| Satellite Internet | 2 | 2.9% |
| No Internet | 14 | 20.0% |
| Total | 70 | 100.0% |
Paint Rock Summary
Paint Rock is a small unincorporated community located in Jackson County, Alabama. It is situated in the foothills of the Appalachian Mountains, approximately 20 miles east of Scottsboro. The town is named for a large rock formation located nearby, which was painted by Native Americans centuries ago.
History
The area around Paint Rock has been inhabited for thousands of years. Archaeological evidence suggests that Native Americans lived in the area as early as the Archaic period (8000-1000 BC). The Cherokee and Creek tribes were the most prominent in the area during the 18th and 19th centuries.
The first European settlers arrived in the area in the early 1800s. The town of Paint Rock was established in 1820 and was named for the nearby rock formation. The town was a popular stop on the stagecoach route between Chattanooga and Huntsville.
In the late 19th century, the town became a center for the timber industry. The town was also home to several gristmills, sawmills, and a cotton gin.
Geography
Paint Rock is located in the foothills of the Appalachian Mountains in Jackson County, Alabama. The town is situated at the intersection of Alabama State Route 65 and Alabama State Route 79. The town is approximately 20 miles east of Scottsboro and 40 miles west of Chattanooga, Tennessee.
The town is located in a hilly area with elevations ranging from 800 to 1,000 feet above sea level. The area is heavily forested with oak, hickory, and pine trees. Paint Rock Creek, a tributary of the Tennessee River, runs through the town.
Economy
The economy of Paint Rock is largely based on agriculture and forestry. The town is home to several farms that produce corn, soybeans, and hay. The timber industry is also an important part of the local economy.
The town is also home to several small businesses, including a grocery store, a hardware store, and a gas station.
Demographics
As of the 2010 census, the population of Paint Rock was 545. The racial makeup of the town was 97.3% White, 0.7% African American, 0.2% Native American, 0.2% Asian, and 1.6% from other races.
The median household income in Paint Rock was $30,000, and the median family income was $35,000. The per capita income was $14,000. Approximately 17.5% of the population was below the poverty line.
Conclusion
Paint Rock is a small unincorporated community located in Jackson County, Alabama. It is situated in the foothills of the Appalachian Mountains and is home to a diverse population. The town is largely supported by agriculture and forestry, and is home to several small businesses. The town has a rich history and is a popular destination for outdoor recreation.
Common Questions
What is Per Capita Income in Paint Rock?
Per Capita income in Paint Rock is $44,357.
What is the Median Family Income in Paint Rock?
Median Family Income in Paint Rock is $57,500.
What is the Median Household income in Paint Rock?
Median Household Income in Paint Rock is $59,583.
What is Income or Wage Gap in Paint Rock?
Income or Wage Gap in Paint Rock is 39.3%.
Women in Paint Rock earn 60.7 cents for every dollar earned by a man.
What is Inequality or Gini Index in Paint Rock?
Inequality or Gini Index in Paint Rock is 0.55.
What is the Total Population of Paint Rock?
Total Population of Paint Rock is 208.
What is the Total Male Population of Paint Rock?
Total Male Population of Paint Rock is 109.
What is the Total Female Population of Paint Rock?
Total Female Population of Paint Rock is 99.
What is the Ratio of Males per 100 Females in Paint Rock?
There are 110.10 Males per 100 Females in Paint Rock.
What is the Ratio of Females per 100 Males in Paint Rock?
There are 90.83 Females per 100 Males in Paint Rock.
What is the Median Population Age in Paint Rock?
Median Population Age in Paint Rock is 42.3 Years.
What is the Average Family Size in Paint Rock
Average Family Size in Paint Rock is 3.6 People.
What is the Average Household Size in Paint Rock
Average Household Size in Paint Rock is 3.0 People.
How Large is the Labor Force in Paint Rock?
There are 103 People in the Labor Forcein in Paint Rock.
What is the Percentage of People in the Labor Force in Paint Rock?
60.6% of People are in the Labor Force in Paint Rock.
What is the Unemployment Rate in Paint Rock?
Unemployment Rate in Paint Rock is 4.0%.