Munford, AL Map & Demographics
Munford Map
Munford Overview
$23,004
PER CAPITA INCOME
$59,063
AVG FAMILY INCOME
$47,750
AVG HOUSEHOLD INCOME
4.3%
WAGE / INCOME GAP [ % ]
95.7¢/ $1
WAGE / INCOME GAP [ $ ]
0.42
INEQUALITY / GINI INDEX
1,743
TOTAL POPULATION
727
MALE POPULATION
1,016
FEMALE POPULATION
71.56
MALES / 100 FEMALES
139.75
FEMALES / 100 MALES
41.0
MEDIAN AGE
3.0
AVG FAMILY SIZE
2.5
AVG HOUSEHOLD SIZE
848
LABOR FORCE [ PEOPLE ]
59.4%
PERCENT IN LABOR FORCE
7.4%
UNEMPLOYMENT RATE
Munford Zip Codes
Munford Area Codes
Income in Munford
Income Overview in Munford
Per Capita Income in Munford is $23,004, while median incomes of families and households are $59,063 and $47,750 respectively.
| Characteristic | Number | Measure |
| Per Capita Income | 1,743 | $23,004 |
| Median Family Income | 492 | $59,063 |
| Mean Family Income | 492 | $67,112 |
| Median Household Income | 684 | $47,750 |
| Mean Household Income | 684 | $58,051 |
| Income Deficit | 492 | $0 |
| Wage / Income Gap (%) | 1,743 | 4.25% |
| Wage / Income Gap ($) | 1,743 | 95.75¢ per $1 |
| Gini / Inequality Index | 1,743 | 0.42 |
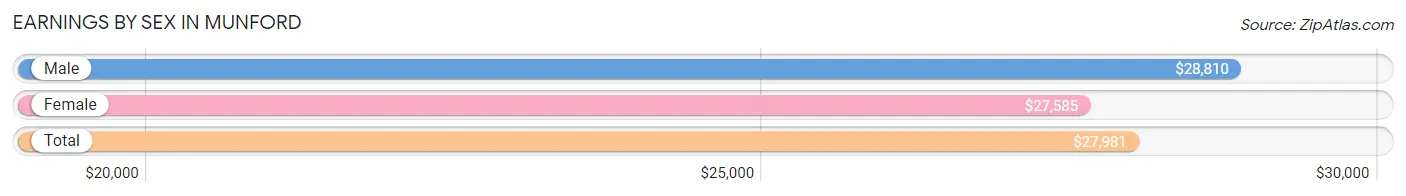
Earnings by Sex in Munford
Average Earnings in Munford are $27,981, $28,810 for men and $27,585 for women, a difference of 4.3%.
| Sex | Number | Average Earnings |
| Male | 354 (42.5%) | $28,810 |
| Female | 479 (57.5%) | $27,585 |
| Total | 833 (100.0%) | $27,981 |
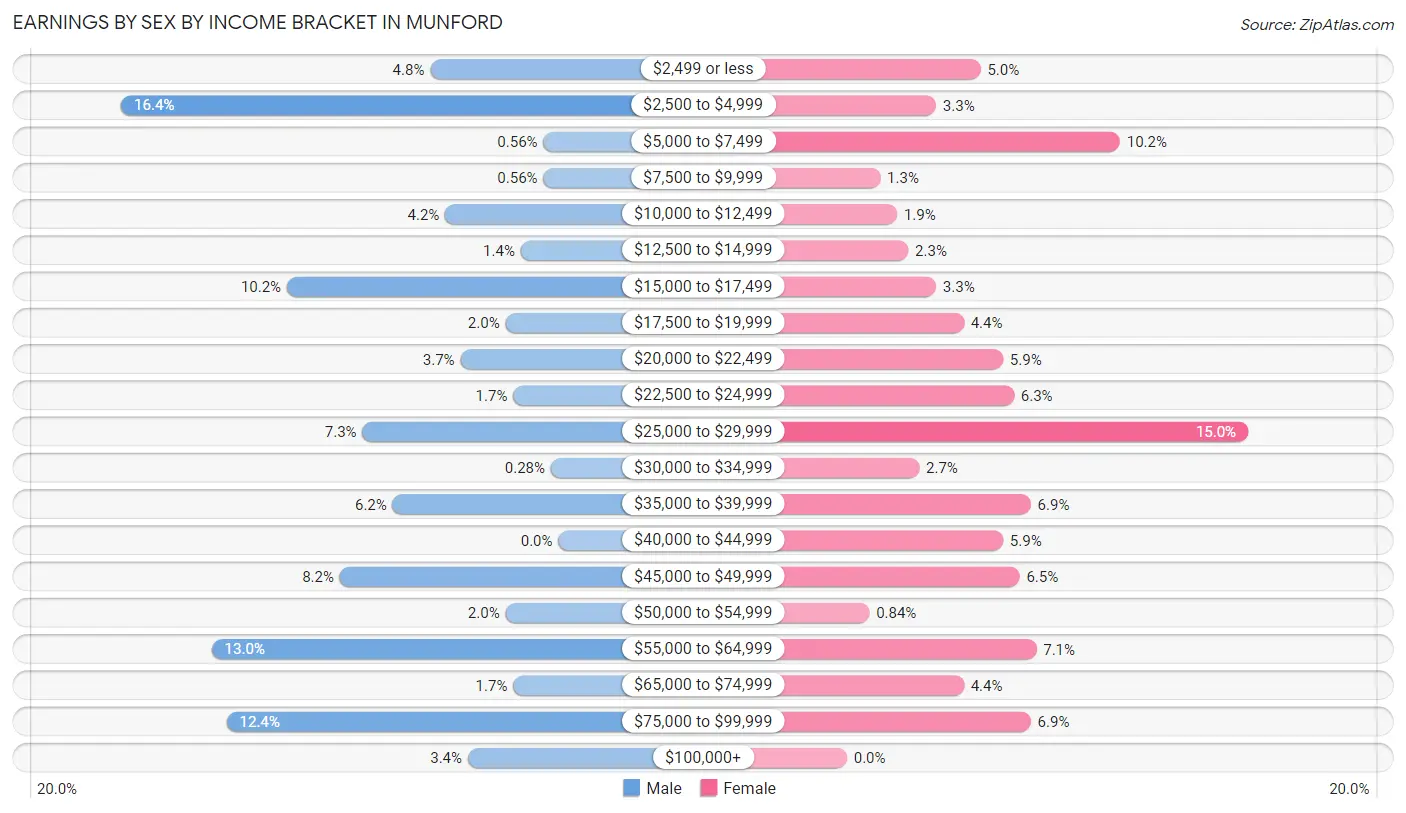
Earnings by Sex by Income Bracket in Munford
The most common earnings brackets in Munford are $2,500 to $4,999 for men (58 | 16.4%) and $25,000 to $29,999 for women (72 | 15.0%).
| Income | Male | Female |
| $2,499 or less | 17 (4.8%) | 24 (5.0%) |
| $2,500 to $4,999 | 58 (16.4%) | 16 (3.3%) |
| $5,000 to $7,499 | 2 (0.6%) | 49 (10.2%) |
| $7,500 to $9,999 | 2 (0.6%) | 6 (1.3%) |
| $10,000 to $12,499 | 15 (4.2%) | 9 (1.9%) |
| $12,500 to $14,999 | 5 (1.4%) | 11 (2.3%) |
| $15,000 to $17,499 | 36 (10.2%) | 16 (3.3%) |
| $17,500 to $19,999 | 7 (2.0%) | 21 (4.4%) |
| $20,000 to $22,499 | 13 (3.7%) | 28 (5.9%) |
| $22,500 to $24,999 | 6 (1.7%) | 30 (6.3%) |
| $25,000 to $29,999 | 26 (7.3%) | 72 (15.0%) |
| $30,000 to $34,999 | 1 (0.3%) | 13 (2.7%) |
| $35,000 to $39,999 | 22 (6.2%) | 33 (6.9%) |
| $40,000 to $44,999 | 0 (0.0%) | 28 (5.9%) |
| $45,000 to $49,999 | 29 (8.2%) | 31 (6.5%) |
| $50,000 to $54,999 | 7 (2.0%) | 4 (0.8%) |
| $55,000 to $64,999 | 46 (13.0%) | 34 (7.1%) |
| $65,000 to $74,999 | 6 (1.7%) | 21 (4.4%) |
| $75,000 to $99,999 | 44 (12.4%) | 33 (6.9%) |
| $100,000+ | 12 (3.4%) | 0 (0.0%) |
| Total | 354 (100.0%) | 479 (100.0%) |
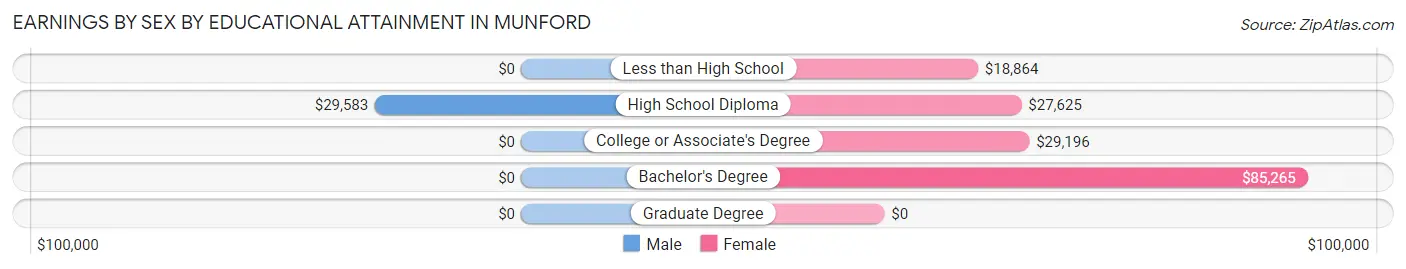
Earnings by Sex by Educational Attainment in Munford
Average earnings in Munford are $36,736 for men and $29,830 for women, a difference of 18.8%. Men with an educational attainment of high school diploma enjoy the highest average annual earnings of $29,583, while those with high school diploma education earn the least with $29,583. Women with an educational attainment of bachelor's degree earn the most with the average annual earnings of $85,265, while those with less than high school education have the smallest earnings of $18,864.
| Educational Attainment | Male Income | Female Income |
| Less than High School | - | - |
| High School Diploma | $29,583 | $27,625 |
| College or Associate's Degree | - | - |
| Bachelor's Degree | - | - |
| Graduate Degree | - | - |
| Total | $36,736 | $29,830 |
Family Income in Munford
Family Income Brackets in Munford
According to the Munford family income data, there are 79 families falling into the $75,000 to $99,999 income range, which is the most common income bracket and makes up 16.1% of all families.
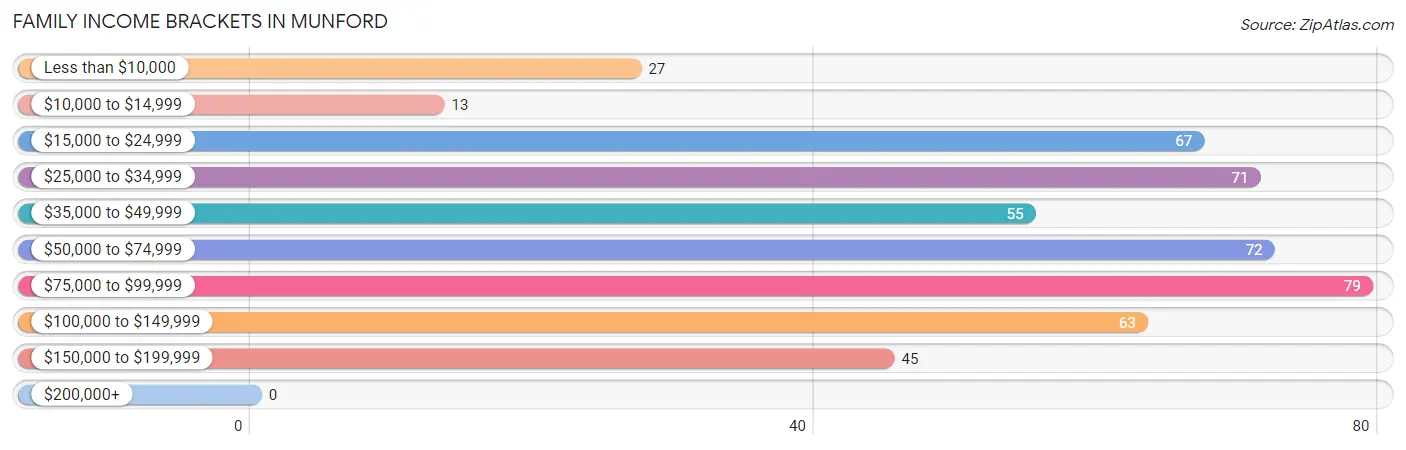
| Income Bracket | # Families | % Families |
| Less than $10,000 | 27 | 5.5% |
| $10,000 to $14,999 | 13 | 2.6% |
| $15,000 to $24,999 | 67 | 13.6% |
| $25,000 to $34,999 | 71 | 14.4% |
| $35,000 to $49,999 | 55 | 11.2% |
| $50,000 to $74,999 | 72 | 14.6% |
| $75,000 to $99,999 | 79 | 16.1% |
| $100,000 to $149,999 | 63 | 12.8% |
| $150,000 to $199,999 | 45 | 9.1% |
| $200,000+ | 0 | 0.0% |
Family Income by Famaliy Size in Munford
3-person families (190 | 38.6%) account for the highest median family income in Munford with $69,750 per family, while 3-person families (190 | 38.6%) have the highest median income of $23,250 per family member.
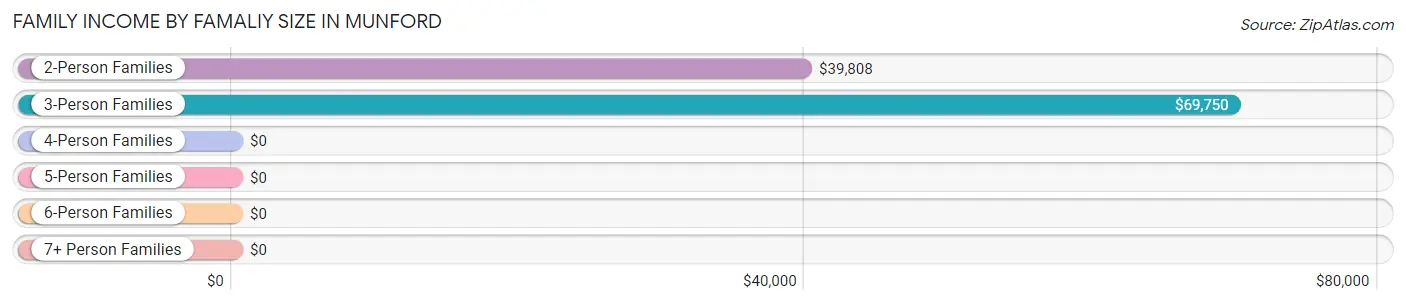
| Income Bracket | # Families | Median Income |
| 2-Person Families | 218 (44.3%) | $39,808 |
| 3-Person Families | 190 (38.6%) | $69,750 |
| 4-Person Families | 30 (6.1%) | $0 |
| 5-Person Families | 32 (6.5%) | $0 |
| 6-Person Families | 8 (1.6%) | $0 |
| 7+ Person Families | 14 (2.9%) | $0 |
| Total | 492 (100.0%) | $59,063 |
Family Income by Number of Earners in Munford
The median family income in Munford is $59,063, with families comprising 2 earners (128) having the highest median family income of $93,636, while families with no earners (77) have the lowest median family income of $33,403, accounting for 26.0% and 15.7% of families, respectively.
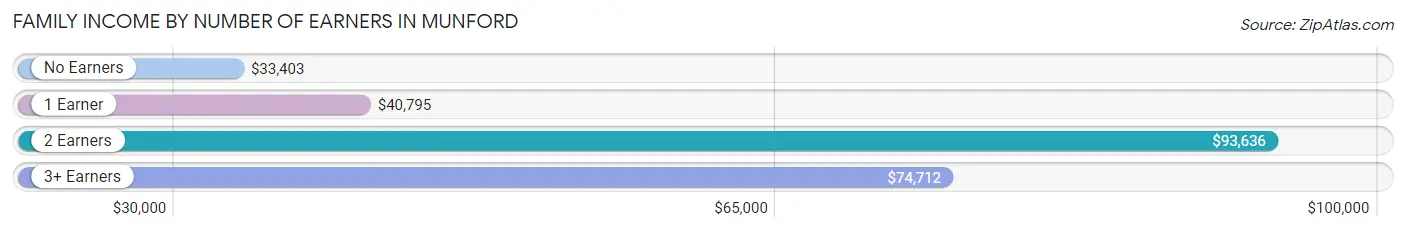
| Number of Earners | # Families | Median Income |
| No Earners | 77 (15.7%) | $33,403 |
| 1 Earner | 213 (43.3%) | $40,795 |
| 2 Earners | 128 (26.0%) | $93,636 |
| 3+ Earners | 74 (15.0%) | $74,712 |
| Total | 492 (100.0%) | $59,063 |
Household Income in Munford
Household Income Brackets in Munford
With 110 households falling in the category, the $25,000 to $34,999 income range is the most frequent in Munford, accounting for 16.1% of all households.
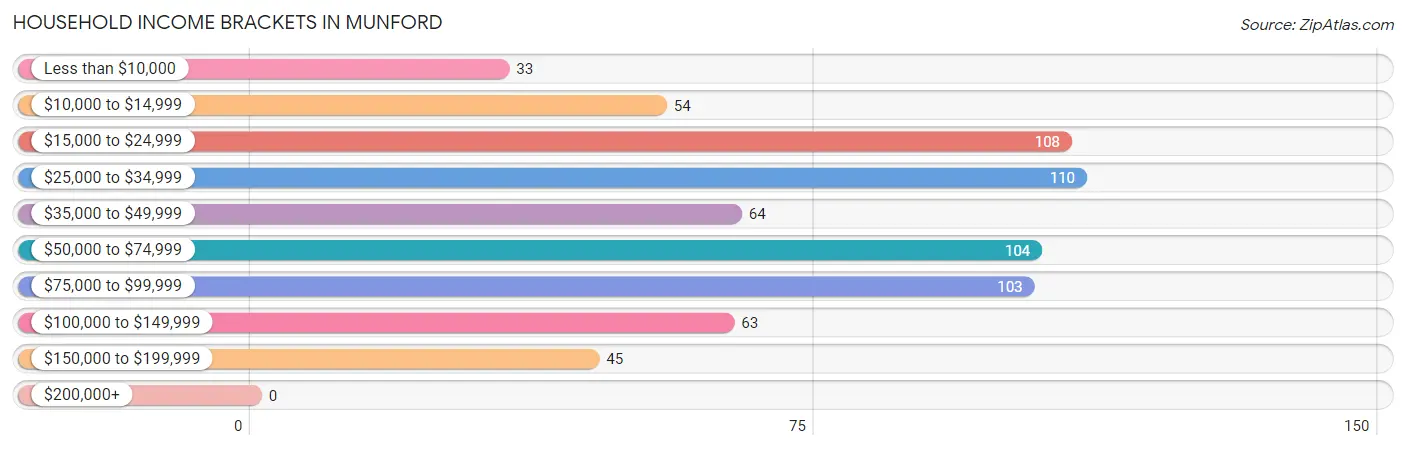
| Income Bracket | # Households | % Households |
| Less than $10,000 | 33 | 4.8% |
| $10,000 to $14,999 | 54 | 7.9% |
| $15,000 to $24,999 | 108 | 15.8% |
| $25,000 to $34,999 | 110 | 16.1% |
| $35,000 to $49,999 | 64 | 9.4% |
| $50,000 to $74,999 | 104 | 15.2% |
| $75,000 to $99,999 | 103 | 15.1% |
| $100,000 to $149,999 | 63 | 9.2% |
| $150,000 to $199,999 | 45 | 6.6% |
| $200,000+ | 0 | 0.0% |
Household Income by Householder Age in Munford
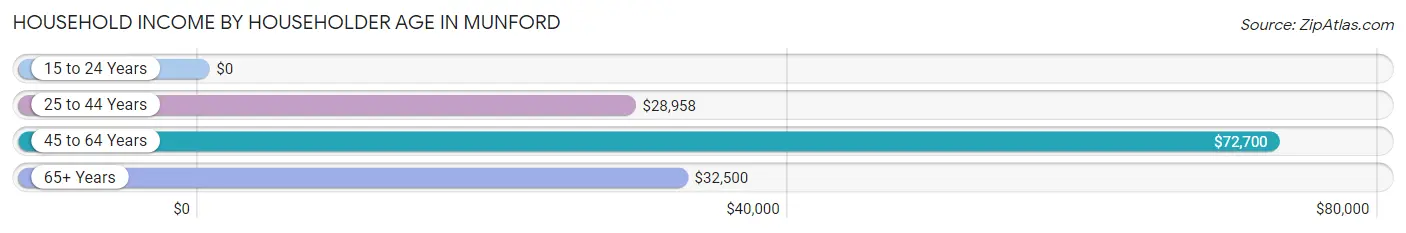
The median household income in Munford is $47,750, with the highest median household income of $72,700 found in the 45 to 64 years age bracket for the primary householder. A total of 248 households (36.3%) fall into this category. Meanwhile, the 15 to 24 years age bracket for the primary householder has the lowest median household income of $0, with 7 households (1.0%) in this group.
| Income Bracket | # Households | Median Income |
| 15 to 24 Years | 7 (1.0%) | $0 |
| 25 to 44 Years | 187 (27.3%) | $28,958 |
| 45 to 64 Years | 248 (36.3%) | $72,700 |
| 65+ Years | 242 (35.4%) | $32,500 |
| Total | 684 (100.0%) | $47,750 |
Poverty in Munford
Income Below Poverty by Sex and Age in Munford
With 21.7% poverty level for males and 33.3% for females among the residents of Munford, 5 year old males and under 5 year old females are the most vulnerable to poverty, with 15 males (88.2%) and 34 females (72.3%) in their respective age groups living below the poverty level.
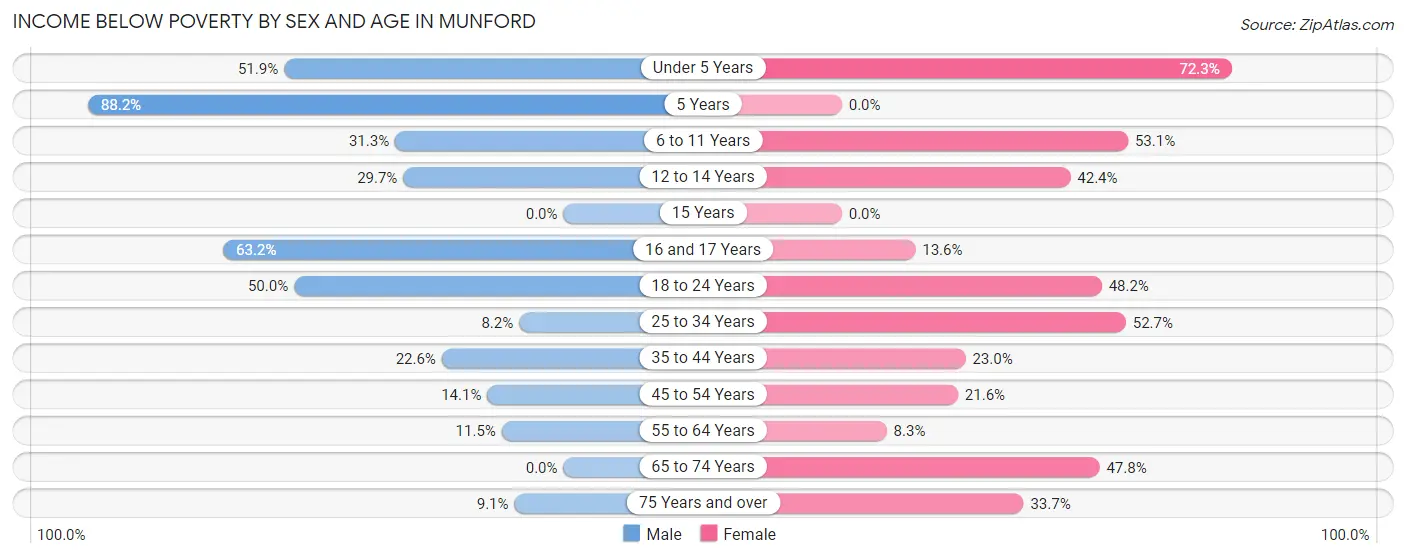
| Age Bracket | Male | Female |
| Under 5 Years | 28 (51.8%) | 34 (72.3%) |
| 5 Years | 15 (88.2%) | 0 (0.0%) |
| 6 to 11 Years | 10 (31.2%) | 17 (53.1%) |
| 12 to 14 Years | 11 (29.7%) | 14 (42.4%) |
| 15 Years | 0 (0.0%) | 0 (0.0%) |
| 16 and 17 Years | 12 (63.2%) | 9 (13.6%) |
| 18 to 24 Years | 28 (50.0%) | 41 (48.2%) |
| 25 to 34 Years | 6 (8.2%) | 68 (52.7%) |
| 35 to 44 Years | 14 (22.6%) | 31 (23.0%) |
| 45 to 54 Years | 13 (14.1%) | 39 (21.5%) |
| 55 to 64 Years | 15 (11.5%) | 7 (8.3%) |
| 65 to 74 Years | 0 (0.0%) | 44 (47.8%) |
| 75 Years and over | 6 (9.1%) | 29 (33.7%) |
| Total | 158 (21.7%) | 333 (33.3%) |
Income Above Poverty by Sex and Age in Munford
According to the poverty statistics in Munford, males aged 15 years and females aged 15 years are the age groups that are most secure financially, with 100.0% of males and 100.0% of females in these age groups living above the poverty line.
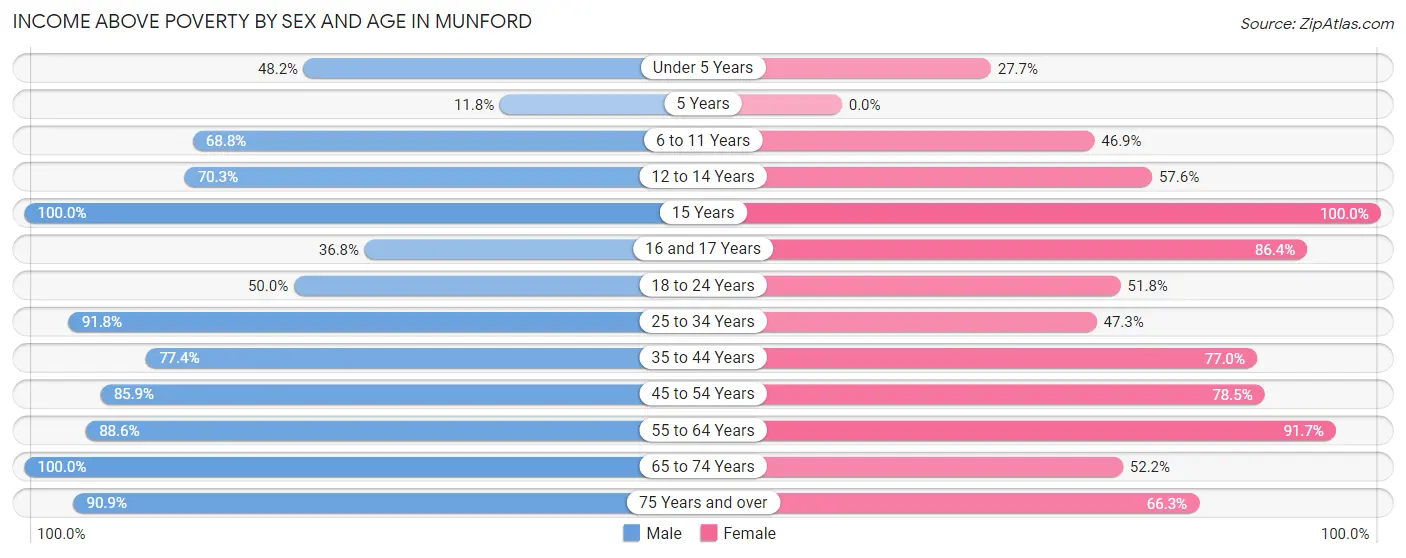
| Age Bracket | Male | Female |
| Under 5 Years | 26 (48.1%) | 13 (27.7%) |
| 5 Years | 2 (11.8%) | 0 (0.0%) |
| 6 to 11 Years | 22 (68.8%) | 15 (46.9%) |
| 12 to 14 Years | 26 (70.3%) | 19 (57.6%) |
| 15 Years | 18 (100.0%) | 31 (100.0%) |
| 16 and 17 Years | 7 (36.8%) | 57 (86.4%) |
| 18 to 24 Years | 28 (50.0%) | 44 (51.8%) |
| 25 to 34 Years | 67 (91.8%) | 61 (47.3%) |
| 35 to 44 Years | 48 (77.4%) | 104 (77.0%) |
| 45 to 54 Years | 79 (85.9%) | 142 (78.4%) |
| 55 to 64 Years | 116 (88.5%) | 77 (91.7%) |
| 65 to 74 Years | 70 (100.0%) | 48 (52.2%) |
| 75 Years and over | 60 (90.9%) | 57 (66.3%) |
| Total | 569 (78.3%) | 668 (66.7%) |
Income Below Poverty Among Married-Couple Families in Munford
The poverty statistics for married-couple families in Munford show that 2.7% or 7 of the total 262 families live below the poverty line. Families with 1 or 2 children have the highest poverty rate of 6.5%, comprising of 7 families. On the other hand, families with no children have the lowest poverty rate of 0.0%, which includes 0 families.
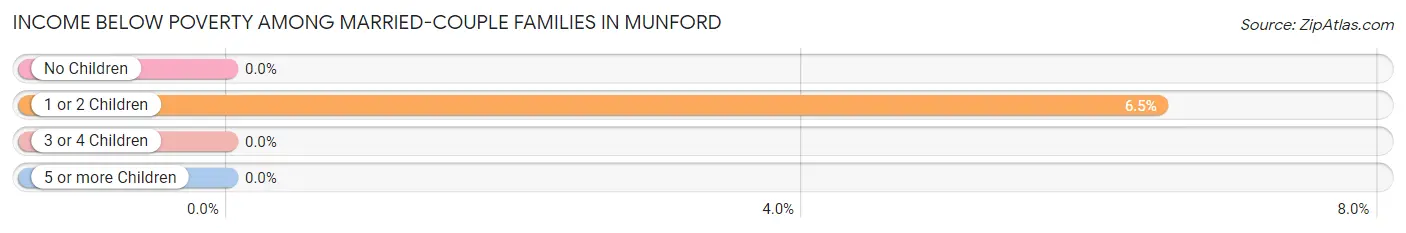
| Children | Above Poverty | Below Poverty |
| No Children | 145 (100.0%) | 0 (0.0%) |
| 1 or 2 Children | 101 (93.5%) | 7 (6.5%) |
| 3 or 4 Children | 9 (100.0%) | 0 (0.0%) |
| 5 or more Children | 0 (0.0%) | 0 (0.0%) |
| Total | 255 (97.3%) | 7 (2.7%) |
Income Below Poverty Among Single-Parent Households in Munford
According to the poverty data in Munford, 36.8% or 25 single-father households and 51.8% or 84 single-mother households are living below the poverty line. Among single-father households, those with 1 or 2 children have the highest poverty rate, with 19 households (38.0%) experiencing poverty. Likewise, among single-mother households, those with 3 or 4 children have the highest poverty rate, with 14 households (100.0%) falling below the poverty line.
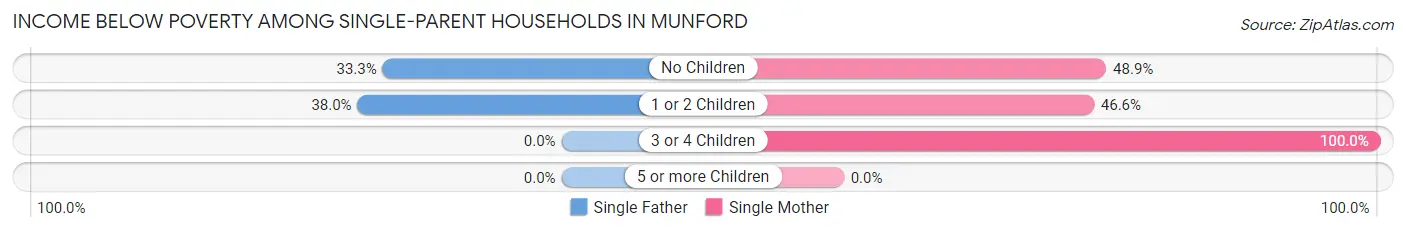
| Children | Single Father | Single Mother |
| No Children | 6 (33.3%) | 22 (48.9%) |
| 1 or 2 Children | 19 (38.0%) | 48 (46.6%) |
| 3 or 4 Children | 0 (0.0%) | 14 (100.0%) |
| 5 or more Children | 0 (0.0%) | 0 (0.0%) |
| Total | 25 (36.8%) | 84 (51.8%) |
Income Below Poverty Among Married-Couple vs Single-Parent Households in Munford
The poverty data for Munford shows that 7 of the married-couple family households (2.7%) and 109 of the single-parent households (47.4%) are living below the poverty level. Within the married-couple family households, those with 1 or 2 children have the highest poverty rate, with 7 households (6.5%) falling below the poverty line. Among the single-parent households, those with 3 or 4 children have the highest poverty rate, with 14 household (100.0%) living below poverty.
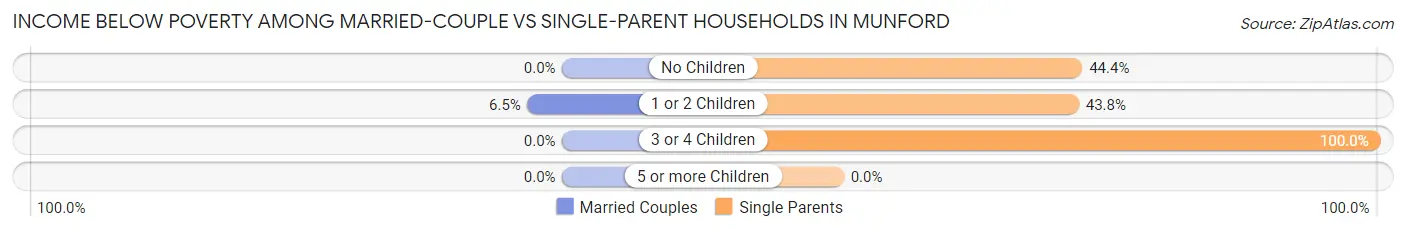
| Children | Married-Couple Families | Single-Parent Households |
| No Children | 0 (0.0%) | 28 (44.4%) |
| 1 or 2 Children | 7 (6.5%) | 67 (43.8%) |
| 3 or 4 Children | 0 (0.0%) | 14 (100.0%) |
| 5 or more Children | 0 (0.0%) | 0 (0.0%) |
| Total | 7 (2.7%) | 109 (47.4%) |
Race in Munford
The most populous races in Munford are White / Caucasian (1,446 | 83.0%), Black / African American (161 | 9.2%), and Two or more Races (45 | 2.6%).
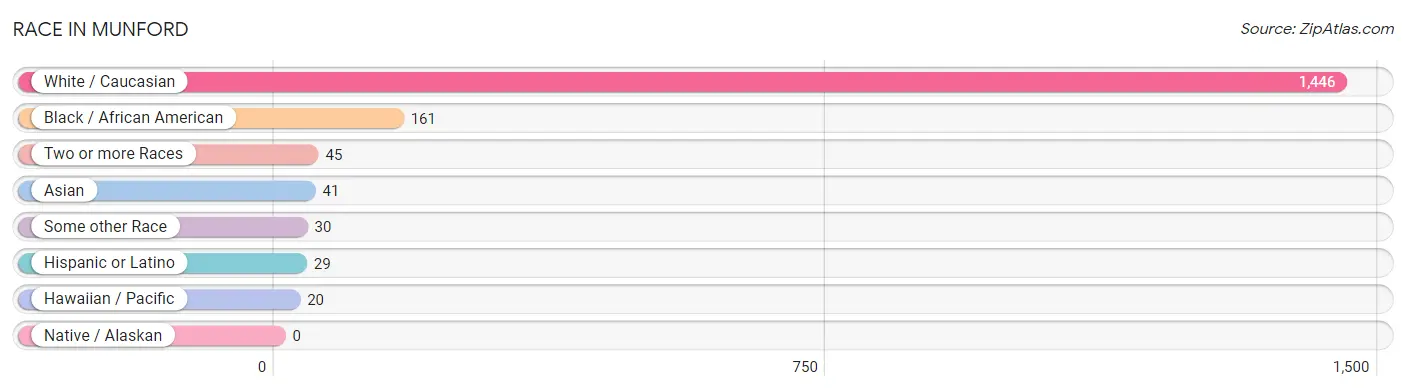
| Race | # Population | % Population |
| Asian | 41 | 2.4% |
| Black / African American | 161 | 9.2% |
| Hawaiian / Pacific | 20 | 1.1% |
| Hispanic or Latino | 29 | 1.7% |
| Native / Alaskan | 0 | 0.0% |
| White / Caucasian | 1,446 | 83.0% |
| Two or more Races | 45 | 2.6% |
| Some other Race | 30 | 1.7% |
| Total | 1,743 | 100.0% |
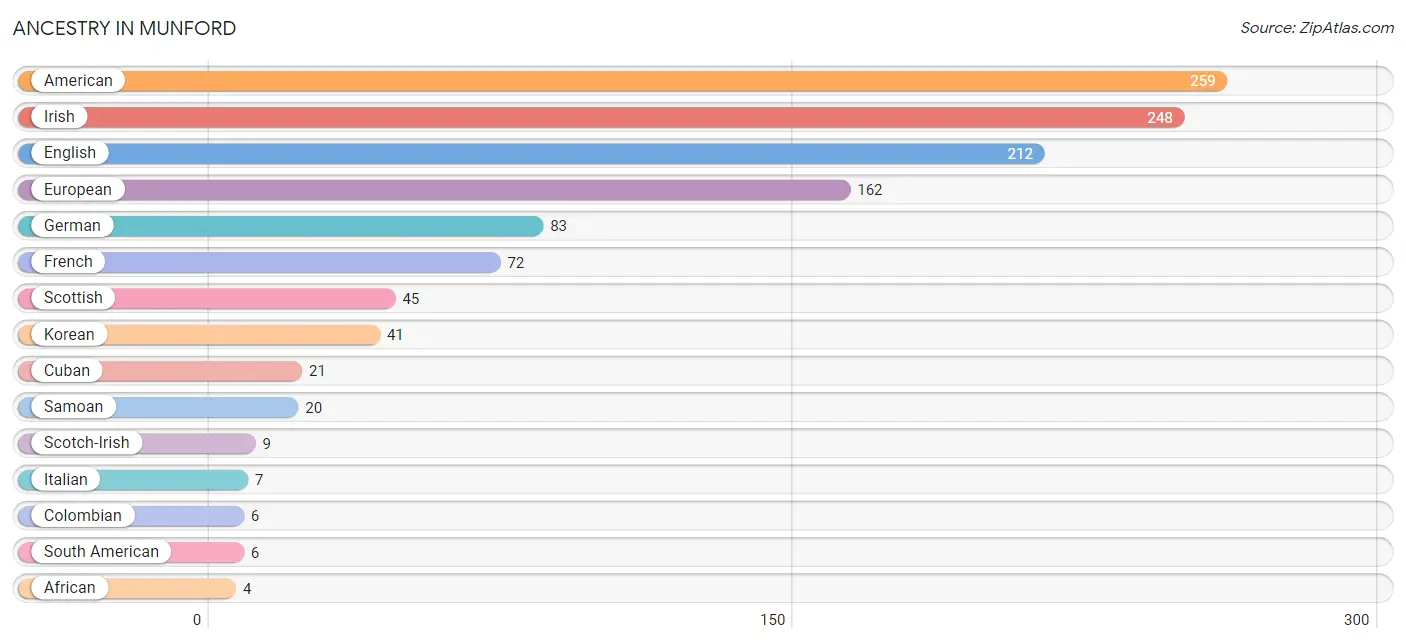
Ancestry in Munford
The most populous ancestries reported in Munford are American (259 | 14.9%), Irish (248 | 14.2%), English (212 | 12.2%), European (162 | 9.3%), and German (83 | 4.8%), together accounting for 55.3% of all Munford residents.
| Ancestry | # Population | % Population |
| African | 4 | 0.2% |
| American | 259 | 14.9% |
| British | 3 | 0.2% |
| Cherokee | 3 | 0.2% |
| Cheyenne | 2 | 0.1% |
| Colombian | 6 | 0.3% |
| Cuban | 21 | 1.2% |
| Dutch | 4 | 0.2% |
| English | 212 | 12.2% |
| European | 162 | 9.3% |
| French | 72 | 4.1% |
| German | 83 | 4.8% |
| Greek | 2 | 0.1% |
| Irish | 248 | 14.2% |
| Italian | 7 | 0.4% |
| Korean | 41 | 2.4% |
| Samoan | 20 | 1.1% |
| Scandinavian | 4 | 0.2% |
| Scotch-Irish | 9 | 0.5% |
| Scottish | 45 | 2.6% |
| South American | 6 | 0.3% |
| Subsaharan African | 4 | 0.2% | View All 22 Rows |
Immigrants in Munford
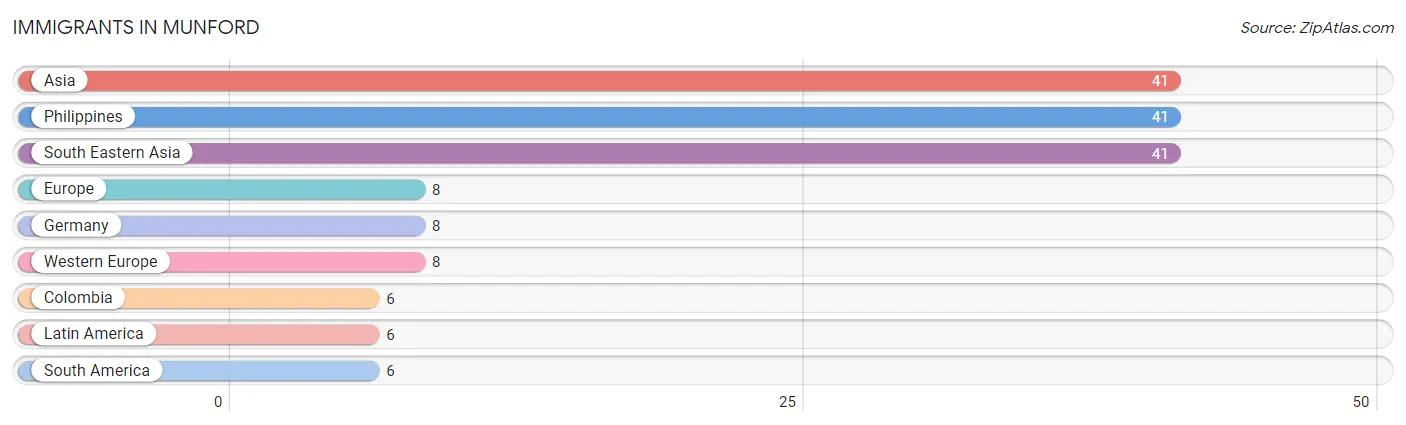
The most numerous immigrant groups reported in Munford came from Asia (41 | 2.4%), Philippines (41 | 2.4%), South Eastern Asia (41 | 2.4%), Europe (8 | 0.5%), and Germany (8 | 0.5%), together accounting for 8.0% of all Munford residents.
| Immigration Origin | # Population | % Population |
| Asia | 41 | 2.4% |
| Colombia | 6 | 0.3% |
| Europe | 8 | 0.5% |
| Germany | 8 | 0.5% |
| Latin America | 6 | 0.3% |
| Philippines | 41 | 2.4% |
| South America | 6 | 0.3% |
| South Eastern Asia | 41 | 2.4% |
| Western Europe | 8 | 0.5% | View All 9 Rows |
Sex and Age in Munford
Sex and Age in Munford
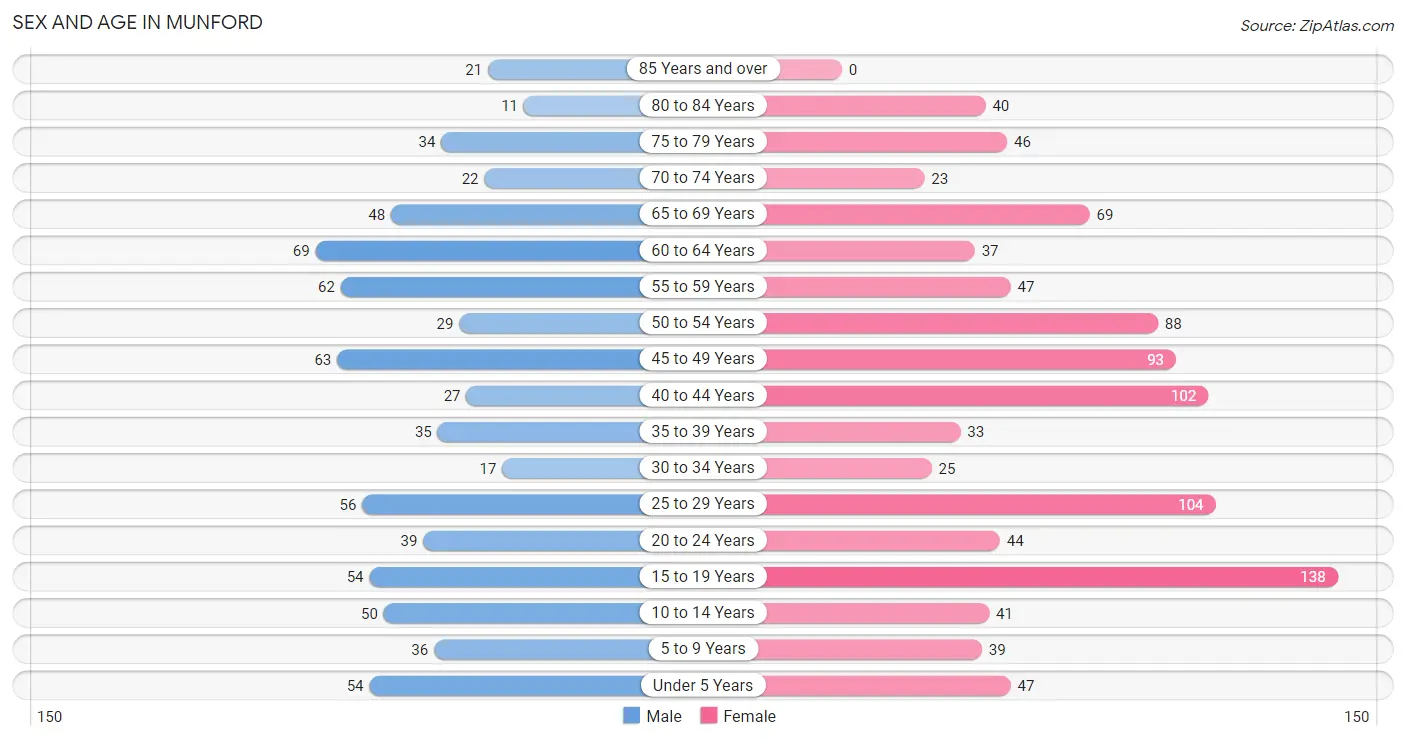
The most populous age groups in Munford are 60 to 64 Years (69 | 9.5%) for men and 15 to 19 Years (138 | 13.6%) for women.
| Age Bracket | Male | Female |
| Under 5 Years | 54 (7.4%) | 47 (4.6%) |
| 5 to 9 Years | 36 (5.0%) | 39 (3.8%) |
| 10 to 14 Years | 50 (6.9%) | 41 (4.0%) |
| 15 to 19 Years | 54 (7.4%) | 138 (13.6%) |
| 20 to 24 Years | 39 (5.4%) | 44 (4.3%) |
| 25 to 29 Years | 56 (7.7%) | 104 (10.2%) |
| 30 to 34 Years | 17 (2.3%) | 25 (2.5%) |
| 35 to 39 Years | 35 (4.8%) | 33 (3.3%) |
| 40 to 44 Years | 27 (3.7%) | 102 (10.0%) |
| 45 to 49 Years | 63 (8.7%) | 93 (9.1%) |
| 50 to 54 Years | 29 (4.0%) | 88 (8.7%) |
| 55 to 59 Years | 62 (8.5%) | 47 (4.6%) |
| 60 to 64 Years | 69 (9.5%) | 37 (3.6%) |
| 65 to 69 Years | 48 (6.6%) | 69 (6.8%) |
| 70 to 74 Years | 22 (3.0%) | 23 (2.3%) |
| 75 to 79 Years | 34 (4.7%) | 46 (4.5%) |
| 80 to 84 Years | 11 (1.5%) | 40 (3.9%) |
| 85 Years and over | 21 (2.9%) | 0 (0.0%) |
| Total | 727 (100.0%) | 1,016 (100.0%) |
Families and Households in Munford
Median Family Size in Munford
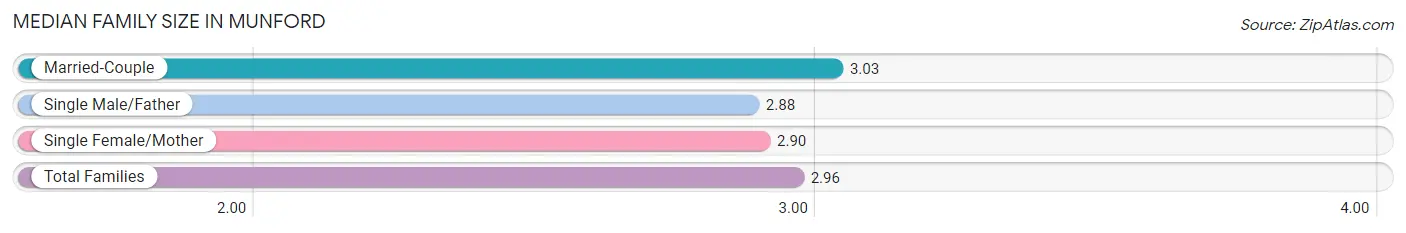
The median family size in Munford is 2.96 persons per family, with married-couple families (262 | 53.2%) accounting for the largest median family size of 3.03 persons per family. On the other hand, single male/father families (68 | 13.8%) represent the smallest median family size with 2.88 persons per family.
| Family Type | # Families | Family Size |
| Married-Couple | 262 (53.2%) | 3.03 |
| Single Male/Father | 68 (13.8%) | 2.88 |
| Single Female/Mother | 162 (32.9%) | 2.90 |
| Total Families | 492 (100.0%) | 2.96 |
Median Household Size in Munford
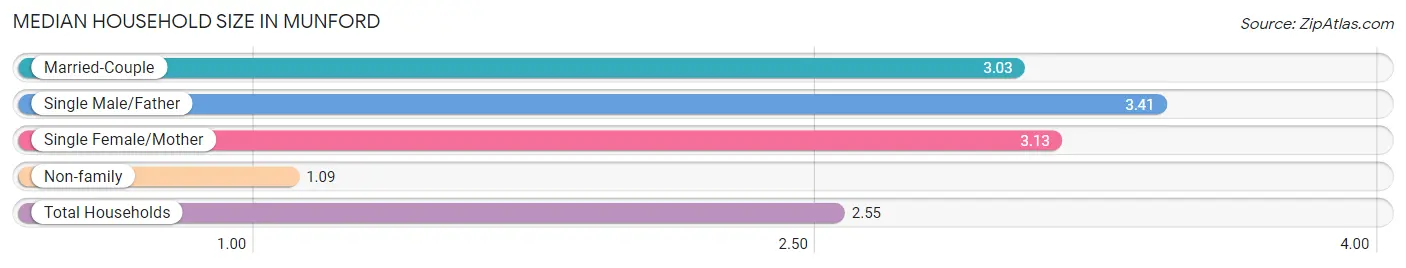
The median household size in Munford is 2.55 persons per household, with single male/father households (68 | 9.9%) accounting for the largest median household size of 3.41 persons per household. non-family households (192 | 28.1%) represent the smallest median household size with 1.09 persons per household.
| Household Type | # Households | Household Size |
| Married-Couple | 262 (38.3%) | 3.03 |
| Single Male/Father | 68 (9.9%) | 3.41 |
| Single Female/Mother | 162 (23.7%) | 3.13 |
| Non-family | 192 (28.1%) | 1.09 |
| Total Households | 684 (100.0%) | 2.55 |
Household Size by Marriage Status in Munford
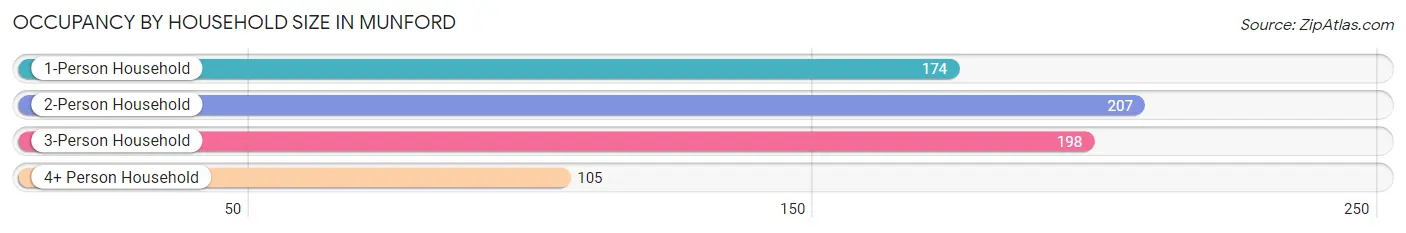
Out of a total of 684 households in Munford, 492 (71.9%) are family households, while 192 (28.1%) are nonfamily households. The most numerous type of family households are 3-person households, comprising 198, and the most common type of nonfamily households are 1-person households, comprising 174.
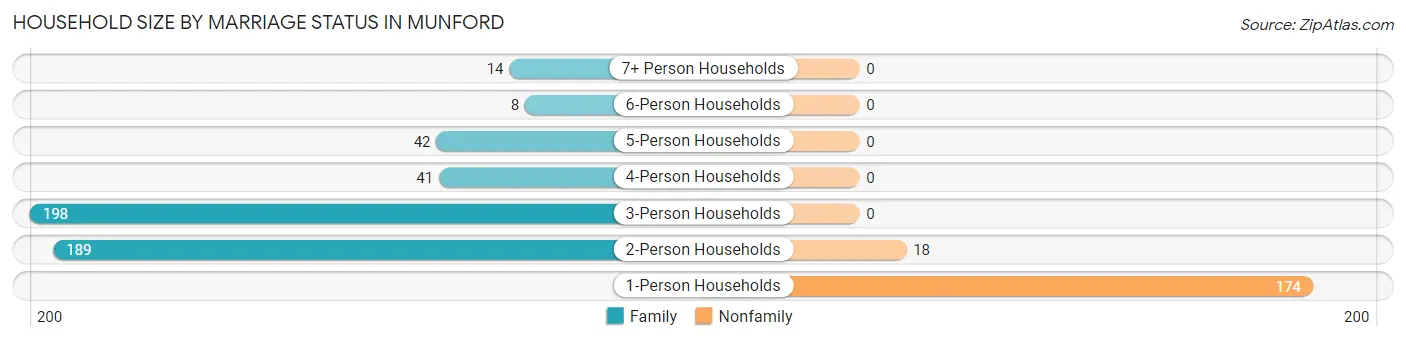
| Household Size | Family Households | Nonfamily Households |
| 1-Person Households | - | 174 (25.4%) |
| 2-Person Households | 189 (27.6%) | 18 (2.6%) |
| 3-Person Households | 198 (28.9%) | 0 (0.0%) |
| 4-Person Households | 41 (6.0%) | 0 (0.0%) |
| 5-Person Households | 42 (6.1%) | 0 (0.0%) |
| 6-Person Households | 8 (1.2%) | 0 (0.0%) |
| 7+ Person Households | 14 (2.1%) | 0 (0.0%) |
| Total | 492 (71.9%) | 192 (28.1%) |
Female Fertility in Munford
Fertility by Age in Munford
Average fertility rate in Munford is 63.0 births per 1,000 women. Women in the age bracket of 20 to 34 years have the highest fertility rate with 150.0 births per 1,000 women. Women in the age bracket of 20 to 34 years acount for 76.5% of all women with births.
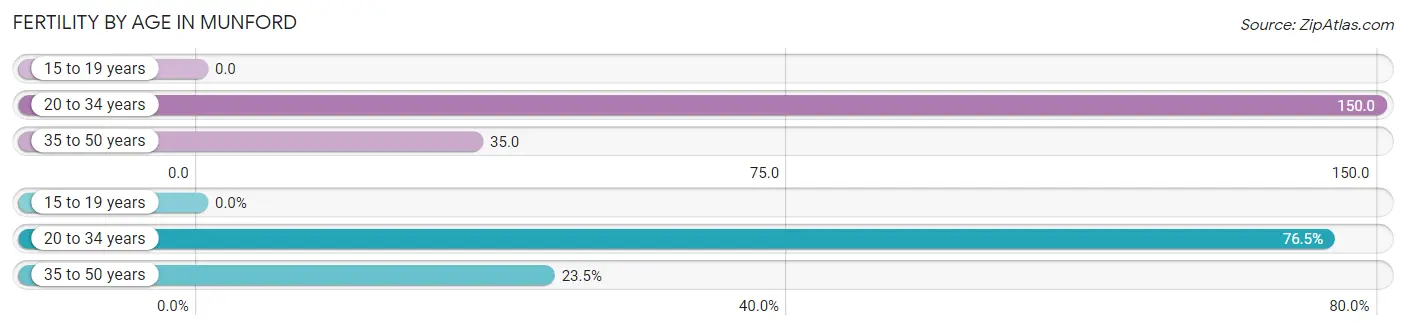
| Age Bracket | Women with Births | Births / 1,000 Women |
| 15 to 19 years | 0 (0.0%) | 0.0 |
| 20 to 34 years | 26 (76.5%) | 150.0 |
| 35 to 50 years | 8 (23.5%) | 35.0 |
| Total | 34 (100.0%) | 63.0 |
Fertility by Age by Marriage Status in Munford
29.4% of women with births (34) in Munford are married. The highest percentage of unmarried women with births falls into 20 to 34 years age bracket with 73.1% of them unmarried at the time of birth, while the lowest percentage of unmarried women with births belong to 35 to 50 years age bracket with 62.5% of them unmarried.
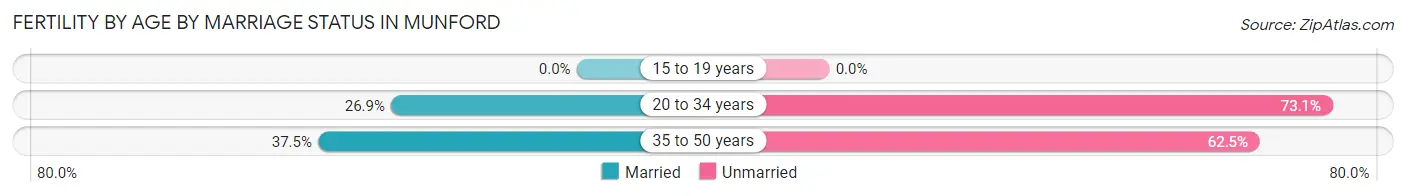
| Age Bracket | Married | Unmarried |
| 15 to 19 years | 0 (0.0%) | 0 (0.0%) |
| 20 to 34 years | 7 (26.9%) | 19 (73.1%) |
| 35 to 50 years | 3 (37.5%) | 5 (62.5%) |
| Total | 10 (29.4%) | 24 (70.6%) |
Fertility by Education in Munford
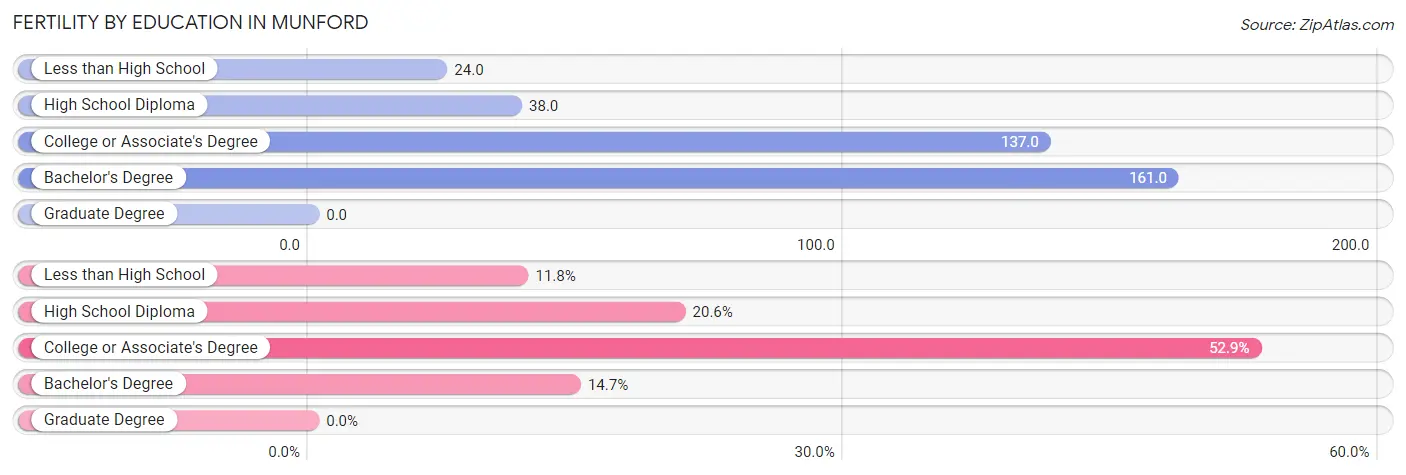
| Educational Attainment | Women with Births | Births / 1,000 Women |
| Less than High School | 4 (11.8%) | 24.0 |
| High School Diploma | 7 (20.6%) | 38.0 |
| College or Associate's Degree | 18 (52.9%) | 137.0 |
| Bachelor's Degree | 5 (14.7%) | 161.0 |
| Graduate Degree | 0 (0.0%) | 0.0 |
| Total | 34 (100.0%) | 63.0 |
Fertility by Education by Marriage Status in Munford
70.6% of women with births in Munford are unmarried. Women with the educational attainment of less than high school are most likely to be married with 100.0% of them married at childbirth, while women with the educational attainment of high school diploma are least likely to be married with 100.0% of them unmarried at childbirth.
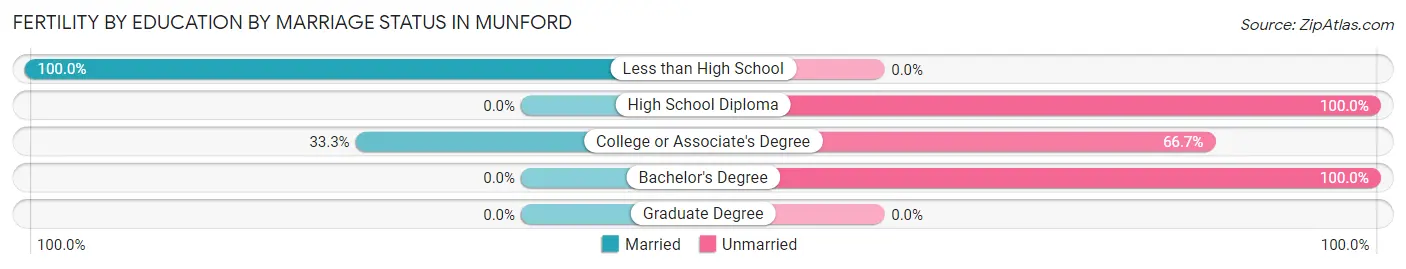
| Educational Attainment | Married | Unmarried |
| Less than High School | 4 (100.0%) | 0 (0.0%) |
| High School Diploma | 0 (0.0%) | 7 (100.0%) |
| College or Associate's Degree | 6 (33.3%) | 12 (66.7%) |
| Bachelor's Degree | 0 (0.0%) | 5 (100.0%) |
| Graduate Degree | 0 (0.0%) | 0 (0.0%) |
| Total | 10 (29.4%) | 24 (70.6%) |
Employment Characteristics in Munford
Employment by Class of Employer in Munford
Among the 767 employed individuals in Munford, private company employees (553 | 72.1%), local government employees (51 | 6.7%), and federal government employees (50 | 6.5%) make up the most common classes of employment.
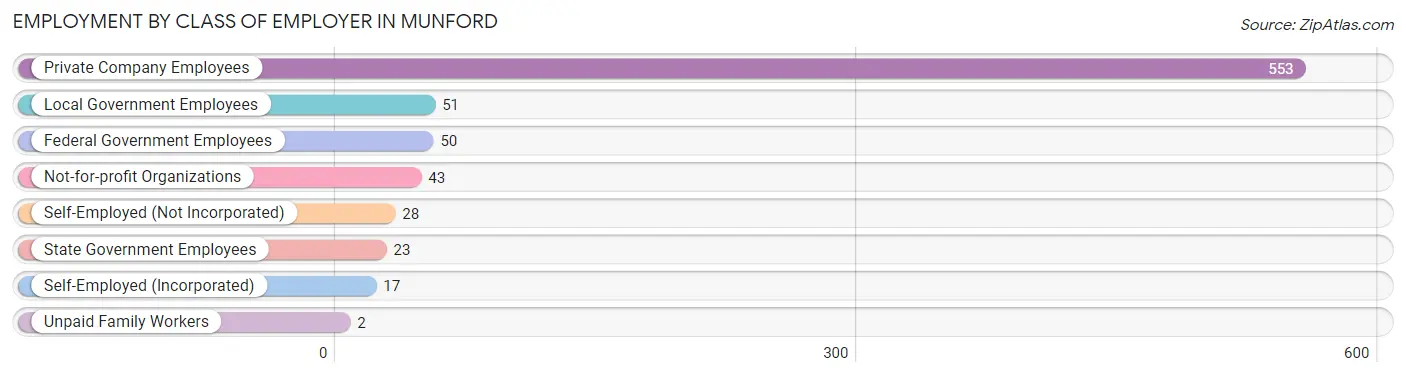
| Employer Class | # Employees | % Employees |
| Private Company Employees | 553 | 72.1% |
| Self-Employed (Incorporated) | 17 | 2.2% |
| Self-Employed (Not Incorporated) | 28 | 3.6% |
| Not-for-profit Organizations | 43 | 5.6% |
| Local Government Employees | 51 | 6.7% |
| State Government Employees | 23 | 3.0% |
| Federal Government Employees | 50 | 6.5% |
| Unpaid Family Workers | 2 | 0.3% |
| Total | 767 | 100.0% |
Employment Status by Age in Munford
According to the labor force statistics for Munford, out of the total population over 16 years of age (1,427), 59.4% or 848 individuals are in the labor force, with 7.4% or 63 of them unemployed. The age group with the highest labor force participation rate is 25 to 29 years, with 90.0% or 144 individuals in the labor force. Within the labor force, the 30 to 34 years age range has the highest percentage of unemployed individuals, with 52.2% or 12 of them being unemployed.
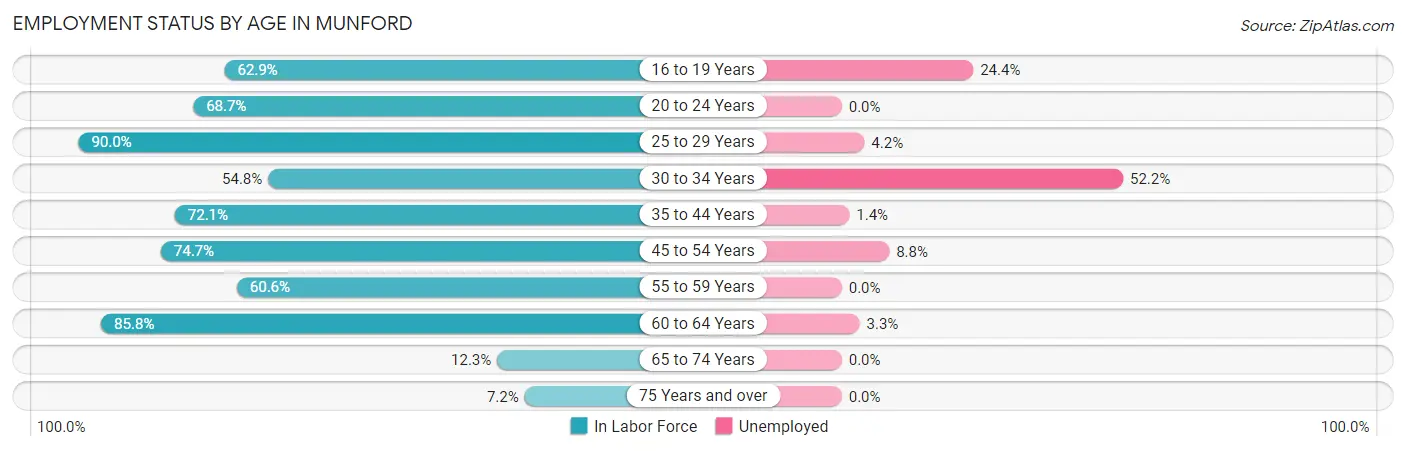
| Age Bracket | In Labor Force | Unemployed |
| 16 to 19 Years | 90 (62.9%) | 22 (24.4%) |
| 20 to 24 Years | 57 (68.7%) | 0 (0.0%) |
| 25 to 29 Years | 144 (90.0%) | 6 (4.2%) |
| 30 to 34 Years | 23 (54.8%) | 12 (52.2%) |
| 35 to 44 Years | 142 (72.1%) | 2 (1.4%) |
| 45 to 54 Years | 204 (74.7%) | 18 (8.8%) |
| 55 to 59 Years | 66 (60.6%) | 0 (0.0%) |
| 60 to 64 Years | 91 (85.8%) | 3 (3.3%) |
| 65 to 74 Years | 20 (12.3%) | 0 (0.0%) |
| 75 Years and over | 11 (7.2%) | 0 (0.0%) |
| Total | 848 (59.4%) | 63 (7.4%) |
Employment Status by Educational Attainment in Munford
According to labor force statistics for Munford, 75.5% of individuals (670) out of the total population between 25 and 64 years of age (887) are in the labor force, with 6.1% or 41 of them being unemployed. The group with the highest labor force participation rate are those with the educational attainment of bachelor's degree or higher, with 85.8% or 115 individuals in the labor force. Within the labor force, individuals with high school diploma education have the highest percentage of unemployment, with 11.4% or 30 of them being unemployed.
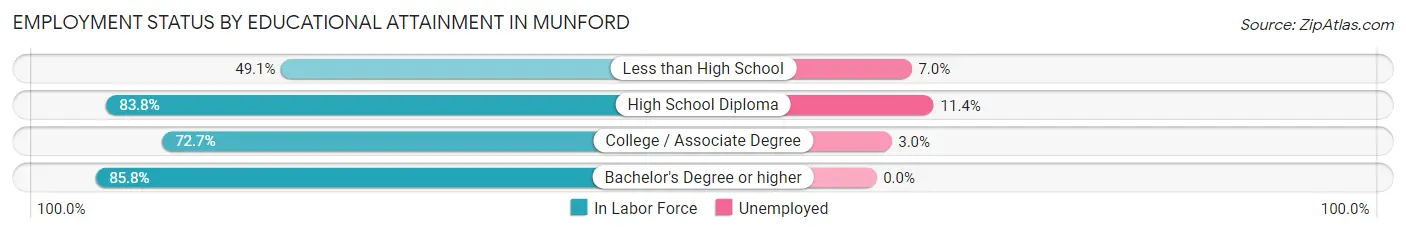
| Educational Attainment | In Labor Force | Unemployed |
| Less than High School | 57 (49.1%) | 8 (7.0%) |
| High School Diploma | 264 (83.8%) | 36 (11.4%) |
| College / Associate Degree | 234 (72.7%) | 10 (3.0%) |
| Bachelor's Degree or higher | 115 (85.8%) | 0 (0.0%) |
| Total | 670 (75.5%) | 54 (6.1%) |
Employment Occupations by Sex in Munford
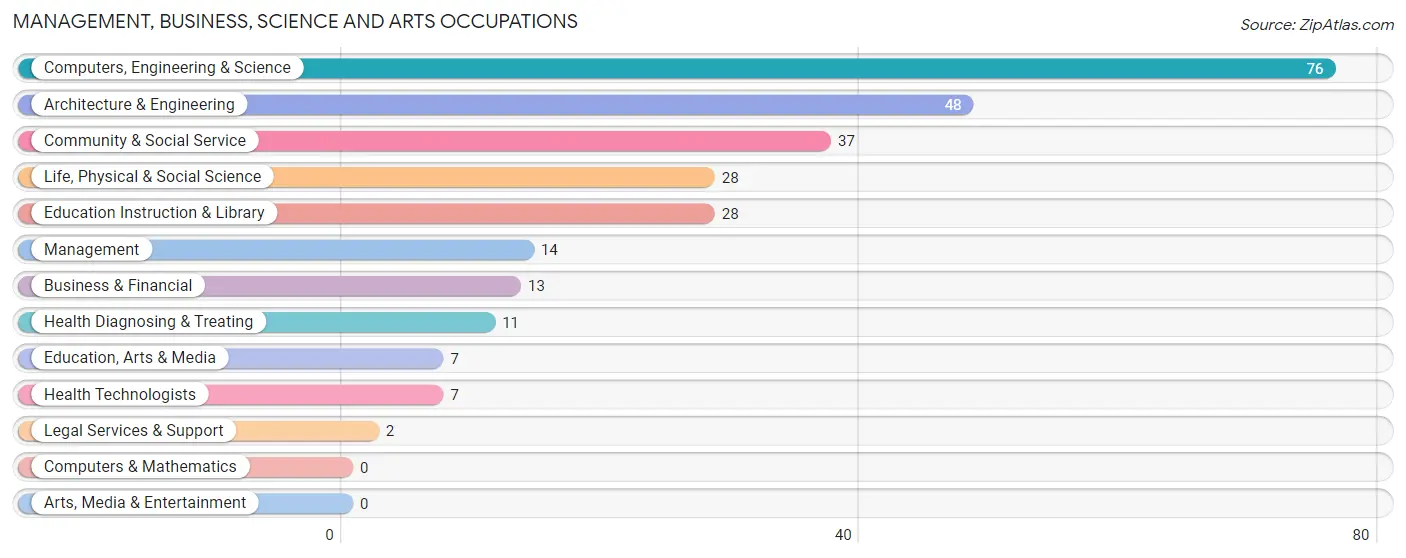
Management, Business, Science and Arts Occupations
The most common Management, Business, Science and Arts occupations in Munford are Computers, Engineering & Science (76 | 9.7%), Architecture & Engineering (48 | 6.1%), Community & Social Service (37 | 4.7%), Life, Physical & Social Science (28 | 3.6%), and Education Instruction & Library (28 | 3.6%).
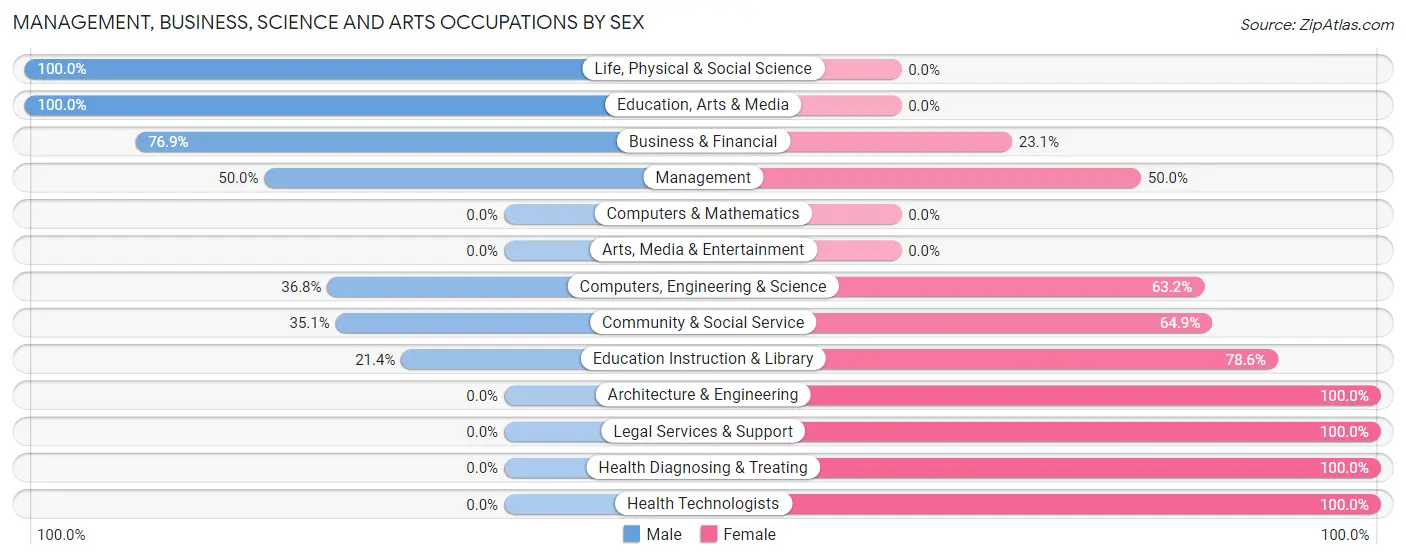
Management, Business, Science and Arts Occupations by Sex
Within the Management, Business, Science and Arts occupations in Munford, the most male-oriented occupations are Life, Physical & Social Science (100.0%), Education, Arts & Media (100.0%), and Business & Financial (76.9%), while the most female-oriented occupations are Architecture & Engineering (100.0%), Legal Services & Support (100.0%), and Health Diagnosing & Treating (100.0%).
| Occupation | Male | Female |
| Management | 7 (50.0%) | 7 (50.0%) |
| Business & Financial | 10 (76.9%) | 3 (23.1%) |
| Computers, Engineering & Science | 28 (36.8%) | 48 (63.2%) |
| Computers & Mathematics | 0 (0.0%) | 0 (0.0%) |
| Architecture & Engineering | 0 (0.0%) | 48 (100.0%) |
| Life, Physical & Social Science | 28 (100.0%) | 0 (0.0%) |
| Community & Social Service | 13 (35.1%) | 24 (64.9%) |
| Education, Arts & Media | 7 (100.0%) | 0 (0.0%) |
| Legal Services & Support | 0 (0.0%) | 2 (100.0%) |
| Education Instruction & Library | 6 (21.4%) | 22 (78.6%) |
| Arts, Media & Entertainment | 0 (0.0%) | 0 (0.0%) |
| Health Diagnosing & Treating | 0 (0.0%) | 11 (100.0%) |
| Health Technologists | 0 (0.0%) | 7 (100.0%) |
| Total (Category) | 58 (38.4%) | 93 (61.6%) |
| Total (Overall) | 325 (41.4%) | 460 (58.6%) |
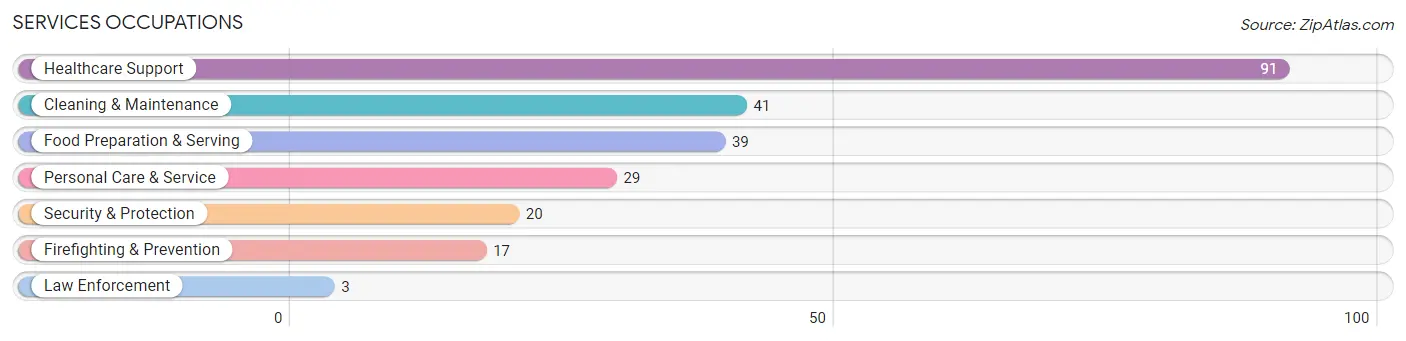
Services Occupations
The most common Services occupations in Munford are Healthcare Support (91 | 11.6%), Cleaning & Maintenance (41 | 5.2%), Food Preparation & Serving (39 | 5.0%), Personal Care & Service (29 | 3.7%), and Security & Protection (20 | 2.5%).
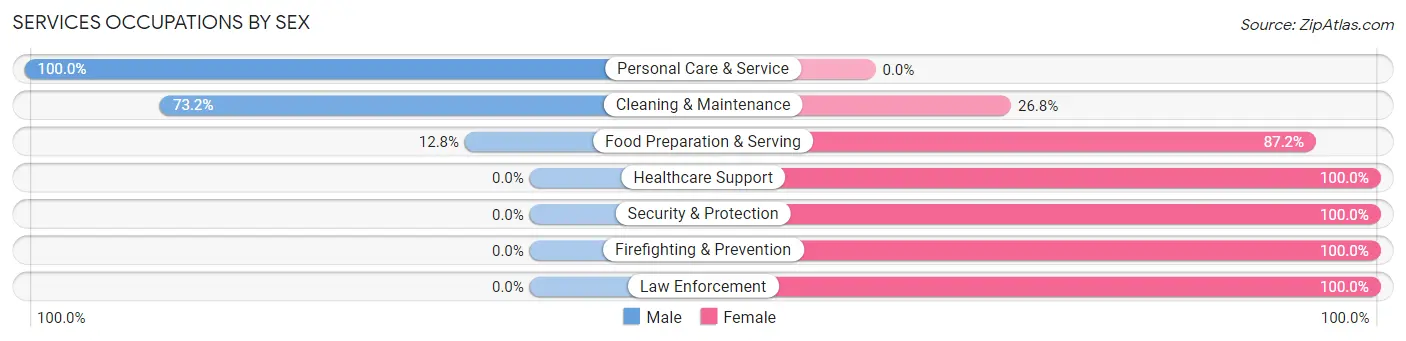
Services Occupations by Sex
Within the Services occupations in Munford, the most male-oriented occupations are Personal Care & Service (100.0%), Cleaning & Maintenance (73.2%), and Food Preparation & Serving (12.8%), while the most female-oriented occupations are Healthcare Support (100.0%), Security & Protection (100.0%), and Firefighting & Prevention (100.0%).
| Occupation | Male | Female |
| Healthcare Support | 0 (0.0%) | 91 (100.0%) |
| Security & Protection | 0 (0.0%) | 20 (100.0%) |
| Firefighting & Prevention | 0 (0.0%) | 17 (100.0%) |
| Law Enforcement | 0 (0.0%) | 3 (100.0%) |
| Food Preparation & Serving | 5 (12.8%) | 34 (87.2%) |
| Cleaning & Maintenance | 30 (73.2%) | 11 (26.8%) |
| Personal Care & Service | 29 (100.0%) | 0 (0.0%) |
| Total (Category) | 64 (29.1%) | 156 (70.9%) |
| Total (Overall) | 325 (41.4%) | 460 (58.6%) |
Sales and Office Occupations
The most common Sales and Office occupations in Munford are Office & Administration (129 | 16.4%), and Sales & Related (57 | 7.3%).
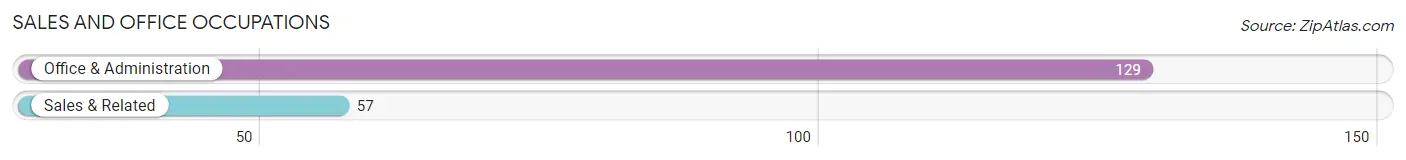
Sales and Office Occupations by Sex
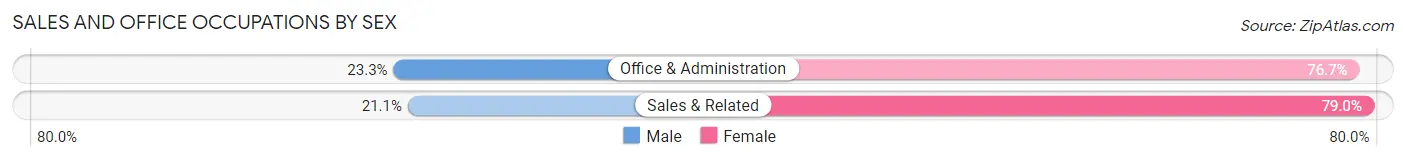
| Occupation | Male | Female |
| Sales & Related | 12 (21.0%) | 45 (78.9%) |
| Office & Administration | 30 (23.3%) | 99 (76.7%) |
| Total (Category) | 42 (22.6%) | 144 (77.4%) |
| Total (Overall) | 325 (41.4%) | 460 (58.6%) |
Natural Resources, Construction and Maintenance Occupations
The most common Natural Resources, Construction and Maintenance occupations in Munford are Installation, Maintenance & Repair (68 | 8.7%), and Construction & Extraction (56 | 7.1%).
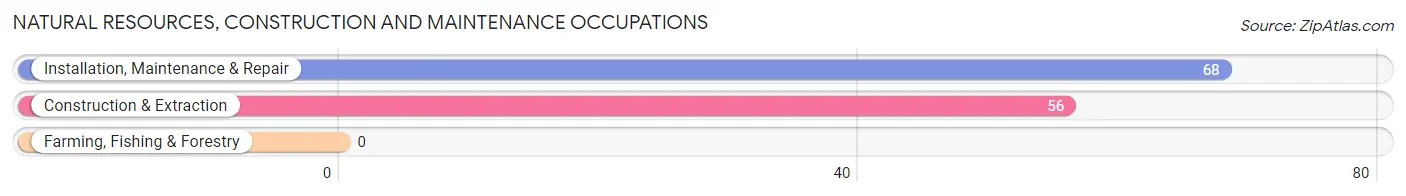
Natural Resources, Construction and Maintenance Occupations by Sex
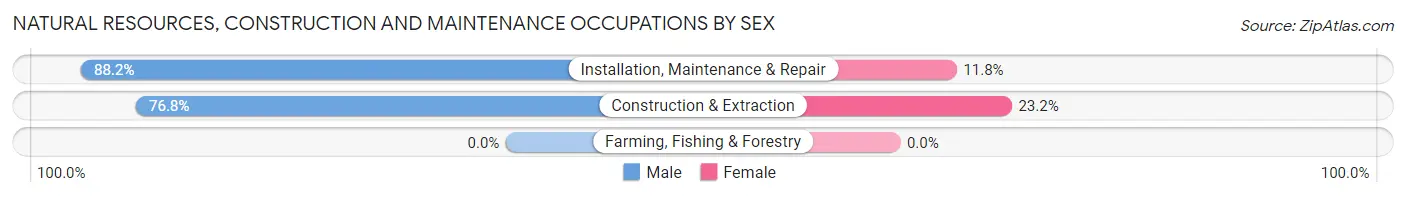
| Occupation | Male | Female |
| Farming, Fishing & Forestry | 0 (0.0%) | 0 (0.0%) |
| Construction & Extraction | 43 (76.8%) | 13 (23.2%) |
| Installation, Maintenance & Repair | 60 (88.2%) | 8 (11.8%) |
| Total (Category) | 103 (83.1%) | 21 (16.9%) |
| Total (Overall) | 325 (41.4%) | 460 (58.6%) |
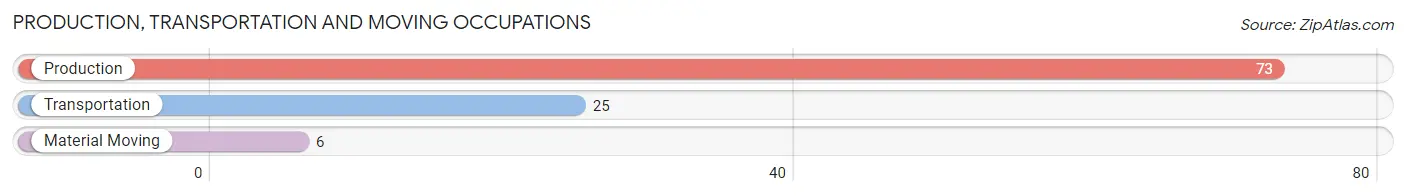
Production, Transportation and Moving Occupations
The most common Production, Transportation and Moving occupations in Munford are Production (73 | 9.3%), Transportation (25 | 3.2%), and Material Moving (6 | 0.8%).
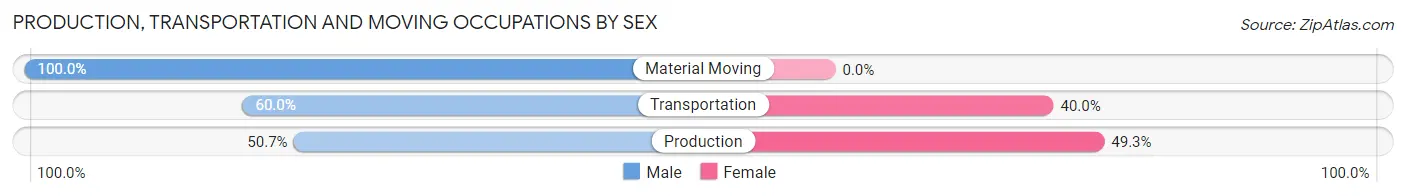
Production, Transportation and Moving Occupations by Sex
| Occupation | Male | Female |
| Production | 37 (50.7%) | 36 (49.3%) |
| Transportation | 15 (60.0%) | 10 (40.0%) |
| Material Moving | 6 (100.0%) | 0 (0.0%) |
| Total (Category) | 58 (55.8%) | 46 (44.2%) |
| Total (Overall) | 325 (41.4%) | 460 (58.6%) |
Employment Industries by Sex in Munford
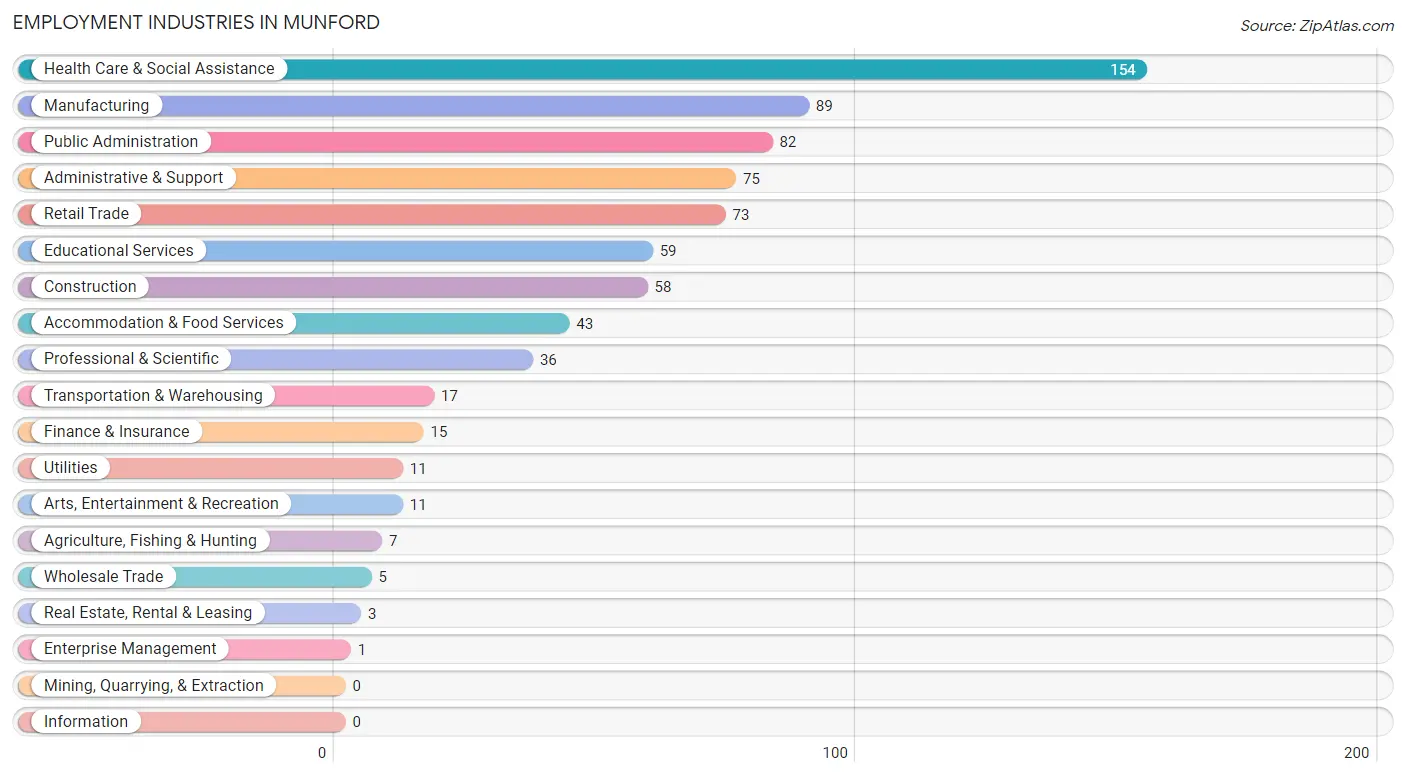
Employment Industries in Munford
The major employment industries in Munford include Health Care & Social Assistance (154 | 19.6%), Manufacturing (89 | 11.3%), Public Administration (82 | 10.4%), Administrative & Support (75 | 9.6%), and Retail Trade (73 | 9.3%).
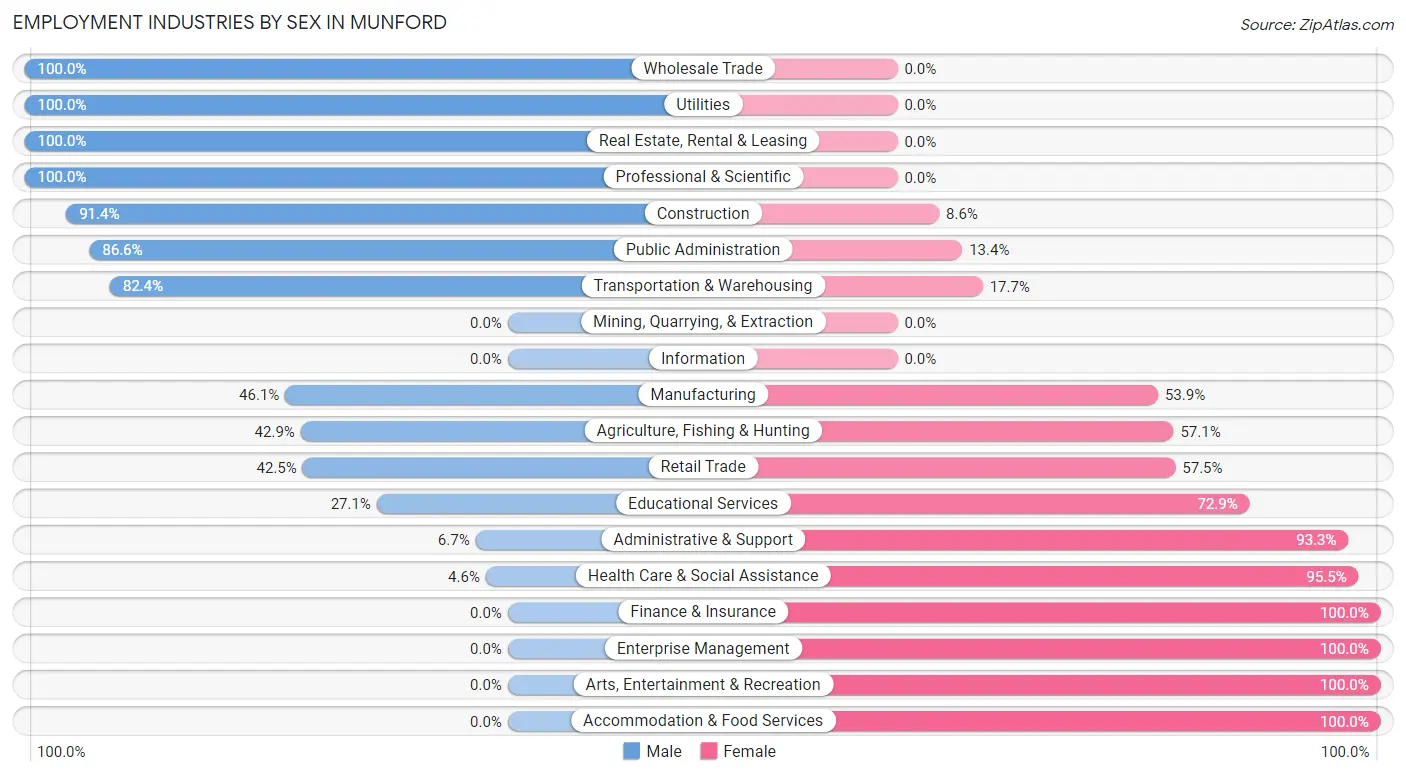
Employment Industries by Sex in Munford
The Munford industries that see more men than women are Wholesale Trade (100.0%), Utilities (100.0%), and Real Estate, Rental & Leasing (100.0%), whereas the industries that tend to have a higher number of women are Finance & Insurance (100.0%), Enterprise Management (100.0%), and Arts, Entertainment & Recreation (100.0%).
| Industry | Male | Female |
| Agriculture, Fishing & Hunting | 3 (42.9%) | 4 (57.1%) |
| Mining, Quarrying, & Extraction | 0 (0.0%) | 0 (0.0%) |
| Construction | 53 (91.4%) | 5 (8.6%) |
| Manufacturing | 41 (46.1%) | 48 (53.9%) |
| Wholesale Trade | 5 (100.0%) | 0 (0.0%) |
| Retail Trade | 31 (42.5%) | 42 (57.5%) |
| Transportation & Warehousing | 14 (82.4%) | 3 (17.6%) |
| Utilities | 11 (100.0%) | 0 (0.0%) |
| Information | 0 (0.0%) | 0 (0.0%) |
| Finance & Insurance | 0 (0.0%) | 15 (100.0%) |
| Real Estate, Rental & Leasing | 3 (100.0%) | 0 (0.0%) |
| Professional & Scientific | 36 (100.0%) | 0 (0.0%) |
| Enterprise Management | 0 (0.0%) | 1 (100.0%) |
| Administrative & Support | 5 (6.7%) | 70 (93.3%) |
| Educational Services | 16 (27.1%) | 43 (72.9%) |
| Health Care & Social Assistance | 7 (4.5%) | 147 (95.5%) |
| Arts, Entertainment & Recreation | 0 (0.0%) | 11 (100.0%) |
| Accommodation & Food Services | 0 (0.0%) | 43 (100.0%) |
| Public Administration | 71 (86.6%) | 11 (13.4%) |
| Total | 325 (41.4%) | 460 (58.6%) |
Education in Munford
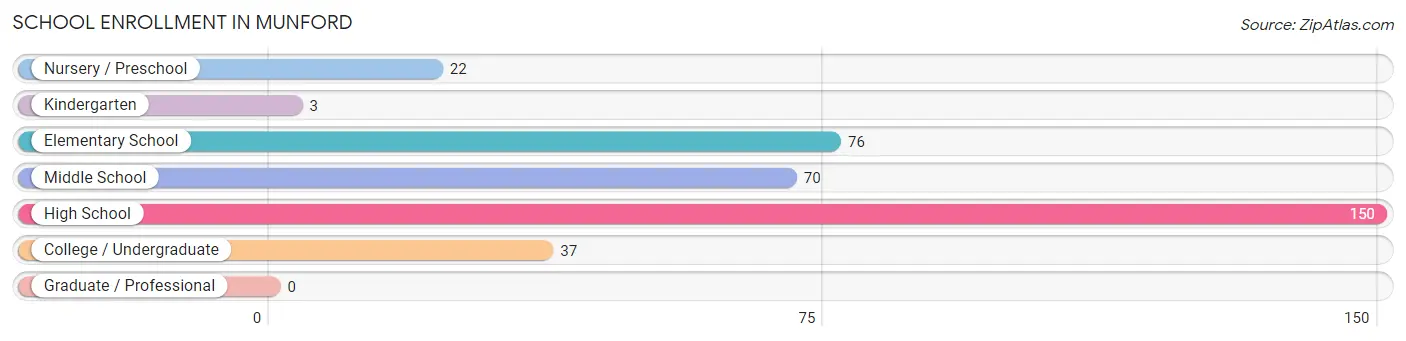
School Enrollment in Munford
The most common levels of schooling among the 358 students in Munford are high school (150 | 41.9%), elementary school (76 | 21.2%), and middle school (70 | 19.6%).
| School Level | # Students | % Students |
| Nursery / Preschool | 22 | 6.1% |
| Kindergarten | 3 | 0.8% |
| Elementary School | 76 | 21.2% |
| Middle School | 70 | 19.6% |
| High School | 150 | 41.9% |
| College / Undergraduate | 37 | 10.3% |
| Graduate / Professional | 0 | 0.0% |
| Total | 358 | 100.0% |
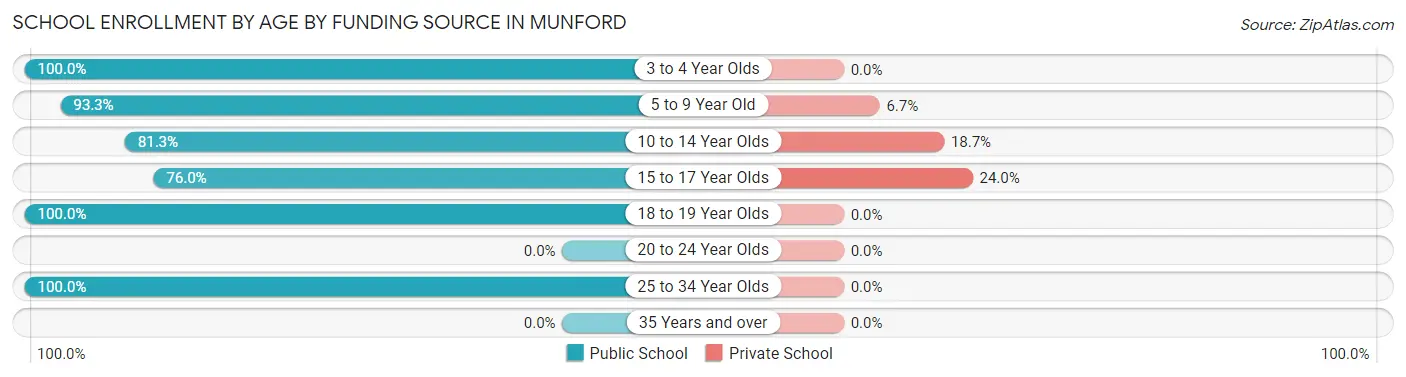
School Enrollment by Age by Funding Source in Munford
Out of a total of 358 students who are enrolled in schools in Munford, 51 (14.2%) attend a private institution, while the remaining 307 (85.8%) are enrolled in public schools. The age group of 15 to 17 year olds has the highest likelihood of being enrolled in private schools, with 30 (24.0% in the age bracket) enrolled. Conversely, the age group of 3 to 4 year olds has the lowest likelihood of being enrolled in a private school, with 20 (100.0% in the age bracket) attending a public institution.
| Age Bracket | Public School | Private School |
| 3 to 4 Year Olds | 20 (100.0%) | 0 (0.0%) |
| 5 to 9 Year Old | 56 (93.3%) | 4 (6.7%) |
| 10 to 14 Year Olds | 74 (81.3%) | 17 (18.7%) |
| 15 to 17 Year Olds | 95 (76.0%) | 30 (24.0%) |
| 18 to 19 Year Olds | 40 (100.0%) | 0 (0.0%) |
| 20 to 24 Year Olds | 0 (0.0%) | 0 (0.0%) |
| 25 to 34 Year Olds | 22 (100.0%) | 0 (0.0%) |
| 35 Years and over | 0 (0.0%) | 0 (0.0%) |
| Total | 307 (85.8%) | 51 (14.2%) |
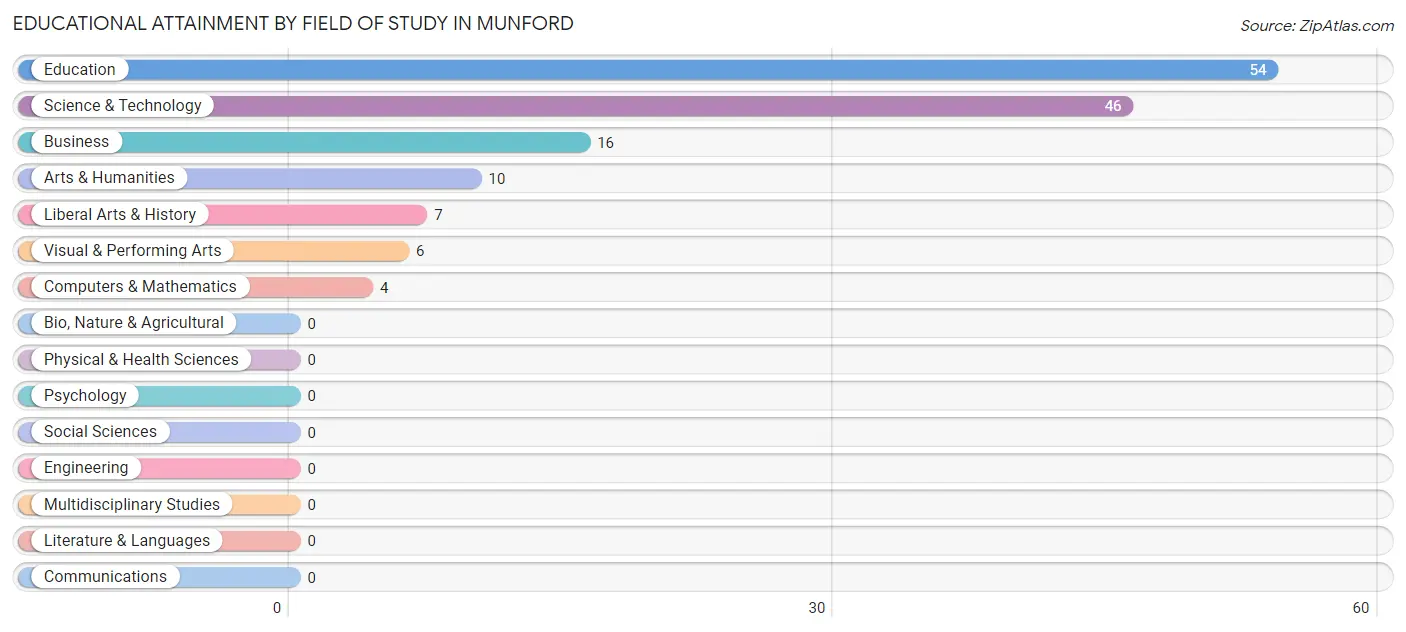
Educational Attainment by Field of Study in Munford
Education (54 | 37.8%), science & technology (46 | 32.2%), business (16 | 11.2%), arts & humanities (10 | 7.0%), and liberal arts & history (7 | 4.9%) are the most common fields of study among 143 individuals in Munford who have obtained a bachelor's degree or higher.
| Field of Study | # Graduates | % Graduates |
| Computers & Mathematics | 4 | 2.8% |
| Bio, Nature & Agricultural | 0 | 0.0% |
| Physical & Health Sciences | 0 | 0.0% |
| Psychology | 0 | 0.0% |
| Social Sciences | 0 | 0.0% |
| Engineering | 0 | 0.0% |
| Multidisciplinary Studies | 0 | 0.0% |
| Science & Technology | 46 | 32.2% |
| Business | 16 | 11.2% |
| Education | 54 | 37.8% |
| Literature & Languages | 0 | 0.0% |
| Liberal Arts & History | 7 | 4.9% |
| Visual & Performing Arts | 6 | 4.2% |
| Communications | 0 | 0.0% |
| Arts & Humanities | 10 | 7.0% |
| Total | 143 | 100.0% |
Transportation & Commute in Munford
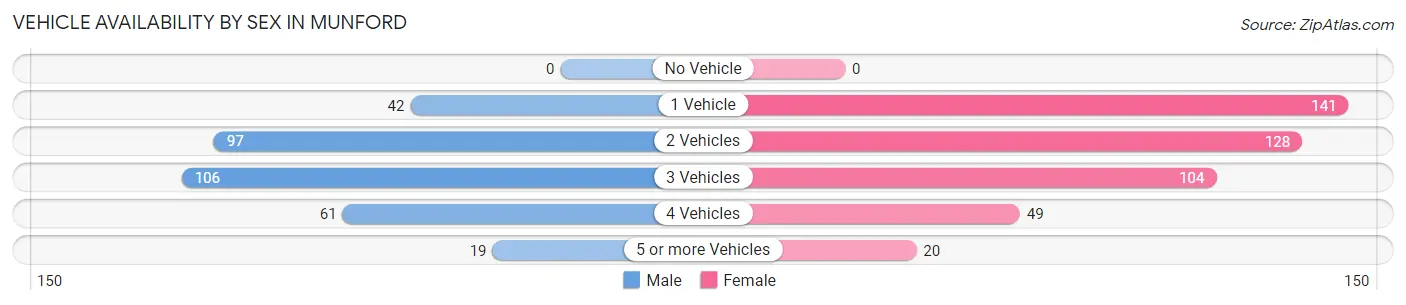
Vehicle Availability by Sex in Munford
The most prevalent vehicle ownership categories in Munford are males with 3 vehicles (106, accounting for 32.6%) and females with 3 vehicles (104, making up 24.0%).
| Vehicles Available | Male | Female |
| No Vehicle | 0 (0.0%) | 0 (0.0%) |
| 1 Vehicle | 42 (12.9%) | 141 (31.9%) |
| 2 Vehicles | 97 (29.8%) | 128 (29.0%) |
| 3 Vehicles | 106 (32.6%) | 104 (23.5%) |
| 4 Vehicles | 61 (18.8%) | 49 (11.1%) |
| 5 or more Vehicles | 19 (5.9%) | 20 (4.5%) |
| Total | 325 (100.0%) | 442 (100.0%) |
Commute Time in Munford
The most frequently occuring commute durations in Munford are 20 to 24 minutes (211 commuters, 30.0%), 15 to 19 minutes (95 commuters, 13.5%), and 5 to 9 minutes (92 commuters, 13.1%).
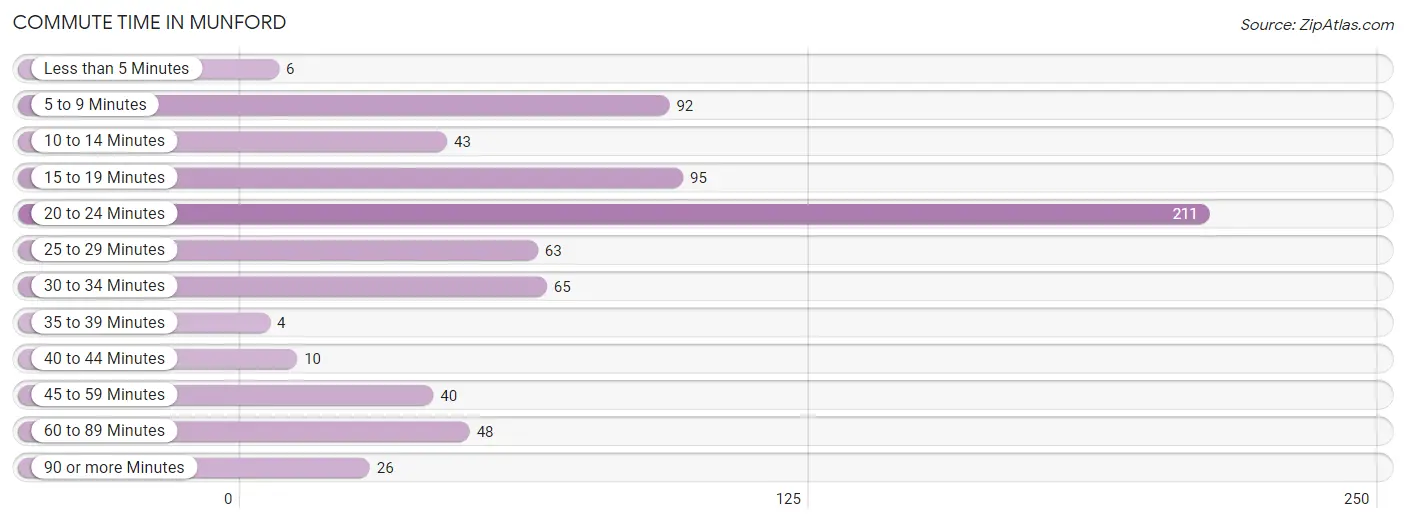
| Commute Time | # Commuters | % Commuters |
| Less than 5 Minutes | 6 | 0.9% |
| 5 to 9 Minutes | 92 | 13.1% |
| 10 to 14 Minutes | 43 | 6.1% |
| 15 to 19 Minutes | 95 | 13.5% |
| 20 to 24 Minutes | 211 | 30.0% |
| 25 to 29 Minutes | 63 | 9.0% |
| 30 to 34 Minutes | 65 | 9.2% |
| 35 to 39 Minutes | 4 | 0.6% |
| 40 to 44 Minutes | 10 | 1.4% |
| 45 to 59 Minutes | 40 | 5.7% |
| 60 to 89 Minutes | 48 | 6.8% |
| 90 or more Minutes | 26 | 3.7% |
Commute Time by Sex in Munford
The most common commute times in Munford are 20 to 24 minutes (120 commuters, 36.9%) for males and 20 to 24 minutes (91 commuters, 24.1%) for females.
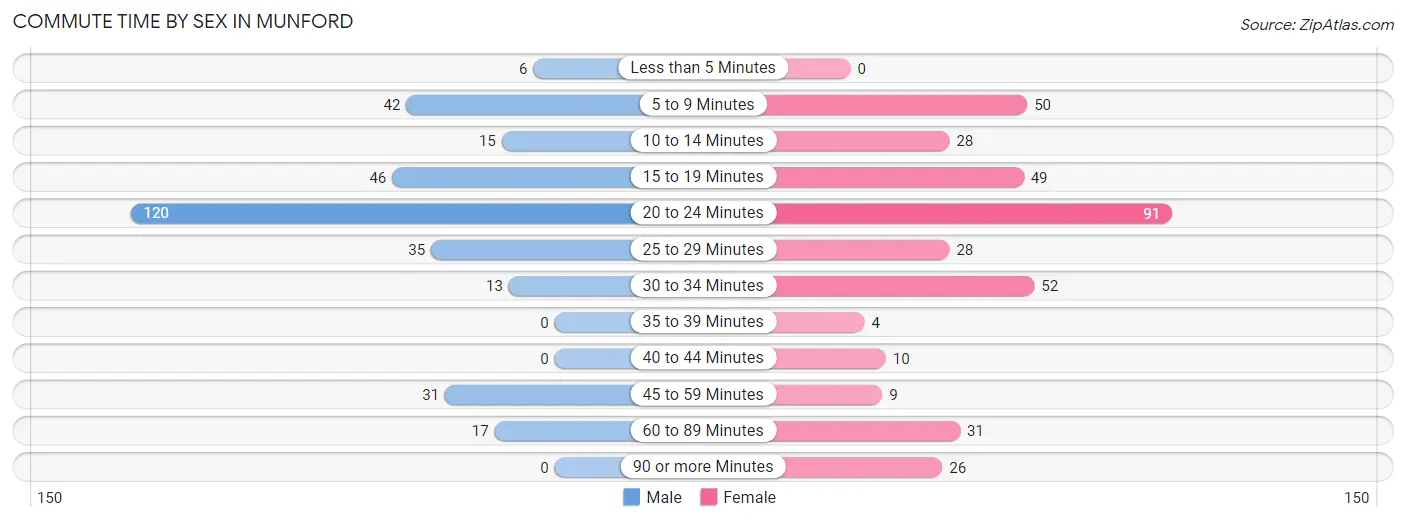
| Commute Time | Male | Female |
| Less than 5 Minutes | 6 (1.8%) | 0 (0.0%) |
| 5 to 9 Minutes | 42 (12.9%) | 50 (13.2%) |
| 10 to 14 Minutes | 15 (4.6%) | 28 (7.4%) |
| 15 to 19 Minutes | 46 (14.1%) | 49 (13.0%) |
| 20 to 24 Minutes | 120 (36.9%) | 91 (24.1%) |
| 25 to 29 Minutes | 35 (10.8%) | 28 (7.4%) |
| 30 to 34 Minutes | 13 (4.0%) | 52 (13.8%) |
| 35 to 39 Minutes | 0 (0.0%) | 4 (1.1%) |
| 40 to 44 Minutes | 0 (0.0%) | 10 (2.6%) |
| 45 to 59 Minutes | 31 (9.5%) | 9 (2.4%) |
| 60 to 89 Minutes | 17 (5.2%) | 31 (8.2%) |
| 90 or more Minutes | 0 (0.0%) | 26 (6.9%) |
Time of Departure to Work by Sex in Munford
The most frequent times of departure to work in Munford are 6:00 AM to 6:29 AM (73, 22.5%) for males and 7:00 AM to 7:29 AM (85, 22.5%) for females.
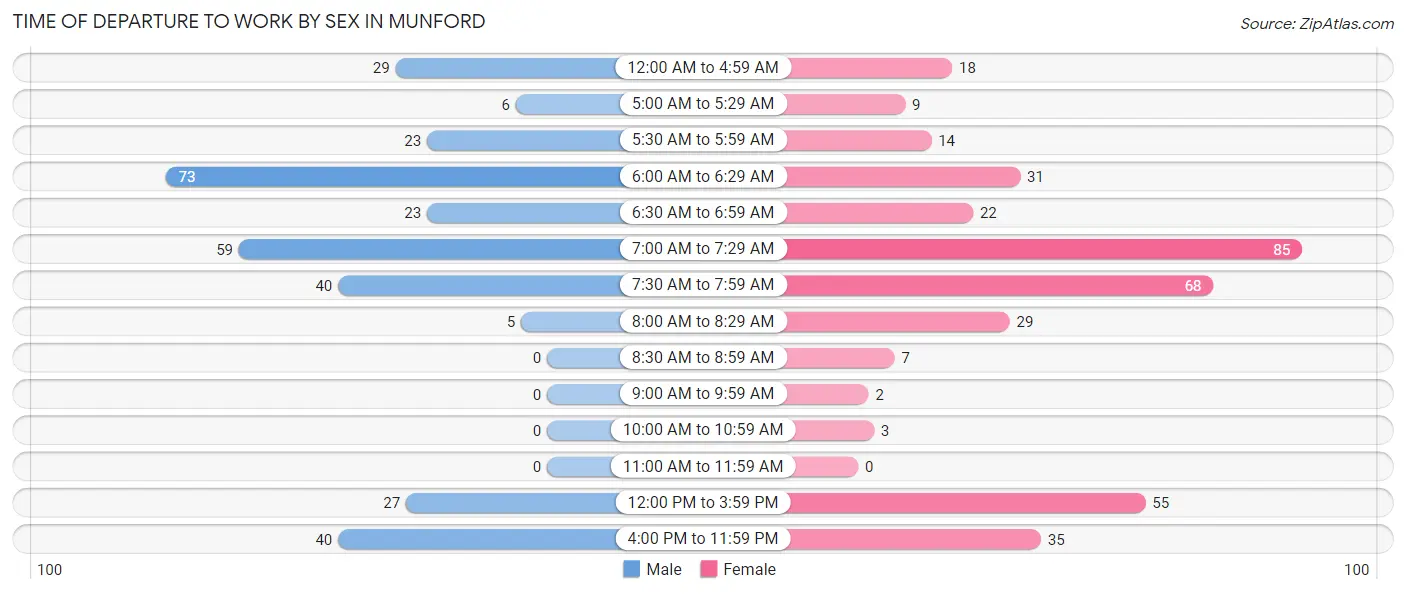
| Time of Departure | Male | Female |
| 12:00 AM to 4:59 AM | 29 (8.9%) | 18 (4.8%) |
| 5:00 AM to 5:29 AM | 6 (1.8%) | 9 (2.4%) |
| 5:30 AM to 5:59 AM | 23 (7.1%) | 14 (3.7%) |
| 6:00 AM to 6:29 AM | 73 (22.5%) | 31 (8.2%) |
| 6:30 AM to 6:59 AM | 23 (7.1%) | 22 (5.8%) |
| 7:00 AM to 7:29 AM | 59 (18.1%) | 85 (22.5%) |
| 7:30 AM to 7:59 AM | 40 (12.3%) | 68 (18.0%) |
| 8:00 AM to 8:29 AM | 5 (1.5%) | 29 (7.7%) |
| 8:30 AM to 8:59 AM | 0 (0.0%) | 7 (1.8%) |
| 9:00 AM to 9:59 AM | 0 (0.0%) | 2 (0.5%) |
| 10:00 AM to 10:59 AM | 0 (0.0%) | 3 (0.8%) |
| 11:00 AM to 11:59 AM | 0 (0.0%) | 0 (0.0%) |
| 12:00 PM to 3:59 PM | 27 (8.3%) | 55 (14.5%) |
| 4:00 PM to 11:59 PM | 40 (12.3%) | 35 (9.3%) |
| Total | 325 (100.0%) | 378 (100.0%) |
Housing Occupancy in Munford
Occupancy by Ownership in Munford
Of the total 684 dwellings in Munford, owner-occupied units account for 625 (91.4%), while renter-occupied units make up 59 (8.6%).
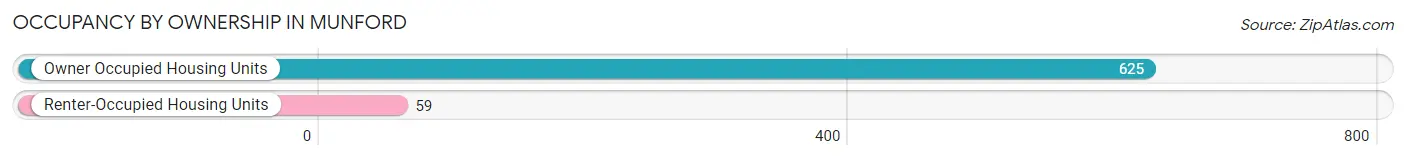
| Occupancy | # Housing Units | % Housing Units |
| Owner Occupied Housing Units | 625 | 91.4% |
| Renter-Occupied Housing Units | 59 | 8.6% |
| Total Occupied Housing Units | 684 | 100.0% |
Occupancy by Household Size in Munford
| Household Size | # Housing Units | % Housing Units |
| 1-Person Household | 174 | 25.4% |
| 2-Person Household | 207 | 30.3% |
| 3-Person Household | 198 | 28.9% |
| 4+ Person Household | 105 | 15.3% |
| Total Housing Units | 684 | 100.0% |
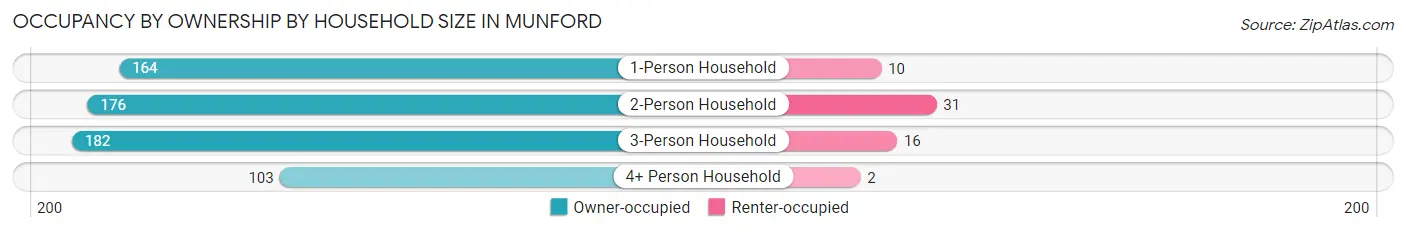
Occupancy by Ownership by Household Size in Munford
| Household Size | Owner-occupied | Renter-occupied |
| 1-Person Household | 164 (94.3%) | 10 (5.8%) |
| 2-Person Household | 176 (85.0%) | 31 (15.0%) |
| 3-Person Household | 182 (91.9%) | 16 (8.1%) |
| 4+ Person Household | 103 (98.1%) | 2 (1.9%) |
| Total Housing Units | 625 (91.4%) | 59 (8.6%) |
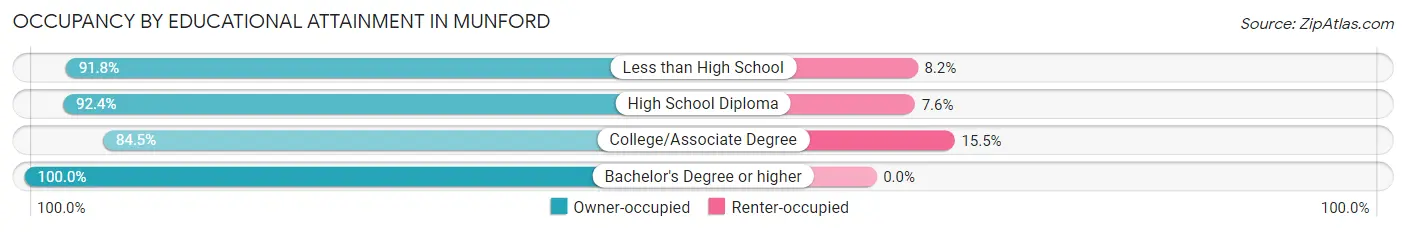
Occupancy by Educational Attainment in Munford
| Household Size | Owner-occupied | Renter-occupied |
| Less than High School | 101 (91.8%) | 9 (8.2%) |
| High School Diploma | 278 (92.4%) | 23 (7.6%) |
| College/Associate Degree | 147 (84.5%) | 27 (15.5%) |
| Bachelor's Degree or higher | 99 (100.0%) | 0 (0.0%) |
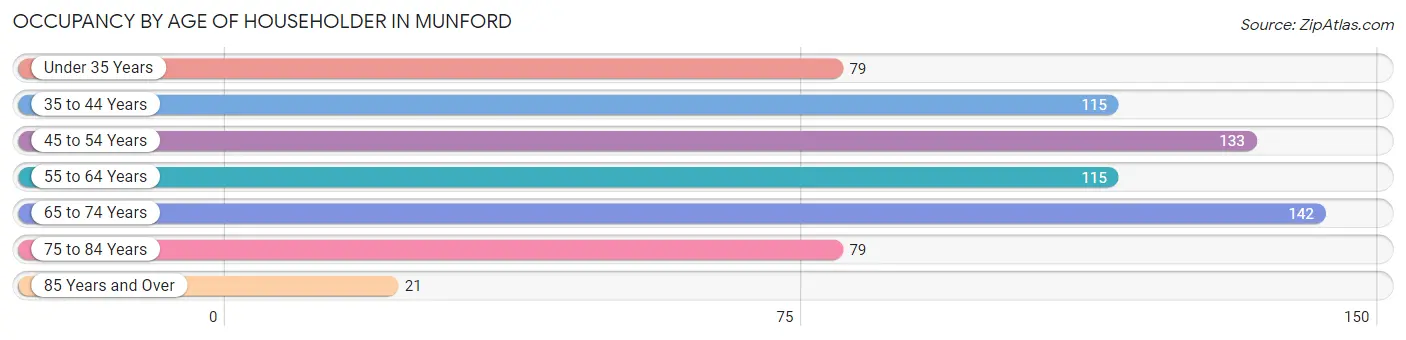
Occupancy by Age of Householder in Munford
| Age Bracket | # Households | % Households |
| Under 35 Years | 79 | 11.6% |
| 35 to 44 Years | 115 | 16.8% |
| 45 to 54 Years | 133 | 19.4% |
| 55 to 64 Years | 115 | 16.8% |
| 65 to 74 Years | 142 | 20.8% |
| 75 to 84 Years | 79 | 11.6% |
| 85 Years and Over | 21 | 3.1% |
| Total | 684 | 100.0% |
Housing Finances in Munford
Median Income by Occupancy in Munford
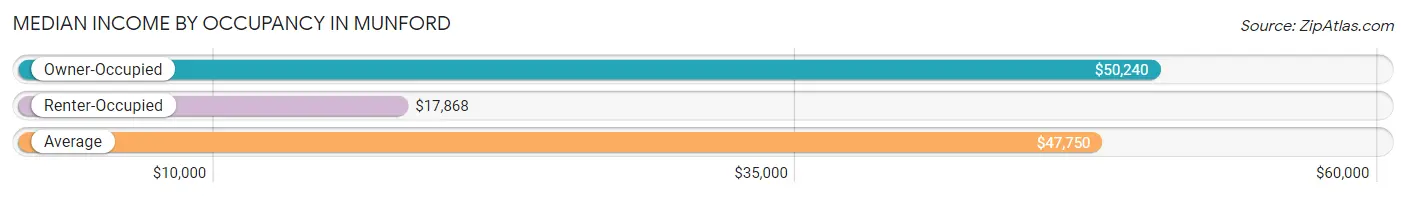
| Occupancy Type | # Households | Median Income |
| Owner-Occupied | 625 (91.4%) | $50,240 |
| Renter-Occupied | 59 (8.6%) | $17,868 |
| Average | 684 (100.0%) | $47,750 |
Occupancy by Householder Income Bracket in Munford
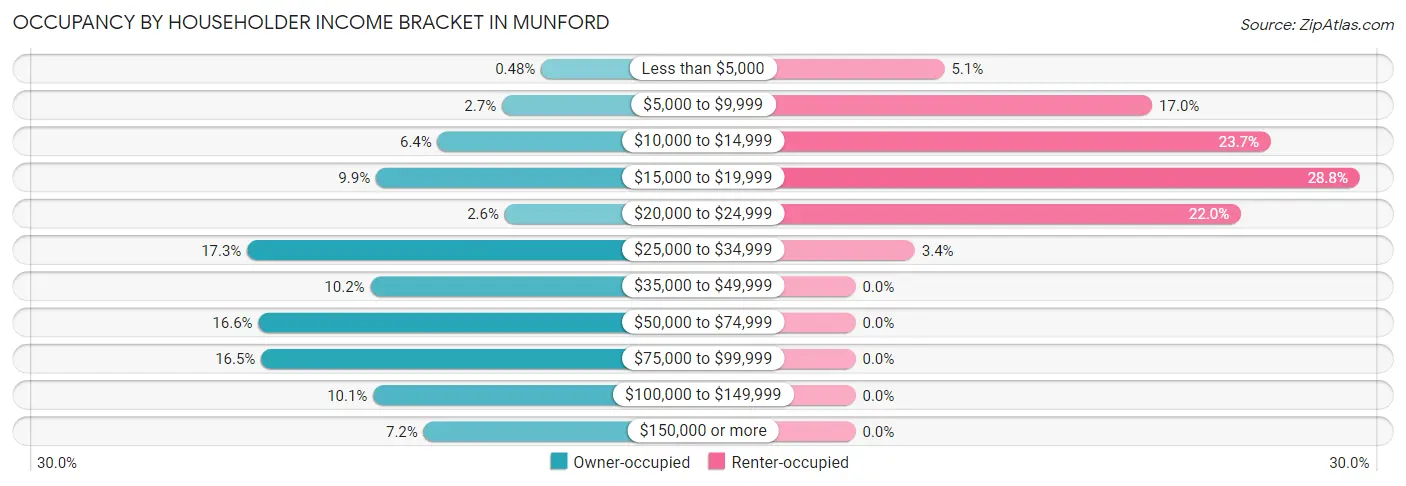
| Income Bracket | Owner-occupied | Renter-occupied |
| Less than $5,000 | 3 (0.5%) | 3 (5.1%) |
| $5,000 to $9,999 | 17 (2.7%) | 10 (17.0%) |
| $10,000 to $14,999 | 40 (6.4%) | 14 (23.7%) |
| $15,000 to $19,999 | 62 (9.9%) | 17 (28.8%) |
| $20,000 to $24,999 | 16 (2.6%) | 13 (22.0%) |
| $25,000 to $34,999 | 108 (17.3%) | 2 (3.4%) |
| $35,000 to $49,999 | 64 (10.2%) | 0 (0.0%) |
| $50,000 to $74,999 | 104 (16.6%) | 0 (0.0%) |
| $75,000 to $99,999 | 103 (16.5%) | 0 (0.0%) |
| $100,000 to $149,999 | 63 (10.1%) | 0 (0.0%) |
| $150,000 or more | 45 (7.2%) | 0 (0.0%) |
| Total | 625 (100.0%) | 59 (100.0%) |
Monthly Housing Cost Tiers in Munford
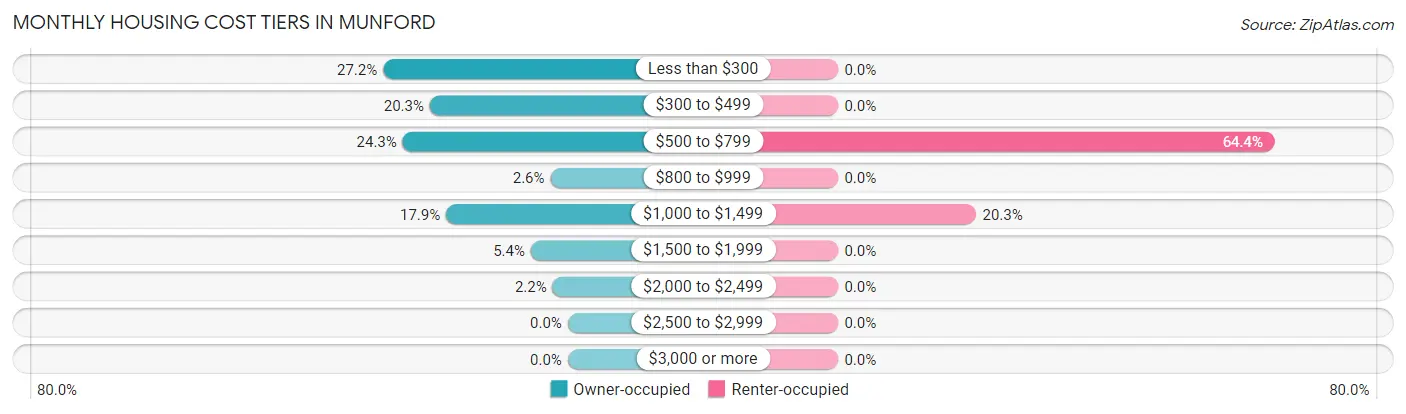
| Monthly Cost | Owner-occupied | Renter-occupied |
| Less than $300 | 170 (27.2%) | 0 (0.0%) |
| $300 to $499 | 127 (20.3%) | 0 (0.0%) |
| $500 to $799 | 152 (24.3%) | 38 (64.4%) |
| $800 to $999 | 16 (2.6%) | 0 (0.0%) |
| $1,000 to $1,499 | 112 (17.9%) | 12 (20.3%) |
| $1,500 to $1,999 | 34 (5.4%) | 0 (0.0%) |
| $2,000 to $2,499 | 14 (2.2%) | 0 (0.0%) |
| $2,500 to $2,999 | 0 (0.0%) | 0 (0.0%) |
| $3,000 or more | 0 (0.0%) | 0 (0.0%) |
| Total | 625 (100.0%) | 59 (100.0%) |
Physical Housing Characteristics in Munford
Housing Structures in Munford
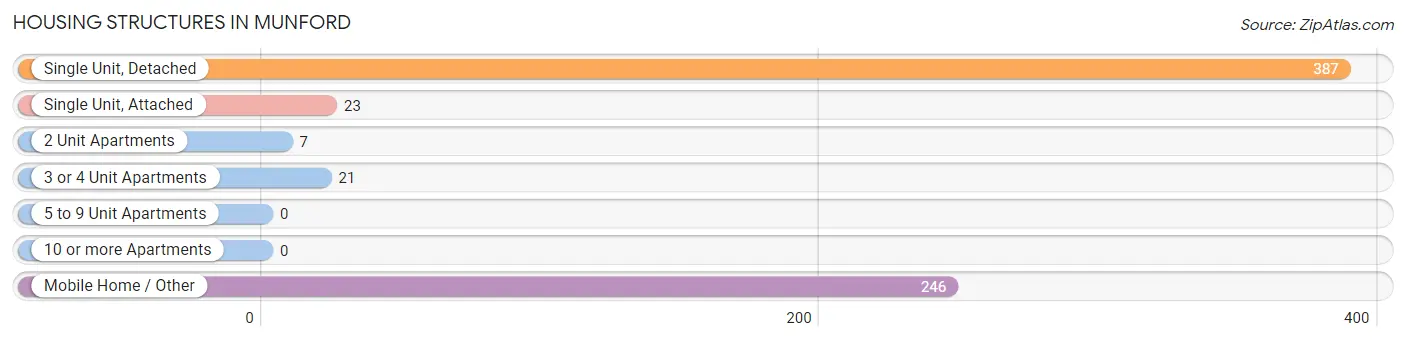
| Structure Type | # Housing Units | % Housing Units |
| Single Unit, Detached | 387 | 56.6% |
| Single Unit, Attached | 23 | 3.4% |
| 2 Unit Apartments | 7 | 1.0% |
| 3 or 4 Unit Apartments | 21 | 3.1% |
| 5 to 9 Unit Apartments | 0 | 0.0% |
| 10 or more Apartments | 0 | 0.0% |
| Mobile Home / Other | 246 | 36.0% |
| Total | 684 | 100.0% |
Housing Structures by Occupancy in Munford
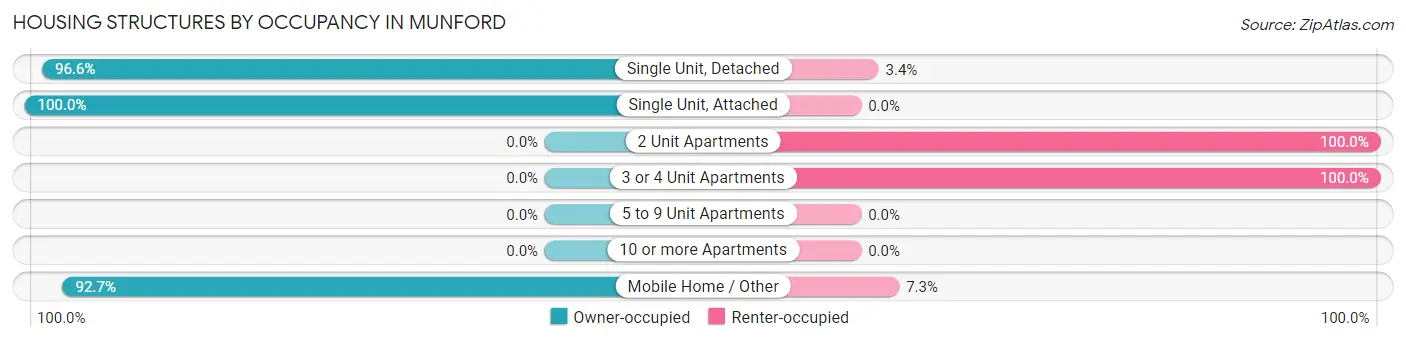
| Structure Type | Owner-occupied | Renter-occupied |
| Single Unit, Detached | 374 (96.6%) | 13 (3.4%) |
| Single Unit, Attached | 23 (100.0%) | 0 (0.0%) |
| 2 Unit Apartments | 0 (0.0%) | 7 (100.0%) |
| 3 or 4 Unit Apartments | 0 (0.0%) | 21 (100.0%) |
| 5 to 9 Unit Apartments | 0 (0.0%) | 0 (0.0%) |
| 10 or more Apartments | 0 (0.0%) | 0 (0.0%) |
| Mobile Home / Other | 228 (92.7%) | 18 (7.3%) |
| Total | 625 (91.4%) | 59 (8.6%) |
Housing Structures by Number of Rooms in Munford
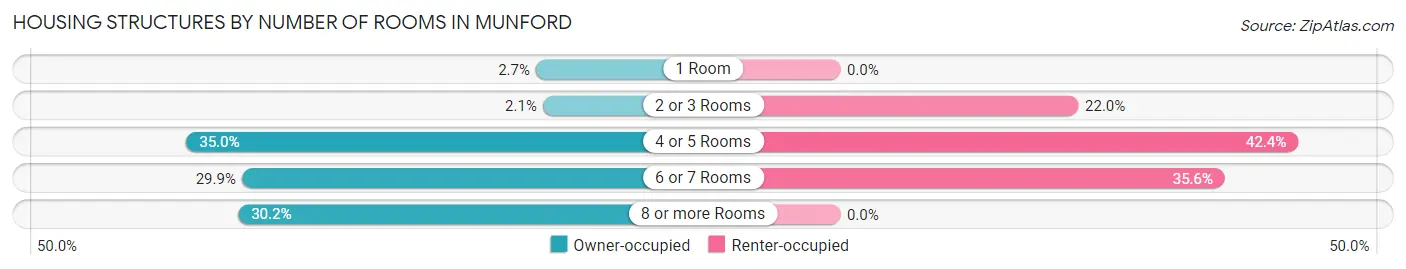
| Number of Rooms | Owner-occupied | Renter-occupied |
| 1 Room | 17 (2.7%) | 0 (0.0%) |
| 2 or 3 Rooms | 13 (2.1%) | 13 (22.0%) |
| 4 or 5 Rooms | 219 (35.0%) | 25 (42.4%) |
| 6 or 7 Rooms | 187 (29.9%) | 21 (35.6%) |
| 8 or more Rooms | 189 (30.2%) | 0 (0.0%) |
| Total | 625 (100.0%) | 59 (100.0%) |
Housing Structure by Heating Type in Munford
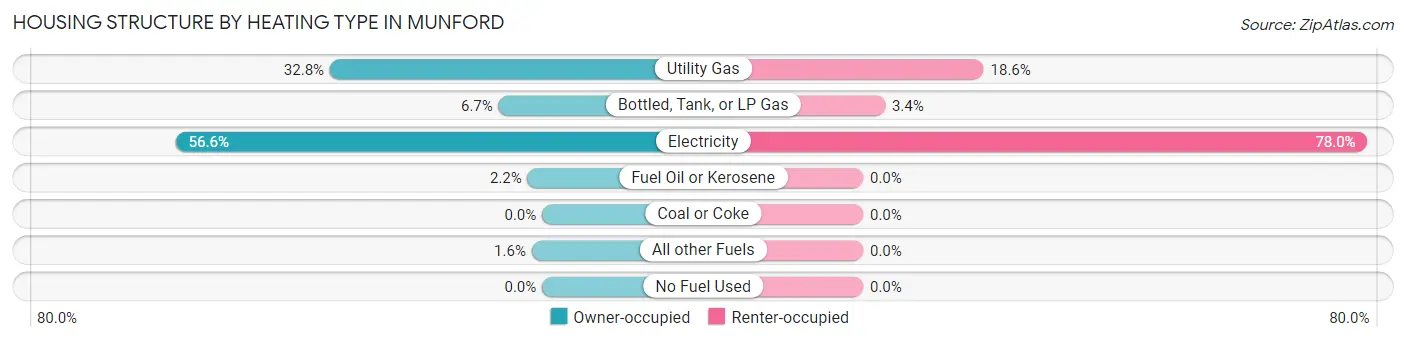
| Heating Type | Owner-occupied | Renter-occupied |
| Utility Gas | 205 (32.8%) | 11 (18.6%) |
| Bottled, Tank, or LP Gas | 42 (6.7%) | 2 (3.4%) |
| Electricity | 354 (56.6%) | 46 (78.0%) |
| Fuel Oil or Kerosene | 14 (2.2%) | 0 (0.0%) |
| Coal or Coke | 0 (0.0%) | 0 (0.0%) |
| All other Fuels | 10 (1.6%) | 0 (0.0%) |
| No Fuel Used | 0 (0.0%) | 0 (0.0%) |
| Total | 625 (100.0%) | 59 (100.0%) |
Household Vehicle Usage in Munford
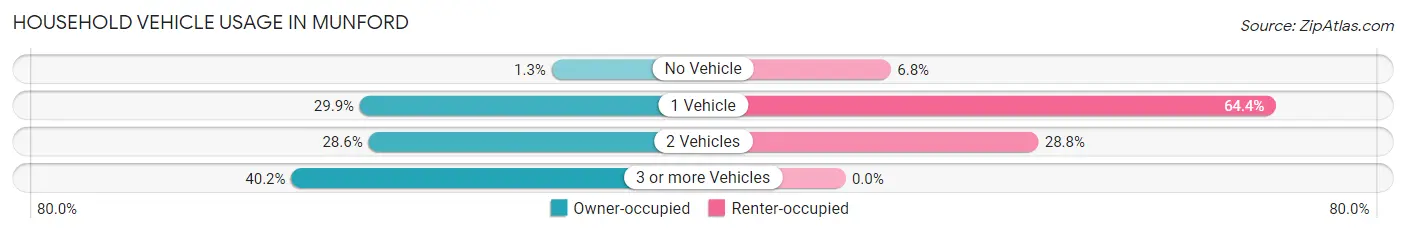
| Vehicles per Household | Owner-occupied | Renter-occupied |
| No Vehicle | 8 (1.3%) | 4 (6.8%) |
| 1 Vehicle | 187 (29.9%) | 38 (64.4%) |
| 2 Vehicles | 179 (28.6%) | 17 (28.8%) |
| 3 or more Vehicles | 251 (40.2%) | 0 (0.0%) |
| Total | 625 (100.0%) | 59 (100.0%) |
Real Estate & Mortgages in Munford
Real Estate and Mortgage Overview in Munford
| Characteristic | Without Mortgage | With Mortgage |
| Housing Units | 385 | 240 |
| Median Property Value | $46,600 | $113,900 |
| Median Household Income | $32,917 | $44 |
| Monthly Housing Costs | $317 | $0 |
| Real Estate Taxes | $242 | $18 |
Property Value by Mortgage Status in Munford
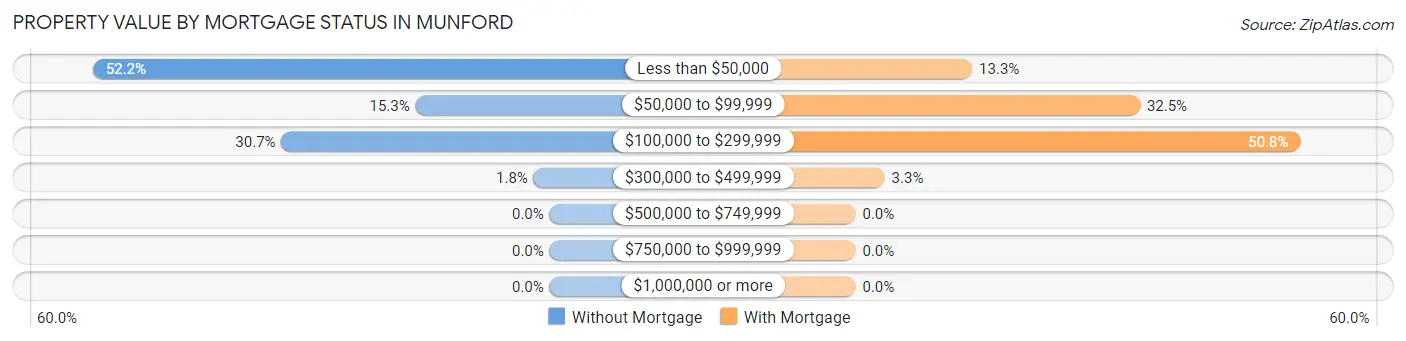
| Property Value | Without Mortgage | With Mortgage |
| Less than $50,000 | 201 (52.2%) | 32 (13.3%) |
| $50,000 to $99,999 | 59 (15.3%) | 78 (32.5%) |
| $100,000 to $299,999 | 118 (30.6%) | 122 (50.8%) |
| $300,000 to $499,999 | 7 (1.8%) | 8 (3.3%) |
| $500,000 to $749,999 | 0 (0.0%) | 0 (0.0%) |
| $750,000 to $999,999 | 0 (0.0%) | 0 (0.0%) |
| $1,000,000 or more | 0 (0.0%) | 0 (0.0%) |
| Total | 385 (100.0%) | 240 (100.0%) |
Household Income by Mortgage Status in Munford
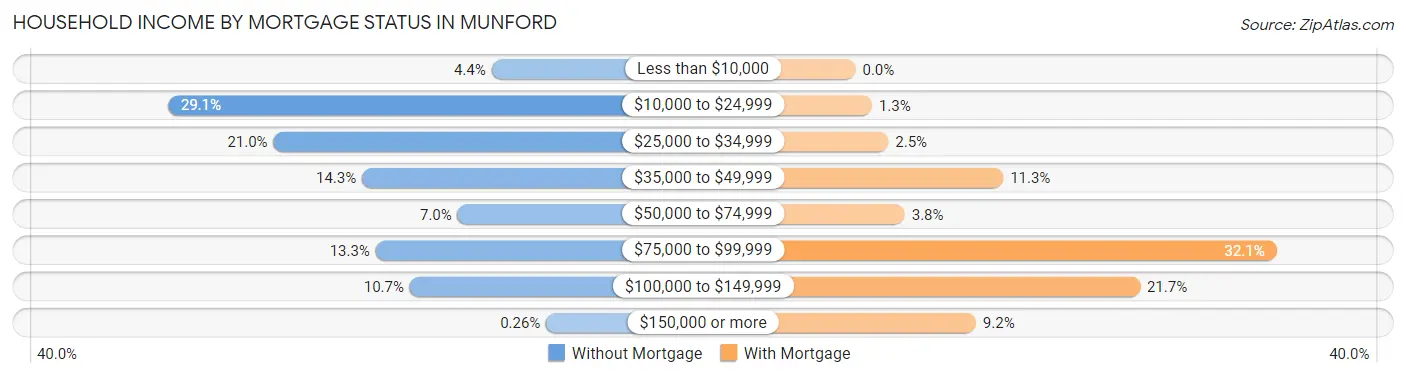
| Household Income | Without Mortgage | With Mortgage |
| Less than $10,000 | 17 (4.4%) | 0 (0.0%) |
| $10,000 to $24,999 | 112 (29.1%) | 3 (1.3%) |
| $25,000 to $34,999 | 81 (21.0%) | 6 (2.5%) |
| $35,000 to $49,999 | 55 (14.3%) | 27 (11.3%) |
| $50,000 to $74,999 | 27 (7.0%) | 9 (3.7%) |
| $75,000 to $99,999 | 51 (13.3%) | 77 (32.1%) |
| $100,000 to $149,999 | 41 (10.6%) | 52 (21.7%) |
| $150,000 or more | 1 (0.3%) | 22 (9.2%) |
| Total | 385 (100.0%) | 240 (100.0%) |
Property Value to Household Income Ratio in Munford
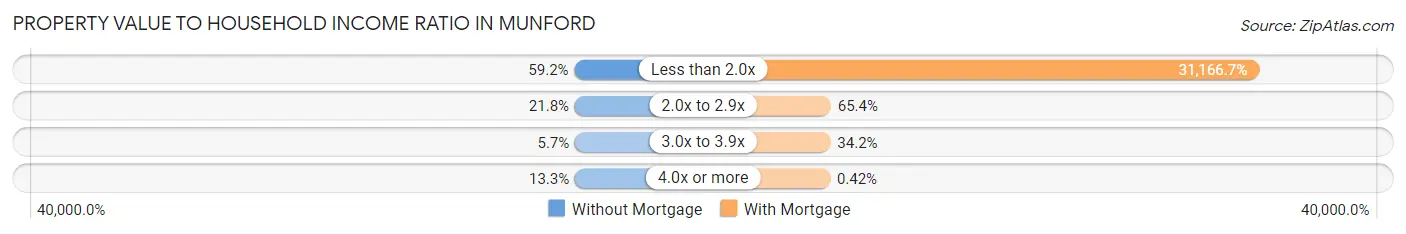
| Value-to-Income Ratio | Without Mortgage | With Mortgage |
| Less than 2.0x | 228 (59.2%) | 74,800 (31,166.7%) |
| 2.0x to 2.9x | 84 (21.8%) | 157 (65.4%) |
| 3.0x to 3.9x | 22 (5.7%) | 82 (34.2%) |
| 4.0x or more | 51 (13.3%) | 1 (0.4%) |
| Total | 385 (100.0%) | 240 (100.0%) |
Real Estate Taxes by Mortgage Status in Munford
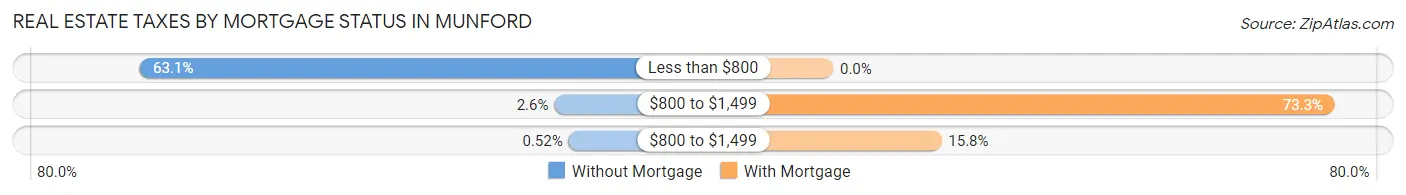
| Property Taxes | Without Mortgage | With Mortgage |
| Less than $800 | 243 (63.1%) | 0 (0.0%) |
| $800 to $1,499 | 10 (2.6%) | 176 (73.3%) |
| $800 to $1,499 | 2 (0.5%) | 38 (15.8%) |
| Total | 385 (100.0%) | 240 (100.0%) |
Health & Disability in Munford
Health Insurance Coverage by Age in Munford
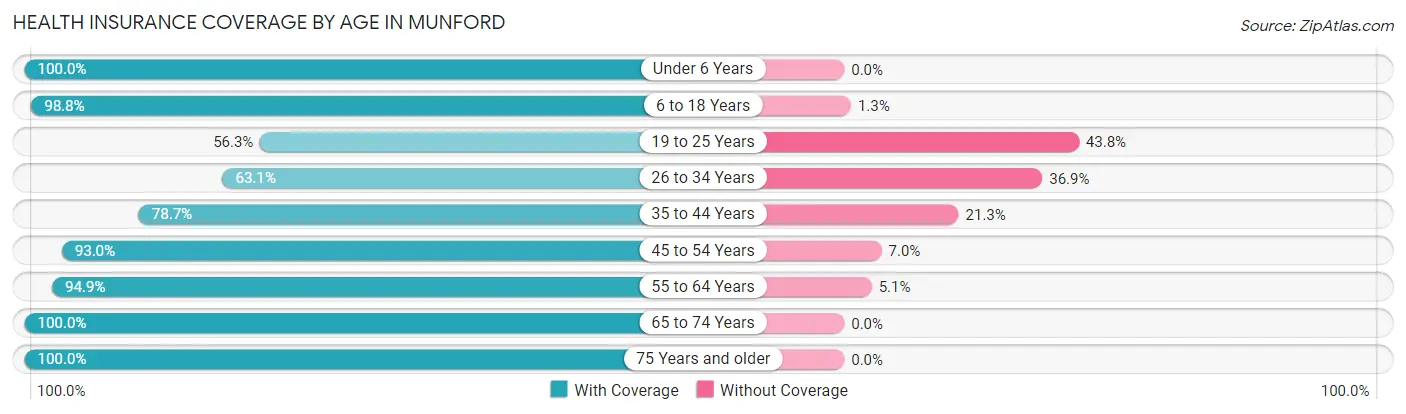
| Age Bracket | With Coverage | Without Coverage |
| Under 6 Years | 118 (100.0%) | 0 (0.0%) |
| 6 to 18 Years | 316 (98.8%) | 4 (1.3%) |
| 19 to 25 Years | 99 (56.2%) | 77 (43.8%) |
| 26 to 34 Years | 82 (63.1%) | 48 (36.9%) |
| 35 to 44 Years | 155 (78.7%) | 42 (21.3%) |
| 45 to 54 Years | 254 (93.0%) | 19 (7.0%) |
| 55 to 64 Years | 204 (94.9%) | 11 (5.1%) |
| 65 to 74 Years | 162 (100.0%) | 0 (0.0%) |
| 75 Years and older | 152 (100.0%) | 0 (0.0%) |
| Total | 1,542 (88.5%) | 201 (11.5%) |
Health Insurance Coverage by Citizenship Status in Munford
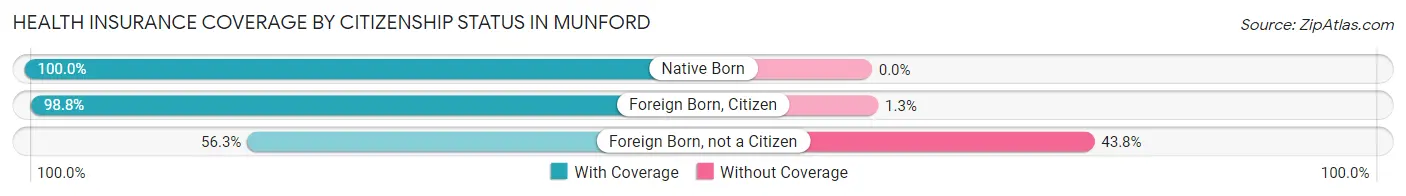
| Citizenship Status | With Coverage | Without Coverage |
| Native Born | 118 (100.0%) | 0 (0.0%) |
| Foreign Born, Citizen | 316 (98.8%) | 4 (1.3%) |
| Foreign Born, not a Citizen | 99 (56.2%) | 77 (43.8%) |
Health Insurance Coverage by Household Income in Munford
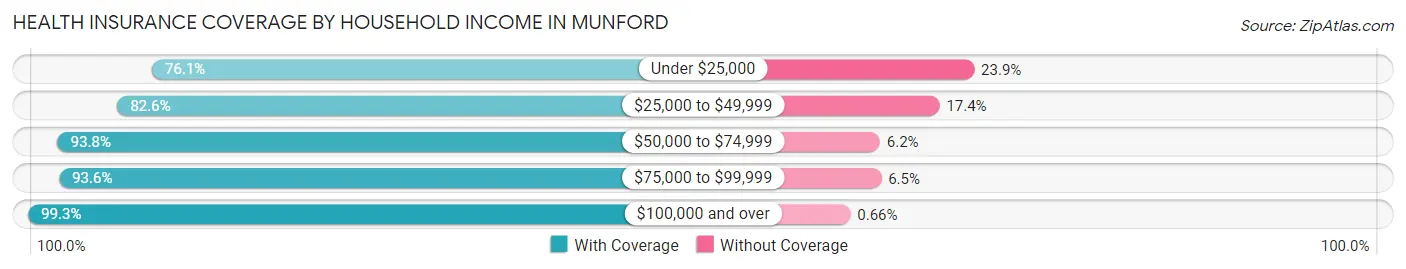
| Household Income | With Coverage | Without Coverage |
| Under $25,000 | 284 (76.1%) | 89 (23.9%) |
| $25,000 to $49,999 | 319 (82.6%) | 67 (17.4%) |
| $50,000 to $74,999 | 318 (93.8%) | 21 (6.2%) |
| $75,000 to $99,999 | 319 (93.5%) | 22 (6.5%) |
| $100,000 and over | 302 (99.3%) | 2 (0.7%) |
Public vs Private Health Insurance Coverage by Age in Munford
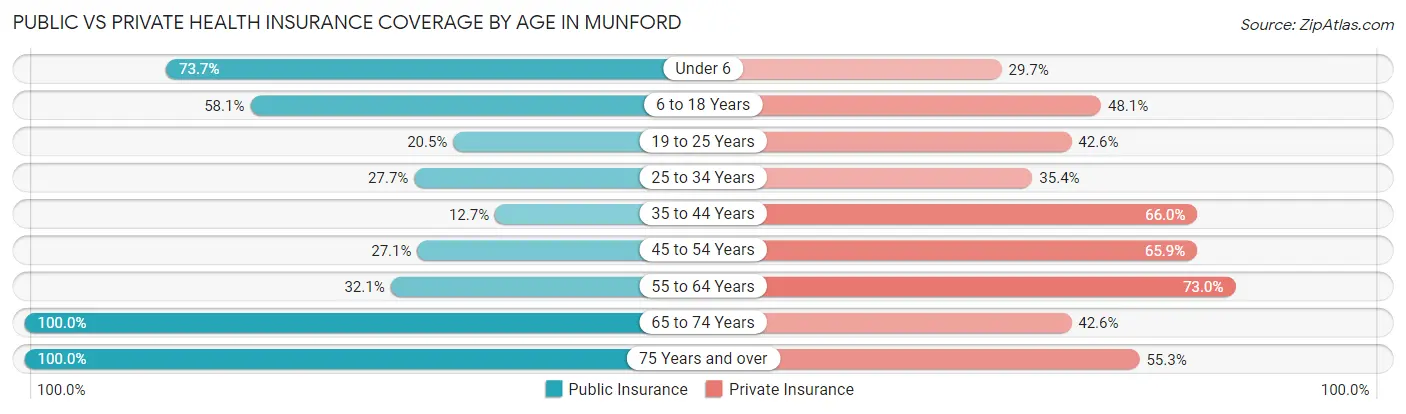
| Age Bracket | Public Insurance | Private Insurance |
| Under 6 | 87 (73.7%) | 35 (29.7%) |
| 6 to 18 Years | 186 (58.1%) | 154 (48.1%) |
| 19 to 25 Years | 36 (20.4%) | 75 (42.6%) |
| 25 to 34 Years | 36 (27.7%) | 46 (35.4%) |
| 35 to 44 Years | 25 (12.7%) | 130 (66.0%) |
| 45 to 54 Years | 74 (27.1%) | 180 (65.9%) |
| 55 to 64 Years | 69 (32.1%) | 157 (73.0%) |
| 65 to 74 Years | 162 (100.0%) | 69 (42.6%) |
| 75 Years and over | 152 (100.0%) | 84 (55.3%) |
| Total | 827 (47.4%) | 930 (53.4%) |
Disability Status by Sex by Age in Munford
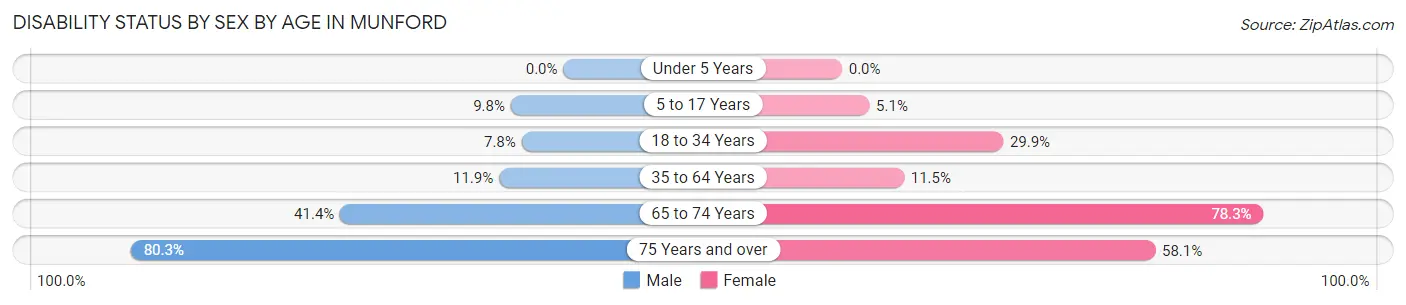
| Age Bracket | Male | Female |
| Under 5 Years | 0 (0.0%) | 0 (0.0%) |
| 5 to 17 Years | 12 (9.8%) | 9 (5.1%) |
| 18 to 34 Years | 10 (7.7%) | 64 (29.9%) |
| 35 to 64 Years | 34 (11.9%) | 46 (11.5%) |
| 65 to 74 Years | 29 (41.4%) | 72 (78.3%) |
| 75 Years and over | 53 (80.3%) | 50 (58.1%) |
Disability Class by Sex by Age in Munford
Disability Class: Hearing Difficulty
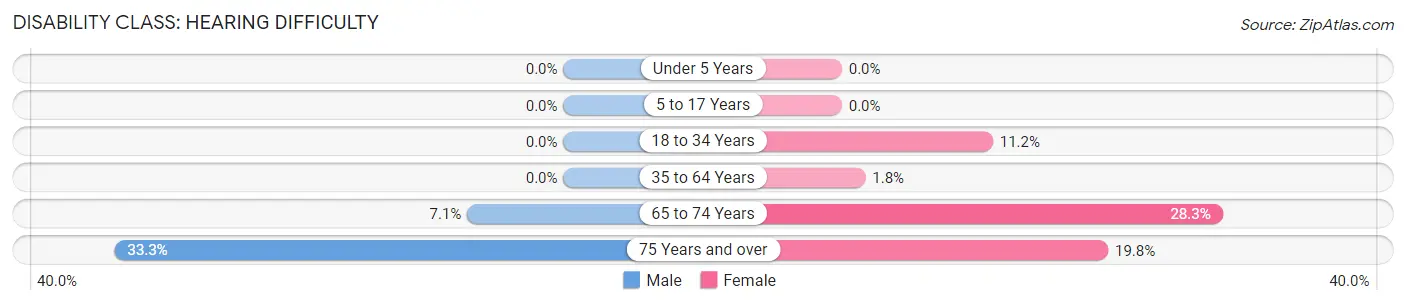
| Age Bracket | Male | Female |
| Under 5 Years | 0 (0.0%) | 0 (0.0%) |
| 5 to 17 Years | 0 (0.0%) | 0 (0.0%) |
| 18 to 34 Years | 0 (0.0%) | 24 (11.2%) |
| 35 to 64 Years | 0 (0.0%) | 7 (1.8%) |
| 65 to 74 Years | 5 (7.1%) | 26 (28.3%) |
| 75 Years and over | 22 (33.3%) | 17 (19.8%) |
Disability Class: Vision Difficulty
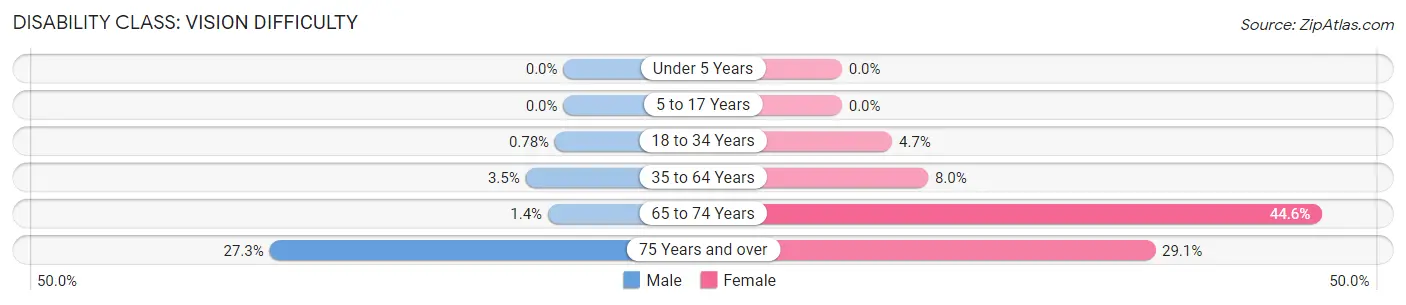
| Age Bracket | Male | Female |
| Under 5 Years | 0 (0.0%) | 0 (0.0%) |
| 5 to 17 Years | 0 (0.0%) | 0 (0.0%) |
| 18 to 34 Years | 1 (0.8%) | 10 (4.7%) |
| 35 to 64 Years | 10 (3.5%) | 32 (8.0%) |
| 65 to 74 Years | 1 (1.4%) | 41 (44.6%) |
| 75 Years and over | 18 (27.3%) | 25 (29.1%) |
Disability Class: Cognitive Difficulty
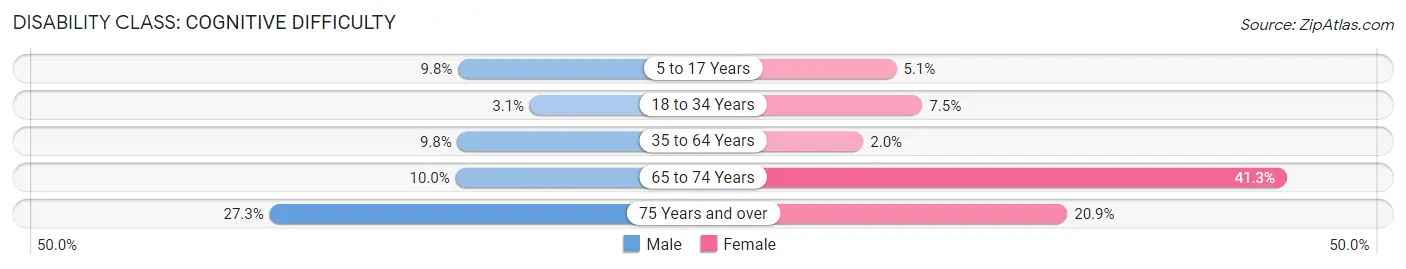
| Age Bracket | Male | Female |
| 5 to 17 Years | 12 (9.8%) | 9 (5.1%) |
| 18 to 34 Years | 4 (3.1%) | 16 (7.5%) |
| 35 to 64 Years | 28 (9.8%) | 8 (2.0%) |
| 65 to 74 Years | 7 (10.0%) | 38 (41.3%) |
| 75 Years and over | 18 (27.3%) | 18 (20.9%) |
Disability Class: Ambulatory Difficulty
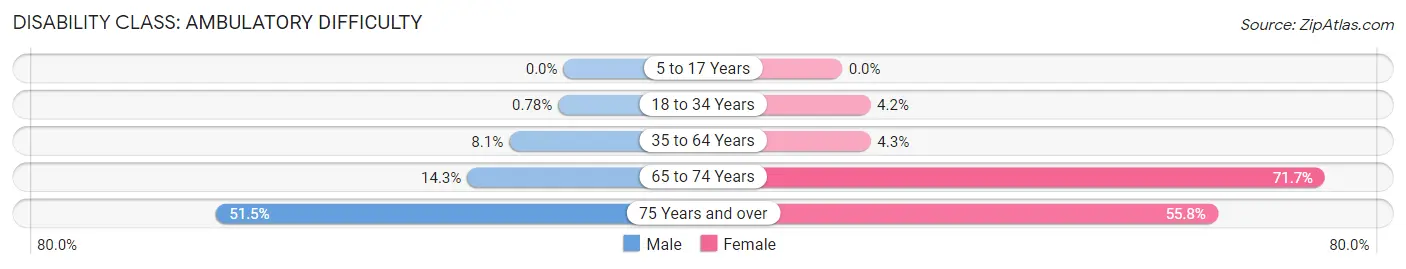
| Age Bracket | Male | Female |
| 5 to 17 Years | 0 (0.0%) | 0 (0.0%) |
| 18 to 34 Years | 1 (0.8%) | 9 (4.2%) |
| 35 to 64 Years | 23 (8.1%) | 17 (4.3%) |
| 65 to 74 Years | 10 (14.3%) | 66 (71.7%) |
| 75 Years and over | 34 (51.5%) | 48 (55.8%) |
Disability Class: Self-Care Difficulty
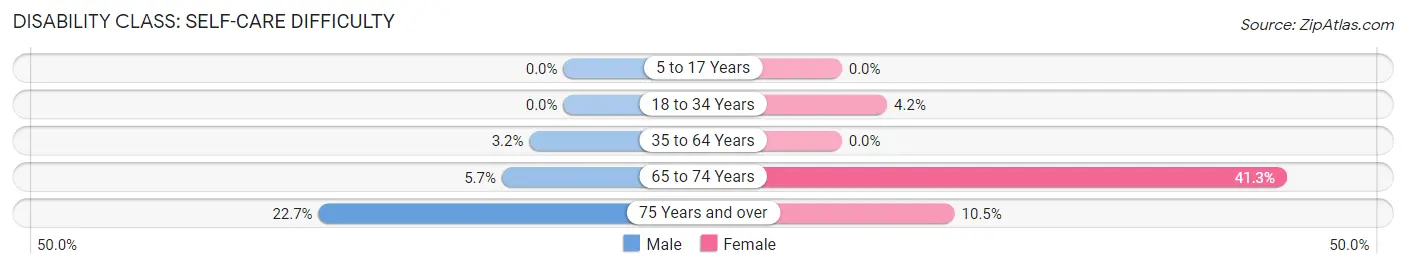
| Age Bracket | Male | Female |
| 5 to 17 Years | 0 (0.0%) | 0 (0.0%) |
| 18 to 34 Years | 0 (0.0%) | 9 (4.2%) |
| 35 to 64 Years | 9 (3.2%) | 0 (0.0%) |
| 65 to 74 Years | 4 (5.7%) | 38 (41.3%) |
| 75 Years and over | 15 (22.7%) | 9 (10.5%) |
Technology Access in Munford
Computing Device Access in Munford
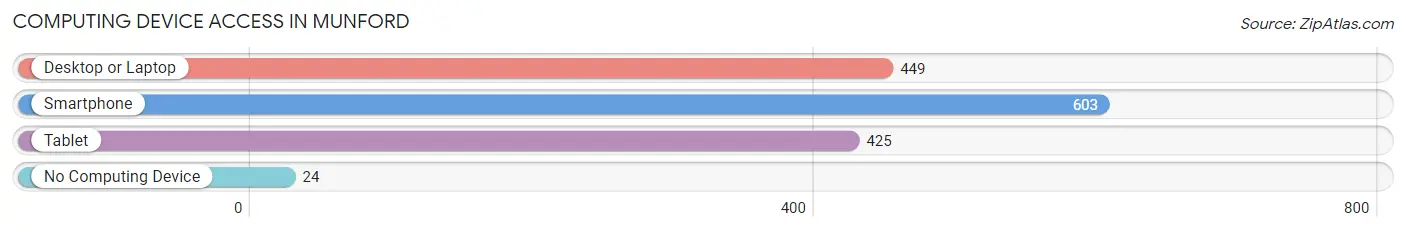
| Device Type | # Households | % Households |
| Desktop or Laptop | 449 | 65.6% |
| Smartphone | 603 | 88.2% |
| Tablet | 425 | 62.1% |
| No Computing Device | 24 | 3.5% |
| Total | 684 | 100.0% |
Internet Access in Munford
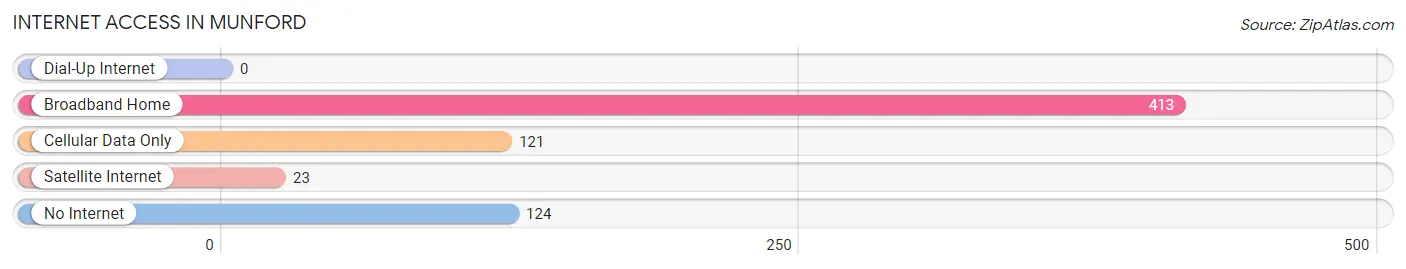
| Internet Type | # Households | % Households |
| Dial-Up Internet | 0 | 0.0% |
| Broadband Home | 413 | 60.4% |
| Cellular Data Only | 121 | 17.7% |
| Satellite Internet | 23 | 3.4% |
| No Internet | 124 | 18.1% |
| Total | 684 | 100.0% |
Munford Summary
Munford, Alabama is a small town located in Talladega County, Alabama. It is situated in the foothills of the Appalachian Mountains and is part of the Birmingham-Hoover Metropolitan Statistical Area. The town has a population of 1,845 people, according to the 2010 census.
History
Munford was founded in 1887 by a group of settlers from Georgia. The town was named after a local family, the Munfords. The town was incorporated in 1891 and was the first town in Talladega County to be incorporated.
The town was originally a farming community, but in the early 1900s, the town began to grow and develop. The first industry in the town was a cotton mill, which was built in 1906. The mill was a major employer in the town and provided jobs for many of the town’s residents.
In the 1920s, the town began to experience a period of growth and development. The town was connected to the rest of the state by the Birmingham-Anniston-Talladega Railroad, which was built in 1923. The railroad provided a link to the larger cities of Birmingham and Anniston.
The town also experienced a period of growth during the Great Depression. The town was able to attract new businesses and industries, which provided jobs for many of the town’s residents.
Geography
Munford is located in the foothills of the Appalachian Mountains in Talladega County, Alabama. The town is situated at the intersection of US Highway 78 and Alabama State Route 21. The town is located approximately 30 miles east of Birmingham and 40 miles west of Anniston.
The town is located in a hilly area and is surrounded by forests and rolling hills. The town is located at an elevation of 845 feet above sea level.
Economy
Munford’s economy is largely based on agriculture and manufacturing. The town is home to several small businesses, including a grocery store, a hardware store, and a few restaurants.
The town is also home to several manufacturing companies, including a furniture factory, a textile mill, and a plastics factory. These companies provide jobs for many of the town’s residents.
The town is also home to several small farms, which produce a variety of crops, including corn, soybeans, and cotton.
Demographics
According to the 2010 census, the population of Munford was 1,845 people. The town has a median household income of $35,000 and a median age of 38.
The town is predominantly white, with 87.3% of the population being white. The town also has a small African American population, with 8.7% of the population being African American. The town also has a small Hispanic population, with 2.2% of the population being Hispanic.
Conclusion
Munford, Alabama is a small town located in Talladega County, Alabama. The town has a population of 1,845 people, according to the 2010 census. The town is situated in the foothills of the Appalachian Mountains and is part of the Birmingham-Hoover Metropolitan Statistical Area. The town’s economy is largely based on agriculture and manufacturing. The town is predominantly white, with 87.3% of the population being white. The town also has a small African American population, with 8.7% of the population being African American. The town also has a small Hispanic population, with 2.2% of the population being Hispanic.
Common Questions
What is Per Capita Income in Munford?
Per Capita income in Munford is $23,004.
What is the Median Family Income in Munford?
Median Family Income in Munford is $59,063.
What is the Median Household income in Munford?
Median Household Income in Munford is $47,750.
What is Income or Wage Gap in Munford?
Income or Wage Gap in Munford is 4.3%.
Women in Munford earn 95.7 cents for every dollar earned by a man.
What is Inequality or Gini Index in Munford?
Inequality or Gini Index in Munford is 0.42.
What is the Total Population of Munford?
Total Population of Munford is 1,743.
What is the Total Male Population of Munford?
Total Male Population of Munford is 727.
What is the Total Female Population of Munford?
Total Female Population of Munford is 1,016.
What is the Ratio of Males per 100 Females in Munford?
There are 71.56 Males per 100 Females in Munford.
What is the Ratio of Females per 100 Males in Munford?
There are 139.75 Females per 100 Males in Munford.
What is the Median Population Age in Munford?
Median Population Age in Munford is 41.0 Years.
What is the Average Family Size in Munford
Average Family Size in Munford is 3.0 People.
What is the Average Household Size in Munford
Average Household Size in Munford is 2.5 People.
How Large is the Labor Force in Munford?
There are 848 People in the Labor Forcein in Munford.
What is the Percentage of People in the Labor Force in Munford?
59.4% of People are in the Labor Force in Munford.
What is the Unemployment Rate in Munford?
Unemployment Rate in Munford is 7.4%.