Mount Vernon, AL Map & Demographics
Mount Vernon Map
Mount Vernon Overview
$25,465
PER CAPITA INCOME
$53,095
AVG FAMILY INCOME
$41,164
AVG HOUSEHOLD INCOME
53.8%
WAGE / INCOME GAP [ % ]
46.2¢/ $1
WAGE / INCOME GAP [ $ ]
0.52
INEQUALITY / GINI INDEX
1,463
TOTAL POPULATION
793
MALE POPULATION
670
FEMALE POPULATION
118.36
MALES / 100 FEMALES
84.49
FEMALES / 100 MALES
39.6
MEDIAN AGE
3.5
AVG FAMILY SIZE
3.1
AVG HOUSEHOLD SIZE
610
LABOR FORCE [ PEOPLE ]
48.9%
PERCENT IN LABOR FORCE
0.8%
UNEMPLOYMENT RATE
Mount Vernon Zip Codes
Mount Vernon Area Codes
Income in Mount Vernon
Income Overview in Mount Vernon
Per Capita Income in Mount Vernon is $25,465, while median incomes of families and households are $53,095 and $41,164 respectively.
| Characteristic | Number | Measure |
| Per Capita Income | 1,463 | $25,465 |
| Median Family Income | 340 | $53,095 |
| Mean Family Income | 340 | $80,536 |
| Median Household Income | 451 | $41,164 |
| Mean Household Income | 451 | $67,943 |
| Income Deficit | 340 | $0 |
| Wage / Income Gap (%) | 1,463 | 53.76% |
| Wage / Income Gap ($) | 1,463 | 46.24¢ per $1 |
| Gini / Inequality Index | 1,463 | 0.52 |
Earnings by Sex in Mount Vernon
Average Earnings in Mount Vernon are $32,083, $45,781 for men and $21,167 for women, a difference of 53.8%.
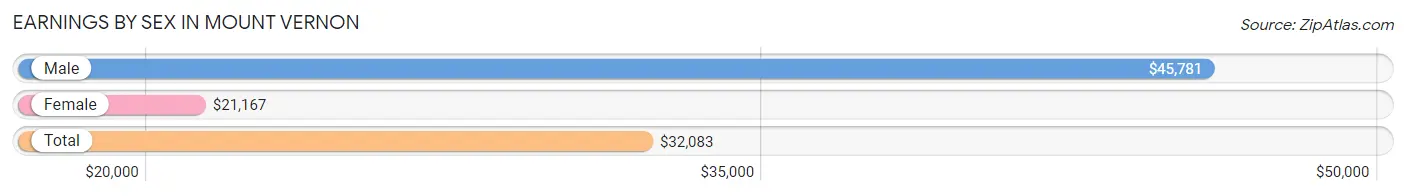
| Sex | Number | Average Earnings |
| Male | 407 (62.3%) | $45,781 |
| Female | 246 (37.7%) | $21,167 |
| Total | 653 (100.0%) | $32,083 |
Earnings by Sex by Income Bracket in Mount Vernon
The most common earnings brackets in Mount Vernon are $45,000 to $49,999 for men (124 | 30.5%) and $75,000 to $99,999 for women (40 | 16.3%).
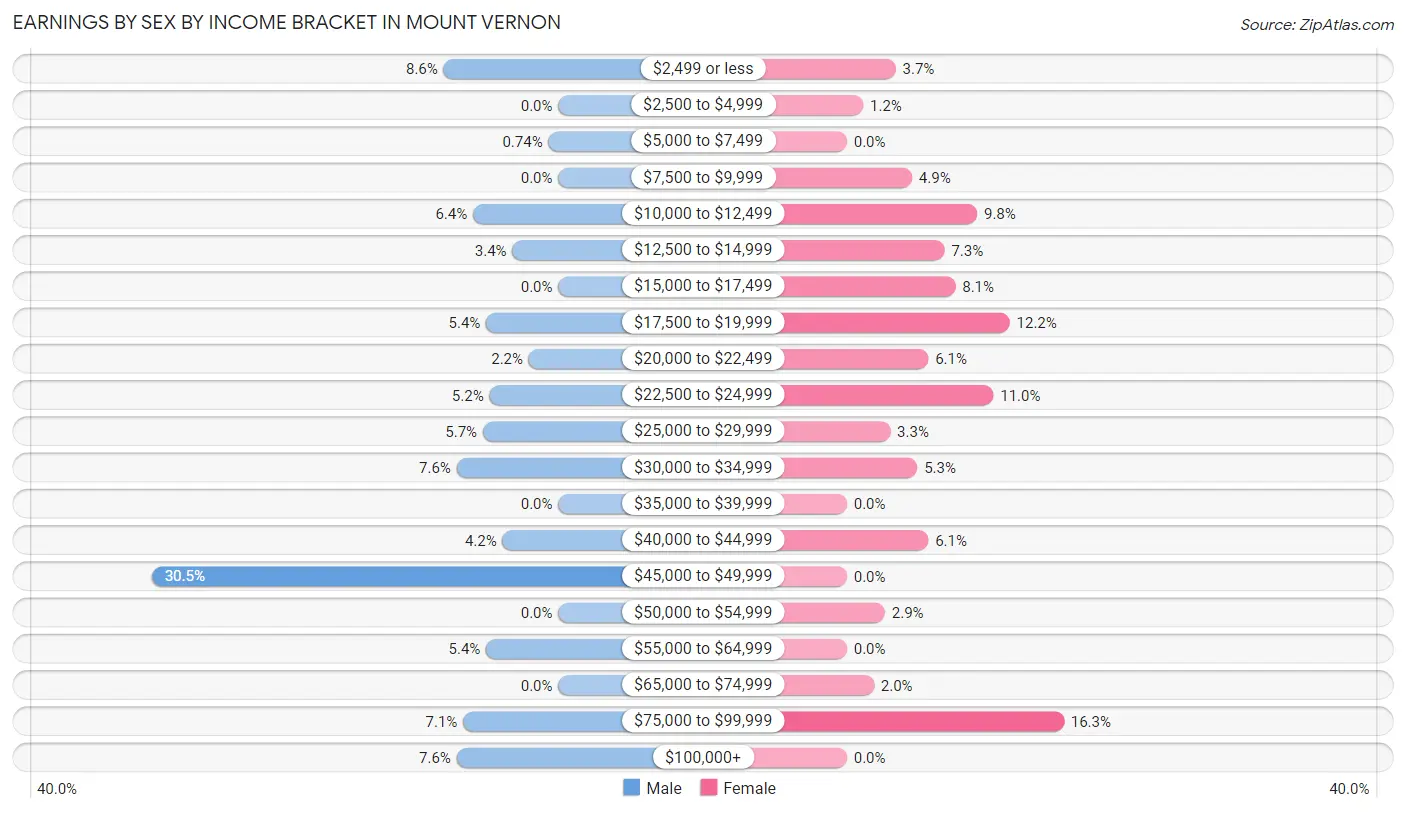
| Income | Male | Female |
| $2,499 or less | 35 (8.6%) | 9 (3.7%) |
| $2,500 to $4,999 | 0 (0.0%) | 3 (1.2%) |
| $5,000 to $7,499 | 3 (0.7%) | 0 (0.0%) |
| $7,500 to $9,999 | 0 (0.0%) | 12 (4.9%) |
| $10,000 to $12,499 | 26 (6.4%) | 24 (9.8%) |
| $12,500 to $14,999 | 14 (3.4%) | 18 (7.3%) |
| $15,000 to $17,499 | 0 (0.0%) | 20 (8.1%) |
| $17,500 to $19,999 | 22 (5.4%) | 30 (12.2%) |
| $20,000 to $22,499 | 9 (2.2%) | 15 (6.1%) |
| $22,500 to $24,999 | 21 (5.2%) | 27 (11.0%) |
| $25,000 to $29,999 | 23 (5.7%) | 8 (3.3%) |
| $30,000 to $34,999 | 31 (7.6%) | 13 (5.3%) |
| $35,000 to $39,999 | 0 (0.0%) | 0 (0.0%) |
| $40,000 to $44,999 | 17 (4.2%) | 15 (6.1%) |
| $45,000 to $49,999 | 124 (30.5%) | 0 (0.0%) |
| $50,000 to $54,999 | 0 (0.0%) | 7 (2.9%) |
| $55,000 to $64,999 | 22 (5.4%) | 0 (0.0%) |
| $65,000 to $74,999 | 0 (0.0%) | 5 (2.0%) |
| $75,000 to $99,999 | 29 (7.1%) | 40 (16.3%) |
| $100,000+ | 31 (7.6%) | 0 (0.0%) |
| Total | 407 (100.0%) | 246 (100.0%) |
Earnings by Sex by Educational Attainment in Mount Vernon
Average earnings in Mount Vernon are $47,031 for men and $23,009 for women, a difference of 51.1%. Men with an educational attainment of college or associate's degree enjoy the highest average annual earnings of $48,875, while those with high school diploma education earn the least with $29,028. Women with an educational attainment of bachelor's degree earn the most with the average annual earnings of $24,722, while those with high school diploma education have the smallest earnings of $18,125.
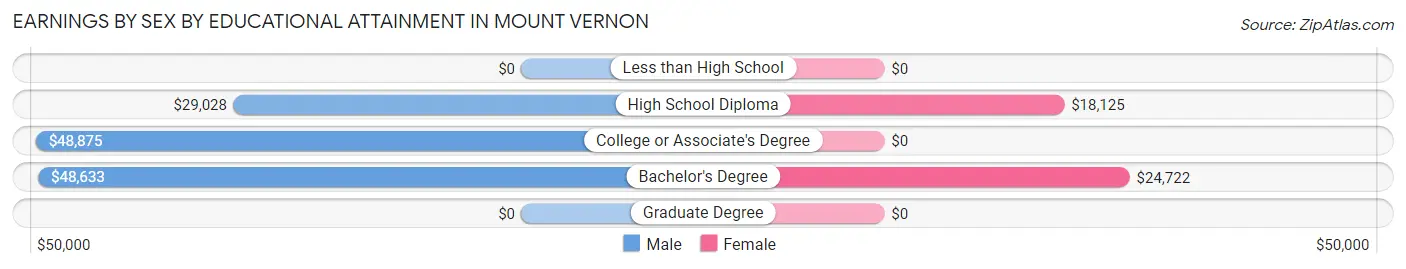
| Educational Attainment | Male Income | Female Income |
| Less than High School | - | - |
| High School Diploma | $29,028 | $18,125 |
| College or Associate's Degree | $48,875 | $0 |
| Bachelor's Degree | $48,633 | $24,722 |
| Graduate Degree | - | - |
| Total | $47,031 | $23,009 |
Family Income in Mount Vernon
Family Income Brackets in Mount Vernon
According to the Mount Vernon family income data, there are 57 families falling into the $50,000 to $74,999 income range, which is the most common income bracket and makes up 16.8% of all families. Conversely, the $200,000+ income bracket is the least frequent group with only 15 families (4.4%) belonging to this category.
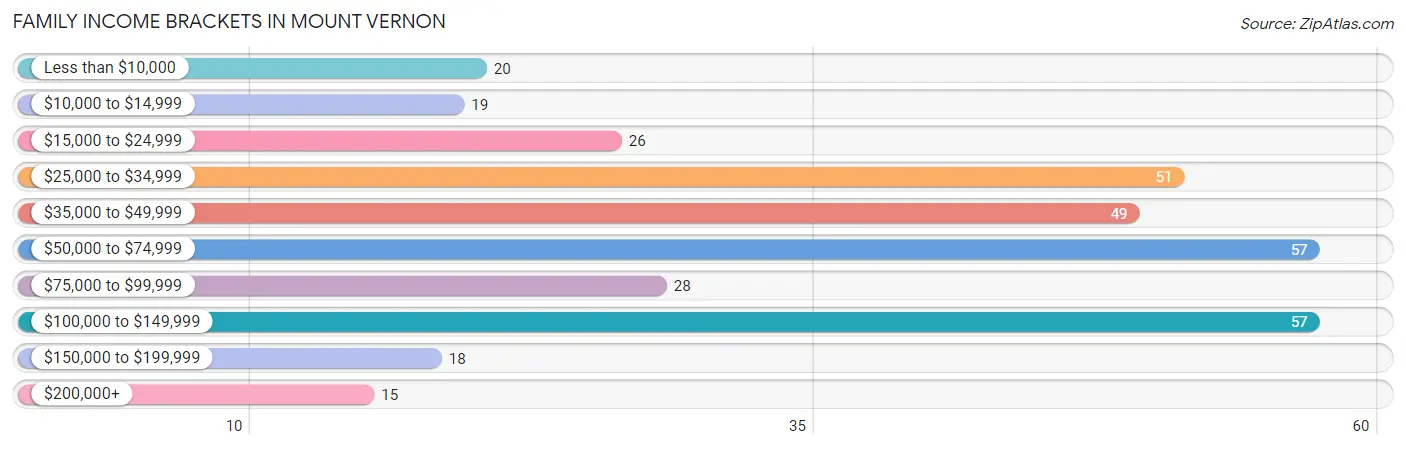
| Income Bracket | # Families | % Families |
| Less than $10,000 | 20 | 5.9% |
| $10,000 to $14,999 | 19 | 5.6% |
| $15,000 to $24,999 | 26 | 7.6% |
| $25,000 to $34,999 | 51 | 15.0% |
| $35,000 to $49,999 | 49 | 14.4% |
| $50,000 to $74,999 | 57 | 16.8% |
| $75,000 to $99,999 | 28 | 8.2% |
| $100,000 to $149,999 | 57 | 16.8% |
| $150,000 to $199,999 | 18 | 5.3% |
| $200,000+ | 15 | 4.4% |
Family Income by Famaliy Size in Mount Vernon
2-person families (156 | 45.9%) account for the highest median family income in Mount Vernon with $57,292 per family, while 2-person families (156 | 45.9%) have the highest median income of $28,646 per family member.
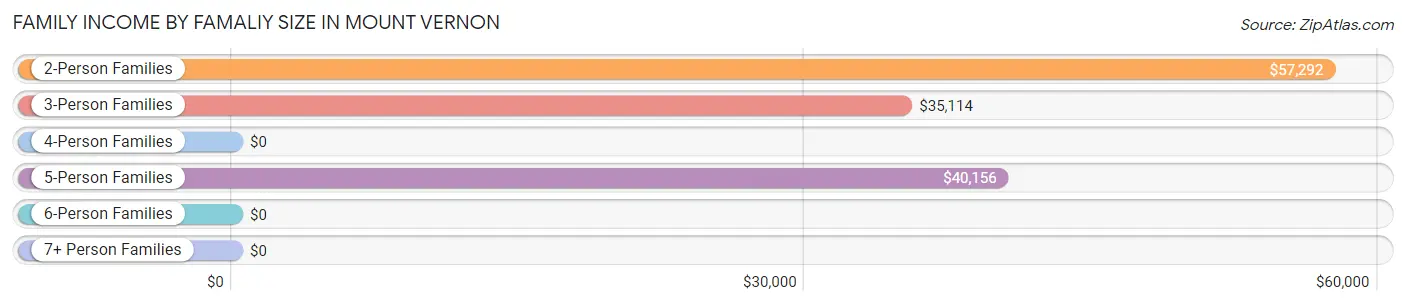
| Income Bracket | # Families | Median Income |
| 2-Person Families | 156 (45.9%) | $57,292 |
| 3-Person Families | 115 (33.8%) | $35,114 |
| 4-Person Families | 45 (13.2%) | $0 |
| 5-Person Families | 19 (5.6%) | $40,156 |
| 6-Person Families | 5 (1.5%) | $0 |
| 7+ Person Families | 0 (0.0%) | $0 |
| Total | 340 (100.0%) | $53,095 |
Family Income by Number of Earners in Mount Vernon
The median family income in Mount Vernon is $53,095, with families comprising 3+ earners (36) having the highest median family income of $156,250, while families with no earners (97) have the lowest median family income of $23,036, accounting for 10.6% and 28.5% of families, respectively.
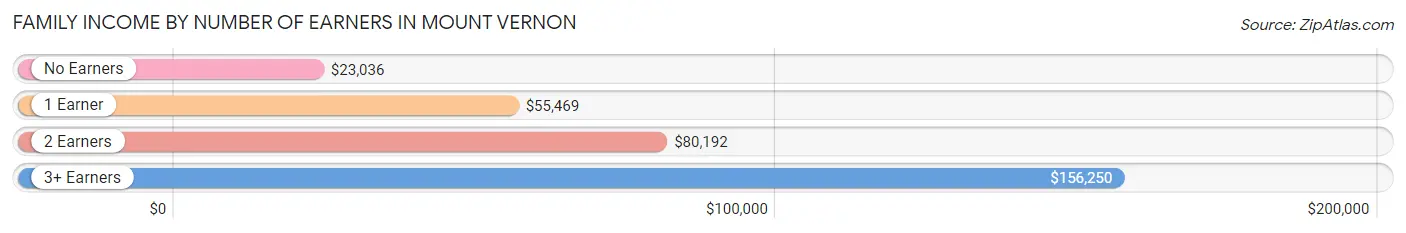
| Number of Earners | # Families | Median Income |
| No Earners | 97 (28.5%) | $23,036 |
| 1 Earner | 93 (27.4%) | $55,469 |
| 2 Earners | 114 (33.5%) | $80,192 |
| 3+ Earners | 36 (10.6%) | $156,250 |
| Total | 340 (100.0%) | $53,095 |
Household Income in Mount Vernon
Household Income Brackets in Mount Vernon
With 78 households falling in the category, the $50,000 to $74,999 income range is the most frequent in Mount Vernon, accounting for 17.3% of all households. In contrast, only 15 households (3.3%) fall into the $200,000+ income bracket, making it the least populous group.
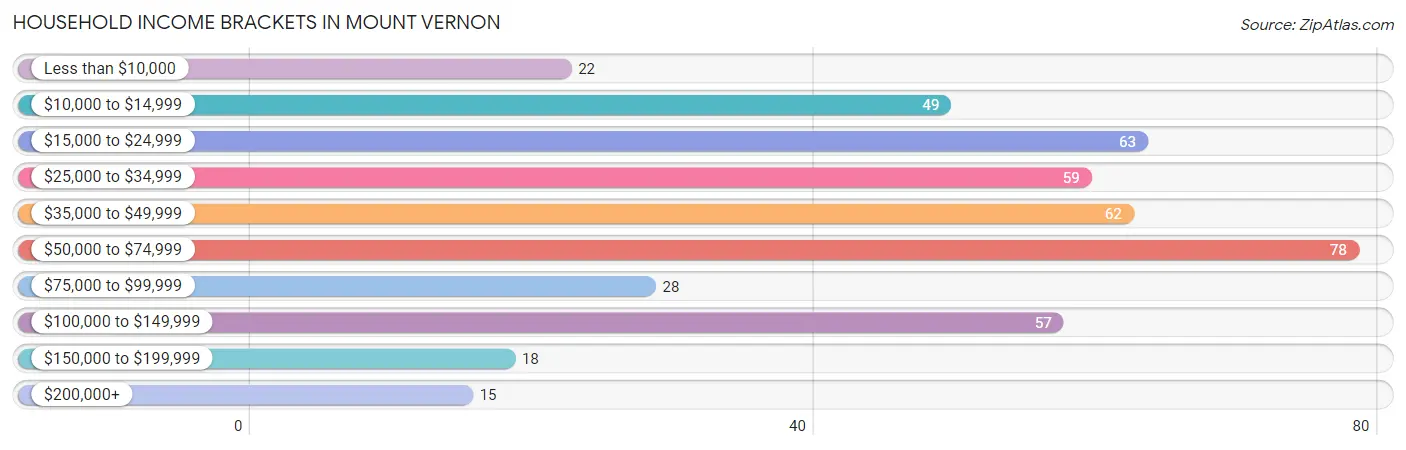
| Income Bracket | # Households | % Households |
| Less than $10,000 | 22 | 4.9% |
| $10,000 to $14,999 | 49 | 10.9% |
| $15,000 to $24,999 | 63 | 14.0% |
| $25,000 to $34,999 | 59 | 13.1% |
| $35,000 to $49,999 | 62 | 13.7% |
| $50,000 to $74,999 | 78 | 17.3% |
| $75,000 to $99,999 | 28 | 6.2% |
| $100,000 to $149,999 | 57 | 12.6% |
| $150,000 to $199,999 | 18 | 4.0% |
| $200,000+ | 15 | 3.3% |
Household Income by Householder Age in Mount Vernon
The median household income in Mount Vernon is $41,164, with the highest median household income of $61,786 found in the 45 to 64 years age bracket for the primary householder. A total of 162 households (35.9%) fall into this category.
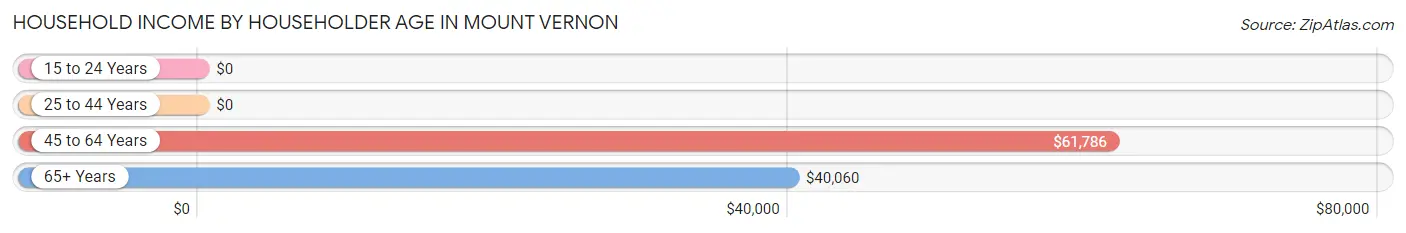
| Income Bracket | # Households | Median Income |
| 15 to 24 Years | 0 (0.0%) | $0 |
| 25 to 44 Years | 100 (22.2%) | $0 |
| 45 to 64 Years | 162 (35.9%) | $61,786 |
| 65+ Years | 189 (41.9%) | $40,060 |
| Total | 451 (100.0%) | $41,164 |
Poverty in Mount Vernon
Income Below Poverty by Sex and Age in Mount Vernon
With 18.9% poverty level for males and 29.2% for females among the residents of Mount Vernon, 18 to 24 year old males and 18 to 24 year old females are the most vulnerable to poverty, with 19 males (70.4%) and 26 females (61.9%) in their respective age groups living below the poverty level.
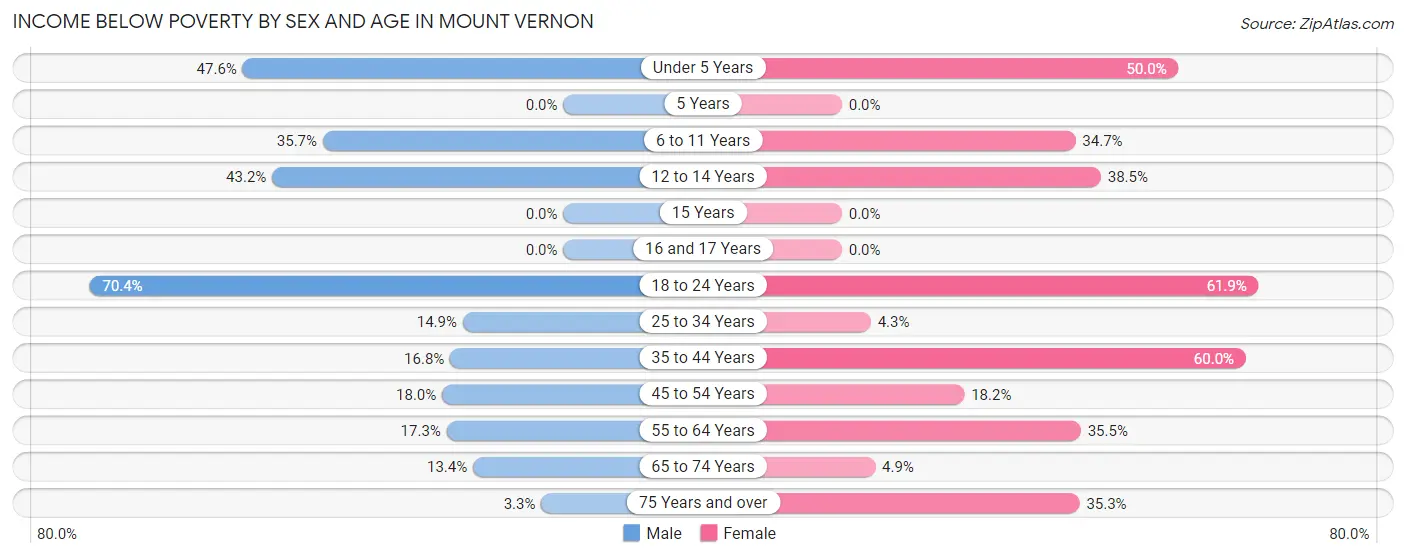
| Age Bracket | Male | Female |
| Under 5 Years | 10 (47.6%) | 15 (50.0%) |
| 5 Years | 0 (0.0%) | 0 (0.0%) |
| 6 to 11 Years | 5 (35.7%) | 17 (34.7%) |
| 12 to 14 Years | 16 (43.2%) | 5 (38.5%) |
| 15 Years | 0 (0.0%) | 0 (0.0%) |
| 16 and 17 Years | 0 (0.0%) | 0 (0.0%) |
| 18 to 24 Years | 19 (70.4%) | 26 (61.9%) |
| 25 to 34 Years | 30 (14.9%) | 4 (4.3%) |
| 35 to 44 Years | 20 (16.8%) | 45 (60.0%) |
| 45 to 54 Years | 9 (18.0%) | 14 (18.2%) |
| 55 to 64 Years | 13 (17.3%) | 44 (35.5%) |
| 65 to 74 Years | 11 (13.4%) | 4 (4.9%) |
| 75 Years and over | 2 (3.3%) | 18 (35.3%) |
| Total | 135 (18.9%) | 192 (29.2%) |
Income Above Poverty by Sex and Age in Mount Vernon
According to the poverty statistics in Mount Vernon, males aged 5 years and females aged 15 years are the age groups that are most secure financially, with 100.0% of males and 100.0% of females in these age groups living above the poverty line.
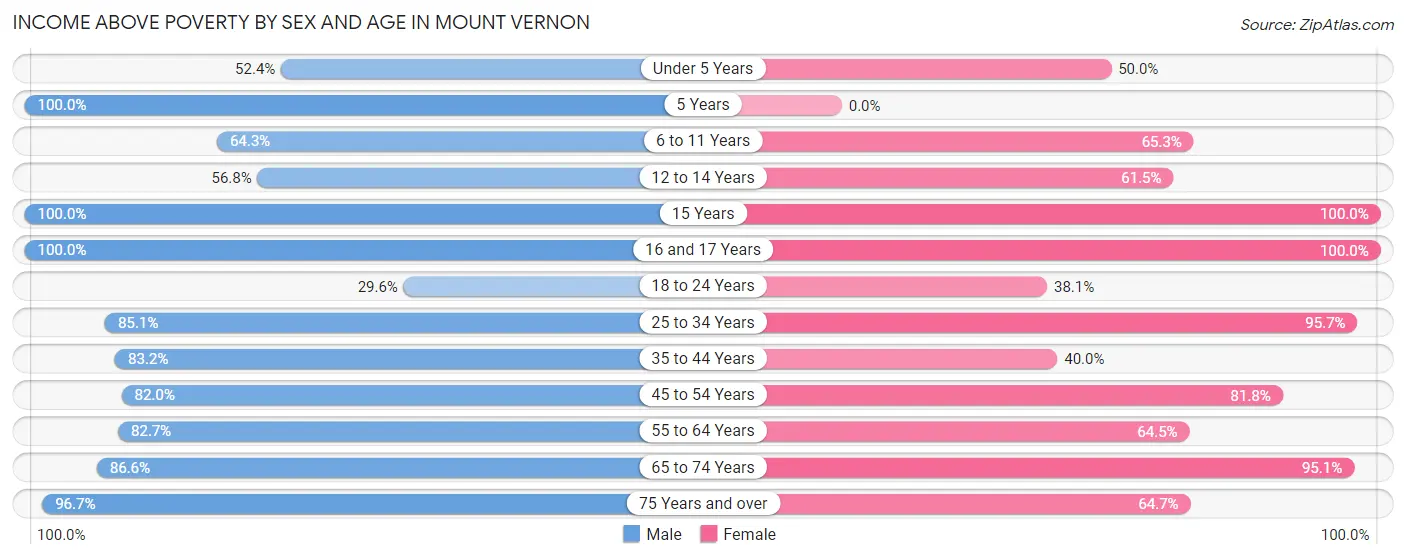
| Age Bracket | Male | Female |
| Under 5 Years | 11 (52.4%) | 15 (50.0%) |
| 5 Years | 2 (100.0%) | 0 (0.0%) |
| 6 to 11 Years | 9 (64.3%) | 32 (65.3%) |
| 12 to 14 Years | 21 (56.8%) | 8 (61.5%) |
| 15 Years | 8 (100.0%) | 6 (100.0%) |
| 16 and 17 Years | 18 (100.0%) | 16 (100.0%) |
| 18 to 24 Years | 8 (29.6%) | 16 (38.1%) |
| 25 to 34 Years | 171 (85.1%) | 89 (95.7%) |
| 35 to 44 Years | 99 (83.2%) | 30 (40.0%) |
| 45 to 54 Years | 41 (82.0%) | 63 (81.8%) |
| 55 to 64 Years | 62 (82.7%) | 80 (64.5%) |
| 65 to 74 Years | 71 (86.6%) | 77 (95.1%) |
| 75 Years and over | 59 (96.7%) | 33 (64.7%) |
| Total | 580 (81.1%) | 465 (70.8%) |
Income Below Poverty Among Married-Couple Families in Mount Vernon
The poverty statistics for married-couple families in Mount Vernon show that 12.1% or 25 of the total 206 families live below the poverty line. Families with 1 or 2 children have the highest poverty rate of 13.4%, comprising of 9 families. On the other hand, families with 3 or 4 children have the lowest poverty rate of 0.0%, which includes 0 families.
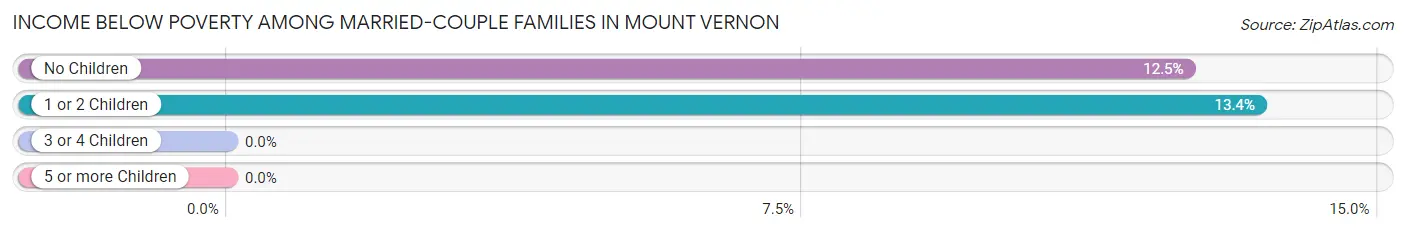
| Children | Above Poverty | Below Poverty |
| No Children | 112 (87.5%) | 16 (12.5%) |
| 1 or 2 Children | 58 (86.6%) | 9 (13.4%) |
| 3 or 4 Children | 11 (100.0%) | 0 (0.0%) |
| 5 or more Children | 0 (0.0%) | 0 (0.0%) |
| Total | 181 (87.9%) | 25 (12.1%) |
Income Below Poverty Among Single-Parent Households in Mount Vernon
According to the poverty data in Mount Vernon, 36.4% or 16 single-father households and 27.8% or 25 single-mother households are living below the poverty line. Among single-father households, those with 1 or 2 children have the highest poverty rate, with 16 households (64.0%) experiencing poverty. Likewise, among single-mother households, those with 1 or 2 children have the highest poverty rate, with 15 households (53.6%) falling below the poverty line.
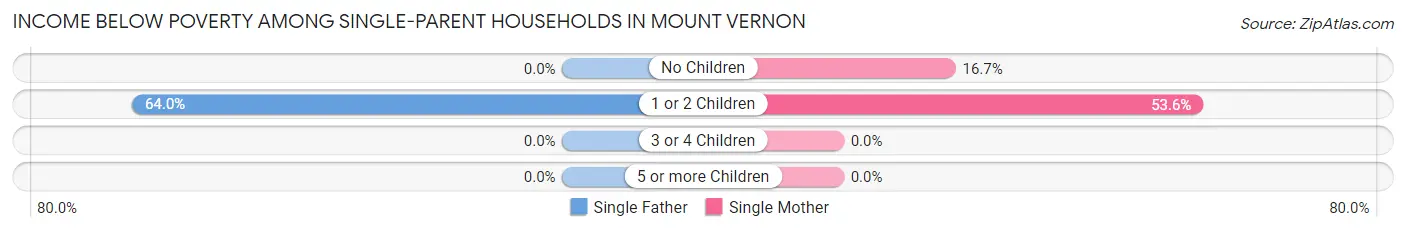
| Children | Single Father | Single Mother |
| No Children | 0 (0.0%) | 10 (16.7%) |
| 1 or 2 Children | 16 (64.0%) | 15 (53.6%) |
| 3 or 4 Children | 0 (0.0%) | 0 (0.0%) |
| 5 or more Children | 0 (0.0%) | 0 (0.0%) |
| Total | 16 (36.4%) | 25 (27.8%) |
Income Below Poverty Among Married-Couple vs Single-Parent Households in Mount Vernon
The poverty data for Mount Vernon shows that 25 of the married-couple family households (12.1%) and 41 of the single-parent households (30.6%) are living below the poverty level. Within the married-couple family households, those with 1 or 2 children have the highest poverty rate, with 9 households (13.4%) falling below the poverty line. Among the single-parent households, those with 1 or 2 children have the highest poverty rate, with 31 household (58.5%) living below poverty.
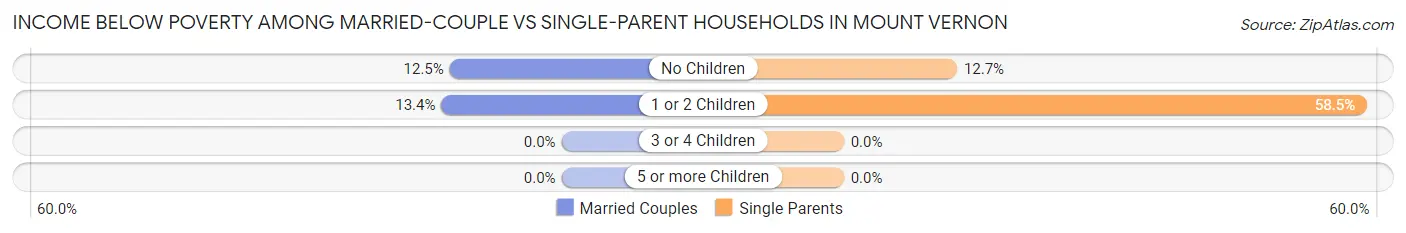
| Children | Married-Couple Families | Single-Parent Households |
| No Children | 16 (12.5%) | 10 (12.7%) |
| 1 or 2 Children | 9 (13.4%) | 31 (58.5%) |
| 3 or 4 Children | 0 (0.0%) | 0 (0.0%) |
| 5 or more Children | 0 (0.0%) | 0 (0.0%) |
| Total | 25 (12.1%) | 41 (30.6%) |
Race in Mount Vernon
The most populous races in Mount Vernon are Black / African American (1,075 | 73.5%), White / Caucasian (332 | 22.7%), and Asian (27 | 1.8%).
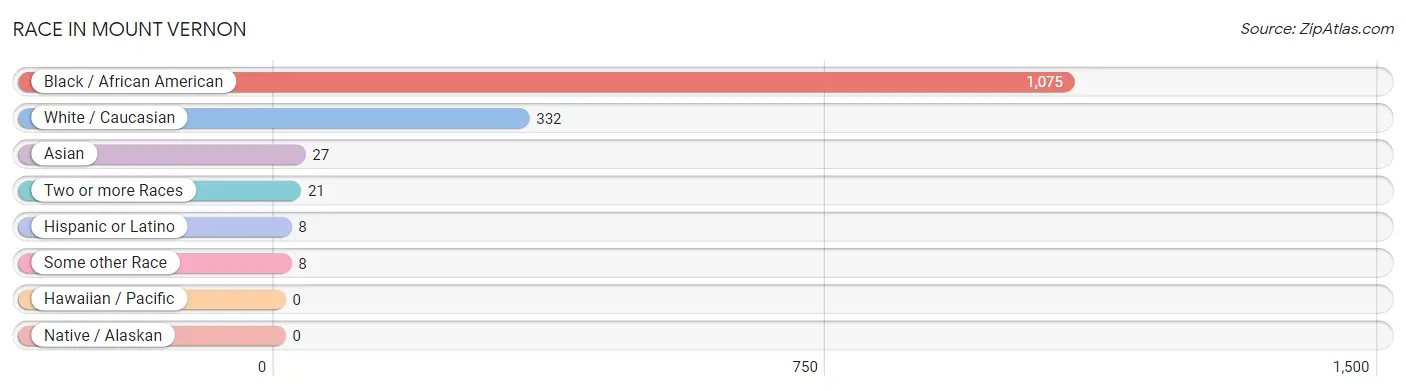
| Race | # Population | % Population |
| Asian | 27 | 1.8% |
| Black / African American | 1,075 | 73.5% |
| Hawaiian / Pacific | 0 | 0.0% |
| Hispanic or Latino | 8 | 0.5% |
| Native / Alaskan | 0 | 0.0% |
| White / Caucasian | 332 | 22.7% |
| Two or more Races | 21 | 1.4% |
| Some other Race | 8 | 0.5% |
| Total | 1,463 | 100.0% |
Ancestry in Mount Vernon
The most populous ancestries reported in Mount Vernon are English (48 | 3.3%), Irish (45 | 3.1%), German (44 | 3.0%), American (33 | 2.3%), and French (20 | 1.4%), together accounting for 13.0% of all Mount Vernon residents.
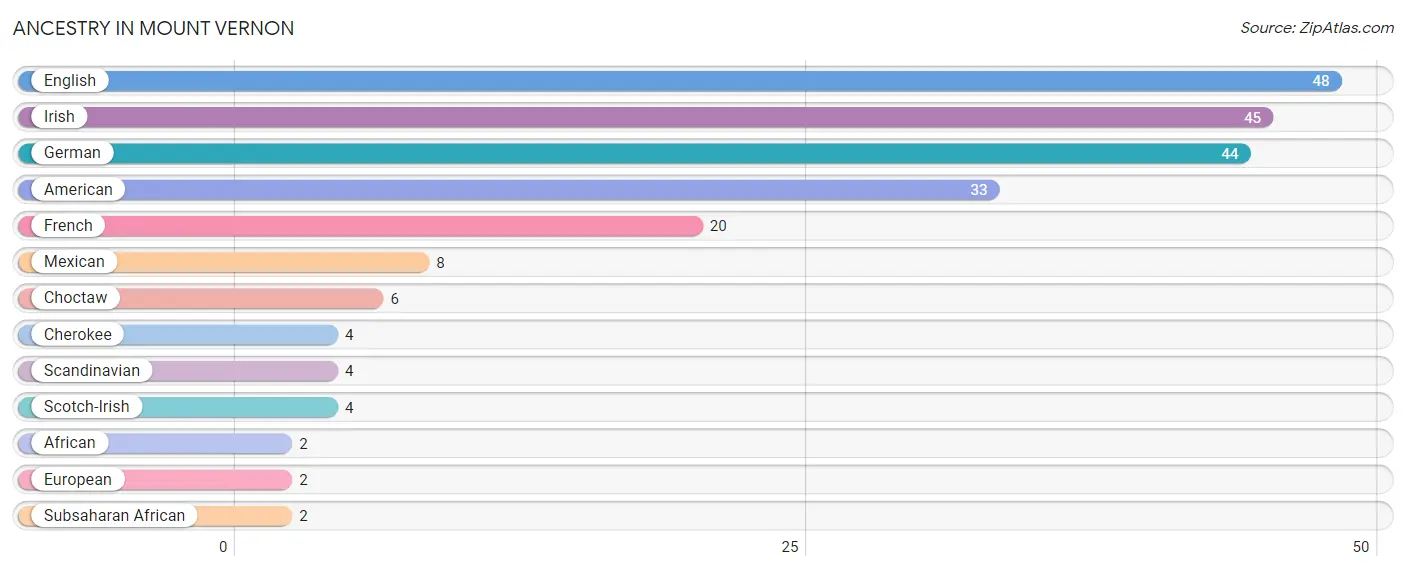
| Ancestry | # Population | % Population |
| African | 2 | 0.1% |
| American | 33 | 2.3% |
| Cherokee | 4 | 0.3% |
| Choctaw | 6 | 0.4% |
| English | 48 | 3.3% |
| European | 2 | 0.1% |
| French | 20 | 1.4% |
| German | 44 | 3.0% |
| Irish | 45 | 3.1% |
| Mexican | 8 | 0.5% |
| Scandinavian | 4 | 0.3% |
| Scotch-Irish | 4 | 0.3% |
| Subsaharan African | 2 | 0.1% | View All 13 Rows |
Immigrants in Mount Vernon
The most numerous immigrant groups reported in Mount Vernon came from Asia (27 | 1.8%), Pakistan (27 | 1.8%), South Central Asia (27 | 1.8%), Central America (8 | 0.5%), and Latin America (8 | 0.5%), together accounting for 6.6% of all Mount Vernon residents.
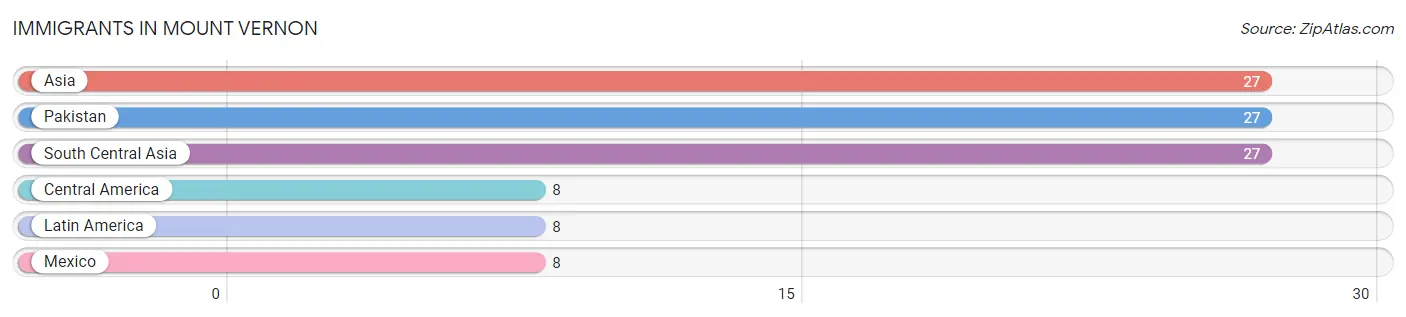
| Immigration Origin | # Population | % Population |
| Asia | 27 | 1.8% |
| Central America | 8 | 0.5% |
| Latin America | 8 | 0.5% |
| Mexico | 8 | 0.5% |
| Pakistan | 27 | 1.8% |
| South Central Asia | 27 | 1.8% | View All 6 Rows |
Sex and Age in Mount Vernon
Sex and Age in Mount Vernon
The most populous age groups in Mount Vernon are 25 to 29 Years (168 | 21.2%) for men and 55 to 59 Years (74 | 11.0%) for women.
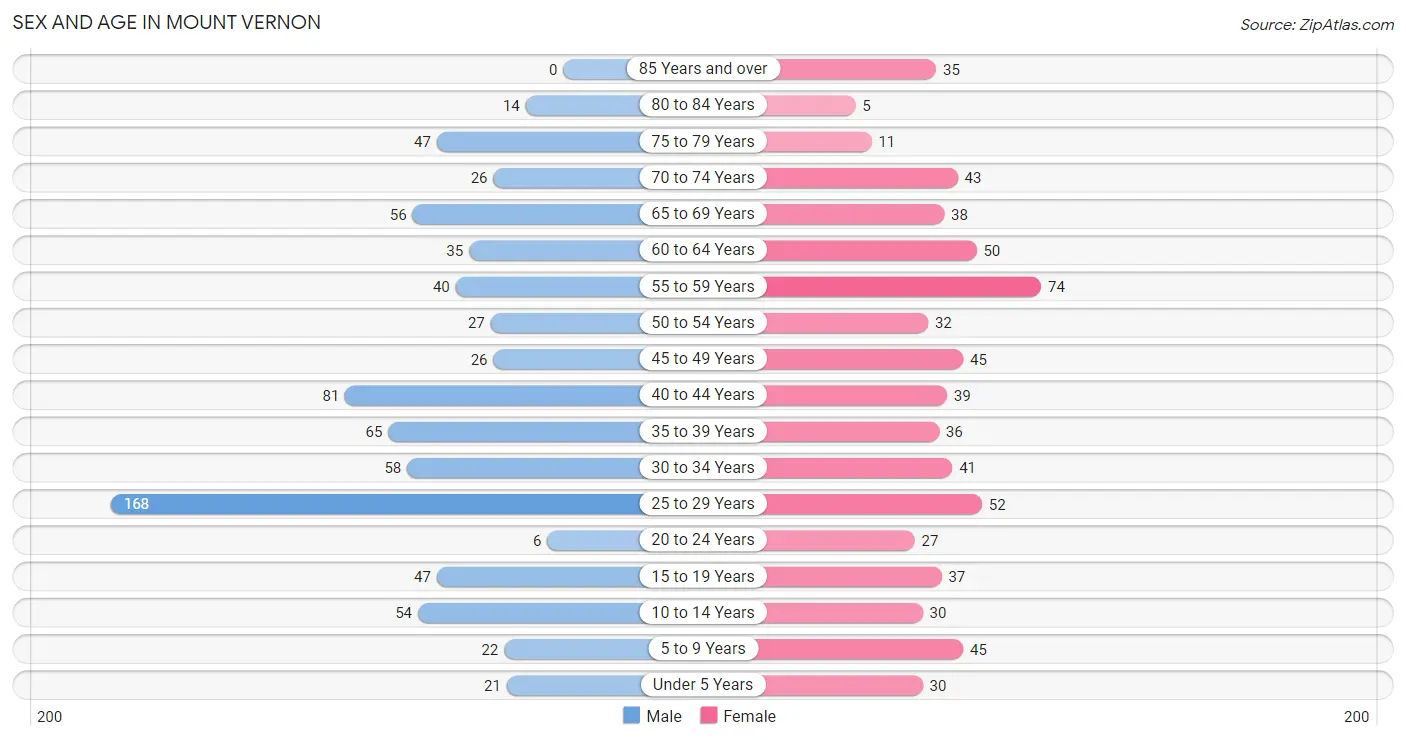
| Age Bracket | Male | Female |
| Under 5 Years | 21 (2.6%) | 30 (4.5%) |
| 5 to 9 Years | 22 (2.8%) | 45 (6.7%) |
| 10 to 14 Years | 54 (6.8%) | 30 (4.5%) |
| 15 to 19 Years | 47 (5.9%) | 37 (5.5%) |
| 20 to 24 Years | 6 (0.8%) | 27 (4.0%) |
| 25 to 29 Years | 168 (21.2%) | 52 (7.8%) |
| 30 to 34 Years | 58 (7.3%) | 41 (6.1%) |
| 35 to 39 Years | 65 (8.2%) | 36 (5.4%) |
| 40 to 44 Years | 81 (10.2%) | 39 (5.8%) |
| 45 to 49 Years | 26 (3.3%) | 45 (6.7%) |
| 50 to 54 Years | 27 (3.4%) | 32 (4.8%) |
| 55 to 59 Years | 40 (5.0%) | 74 (11.0%) |
| 60 to 64 Years | 35 (4.4%) | 50 (7.5%) |
| 65 to 69 Years | 56 (7.1%) | 38 (5.7%) |
| 70 to 74 Years | 26 (3.3%) | 43 (6.4%) |
| 75 to 79 Years | 47 (5.9%) | 11 (1.6%) |
| 80 to 84 Years | 14 (1.8%) | 5 (0.7%) |
| 85 Years and over | 0 (0.0%) | 35 (5.2%) |
| Total | 793 (100.0%) | 670 (100.0%) |
Families and Households in Mount Vernon
Median Family Size in Mount Vernon
The median family size in Mount Vernon is 3.48 persons per family, with married-couple families (206 | 60.6%) accounting for the largest median family size of 3.59 persons per family. On the other hand, single male/father families (44 | 12.9%) represent the smallest median family size with 2.80 persons per family.
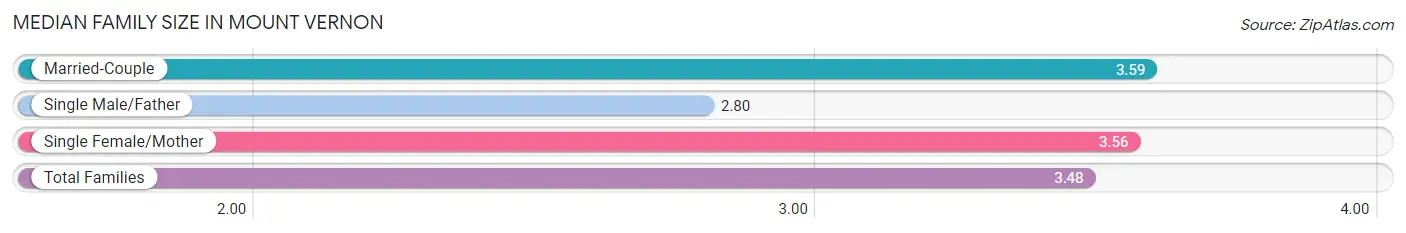
| Family Type | # Families | Family Size |
| Married-Couple | 206 (60.6%) | 3.59 |
| Single Male/Father | 44 (12.9%) | 2.80 |
| Single Female/Mother | 90 (26.5%) | 3.56 |
| Total Families | 340 (100.0%) | 3.48 |
Median Household Size in Mount Vernon
The median household size in Mount Vernon is 3.07 persons per household, with single female/mother households (90 | 20.0%) accounting for the largest median household size of 3.66 persons per household. non-family households (111 | 24.6%) represent the smallest median household size with 1.56 persons per household.
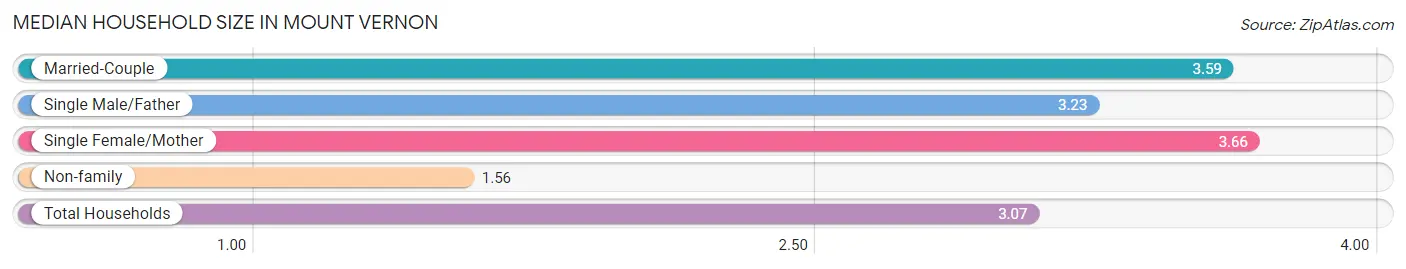
| Household Type | # Households | Household Size |
| Married-Couple | 206 (45.7%) | 3.59 |
| Single Male/Father | 44 (9.8%) | 3.23 |
| Single Female/Mother | 90 (20.0%) | 3.66 |
| Non-family | 111 (24.6%) | 1.56 |
| Total Households | 451 (100.0%) | 3.07 |
Household Size by Marriage Status in Mount Vernon
Out of a total of 451 households in Mount Vernon, 340 (75.4%) are family households, while 111 (24.6%) are nonfamily households. The most numerous type of family households are 2-person households, comprising 153, and the most common type of nonfamily households are 1-person households, comprising 79.
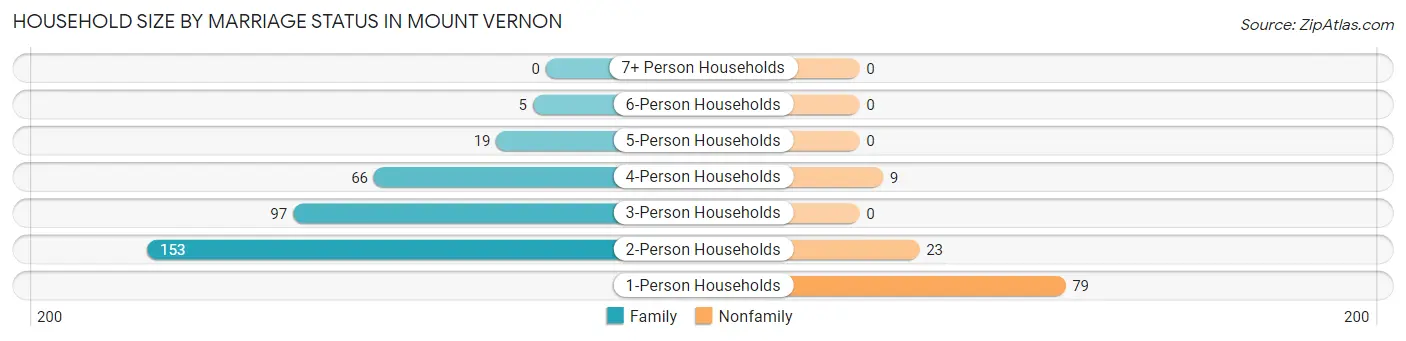
| Household Size | Family Households | Nonfamily Households |
| 1-Person Households | - | 79 (17.5%) |
| 2-Person Households | 153 (33.9%) | 23 (5.1%) |
| 3-Person Households | 97 (21.5%) | 0 (0.0%) |
| 4-Person Households | 66 (14.6%) | 9 (2.0%) |
| 5-Person Households | 19 (4.2%) | 0 (0.0%) |
| 6-Person Households | 5 (1.1%) | 0 (0.0%) |
| 7+ Person Households | 0 (0.0%) | 0 (0.0%) |
| Total | 340 (75.4%) | 111 (24.6%) |
Female Fertility in Mount Vernon
Fertility by Age in Mount Vernon
Average fertility rate in Mount Vernon is 14.0 births per 1,000 women. Women in the age bracket of 20 to 34 years have the highest fertility rate with 33.0 births per 1,000 women. Women in the age bracket of 20 to 34 years acount for 100.0% of all women with births.
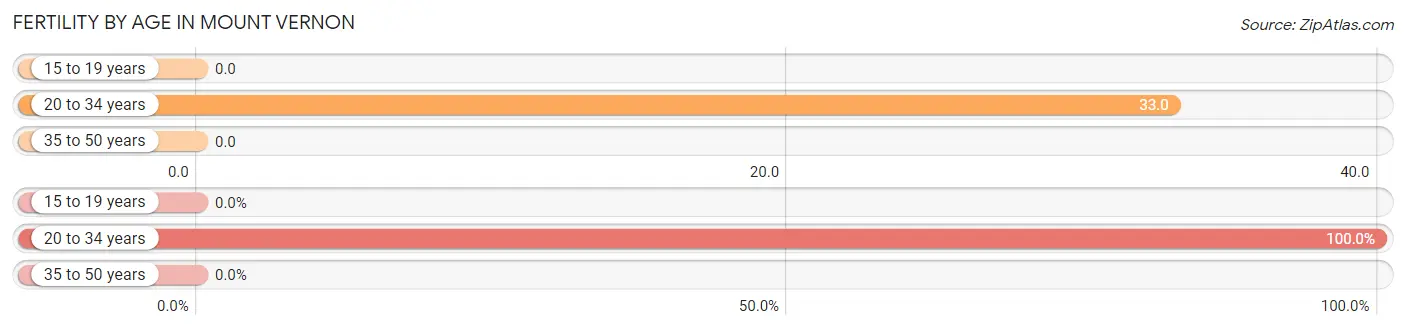
| Age Bracket | Women with Births | Births / 1,000 Women |
| 15 to 19 years | 0 (0.0%) | 0.0 |
| 20 to 34 years | 4 (100.0%) | 33.0 |
| 35 to 50 years | 0 (0.0%) | 0.0 |
| Total | 4 (100.0%) | 14.0 |
Fertility by Age by Marriage Status in Mount Vernon
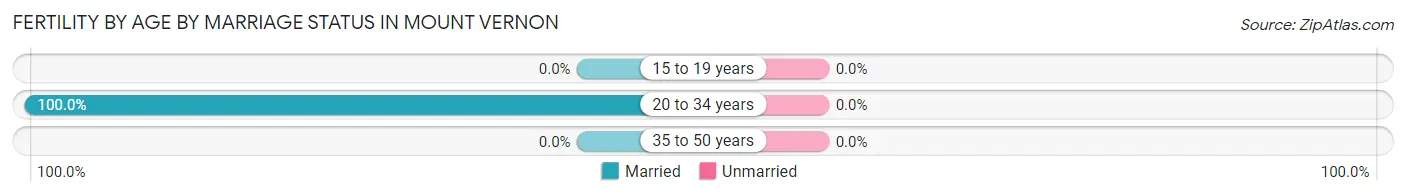
| Age Bracket | Married | Unmarried |
| 15 to 19 years | 0 (0.0%) | 0 (0.0%) |
| 20 to 34 years | 4 (100.0%) | 0 (0.0%) |
| 35 to 50 years | 0 (0.0%) | 0 (0.0%) |
| Total | 4 (100.0%) | 0 (0.0%) |
Fertility by Education in Mount Vernon
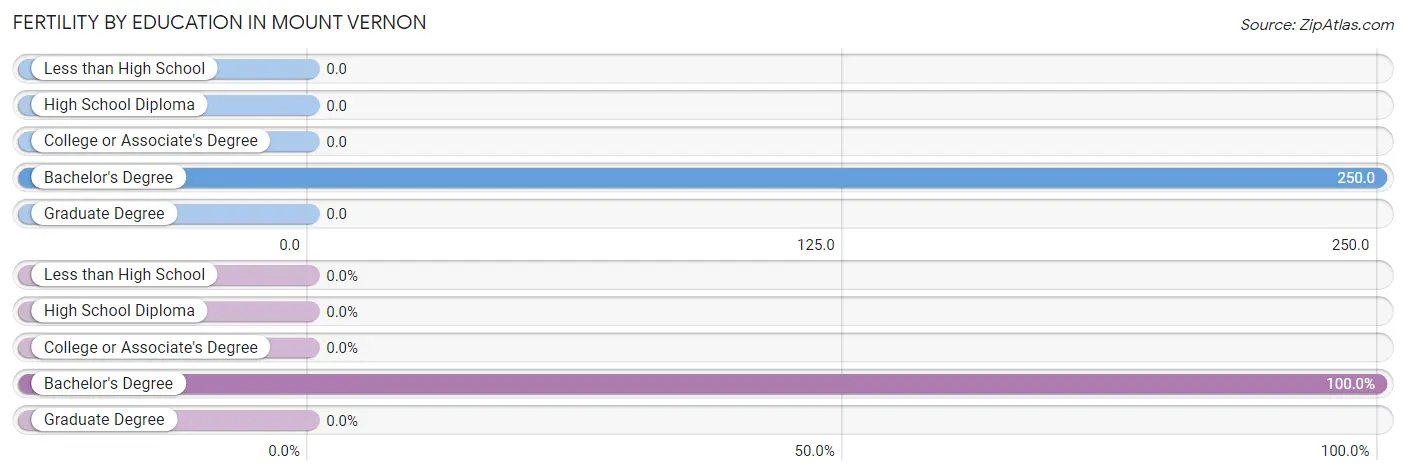
| Educational Attainment | Women with Births | Births / 1,000 Women |
| Less than High School | 0 (0.0%) | 0.0 |
| High School Diploma | 0 (0.0%) | 0.0 |
| College or Associate's Degree | 0 (0.0%) | 0.0 |
| Bachelor's Degree | 4 (100.0%) | 250.0 |
| Graduate Degree | 0 (0.0%) | 0.0 |
| Total | 4 (100.0%) | 14.0 |
Fertility by Education by Marriage Status in Mount Vernon
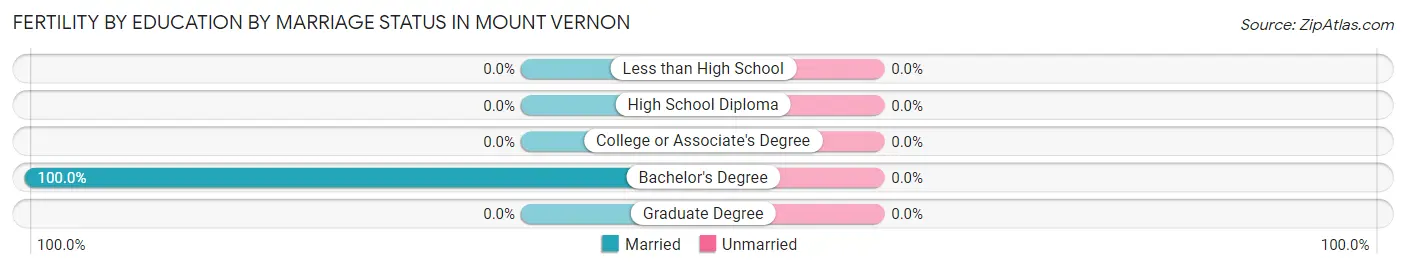
| Educational Attainment | Married | Unmarried |
| Less than High School | 0 (0.0%) | 0 (0.0%) |
| High School Diploma | 0 (0.0%) | 0 (0.0%) |
| College or Associate's Degree | 0 (0.0%) | 0 (0.0%) |
| Bachelor's Degree | 4 (100.0%) | 0 (0.0%) |
| Graduate Degree | 0 (0.0%) | 0 (0.0%) |
| Total | 4 (100.0%) | 0 (0.0%) |
Employment Characteristics in Mount Vernon
Employment by Class of Employer in Mount Vernon
Among the 587 employed individuals in Mount Vernon, private company employees (445 | 75.8%), self-employed (not incorporated) (48 | 8.2%), and local government employees (40 | 6.8%) make up the most common classes of employment.
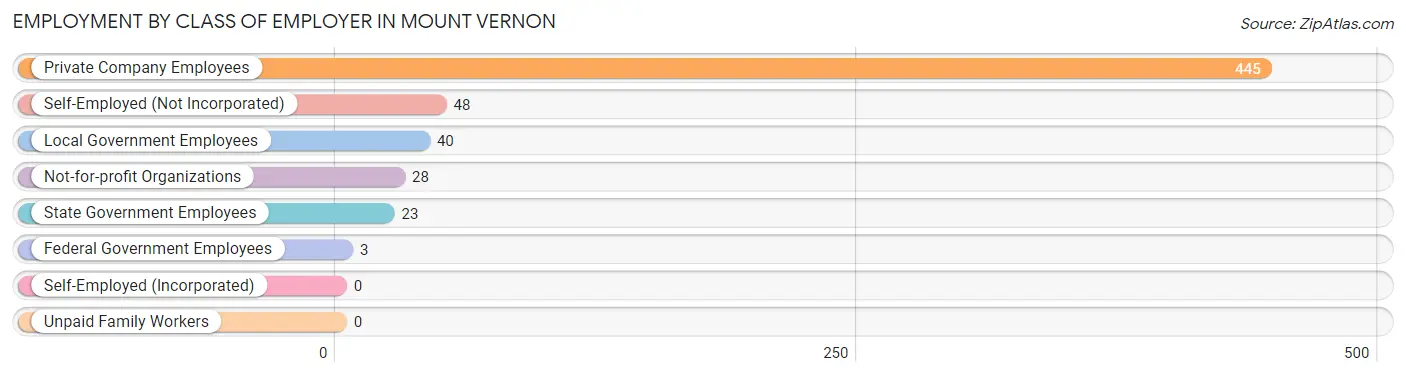
| Employer Class | # Employees | % Employees |
| Private Company Employees | 445 | 75.8% |
| Self-Employed (Incorporated) | 0 | 0.0% |
| Self-Employed (Not Incorporated) | 48 | 8.2% |
| Not-for-profit Organizations | 28 | 4.8% |
| Local Government Employees | 40 | 6.8% |
| State Government Employees | 23 | 3.9% |
| Federal Government Employees | 3 | 0.5% |
| Unpaid Family Workers | 0 | 0.0% |
| Total | 587 | 100.0% |
Employment Status by Age in Mount Vernon
According to the labor force statistics for Mount Vernon, out of the total population over 16 years of age (1,247), 48.9% or 610 individuals are in the labor force, with 0.8% or 5 of them unemployed. The age group with the highest labor force participation rate is 30 to 34 years, with 88.9% or 88 individuals in the labor force. Within the labor force, the 35 to 44 years age range has the highest percentage of unemployed individuals, with 3.7% or 5 of them being unemployed.
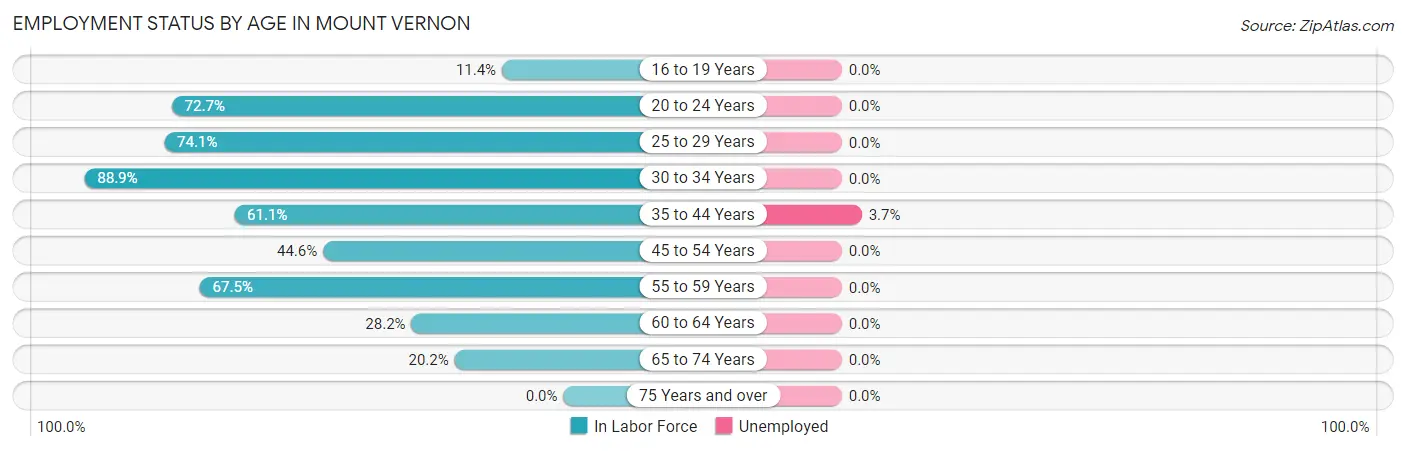
| Age Bracket | In Labor Force | Unemployed |
| 16 to 19 Years | 8 (11.4%) | 0 (0.0%) |
| 20 to 24 Years | 24 (72.7%) | 0 (0.0%) |
| 25 to 29 Years | 163 (74.1%) | 0 (0.0%) |
| 30 to 34 Years | 88 (88.9%) | 0 (0.0%) |
| 35 to 44 Years | 135 (61.1%) | 5 (3.7%) |
| 45 to 54 Years | 58 (44.6%) | 0 (0.0%) |
| 55 to 59 Years | 77 (67.5%) | 0 (0.0%) |
| 60 to 64 Years | 24 (28.2%) | 0 (0.0%) |
| 65 to 74 Years | 33 (20.2%) | 0 (0.0%) |
| 75 Years and over | 0 (0.0%) | 0 (0.0%) |
| Total | 610 (48.9%) | 5 (0.8%) |
Employment Status by Educational Attainment in Mount Vernon
According to labor force statistics for Mount Vernon, 62.7% of individuals (545) out of the total population between 25 and 64 years of age (869) are in the labor force, with 0.9% or 5 of them being unemployed. The group with the highest labor force participation rate are those with the educational attainment of bachelor's degree or higher, with 94.9% or 129 individuals in the labor force. Within the labor force, individuals with high school diploma education have the highest percentage of unemployment, with 2.0% or 5 of them being unemployed.
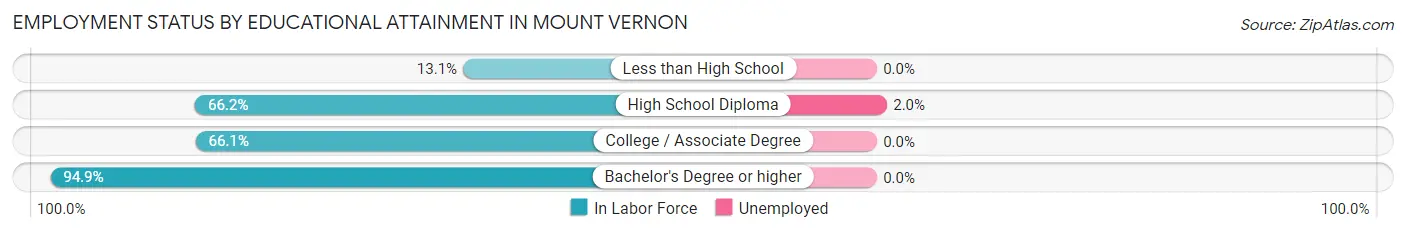
| Educational Attainment | In Labor Force | Unemployed |
| Less than High School | 17 (13.1%) | 0 (0.0%) |
| High School Diploma | 247 (66.2%) | 7 (2.0%) |
| College / Associate Degree | 152 (66.1%) | 0 (0.0%) |
| Bachelor's Degree or higher | 129 (94.9%) | 0 (0.0%) |
| Total | 545 (62.7%) | 8 (0.9%) |
Employment Occupations by Sex in Mount Vernon
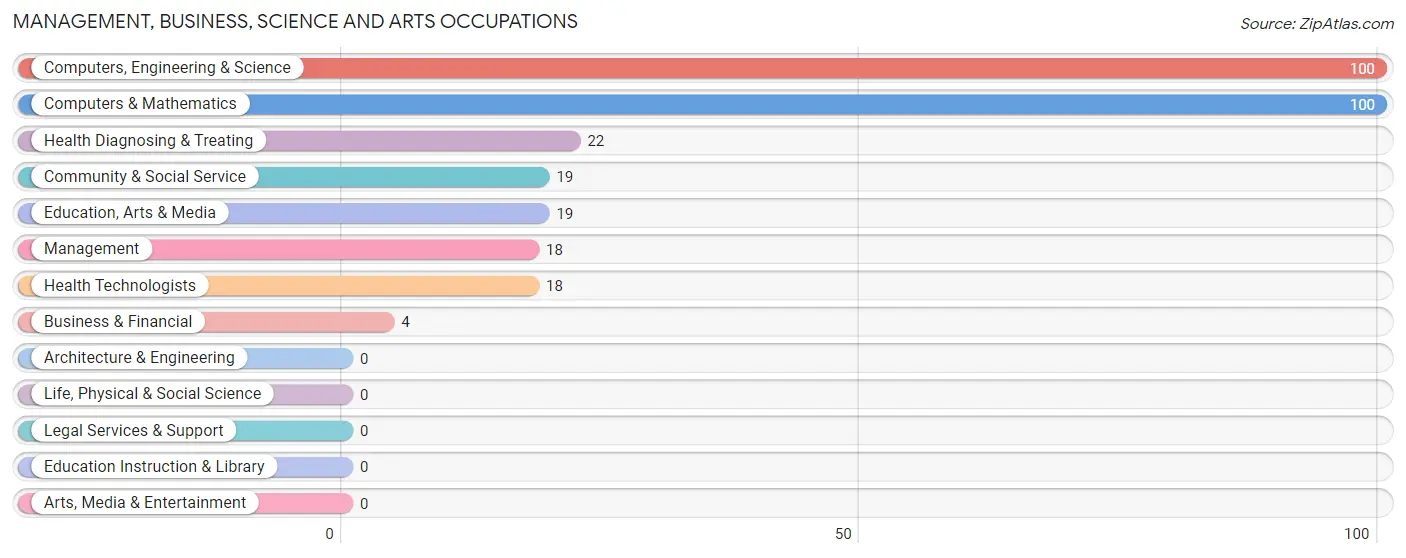
Management, Business, Science and Arts Occupations
The most common Management, Business, Science and Arts occupations in Mount Vernon are Computers, Engineering & Science (100 | 16.5%), Computers & Mathematics (100 | 16.5%), Health Diagnosing & Treating (22 | 3.6%), Community & Social Service (19 | 3.1%), and Education, Arts & Media (19 | 3.1%).
Management, Business, Science and Arts Occupations by Sex
Within the Management, Business, Science and Arts occupations in Mount Vernon, the most male-oriented occupations are Management (100.0%), Business & Financial (100.0%), and Computers, Engineering & Science (100.0%), while the most female-oriented occupations are Health Diagnosing & Treating (100.0%), Health Technologists (100.0%), and Community & Social Service (78.9%).
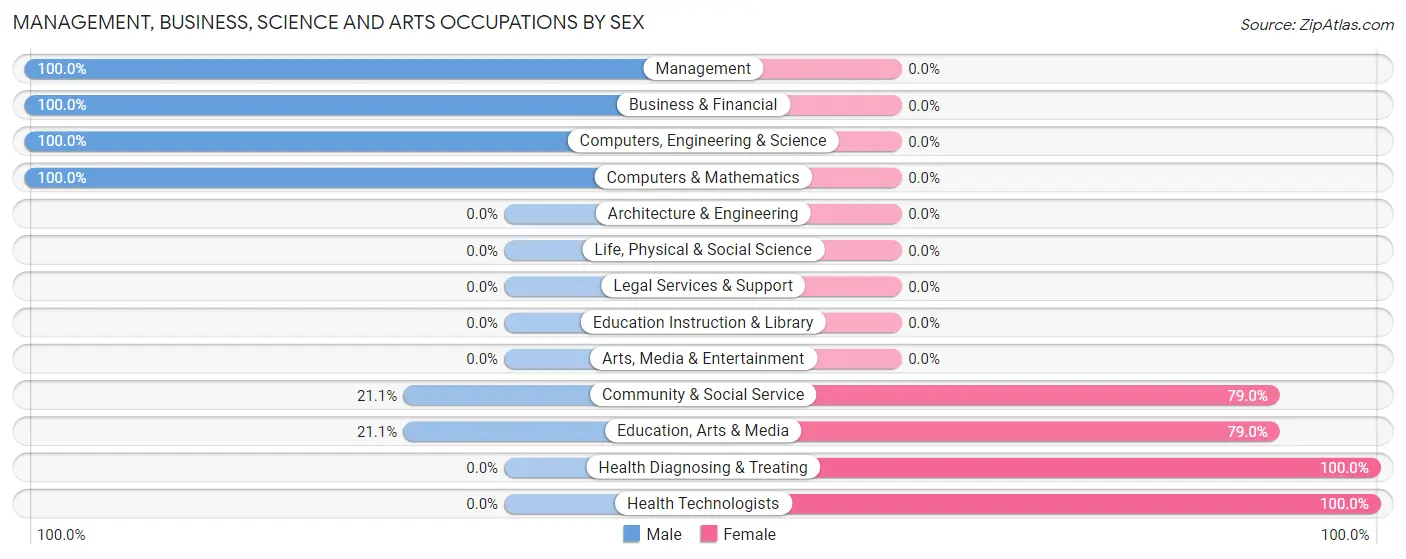
| Occupation | Male | Female |
| Management | 18 (100.0%) | 0 (0.0%) |
| Business & Financial | 4 (100.0%) | 0 (0.0%) |
| Computers, Engineering & Science | 100 (100.0%) | 0 (0.0%) |
| Computers & Mathematics | 100 (100.0%) | 0 (0.0%) |
| Architecture & Engineering | 0 (0.0%) | 0 (0.0%) |
| Life, Physical & Social Science | 0 (0.0%) | 0 (0.0%) |
| Community & Social Service | 4 (21.0%) | 15 (78.9%) |
| Education, Arts & Media | 4 (21.0%) | 15 (78.9%) |
| Legal Services & Support | 0 (0.0%) | 0 (0.0%) |
| Education Instruction & Library | 0 (0.0%) | 0 (0.0%) |
| Arts, Media & Entertainment | 0 (0.0%) | 0 (0.0%) |
| Health Diagnosing & Treating | 0 (0.0%) | 22 (100.0%) |
| Health Technologists | 0 (0.0%) | 18 (100.0%) |
| Total (Category) | 126 (77.3%) | 37 (22.7%) |
| Total (Overall) | 363 (60.0%) | 242 (40.0%) |
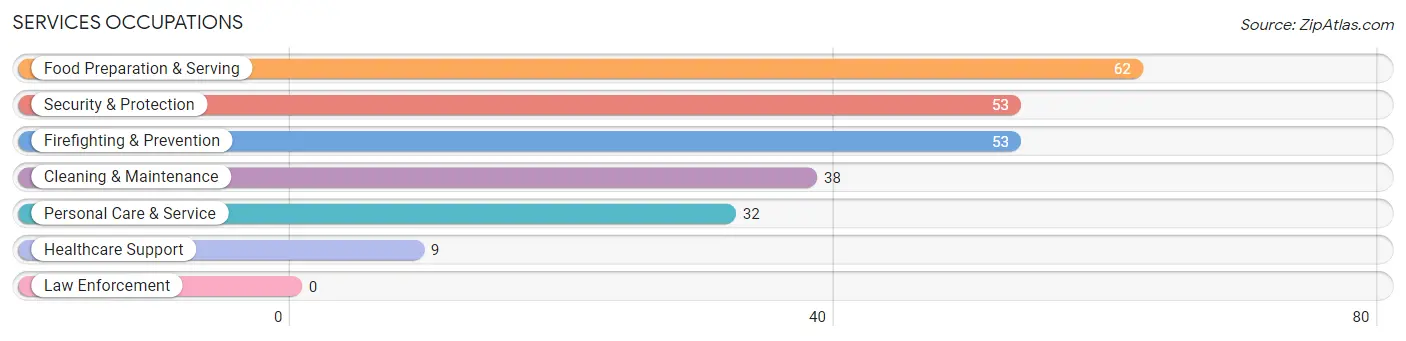
Services Occupations
The most common Services occupations in Mount Vernon are Food Preparation & Serving (62 | 10.2%), Security & Protection (53 | 8.8%), Firefighting & Prevention (53 | 8.8%), Cleaning & Maintenance (38 | 6.3%), and Personal Care & Service (32 | 5.3%).
Services Occupations by Sex
Within the Services occupations in Mount Vernon, the most male-oriented occupations are Food Preparation & Serving (61.3%), Cleaning & Maintenance (52.6%), and Security & Protection (47.2%), while the most female-oriented occupations are Healthcare Support (100.0%), Personal Care & Service (100.0%), and Security & Protection (52.8%).
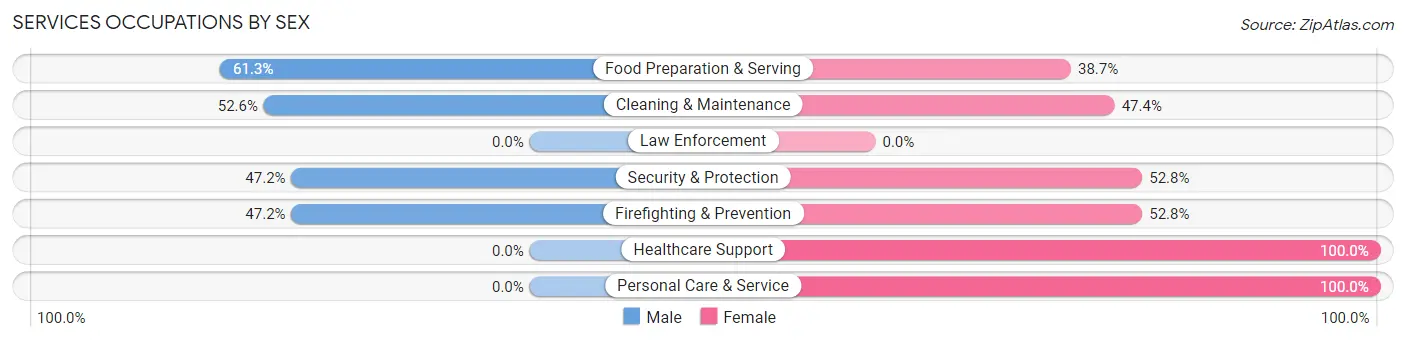
| Occupation | Male | Female |
| Healthcare Support | 0 (0.0%) | 9 (100.0%) |
| Security & Protection | 25 (47.2%) | 28 (52.8%) |
| Firefighting & Prevention | 25 (47.2%) | 28 (52.8%) |
| Law Enforcement | 0 (0.0%) | 0 (0.0%) |
| Food Preparation & Serving | 38 (61.3%) | 24 (38.7%) |
| Cleaning & Maintenance | 20 (52.6%) | 18 (47.4%) |
| Personal Care & Service | 0 (0.0%) | 32 (100.0%) |
| Total (Category) | 83 (42.8%) | 111 (57.2%) |
| Total (Overall) | 363 (60.0%) | 242 (40.0%) |
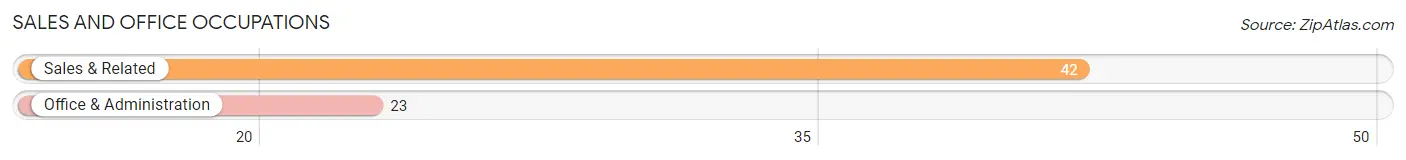
Sales and Office Occupations
The most common Sales and Office occupations in Mount Vernon are Sales & Related (42 | 6.9%), and Office & Administration (23 | 3.8%).
Sales and Office Occupations by Sex
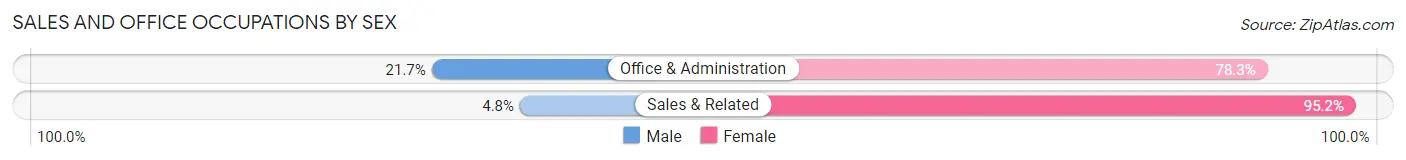
| Occupation | Male | Female |
| Sales & Related | 2 (4.8%) | 40 (95.2%) |
| Office & Administration | 5 (21.7%) | 18 (78.3%) |
| Total (Category) | 7 (10.8%) | 58 (89.2%) |
| Total (Overall) | 363 (60.0%) | 242 (40.0%) |
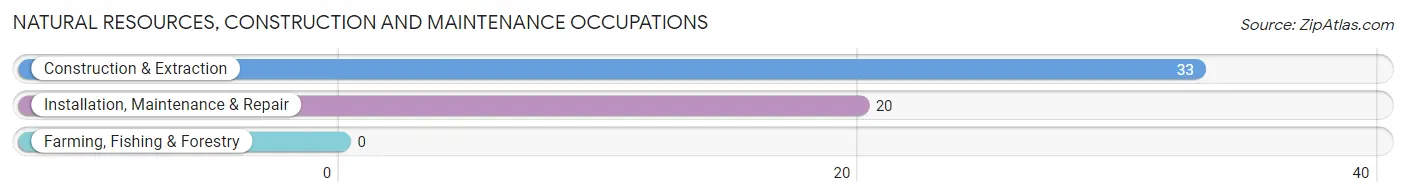
Natural Resources, Construction and Maintenance Occupations
The most common Natural Resources, Construction and Maintenance occupations in Mount Vernon are Construction & Extraction (33 | 5.4%), and Installation, Maintenance & Repair (20 | 3.3%).
Natural Resources, Construction and Maintenance Occupations by Sex
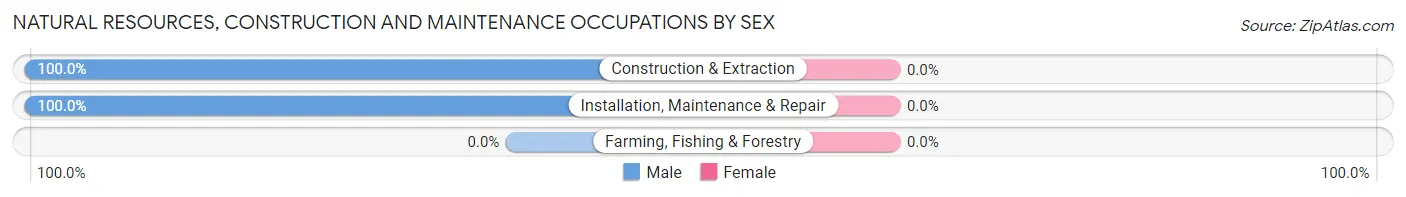
| Occupation | Male | Female |
| Farming, Fishing & Forestry | 0 (0.0%) | 0 (0.0%) |
| Construction & Extraction | 33 (100.0%) | 0 (0.0%) |
| Installation, Maintenance & Repair | 20 (100.0%) | 0 (0.0%) |
| Total (Category) | 53 (100.0%) | 0 (0.0%) |
| Total (Overall) | 363 (60.0%) | 242 (40.0%) |
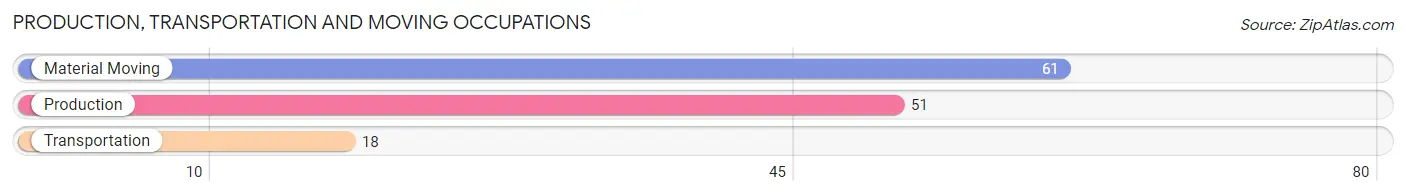
Production, Transportation and Moving Occupations
The most common Production, Transportation and Moving occupations in Mount Vernon are Material Moving (61 | 10.1%), Production (51 | 8.4%), and Transportation (18 | 3.0%).
Production, Transportation and Moving Occupations by Sex
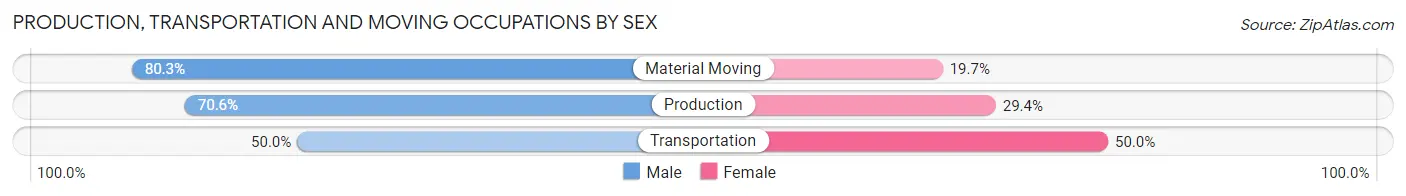
| Occupation | Male | Female |
| Production | 36 (70.6%) | 15 (29.4%) |
| Transportation | 9 (50.0%) | 9 (50.0%) |
| Material Moving | 49 (80.3%) | 12 (19.7%) |
| Total (Category) | 94 (72.3%) | 36 (27.7%) |
| Total (Overall) | 363 (60.0%) | 242 (40.0%) |
Employment Industries by Sex in Mount Vernon
Employment Industries in Mount Vernon
The major employment industries in Mount Vernon include Health Care & Social Assistance (149 | 24.6%), Manufacturing (89 | 14.7%), Accommodation & Food Services (67 | 11.1%), Retail Trade (64 | 10.6%), and Public Administration (47 | 7.8%).
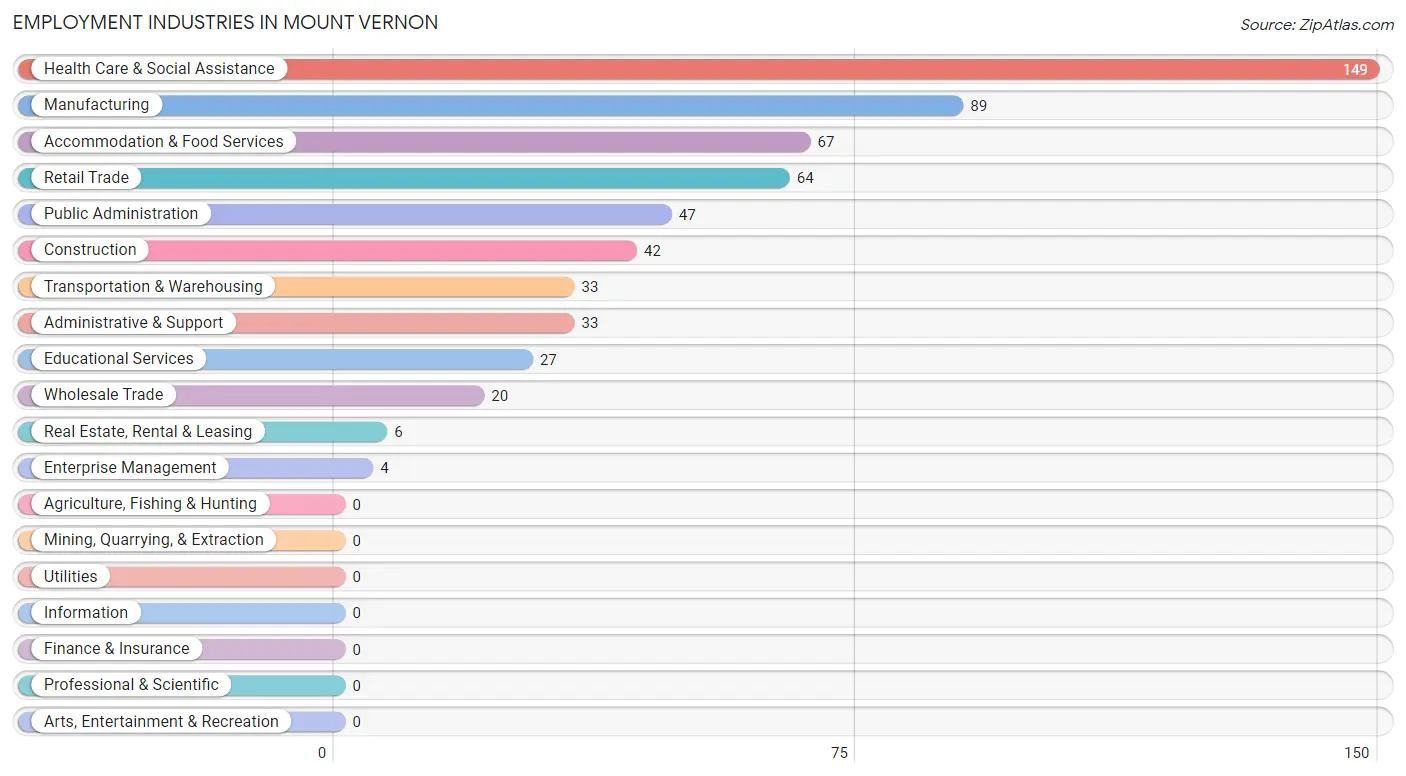
Employment Industries by Sex in Mount Vernon
The Mount Vernon industries that see more men than women are Construction (100.0%), Wholesale Trade (100.0%), and Real Estate, Rental & Leasing (100.0%), whereas the industries that tend to have a higher number of women are Educational Services (85.2%), Administrative & Support (84.9%), and Transportation & Warehousing (63.6%).
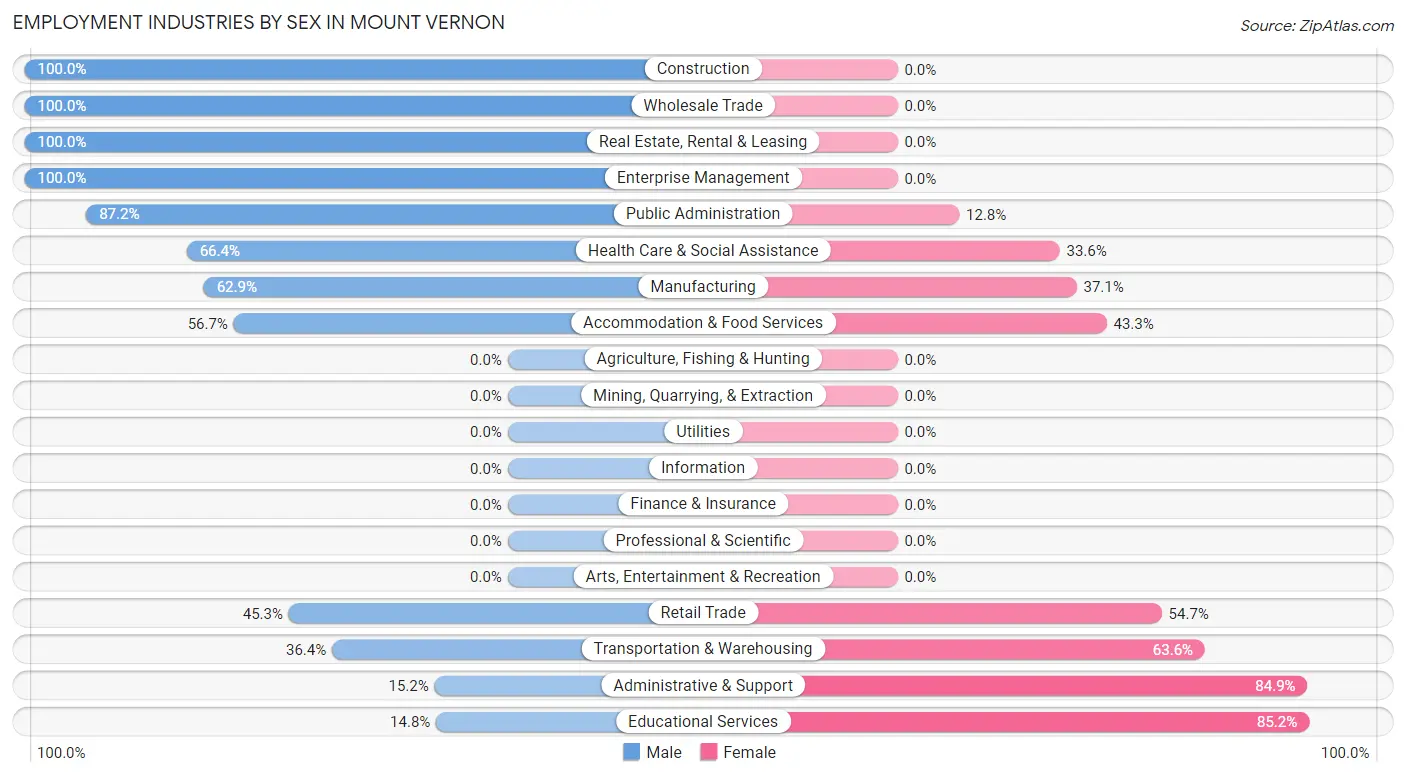
| Industry | Male | Female |
| Agriculture, Fishing & Hunting | 0 (0.0%) | 0 (0.0%) |
| Mining, Quarrying, & Extraction | 0 (0.0%) | 0 (0.0%) |
| Construction | 42 (100.0%) | 0 (0.0%) |
| Manufacturing | 56 (62.9%) | 33 (37.1%) |
| Wholesale Trade | 20 (100.0%) | 0 (0.0%) |
| Retail Trade | 29 (45.3%) | 35 (54.7%) |
| Transportation & Warehousing | 12 (36.4%) | 21 (63.6%) |
| Utilities | 0 (0.0%) | 0 (0.0%) |
| Information | 0 (0.0%) | 0 (0.0%) |
| Finance & Insurance | 0 (0.0%) | 0 (0.0%) |
| Real Estate, Rental & Leasing | 6 (100.0%) | 0 (0.0%) |
| Professional & Scientific | 0 (0.0%) | 0 (0.0%) |
| Enterprise Management | 4 (100.0%) | 0 (0.0%) |
| Administrative & Support | 5 (15.1%) | 28 (84.9%) |
| Educational Services | 4 (14.8%) | 23 (85.2%) |
| Health Care & Social Assistance | 99 (66.4%) | 50 (33.6%) |
| Arts, Entertainment & Recreation | 0 (0.0%) | 0 (0.0%) |
| Accommodation & Food Services | 38 (56.7%) | 29 (43.3%) |
| Public Administration | 41 (87.2%) | 6 (12.8%) |
| Total | 363 (60.0%) | 242 (40.0%) |
Education in Mount Vernon
School Enrollment in Mount Vernon
The most common levels of schooling among the 247 students in Mount Vernon are middle school (79 | 32.0%), high school (63 | 25.5%), and elementary school (50 | 20.2%).
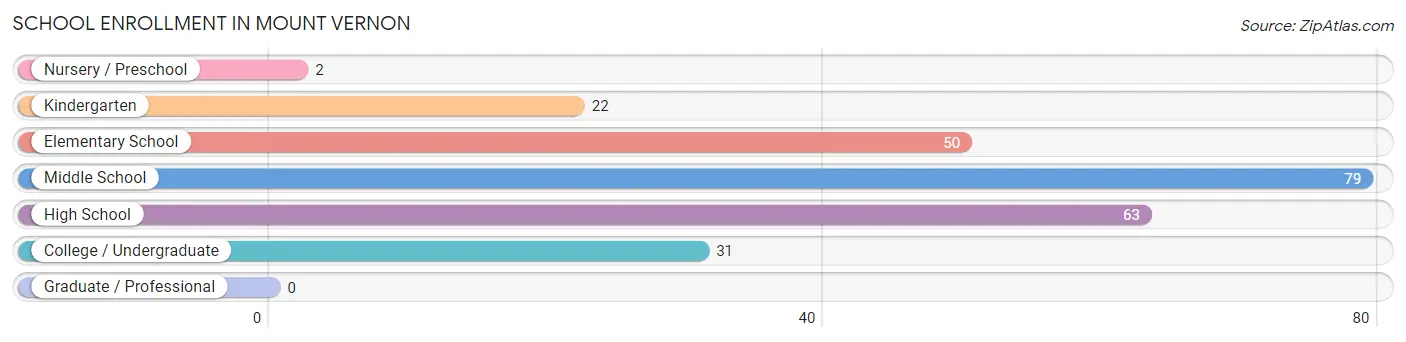
| School Level | # Students | % Students |
| Nursery / Preschool | 2 | 0.8% |
| Kindergarten | 22 | 8.9% |
| Elementary School | 50 | 20.2% |
| Middle School | 79 | 32.0% |
| High School | 63 | 25.5% |
| College / Undergraduate | 31 | 12.6% |
| Graduate / Professional | 0 | 0.0% |
| Total | 247 | 100.0% |
School Enrollment by Age by Funding Source in Mount Vernon
Out of a total of 247 students who are enrolled in schools in Mount Vernon, 18 (7.3%) attend a private institution, while the remaining 229 (92.7%) are enrolled in public schools. The age group of 20 to 24 year olds has the highest likelihood of being enrolled in private schools, with 12 (63.2% in the age bracket) enrolled. Conversely, the age group of 3 to 4 year olds has the lowest likelihood of being enrolled in a private school, with 17 (100.0% in the age bracket) attending a public institution.
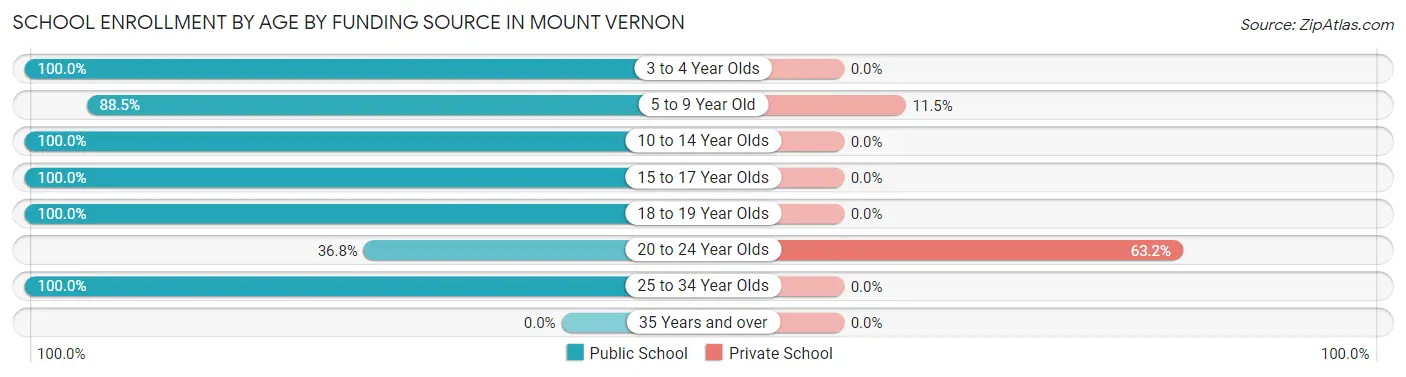
| Age Bracket | Public School | Private School |
| 3 to 4 Year Olds | 17 (100.0%) | 0 (0.0%) |
| 5 to 9 Year Old | 46 (88.5%) | 6 (11.5%) |
| 10 to 14 Year Olds | 84 (100.0%) | 0 (0.0%) |
| 15 to 17 Year Olds | 48 (100.0%) | 0 (0.0%) |
| 18 to 19 Year Olds | 23 (100.0%) | 0 (0.0%) |
| 20 to 24 Year Olds | 7 (36.8%) | 12 (63.2%) |
| 25 to 34 Year Olds | 4 (100.0%) | 0 (0.0%) |
| 35 Years and over | 0 (0.0%) | 0 (0.0%) |
| Total | 229 (92.7%) | 18 (7.3%) |
Educational Attainment by Field of Study in Mount Vernon
Bio, nature & agricultural (100 | 60.2%), science & technology (16 | 9.6%), business (11 | 6.6%), education (11 | 6.6%), and social sciences (9 | 5.4%) are the most common fields of study among 166 individuals in Mount Vernon who have obtained a bachelor's degree or higher.
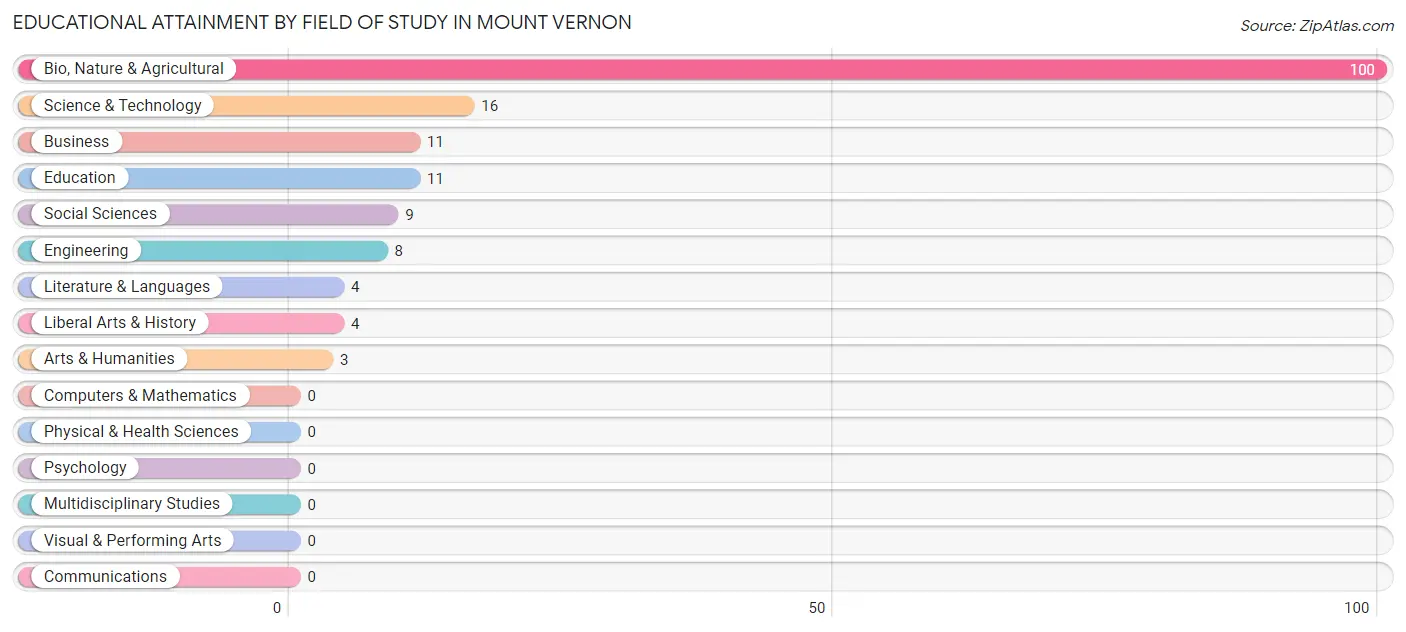
| Field of Study | # Graduates | % Graduates |
| Computers & Mathematics | 0 | 0.0% |
| Bio, Nature & Agricultural | 100 | 60.2% |
| Physical & Health Sciences | 0 | 0.0% |
| Psychology | 0 | 0.0% |
| Social Sciences | 9 | 5.4% |
| Engineering | 8 | 4.8% |
| Multidisciplinary Studies | 0 | 0.0% |
| Science & Technology | 16 | 9.6% |
| Business | 11 | 6.6% |
| Education | 11 | 6.6% |
| Literature & Languages | 4 | 2.4% |
| Liberal Arts & History | 4 | 2.4% |
| Visual & Performing Arts | 0 | 0.0% |
| Communications | 0 | 0.0% |
| Arts & Humanities | 3 | 1.8% |
| Total | 166 | 100.0% |
Transportation & Commute in Mount Vernon
Vehicle Availability by Sex in Mount Vernon
The most prevalent vehicle ownership categories in Mount Vernon are males with 3 vehicles (198, accounting for 55.9%) and females with 3 vehicles (77, making up 85.0%).
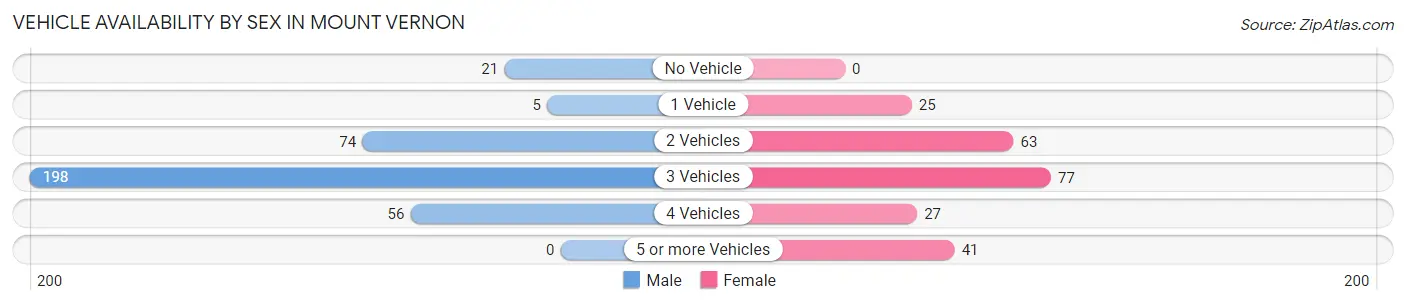
| Vehicles Available | Male | Female |
| No Vehicle | 21 (5.9%) | 0 (0.0%) |
| 1 Vehicle | 5 (1.4%) | 25 (10.7%) |
| 2 Vehicles | 74 (20.9%) | 63 (27.0%) |
| 3 Vehicles | 198 (55.9%) | 77 (33.1%) |
| 4 Vehicles | 56 (15.8%) | 27 (11.6%) |
| 5 or more Vehicles | 0 (0.0%) | 41 (17.6%) |
| Total | 354 (100.0%) | 233 (100.0%) |
Commute Time in Mount Vernon
The most frequently occuring commute durations in Mount Vernon are 30 to 34 minutes (212 commuters, 38.1%), 10 to 14 minutes (75 commuters, 13.5%), and 15 to 19 minutes (67 commuters, 12.0%).
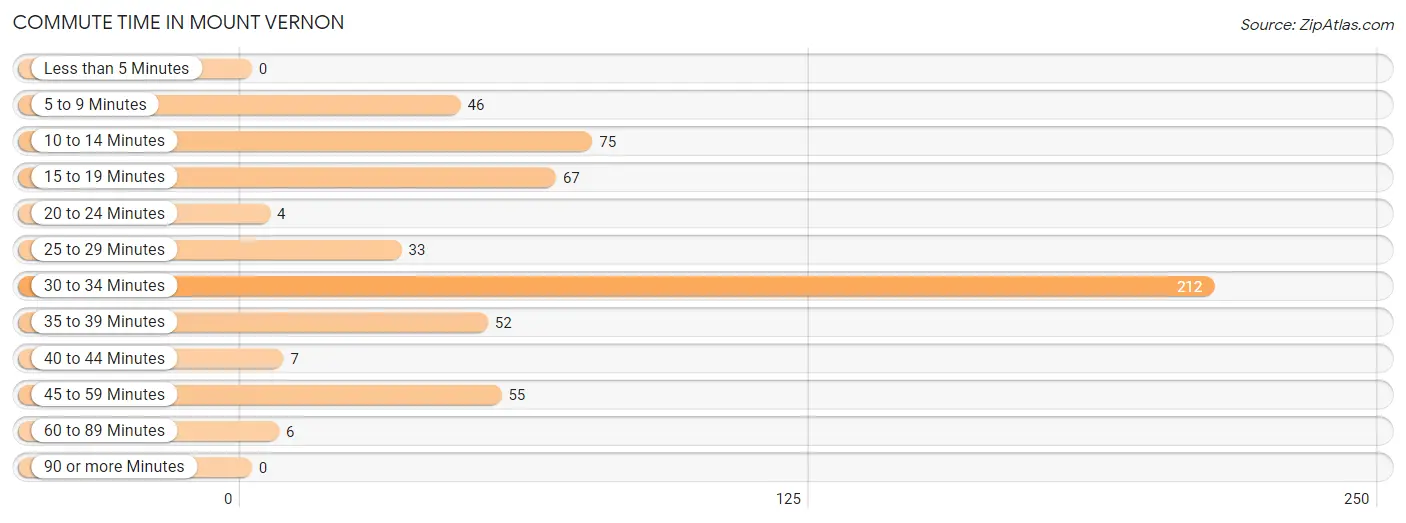
| Commute Time | # Commuters | % Commuters |
| Less than 5 Minutes | 0 | 0.0% |
| 5 to 9 Minutes | 46 | 8.3% |
| 10 to 14 Minutes | 75 | 13.5% |
| 15 to 19 Minutes | 67 | 12.0% |
| 20 to 24 Minutes | 4 | 0.7% |
| 25 to 29 Minutes | 33 | 5.9% |
| 30 to 34 Minutes | 212 | 38.1% |
| 35 to 39 Minutes | 52 | 9.3% |
| 40 to 44 Minutes | 7 | 1.3% |
| 45 to 59 Minutes | 55 | 9.9% |
| 60 to 89 Minutes | 6 | 1.1% |
| 90 or more Minutes | 0 | 0.0% |
Commute Time by Sex in Mount Vernon
The most common commute times in Mount Vernon are 30 to 34 minutes (182 commuters, 53.8%) for males and 10 to 14 minutes (59 commuters, 26.9%) for females.
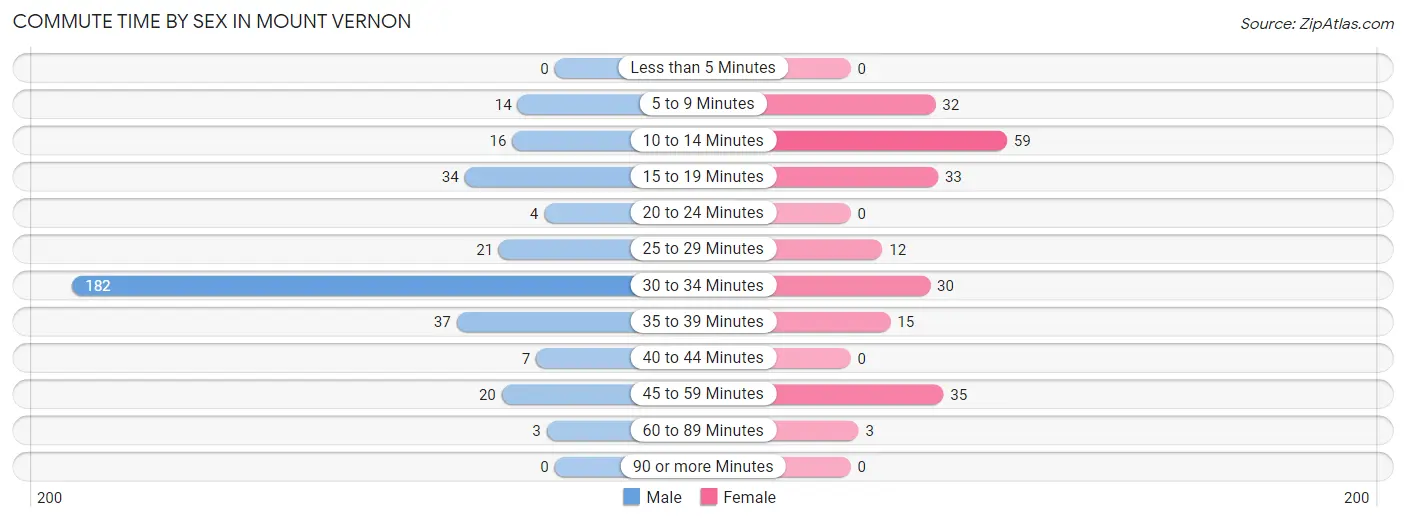
| Commute Time | Male | Female |
| Less than 5 Minutes | 0 (0.0%) | 0 (0.0%) |
| 5 to 9 Minutes | 14 (4.1%) | 32 (14.6%) |
| 10 to 14 Minutes | 16 (4.7%) | 59 (26.9%) |
| 15 to 19 Minutes | 34 (10.1%) | 33 (15.1%) |
| 20 to 24 Minutes | 4 (1.2%) | 0 (0.0%) |
| 25 to 29 Minutes | 21 (6.2%) | 12 (5.5%) |
| 30 to 34 Minutes | 182 (53.8%) | 30 (13.7%) |
| 35 to 39 Minutes | 37 (11.0%) | 15 (6.9%) |
| 40 to 44 Minutes | 7 (2.1%) | 0 (0.0%) |
| 45 to 59 Minutes | 20 (5.9%) | 35 (16.0%) |
| 60 to 89 Minutes | 3 (0.9%) | 3 (1.4%) |
| 90 or more Minutes | 0 (0.0%) | 0 (0.0%) |
Time of Departure to Work by Sex in Mount Vernon
The most frequent times of departure to work in Mount Vernon are 12:00 PM to 3:59 PM (122, 36.1%) for males and 6:30 AM to 6:59 AM (49, 22.4%) for females.
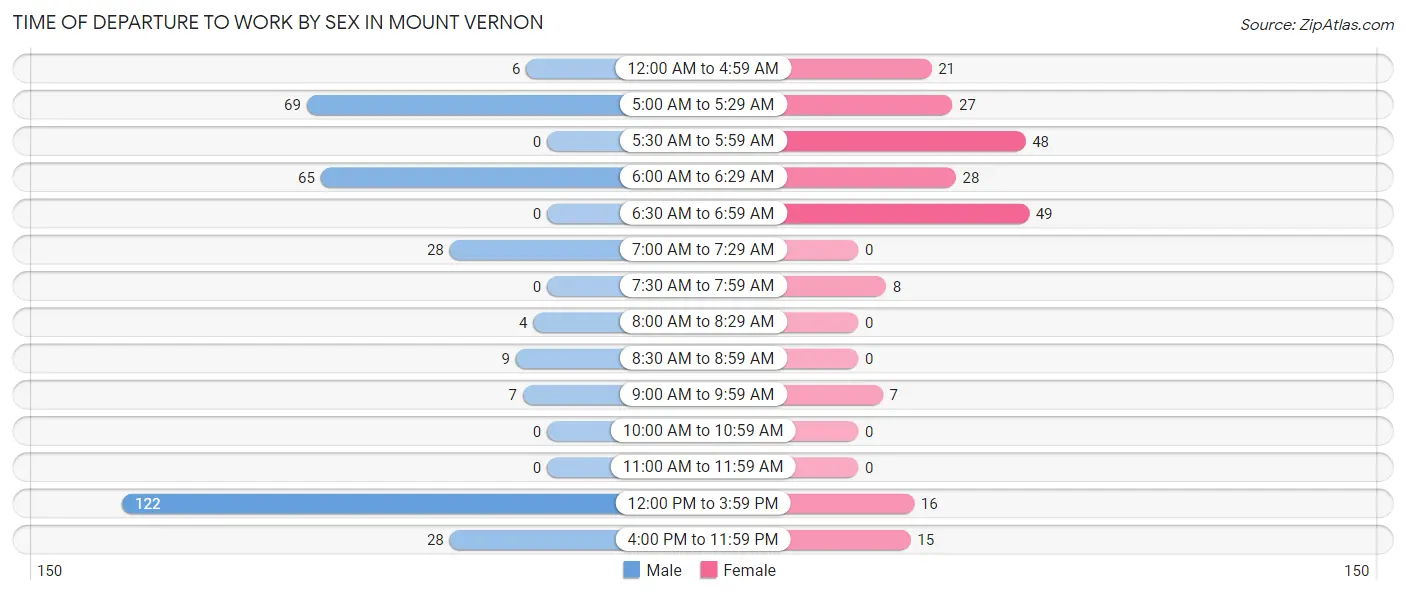
| Time of Departure | Male | Female |
| 12:00 AM to 4:59 AM | 6 (1.8%) | 21 (9.6%) |
| 5:00 AM to 5:29 AM | 69 (20.4%) | 27 (12.3%) |
| 5:30 AM to 5:59 AM | 0 (0.0%) | 48 (21.9%) |
| 6:00 AM to 6:29 AM | 65 (19.2%) | 28 (12.8%) |
| 6:30 AM to 6:59 AM | 0 (0.0%) | 49 (22.4%) |
| 7:00 AM to 7:29 AM | 28 (8.3%) | 0 (0.0%) |
| 7:30 AM to 7:59 AM | 0 (0.0%) | 8 (3.6%) |
| 8:00 AM to 8:29 AM | 4 (1.2%) | 0 (0.0%) |
| 8:30 AM to 8:59 AM | 9 (2.7%) | 0 (0.0%) |
| 9:00 AM to 9:59 AM | 7 (2.1%) | 7 (3.2%) |
| 10:00 AM to 10:59 AM | 0 (0.0%) | 0 (0.0%) |
| 11:00 AM to 11:59 AM | 0 (0.0%) | 0 (0.0%) |
| 12:00 PM to 3:59 PM | 122 (36.1%) | 16 (7.3%) |
| 4:00 PM to 11:59 PM | 28 (8.3%) | 15 (6.9%) |
| Total | 338 (100.0%) | 219 (100.0%) |
Housing Occupancy in Mount Vernon
Occupancy by Ownership in Mount Vernon
Of the total 451 dwellings in Mount Vernon, owner-occupied units account for 328 (72.7%), while renter-occupied units make up 123 (27.3%).
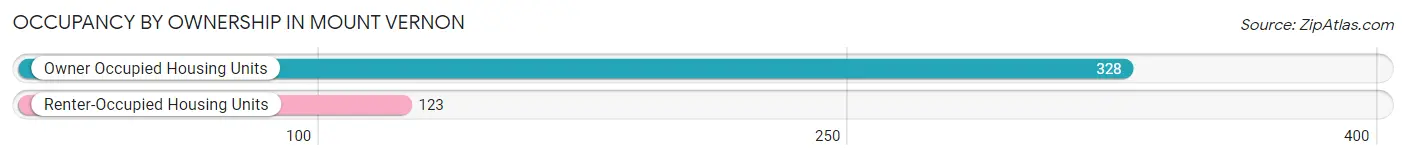
| Occupancy | # Housing Units | % Housing Units |
| Owner Occupied Housing Units | 328 | 72.7% |
| Renter-Occupied Housing Units | 123 | 27.3% |
| Total Occupied Housing Units | 451 | 100.0% |
Occupancy by Household Size in Mount Vernon
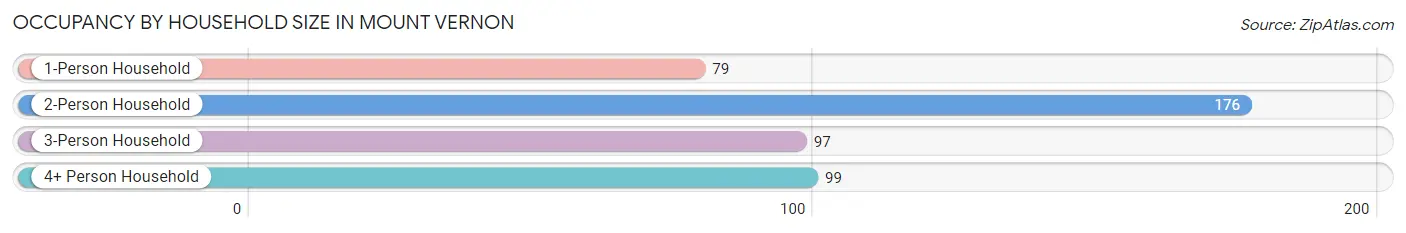
| Household Size | # Housing Units | % Housing Units |
| 1-Person Household | 79 | 17.5% |
| 2-Person Household | 176 | 39.0% |
| 3-Person Household | 97 | 21.5% |
| 4+ Person Household | 99 | 22.0% |
| Total Housing Units | 451 | 100.0% |
Occupancy by Ownership by Household Size in Mount Vernon
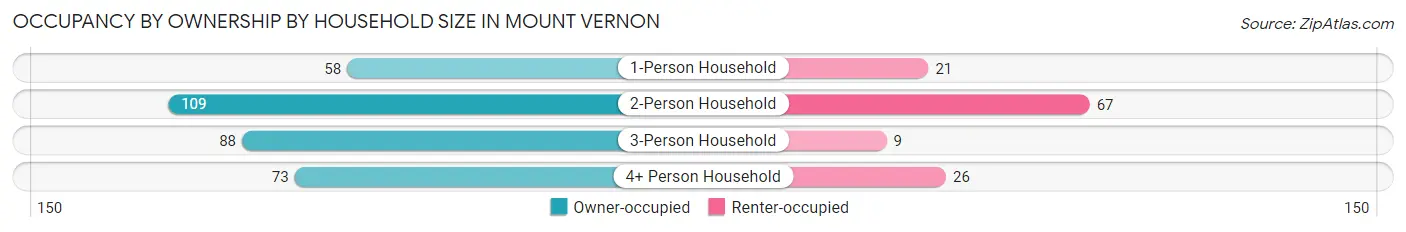
| Household Size | Owner-occupied | Renter-occupied |
| 1-Person Household | 58 (73.4%) | 21 (26.6%) |
| 2-Person Household | 109 (61.9%) | 67 (38.1%) |
| 3-Person Household | 88 (90.7%) | 9 (9.3%) |
| 4+ Person Household | 73 (73.7%) | 26 (26.3%) |
| Total Housing Units | 328 (72.7%) | 123 (27.3%) |
Occupancy by Educational Attainment in Mount Vernon
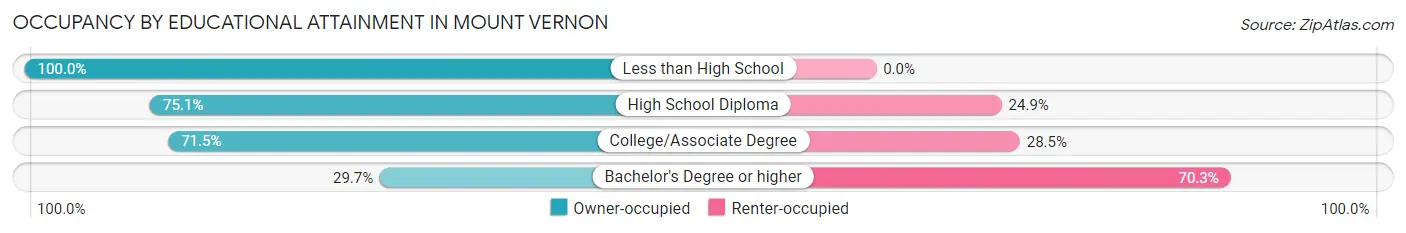
| Household Size | Owner-occupied | Renter-occupied |
| Less than High School | 46 (100.0%) | 0 (0.0%) |
| High School Diploma | 163 (75.1%) | 54 (24.9%) |
| College/Associate Degree | 108 (71.5%) | 43 (28.5%) |
| Bachelor's Degree or higher | 11 (29.7%) | 26 (70.3%) |
Occupancy by Age of Householder in Mount Vernon
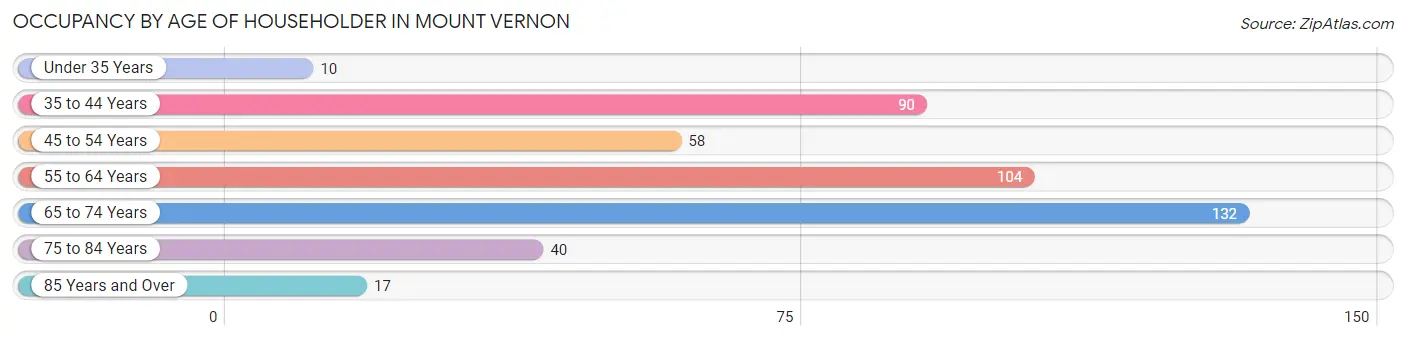
| Age Bracket | # Households | % Households |
| Under 35 Years | 10 | 2.2% |
| 35 to 44 Years | 90 | 20.0% |
| 45 to 54 Years | 58 | 12.9% |
| 55 to 64 Years | 104 | 23.1% |
| 65 to 74 Years | 132 | 29.3% |
| 75 to 84 Years | 40 | 8.9% |
| 85 Years and Over | 17 | 3.8% |
| Total | 451 | 100.0% |
Housing Finances in Mount Vernon
Median Income by Occupancy in Mount Vernon
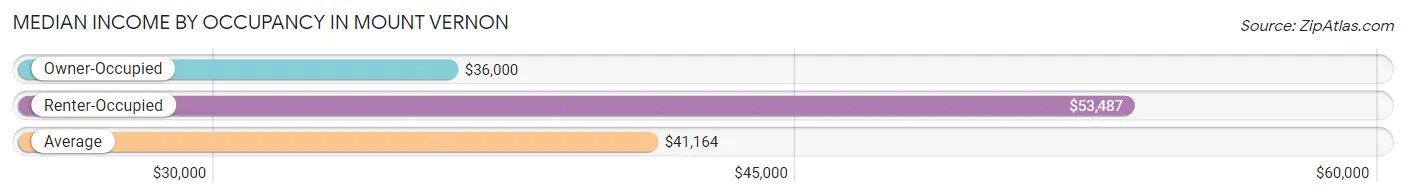
| Occupancy Type | # Households | Median Income |
| Owner-Occupied | 328 (72.7%) | $36,000 |
| Renter-Occupied | 123 (27.3%) | $53,487 |
| Average | 451 (100.0%) | $41,164 |
Occupancy by Householder Income Bracket in Mount Vernon
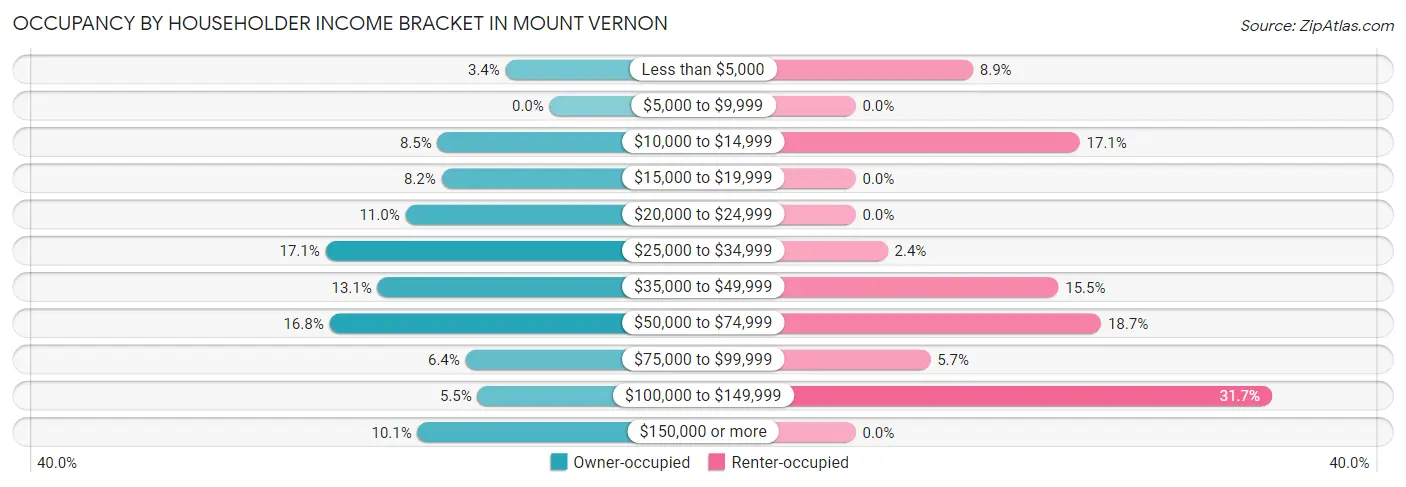
| Income Bracket | Owner-occupied | Renter-occupied |
| Less than $5,000 | 11 (3.4%) | 11 (8.9%) |
| $5,000 to $9,999 | 0 (0.0%) | 0 (0.0%) |
| $10,000 to $14,999 | 28 (8.5%) | 21 (17.1%) |
| $15,000 to $19,999 | 27 (8.2%) | 0 (0.0%) |
| $20,000 to $24,999 | 36 (11.0%) | 0 (0.0%) |
| $25,000 to $34,999 | 56 (17.1%) | 3 (2.4%) |
| $35,000 to $49,999 | 43 (13.1%) | 19 (15.4%) |
| $50,000 to $74,999 | 55 (16.8%) | 23 (18.7%) |
| $75,000 to $99,999 | 21 (6.4%) | 7 (5.7%) |
| $100,000 to $149,999 | 18 (5.5%) | 39 (31.7%) |
| $150,000 or more | 33 (10.1%) | 0 (0.0%) |
| Total | 328 (100.0%) | 123 (100.0%) |
Monthly Housing Cost Tiers in Mount Vernon
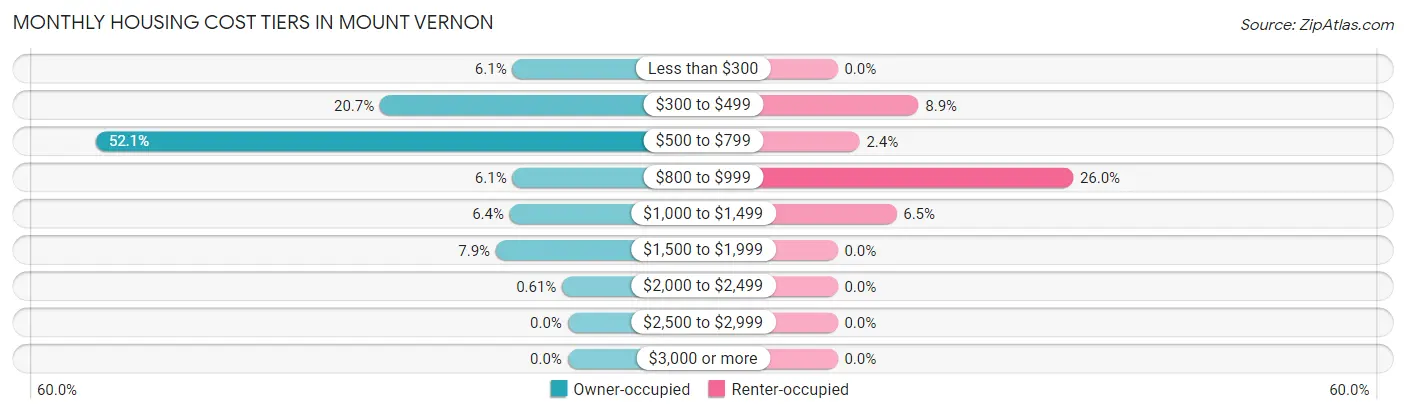
| Monthly Cost | Owner-occupied | Renter-occupied |
| Less than $300 | 20 (6.1%) | 0 (0.0%) |
| $300 to $499 | 68 (20.7%) | 11 (8.9%) |
| $500 to $799 | 171 (52.1%) | 3 (2.4%) |
| $800 to $999 | 20 (6.1%) | 32 (26.0%) |
| $1,000 to $1,499 | 21 (6.4%) | 8 (6.5%) |
| $1,500 to $1,999 | 26 (7.9%) | 0 (0.0%) |
| $2,000 to $2,499 | 2 (0.6%) | 0 (0.0%) |
| $2,500 to $2,999 | 0 (0.0%) | 0 (0.0%) |
| $3,000 or more | 0 (0.0%) | 0 (0.0%) |
| Total | 328 (100.0%) | 123 (100.0%) |
Physical Housing Characteristics in Mount Vernon
Housing Structures in Mount Vernon
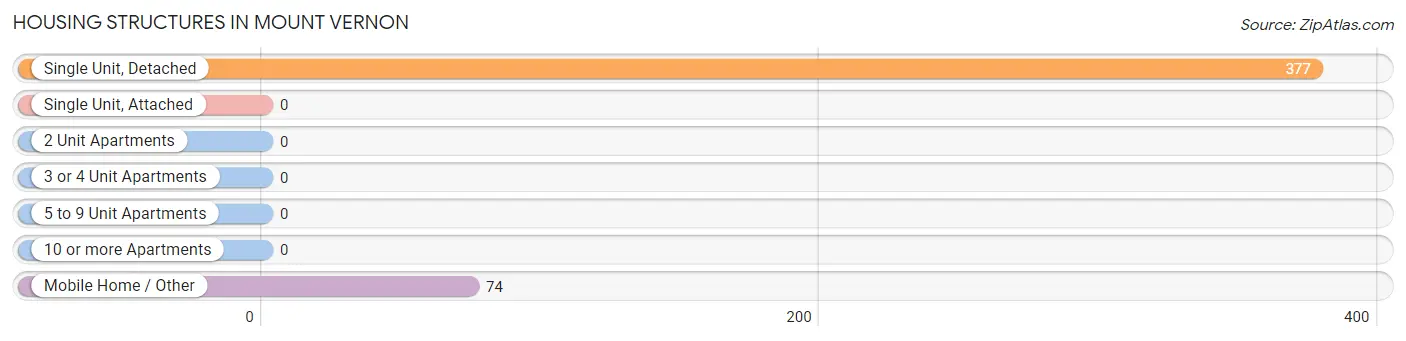
| Structure Type | # Housing Units | % Housing Units |
| Single Unit, Detached | 377 | 83.6% |
| Single Unit, Attached | 0 | 0.0% |
| 2 Unit Apartments | 0 | 0.0% |
| 3 or 4 Unit Apartments | 0 | 0.0% |
| 5 to 9 Unit Apartments | 0 | 0.0% |
| 10 or more Apartments | 0 | 0.0% |
| Mobile Home / Other | 74 | 16.4% |
| Total | 451 | 100.0% |
Housing Structures by Occupancy in Mount Vernon
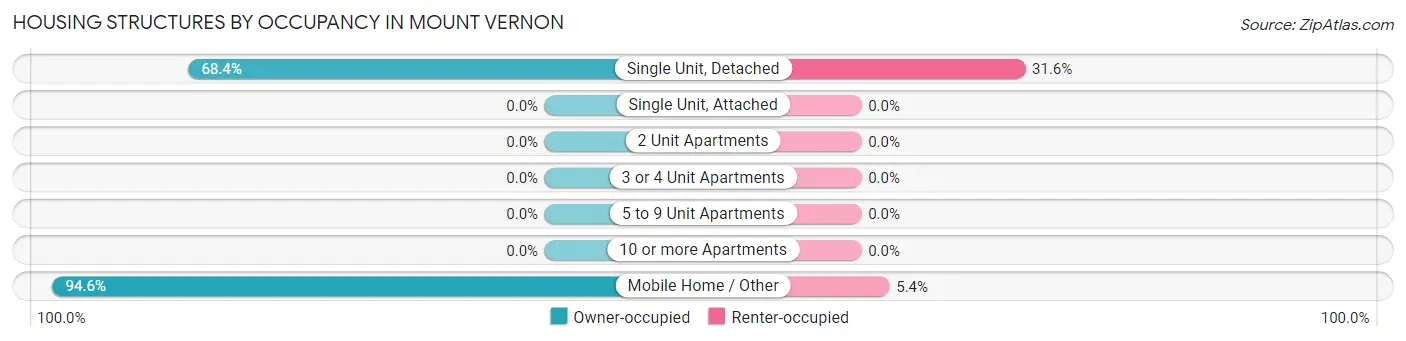
| Structure Type | Owner-occupied | Renter-occupied |
| Single Unit, Detached | 258 (68.4%) | 119 (31.6%) |
| Single Unit, Attached | 0 (0.0%) | 0 (0.0%) |
| 2 Unit Apartments | 0 (0.0%) | 0 (0.0%) |
| 3 or 4 Unit Apartments | 0 (0.0%) | 0 (0.0%) |
| 5 to 9 Unit Apartments | 0 (0.0%) | 0 (0.0%) |
| 10 or more Apartments | 0 (0.0%) | 0 (0.0%) |
| Mobile Home / Other | 70 (94.6%) | 4 (5.4%) |
| Total | 328 (72.7%) | 123 (27.3%) |
Housing Structures by Number of Rooms in Mount Vernon
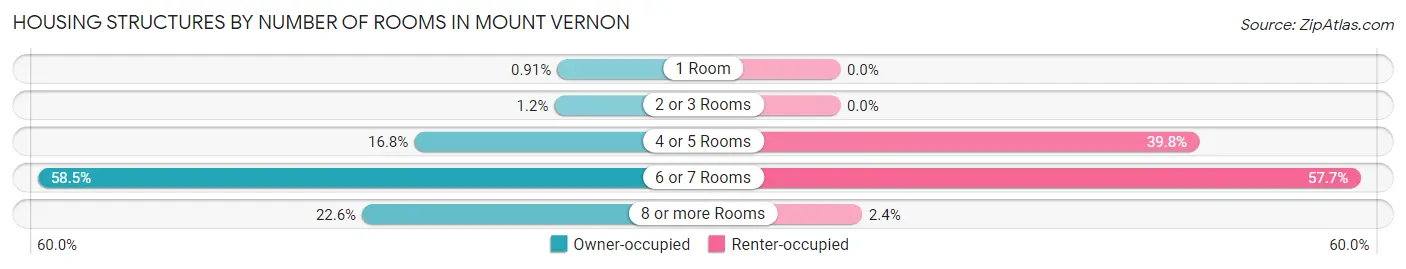
| Number of Rooms | Owner-occupied | Renter-occupied |
| 1 Room | 3 (0.9%) | 0 (0.0%) |
| 2 or 3 Rooms | 4 (1.2%) | 0 (0.0%) |
| 4 or 5 Rooms | 55 (16.8%) | 49 (39.8%) |
| 6 or 7 Rooms | 192 (58.5%) | 71 (57.7%) |
| 8 or more Rooms | 74 (22.6%) | 3 (2.4%) |
| Total | 328 (100.0%) | 123 (100.0%) |
Housing Structure by Heating Type in Mount Vernon
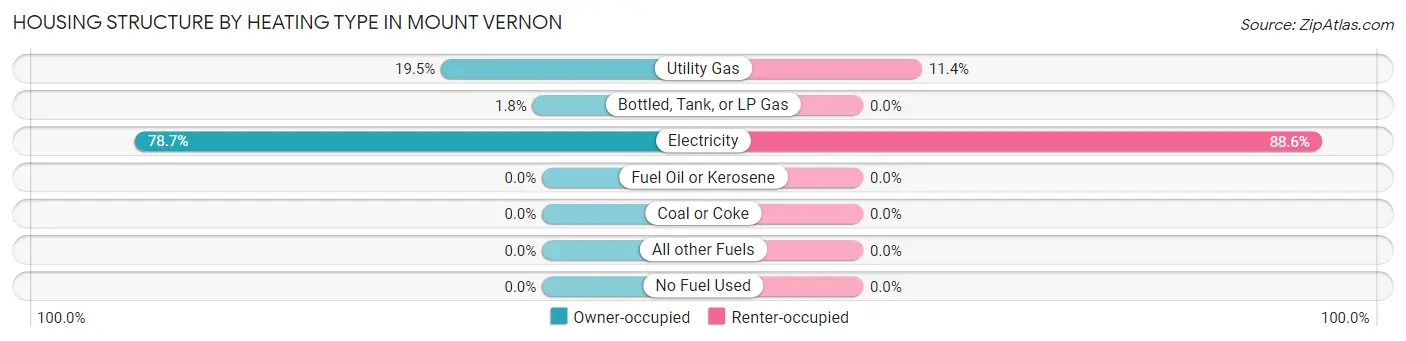
| Heating Type | Owner-occupied | Renter-occupied |
| Utility Gas | 64 (19.5%) | 14 (11.4%) |
| Bottled, Tank, or LP Gas | 6 (1.8%) | 0 (0.0%) |
| Electricity | 258 (78.7%) | 109 (88.6%) |
| Fuel Oil or Kerosene | 0 (0.0%) | 0 (0.0%) |
| Coal or Coke | 0 (0.0%) | 0 (0.0%) |
| All other Fuels | 0 (0.0%) | 0 (0.0%) |
| No Fuel Used | 0 (0.0%) | 0 (0.0%) |
| Total | 328 (100.0%) | 123 (100.0%) |
Household Vehicle Usage in Mount Vernon
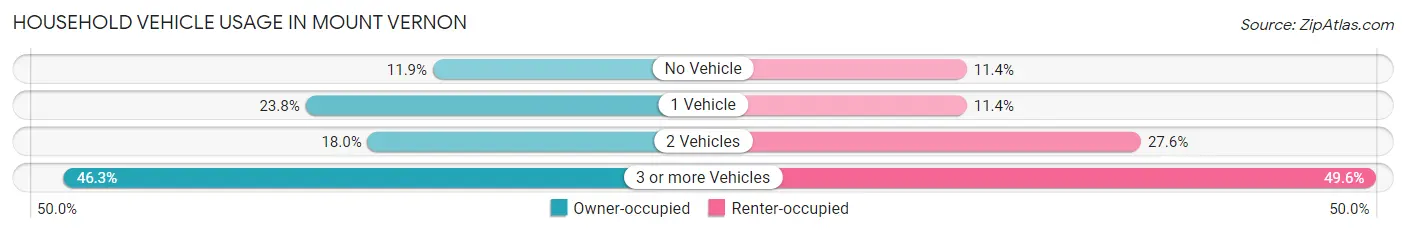
| Vehicles per Household | Owner-occupied | Renter-occupied |
| No Vehicle | 39 (11.9%) | 14 (11.4%) |
| 1 Vehicle | 78 (23.8%) | 14 (11.4%) |
| 2 Vehicles | 59 (18.0%) | 34 (27.6%) |
| 3 or more Vehicles | 152 (46.3%) | 61 (49.6%) |
| Total | 328 (100.0%) | 123 (100.0%) |
Real Estate & Mortgages in Mount Vernon
Real Estate and Mortgage Overview in Mount Vernon
| Characteristic | Without Mortgage | With Mortgage |
| Housing Units | 226 | 102 |
| Median Property Value | $110,300 | $110,000 |
| Median Household Income | $34,444 | $5 |
| Monthly Housing Costs | $535 | $0 |
| Real Estate Taxes | $386 | $32 |
Property Value by Mortgage Status in Mount Vernon
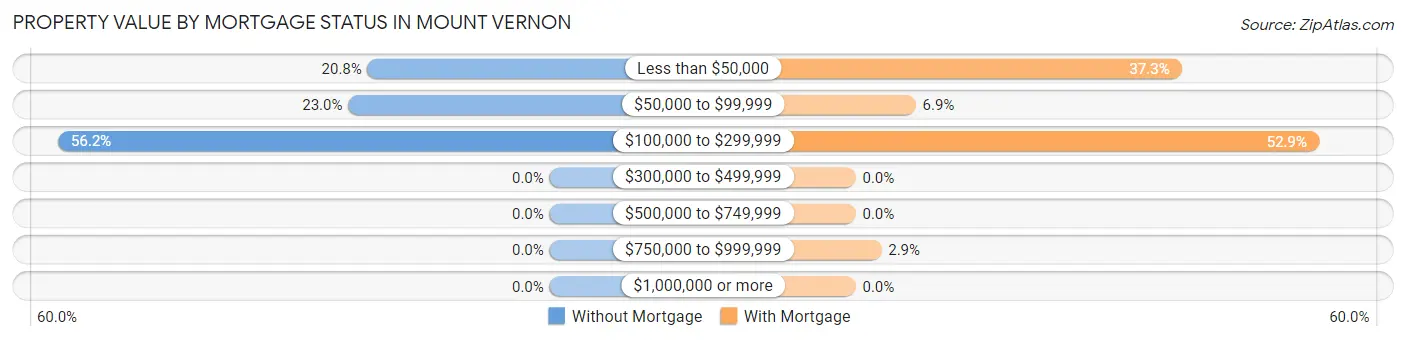
| Property Value | Without Mortgage | With Mortgage |
| Less than $50,000 | 47 (20.8%) | 38 (37.2%) |
| $50,000 to $99,999 | 52 (23.0%) | 7 (6.9%) |
| $100,000 to $299,999 | 127 (56.2%) | 54 (52.9%) |
| $300,000 to $499,999 | 0 (0.0%) | 0 (0.0%) |
| $500,000 to $749,999 | 0 (0.0%) | 0 (0.0%) |
| $750,000 to $999,999 | 0 (0.0%) | 3 (2.9%) |
| $1,000,000 or more | 0 (0.0%) | 0 (0.0%) |
| Total | 226 (100.0%) | 102 (100.0%) |
Household Income by Mortgage Status in Mount Vernon
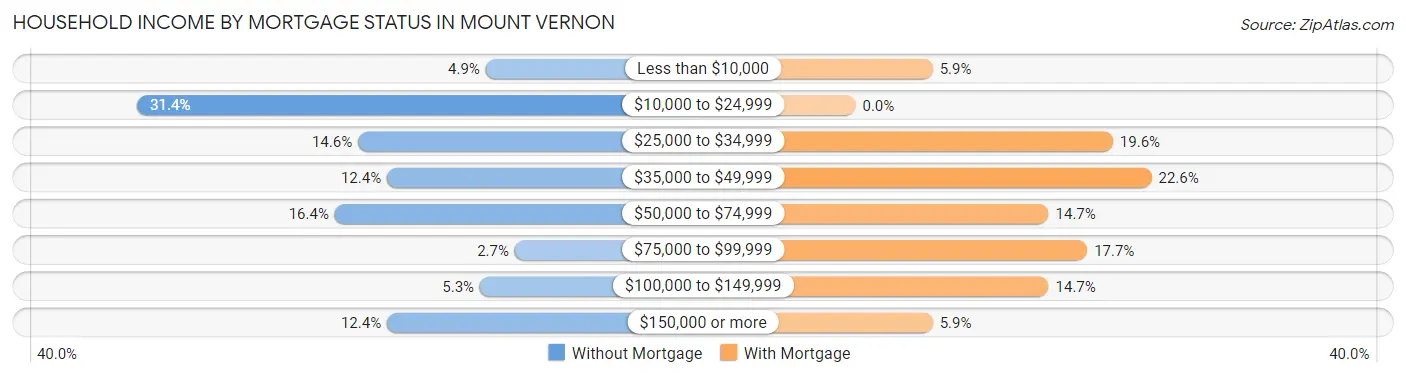
| Household Income | Without Mortgage | With Mortgage |
| Less than $10,000 | 11 (4.9%) | 6 (5.9%) |
| $10,000 to $24,999 | 71 (31.4%) | 0 (0.0%) |
| $25,000 to $34,999 | 33 (14.6%) | 20 (19.6%) |
| $35,000 to $49,999 | 28 (12.4%) | 23 (22.6%) |
| $50,000 to $74,999 | 37 (16.4%) | 15 (14.7%) |
| $75,000 to $99,999 | 6 (2.6%) | 18 (17.6%) |
| $100,000 to $149,999 | 12 (5.3%) | 15 (14.7%) |
| $150,000 or more | 28 (12.4%) | 6 (5.9%) |
| Total | 226 (100.0%) | 102 (100.0%) |
Property Value to Household Income Ratio in Mount Vernon
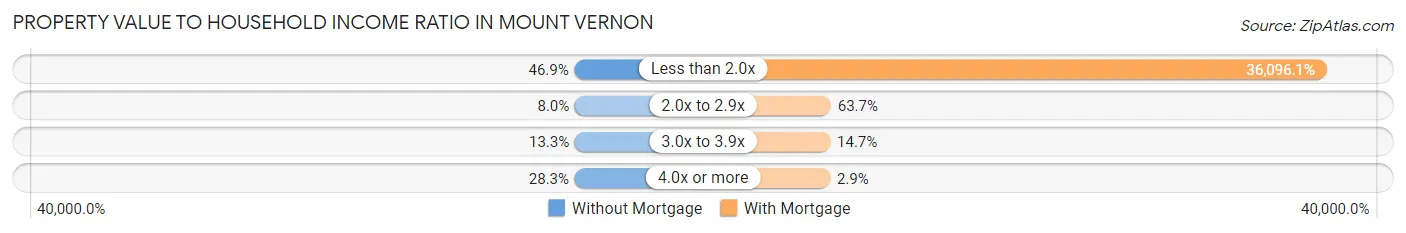
| Value-to-Income Ratio | Without Mortgage | With Mortgage |
| Less than 2.0x | 106 (46.9%) | 36,818 (36,096.1%) |
| 2.0x to 2.9x | 18 (8.0%) | 65 (63.7%) |
| 3.0x to 3.9x | 30 (13.3%) | 15 (14.7%) |
| 4.0x or more | 64 (28.3%) | 3 (2.9%) |
| Total | 226 (100.0%) | 102 (100.0%) |
Real Estate Taxes by Mortgage Status in Mount Vernon
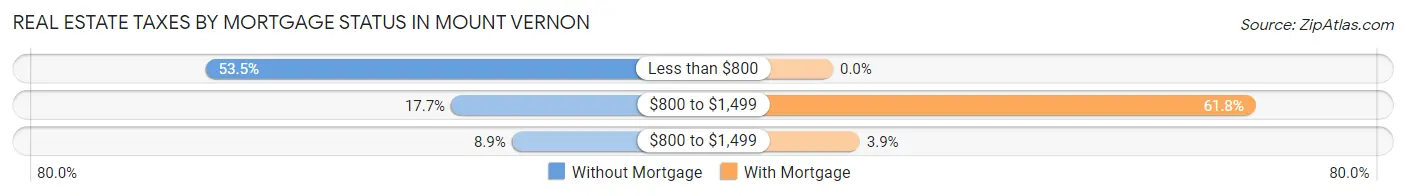
| Property Taxes | Without Mortgage | With Mortgage |
| Less than $800 | 121 (53.5%) | 0 (0.0%) |
| $800 to $1,499 | 40 (17.7%) | 63 (61.8%) |
| $800 to $1,499 | 20 (8.8%) | 4 (3.9%) |
| Total | 226 (100.0%) | 102 (100.0%) |
Health & Disability in Mount Vernon
Health Insurance Coverage by Age in Mount Vernon
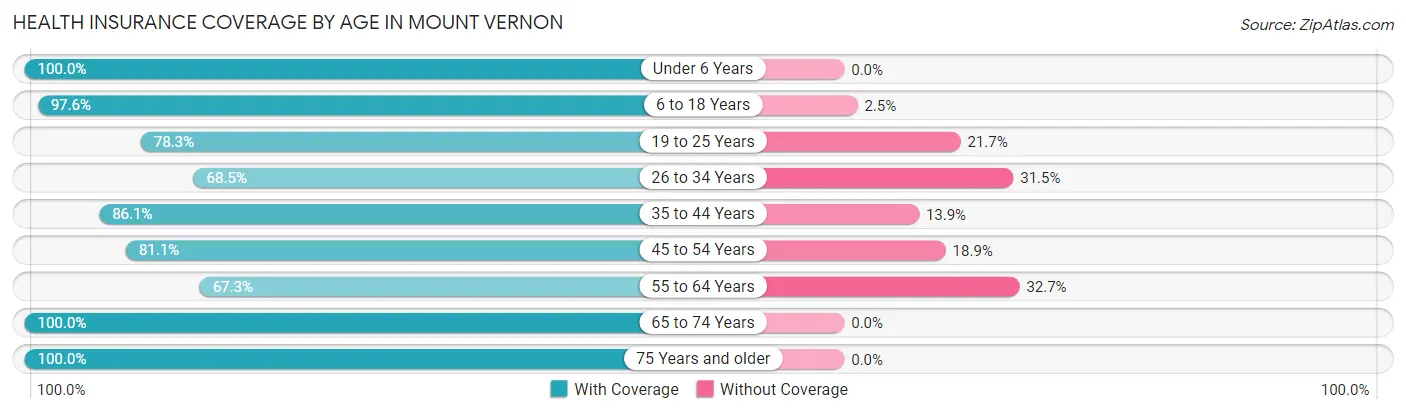
| Age Bracket | With Coverage | Without Coverage |
| Under 6 Years | 64 (100.0%) | 0 (0.0%) |
| 6 to 18 Years | 199 (97.6%) | 5 (2.5%) |
| 19 to 25 Years | 141 (78.3%) | 39 (21.7%) |
| 26 to 34 Years | 113 (68.5%) | 52 (31.5%) |
| 35 to 44 Years | 167 (86.1%) | 27 (13.9%) |
| 45 to 54 Years | 103 (81.1%) | 24 (18.9%) |
| 55 to 64 Years | 134 (67.3%) | 65 (32.7%) |
| 65 to 74 Years | 163 (100.0%) | 0 (0.0%) |
| 75 Years and older | 112 (100.0%) | 0 (0.0%) |
| Total | 1,196 (84.9%) | 212 (15.1%) |
Health Insurance Coverage by Citizenship Status in Mount Vernon
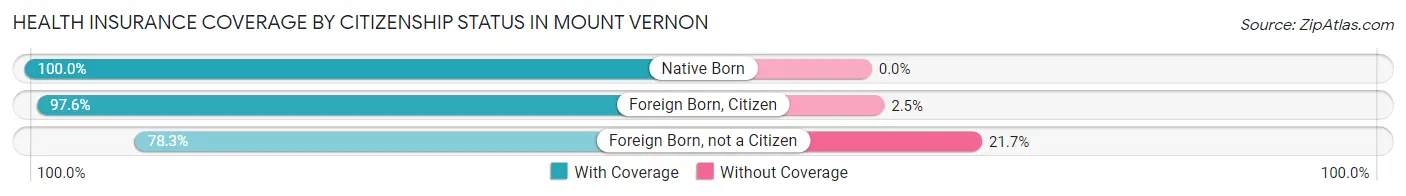
| Citizenship Status | With Coverage | Without Coverage |
| Native Born | 64 (100.0%) | 0 (0.0%) |
| Foreign Born, Citizen | 199 (97.6%) | 5 (2.5%) |
| Foreign Born, not a Citizen | 141 (78.3%) | 39 (21.7%) |
Health Insurance Coverage by Household Income in Mount Vernon
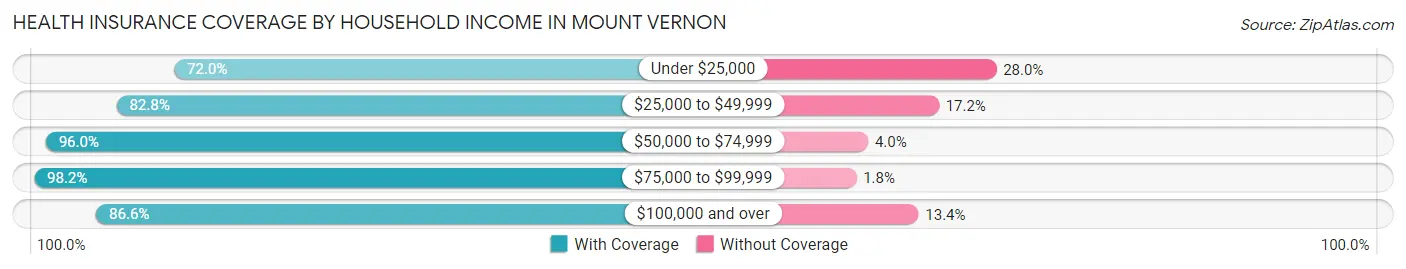
| Household Income | With Coverage | Without Coverage |
| Under $25,000 | 211 (72.0%) | 82 (28.0%) |
| $25,000 to $49,999 | 346 (82.8%) | 72 (17.2%) |
| $50,000 to $74,999 | 194 (96.0%) | 8 (4.0%) |
| $75,000 to $99,999 | 111 (98.2%) | 2 (1.8%) |
| $100,000 and over | 310 (86.6%) | 48 (13.4%) |
Public vs Private Health Insurance Coverage by Age in Mount Vernon
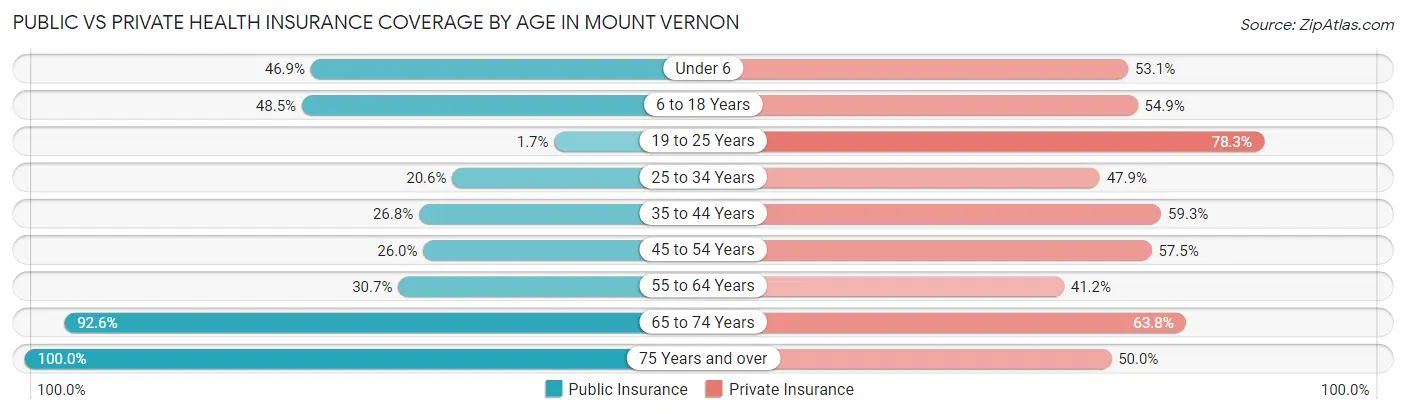
| Age Bracket | Public Insurance | Private Insurance |
| Under 6 | 30 (46.9%) | 34 (53.1%) |
| 6 to 18 Years | 99 (48.5%) | 112 (54.9%) |
| 19 to 25 Years | 3 (1.7%) | 141 (78.3%) |
| 25 to 34 Years | 34 (20.6%) | 79 (47.9%) |
| 35 to 44 Years | 52 (26.8%) | 115 (59.3%) |
| 45 to 54 Years | 33 (26.0%) | 73 (57.5%) |
| 55 to 64 Years | 61 (30.6%) | 82 (41.2%) |
| 65 to 74 Years | 151 (92.6%) | 104 (63.8%) |
| 75 Years and over | 112 (100.0%) | 56 (50.0%) |
| Total | 575 (40.8%) | 796 (56.5%) |
Disability Status by Sex by Age in Mount Vernon
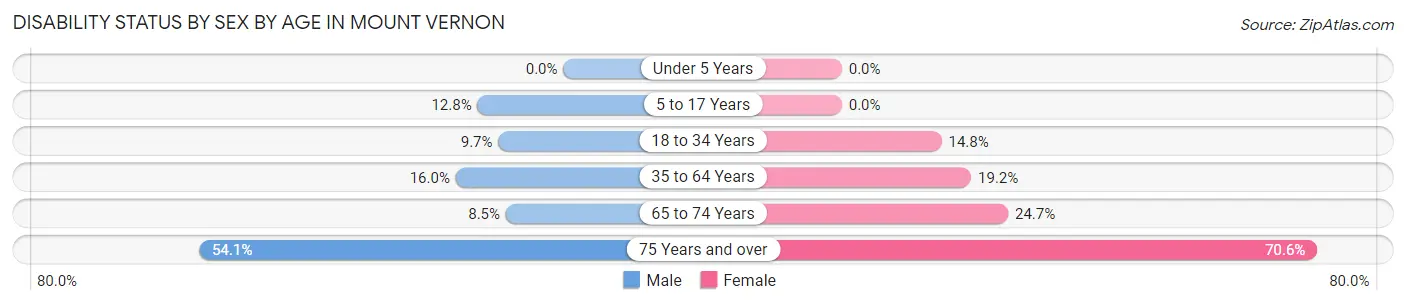
| Age Bracket | Male | Female |
| Under 5 Years | 0 (0.0%) | 0 (0.0%) |
| 5 to 17 Years | 13 (12.8%) | 0 (0.0%) |
| 18 to 34 Years | 22 (9.7%) | 20 (14.8%) |
| 35 to 64 Years | 39 (16.0%) | 53 (19.2%) |
| 65 to 74 Years | 7 (8.5%) | 20 (24.7%) |
| 75 Years and over | 33 (54.1%) | 36 (70.6%) |
Disability Class by Sex by Age in Mount Vernon
Disability Class: Hearing Difficulty
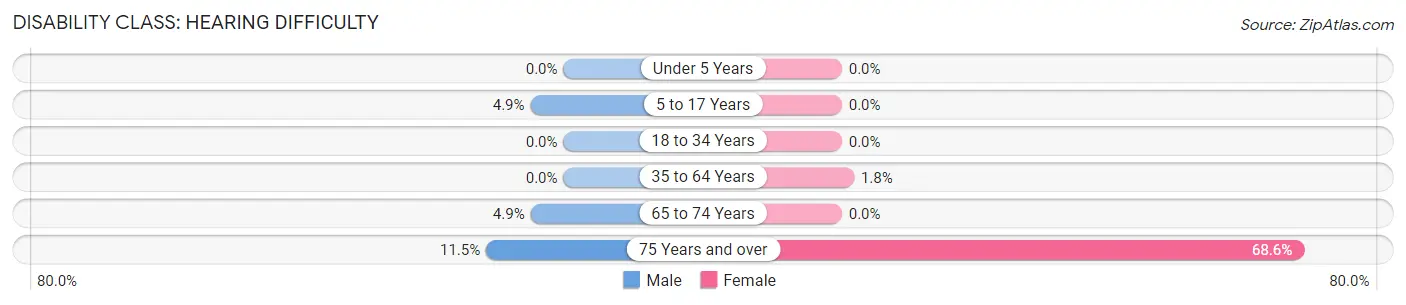
| Age Bracket | Male | Female |
| Under 5 Years | 0 (0.0%) | 0 (0.0%) |
| 5 to 17 Years | 5 (4.9%) | 0 (0.0%) |
| 18 to 34 Years | 0 (0.0%) | 0 (0.0%) |
| 35 to 64 Years | 0 (0.0%) | 5 (1.8%) |
| 65 to 74 Years | 4 (4.9%) | 0 (0.0%) |
| 75 Years and over | 7 (11.5%) | 35 (68.6%) |
Disability Class: Vision Difficulty
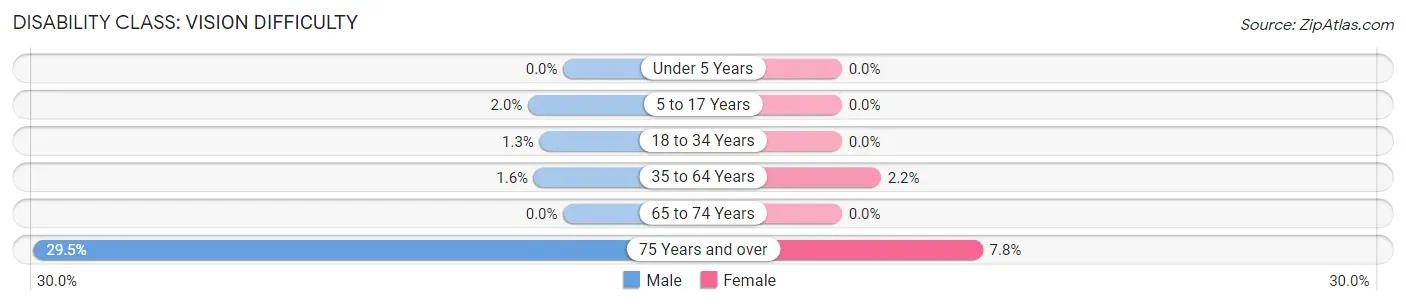
| Age Bracket | Male | Female |
| Under 5 Years | 0 (0.0%) | 0 (0.0%) |
| 5 to 17 Years | 2 (2.0%) | 0 (0.0%) |
| 18 to 34 Years | 3 (1.3%) | 0 (0.0%) |
| 35 to 64 Years | 4 (1.6%) | 6 (2.2%) |
| 65 to 74 Years | 0 (0.0%) | 0 (0.0%) |
| 75 Years and over | 18 (29.5%) | 4 (7.8%) |
Disability Class: Cognitive Difficulty
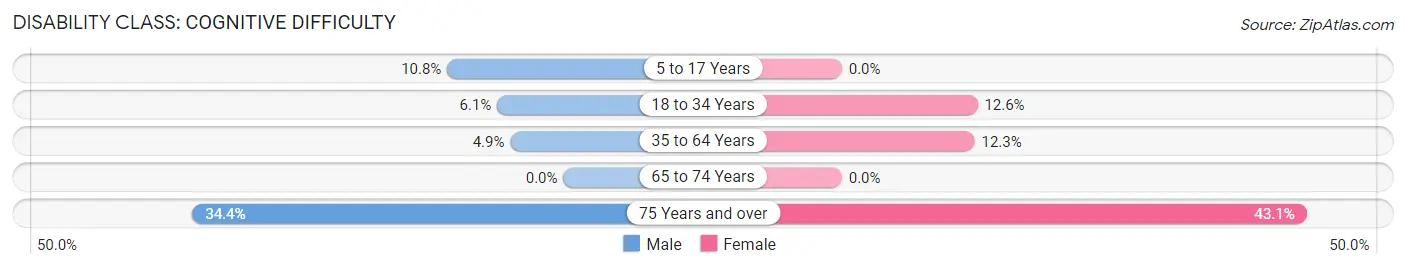
| Age Bracket | Male | Female |
| 5 to 17 Years | 11 (10.8%) | 0 (0.0%) |
| 18 to 34 Years | 14 (6.1%) | 17 (12.6%) |
| 35 to 64 Years | 12 (4.9%) | 34 (12.3%) |
| 65 to 74 Years | 0 (0.0%) | 0 (0.0%) |
| 75 Years and over | 21 (34.4%) | 22 (43.1%) |
Disability Class: Ambulatory Difficulty
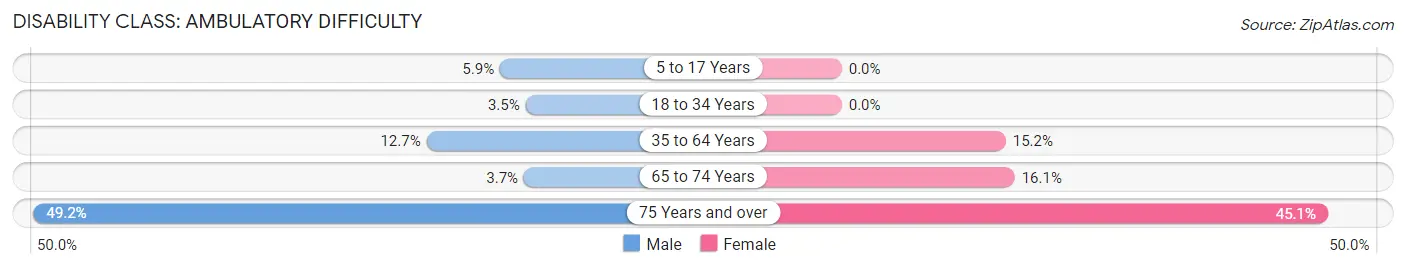
| Age Bracket | Male | Female |
| 5 to 17 Years | 6 (5.9%) | 0 (0.0%) |
| 18 to 34 Years | 8 (3.5%) | 0 (0.0%) |
| 35 to 64 Years | 31 (12.7%) | 42 (15.2%) |
| 65 to 74 Years | 3 (3.7%) | 13 (16.1%) |
| 75 Years and over | 30 (49.2%) | 23 (45.1%) |
Disability Class: Self-Care Difficulty
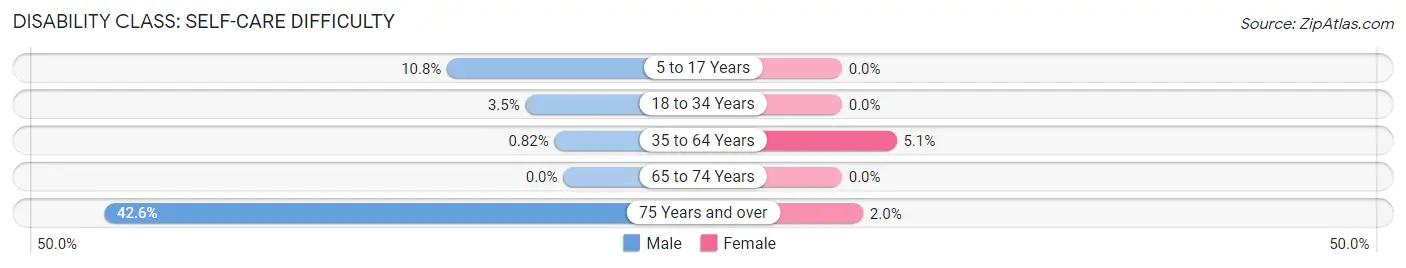
| Age Bracket | Male | Female |
| 5 to 17 Years | 11 (10.8%) | 0 (0.0%) |
| 18 to 34 Years | 8 (3.5%) | 0 (0.0%) |
| 35 to 64 Years | 2 (0.8%) | 14 (5.1%) |
| 65 to 74 Years | 0 (0.0%) | 0 (0.0%) |
| 75 Years and over | 26 (42.6%) | 1 (2.0%) |
Technology Access in Mount Vernon
Computing Device Access in Mount Vernon
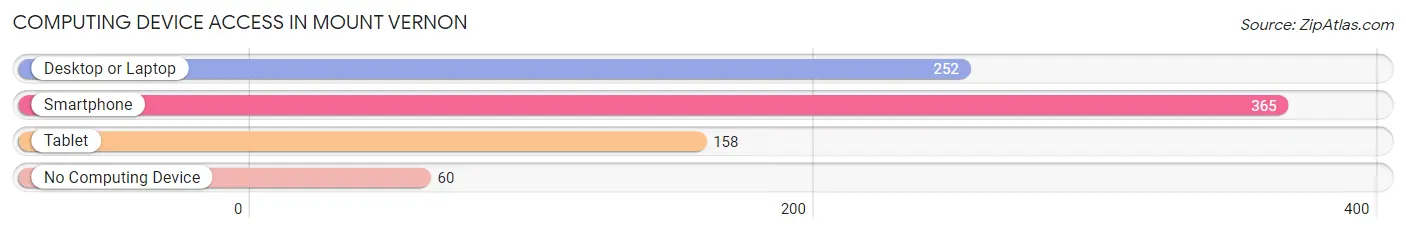
| Device Type | # Households | % Households |
| Desktop or Laptop | 252 | 55.9% |
| Smartphone | 365 | 80.9% |
| Tablet | 158 | 35.0% |
| No Computing Device | 60 | 13.3% |
| Total | 451 | 100.0% |
Internet Access in Mount Vernon
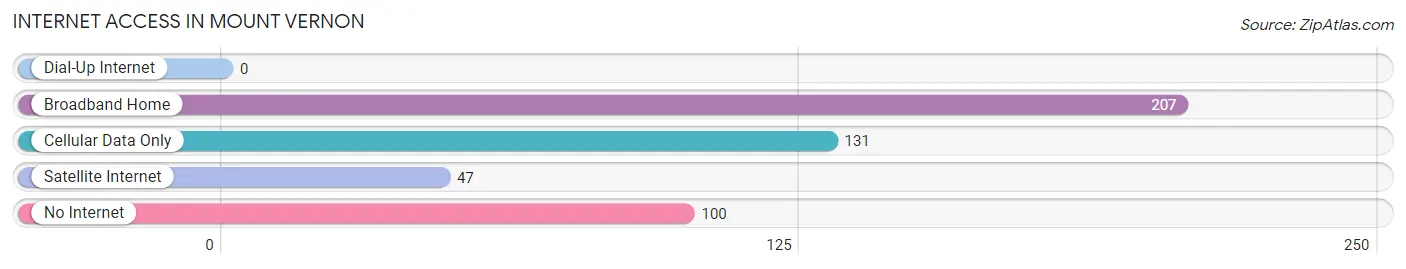
| Internet Type | # Households | % Households |
| Dial-Up Internet | 0 | 0.0% |
| Broadband Home | 207 | 45.9% |
| Cellular Data Only | 131 | 29.0% |
| Satellite Internet | 47 | 10.4% |
| No Internet | 100 | 22.2% |
| Total | 451 | 100.0% |
Mount Vernon Summary
Introduction
Mount Vernon, Alabama is a small town located in the northwest corner of the state, near the Mississippi border. It is part of the Mobile metropolitan area and is the county seat of Mobile County. The town has a population of just over 1,000 people and is known for its rural charm and friendly atmosphere. The town is home to a variety of businesses, including a few restaurants, a grocery store, and a few other small businesses. The town is also home to a few churches and a library.
History
Mount Vernon was founded in 1819 by settlers from the nearby town of Mobile. The town was named after the nearby Mount Vernon plantation, which was owned by the prominent local family of the same name. The town was incorporated in 1821 and quickly became a popular destination for travelers and settlers. The town was a major stop on the Mobile and Ohio Railroad, which connected Mobile to the rest of the country.
The town was also home to a number of prominent families, including the McGehees, who owned a large plantation in the area. The McGehees were influential in the development of the town and helped to establish a number of businesses, including a cotton gin and a sawmill.
The town was also home to a number of prominent churches, including the First Baptist Church of Mount Vernon, which was founded in 1822. The church is still active today and is one of the oldest churches in the state.
Geography
Mount Vernon is located in the northwest corner of Alabama, near the Mississippi border. The town is situated on the banks of the Tombigbee River and is surrounded by rolling hills and forests. The town is located about 25 miles south of Mobile and about 50 miles north of Pensacola, Florida.
The town is located in a humid subtropical climate zone, with hot summers and mild winters. The average temperature in the summer is around 90 degrees Fahrenheit, while the average temperature in the winter is around 50 degrees Fahrenheit. The town receives an average of about 50 inches of rain per year.
Economy
The economy of Mount Vernon is largely based on agriculture and forestry. The town is home to a number of farms, which produce a variety of crops, including cotton, corn, soybeans, and peanuts. The town is also home to a number of timber companies, which harvest timber from the surrounding forests.
The town is also home to a number of small businesses, including a few restaurants, a grocery store, and a few other small businesses. The town is also home to a few churches and a library.
Demographics
As of the 2010 census, the population of Mount Vernon was 1,072. The town is predominantly white, with about 90% of the population being white. The town is also home to a small African American population, with about 8% of the population being African American. The town is also home to a small Hispanic population, with about 2% of the population being Hispanic.
Conclusion
Mount Vernon, Alabama is a small town located in the northwest corner of the state, near the Mississippi border. The town has a population of just over 1,000 people and is known for its rural charm and friendly atmosphere. The town is home to a variety of businesses, including a few restaurants, a grocery store, and a few other small businesses. The town is also home to a few churches and a library. The economy of Mount Vernon is largely based on agriculture and forestry, and the town is predominantly white, with about 90% of the population being white.
Common Questions
What is Per Capita Income in Mount Vernon?
Per Capita income in Mount Vernon is $25,465.
What is the Median Family Income in Mount Vernon?
Median Family Income in Mount Vernon is $53,095.
What is the Median Household income in Mount Vernon?
Median Household Income in Mount Vernon is $41,164.
What is Income or Wage Gap in Mount Vernon?
Income or Wage Gap in Mount Vernon is 53.8%.
Women in Mount Vernon earn 46.2 cents for every dollar earned by a man.
What is Inequality or Gini Index in Mount Vernon?
Inequality or Gini Index in Mount Vernon is 0.52.
What is the Total Population of Mount Vernon?
Total Population of Mount Vernon is 1,463.
What is the Total Male Population of Mount Vernon?
Total Male Population of Mount Vernon is 793.
What is the Total Female Population of Mount Vernon?
Total Female Population of Mount Vernon is 670.
What is the Ratio of Males per 100 Females in Mount Vernon?
There are 118.36 Males per 100 Females in Mount Vernon.
What is the Ratio of Females per 100 Males in Mount Vernon?
There are 84.49 Females per 100 Males in Mount Vernon.
What is the Median Population Age in Mount Vernon?
Median Population Age in Mount Vernon is 39.6 Years.
What is the Average Family Size in Mount Vernon
Average Family Size in Mount Vernon is 3.5 People.
What is the Average Household Size in Mount Vernon
Average Household Size in Mount Vernon is 3.1 People.
How Large is the Labor Force in Mount Vernon?
There are 610 People in the Labor Forcein in Mount Vernon.
What is the Percentage of People in the Labor Force in Mount Vernon?
48.9% of People are in the Labor Force in Mount Vernon.
What is the Unemployment Rate in Mount Vernon?
Unemployment Rate in Mount Vernon is 0.8%.