Millerville, AL Map & Demographics
Millerville Map
Millerville Overview
$25,847
PER CAPITA INCOME
$95,313
AVG FAMILY INCOME
$81,875
AVG HOUSEHOLD INCOME
0.26
INEQUALITY / GINI INDEX
473
TOTAL POPULATION
268
MALE POPULATION
205
FEMALE POPULATION
130.73
MALES / 100 FEMALES
76.49
FEMALES / 100 MALES
40.0
MEDIAN AGE
4.3
AVG FAMILY SIZE
3.2
AVG HOUSEHOLD SIZE
174
LABOR FORCE [ PEOPLE ]
52.4%
PERCENT IN LABOR FORCE
Millerville Zip Codes
Millerville Area Codes
Income in Millerville
Income Overview in Millerville
Per Capita Income in Millerville is $25,847, while median incomes of families and households are $95,313 and $81,875 respectively.
| Characteristic | Number | Measure |
| Per Capita Income | 473 | $25,847 |
| Median Family Income | 100 | $95,313 |
| Mean Family Income | 100 | $99,993 |
| Median Household Income | 147 | $81,875 |
| Mean Household Income | 147 | $79,921 |
| Income Deficit | 100 | $0 |
| Wage / Income Gap (%) | 473 | 0.00% |
| Wage / Income Gap ($) | 473 | 100.00¢ per $1 |
| Gini / Inequality Index | 473 | 0.26 |
Earnings by Sex in Millerville
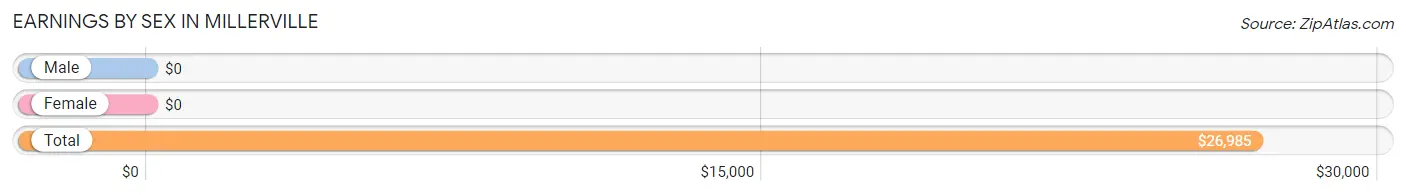
| Sex | Number | Average Earnings |
| Male | 101 (41.7%) | $0 |
| Female | 141 (58.3%) | $0 |
| Total | 242 (100.0%) | $26,985 |
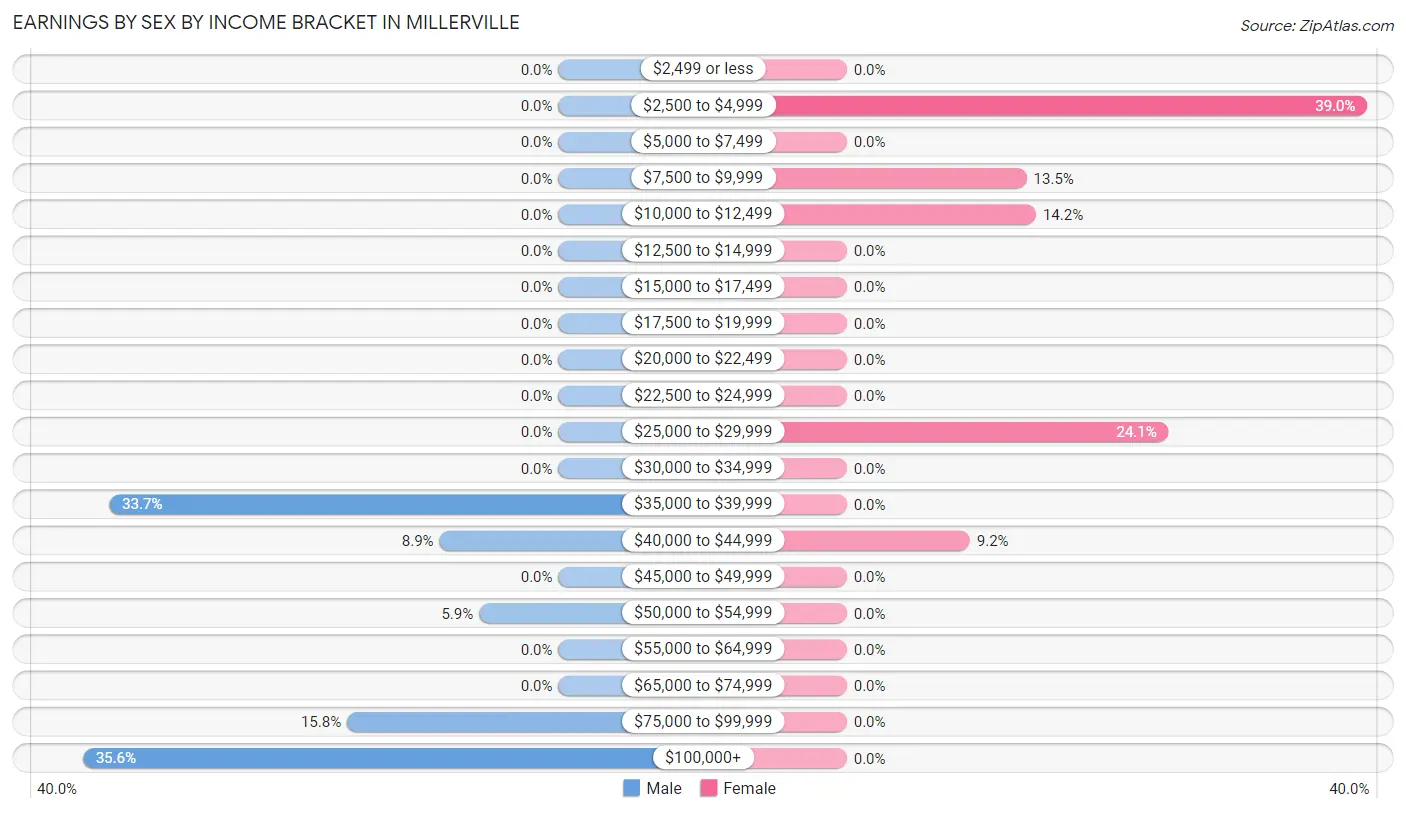
Earnings by Sex by Income Bracket in Millerville
The most common earnings brackets in Millerville are $100,000+ for men (36 | 35.6%) and $2,500 to $4,999 for women (55 | 39.0%).
| Income | Male | Female |
| $2,499 or less | 0 (0.0%) | 0 (0.0%) |
| $2,500 to $4,999 | 0 (0.0%) | 55 (39.0%) |
| $5,000 to $7,499 | 0 (0.0%) | 0 (0.0%) |
| $7,500 to $9,999 | 0 (0.0%) | 19 (13.5%) |
| $10,000 to $12,499 | 0 (0.0%) | 20 (14.2%) |
| $12,500 to $14,999 | 0 (0.0%) | 0 (0.0%) |
| $15,000 to $17,499 | 0 (0.0%) | 0 (0.0%) |
| $17,500 to $19,999 | 0 (0.0%) | 0 (0.0%) |
| $20,000 to $22,499 | 0 (0.0%) | 0 (0.0%) |
| $22,500 to $24,999 | 0 (0.0%) | 0 (0.0%) |
| $25,000 to $29,999 | 0 (0.0%) | 34 (24.1%) |
| $30,000 to $34,999 | 0 (0.0%) | 0 (0.0%) |
| $35,000 to $39,999 | 34 (33.7%) | 0 (0.0%) |
| $40,000 to $44,999 | 9 (8.9%) | 13 (9.2%) |
| $45,000 to $49,999 | 0 (0.0%) | 0 (0.0%) |
| $50,000 to $54,999 | 6 (5.9%) | 0 (0.0%) |
| $55,000 to $64,999 | 0 (0.0%) | 0 (0.0%) |
| $65,000 to $74,999 | 0 (0.0%) | 0 (0.0%) |
| $75,000 to $99,999 | 16 (15.8%) | 0 (0.0%) |
| $100,000+ | 36 (35.6%) | 0 (0.0%) |
| Total | 101 (100.0%) | 141 (100.0%) |
Earnings by Sex by Educational Attainment in Millerville
| Educational Attainment | Male Income | Female Income |
| Less than High School | - | - |
| High School Diploma | - | - |
| College or Associate's Degree | - | - |
| Bachelor's Degree | - | - |
| Graduate Degree | - | - |
| Total | - | - |
Family Income in Millerville
Family Income Brackets in Millerville
According to the Millerville family income data, there are 42 families falling into the $75,000 to $99,999 income range, which is the most common income bracket and makes up 42.0% of all families.
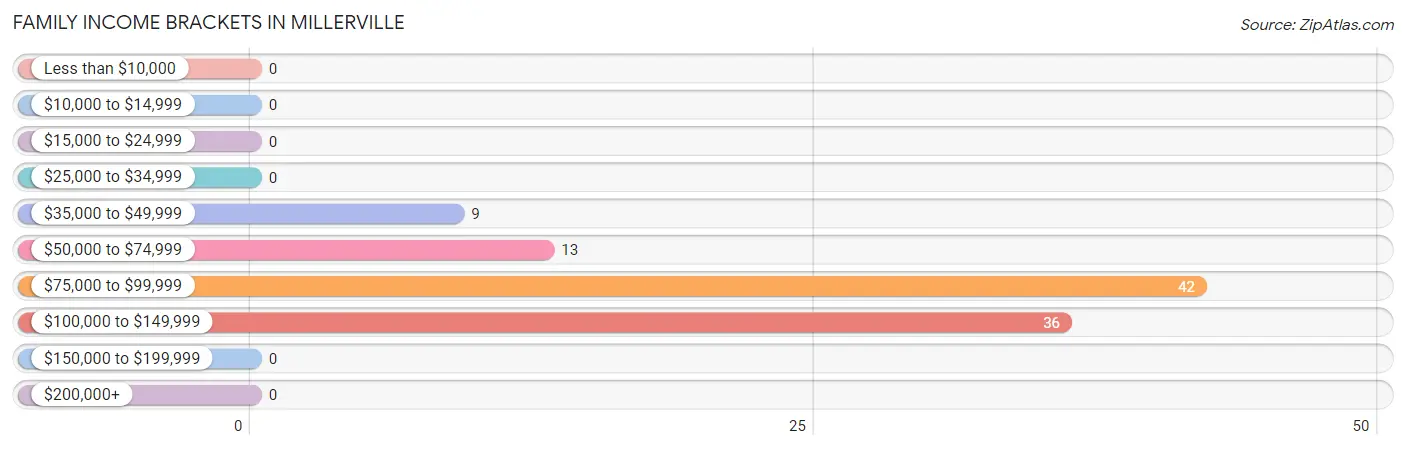
| Income Bracket | # Families | % Families |
| Less than $10,000 | 0 | 0.0% |
| $10,000 to $14,999 | 0 | 0.0% |
| $15,000 to $24,999 | 0 | 0.0% |
| $25,000 to $34,999 | 0 | 0.0% |
| $35,000 to $49,999 | 9 | 9.0% |
| $50,000 to $74,999 | 13 | 13.0% |
| $75,000 to $99,999 | 42 | 42.0% |
| $100,000 to $149,999 | 36 | 36.0% |
| $150,000 to $199,999 | 0 | 0.0% |
| $200,000+ | 0 | 0.0% |
Family Income by Famaliy Size in Millerville
2-person families (78 | 78.0%) account for the highest median family income in Millerville with $89,625 per family, while 2-person families (78 | 78.0%) have the highest median income of $44,812 per family member.
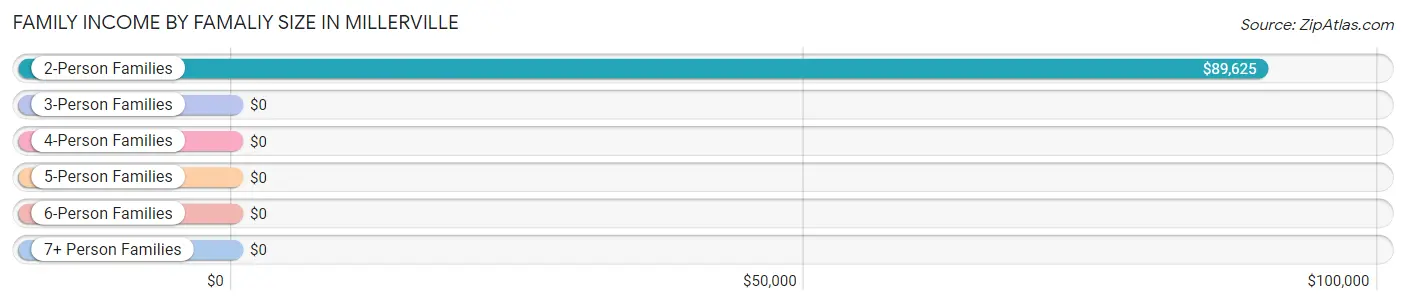
| Income Bracket | # Families | Median Income |
| 2-Person Families | 78 (78.0%) | $89,625 |
| 3-Person Families | 0 (0.0%) | $0 |
| 4-Person Families | 0 (0.0%) | $0 |
| 5-Person Families | 0 (0.0%) | $0 |
| 6-Person Families | 6 (6.0%) | $0 |
| 7+ Person Families | 16 (16.0%) | $0 |
| Total | 100 (100.0%) | $95,313 |
Family Income by Number of Earners in Millerville
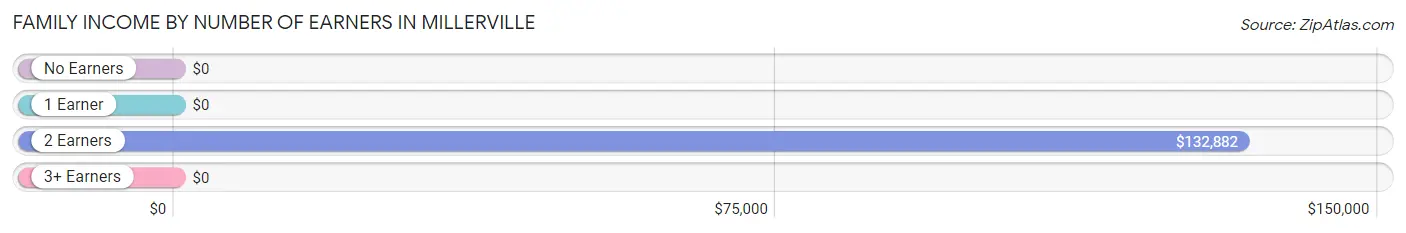
| Number of Earners | # Families | Median Income |
| No Earners | 20 (20.0%) | $0 |
| 1 Earner | 13 (13.0%) | $0 |
| 2 Earners | 61 (61.0%) | $132,882 |
| 3+ Earners | 6 (6.0%) | $0 |
| Total | 100 (100.0%) | $95,313 |
Household Income in Millerville
Household Income Brackets in Millerville
With 56 households falling in the category, the $35,000 to $49,999 income range is the most frequent in Millerville, accounting for 38.1% of all households.
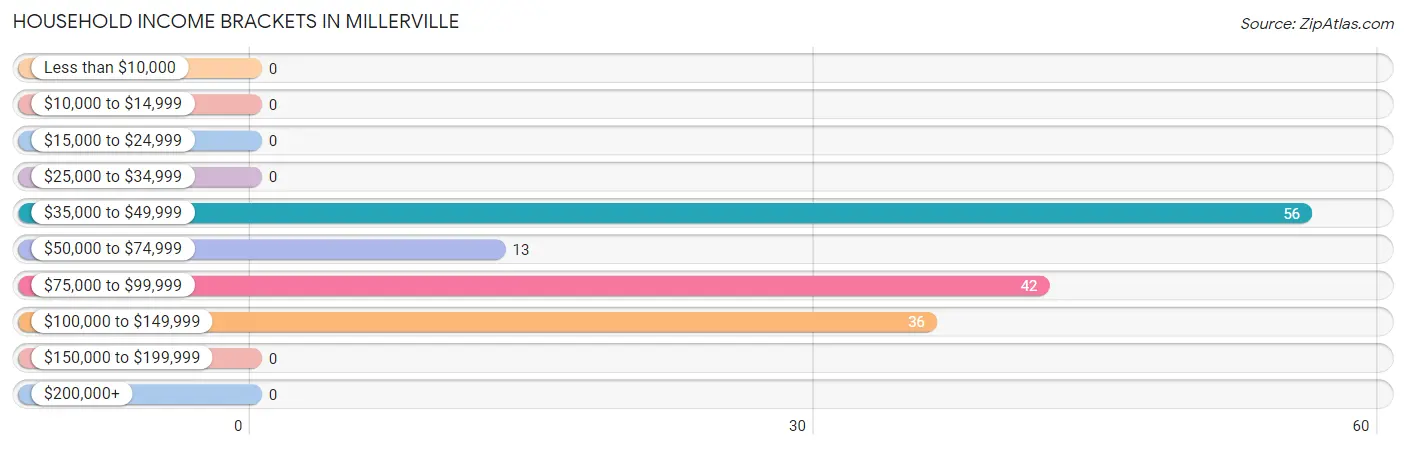
| Income Bracket | # Households | % Households |
| Less than $10,000 | 0 | 0.0% |
| $10,000 to $14,999 | 0 | 0.0% |
| $15,000 to $24,999 | 0 | 0.0% |
| $25,000 to $34,999 | 0 | 0.0% |
| $35,000 to $49,999 | 56 | 38.1% |
| $50,000 to $74,999 | 13 | 8.8% |
| $75,000 to $99,999 | 42 | 28.6% |
| $100,000 to $149,999 | 36 | 24.5% |
| $150,000 to $199,999 | 0 | 0.0% |
| $200,000+ | 0 | 0.0% |
Household Income by Householder Age in Millerville
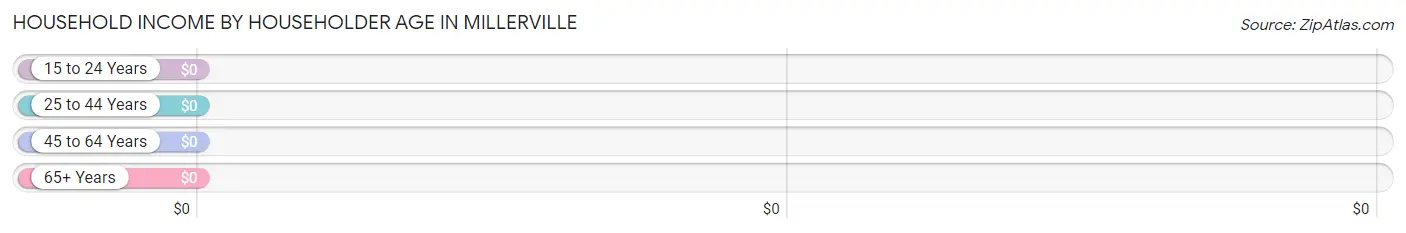
| Income Bracket | # Households | Median Income |
| 15 to 24 Years | 0 (0.0%) | $0 |
| 25 to 44 Years | 22 (15.0%) | $0 |
| 45 to 64 Years | 105 (71.4%) | $0 |
| 65+ Years | 20 (13.6%) | $0 |
| Total | 147 (100.0%) | $81,875 |
Poverty in Millerville
Income Below Poverty by Sex and Age in Millerville
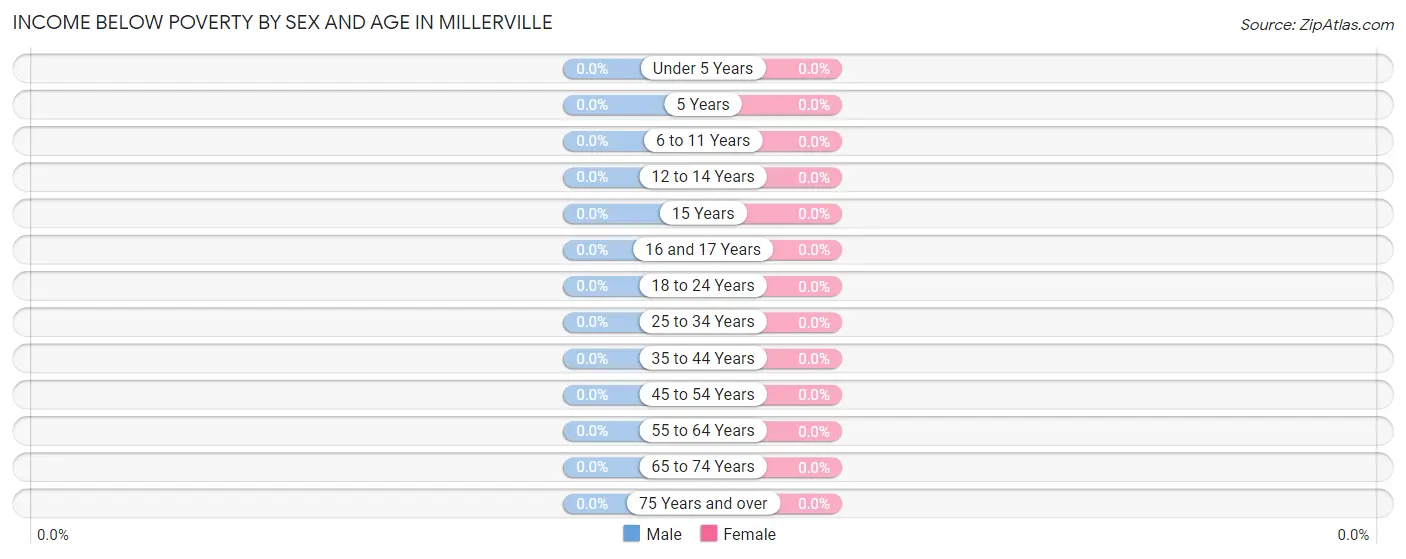
| Age Bracket | Male | Female |
| Under 5 Years | 0 (0.0%) | 0 (0.0%) |
| 5 Years | 0 (0.0%) | 0 (0.0%) |
| 6 to 11 Years | 0 (0.0%) | 0 (0.0%) |
| 12 to 14 Years | 0 (0.0%) | 0 (0.0%) |
| 15 Years | 0 (0.0%) | 0 (0.0%) |
| 16 and 17 Years | 0 (0.0%) | 0 (0.0%) |
| 18 to 24 Years | 0 (0.0%) | 0 (0.0%) |
| 25 to 34 Years | 0 (0.0%) | 0 (0.0%) |
| 35 to 44 Years | 0 (0.0%) | 0 (0.0%) |
| 45 to 54 Years | 0 (0.0%) | 0 (0.0%) |
| 55 to 64 Years | 0 (0.0%) | 0 (0.0%) |
| 65 to 74 Years | 0 (0.0%) | 0 (0.0%) |
| 75 Years and over | 0 (0.0%) | 0 (0.0%) |
| Total | 0 (0.0%) | 0 (0.0%) |
Income Above Poverty by Sex and Age in Millerville
According to the poverty statistics in Millerville, males aged under 5 years and females aged 12 to 14 years are the age groups that are most secure financially, with 100.0% of males and 100.0% of females in these age groups living above the poverty line.
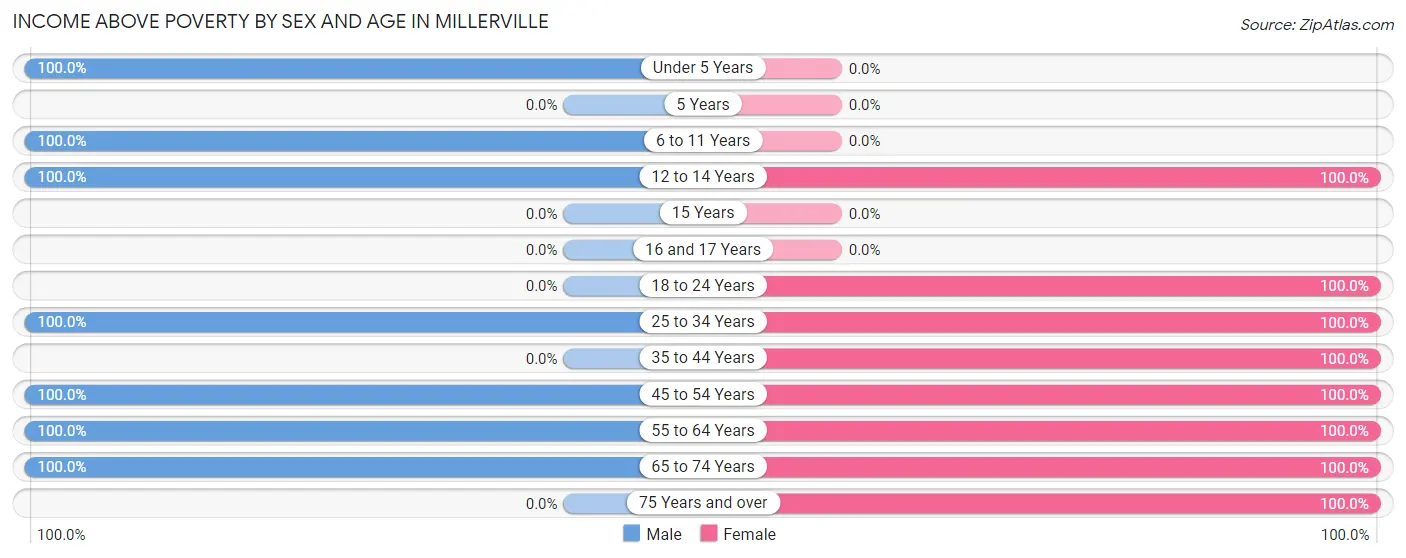
| Age Bracket | Male | Female |
| Under 5 Years | 68 (100.0%) | 0 (0.0%) |
| 5 Years | 0 (0.0%) | 0 (0.0%) |
| 6 to 11 Years | 52 (100.0%) | 0 (0.0%) |
| 12 to 14 Years | 13 (100.0%) | 8 (100.0%) |
| 15 Years | 0 (0.0%) | 0 (0.0%) |
| 16 and 17 Years | 0 (0.0%) | 0 (0.0%) |
| 18 to 24 Years | 0 (0.0%) | 6 (100.0%) |
| 25 to 34 Years | 23 (100.0%) | 66 (100.0%) |
| 35 to 44 Years | 0 (0.0%) | 31 (100.0%) |
| 45 to 54 Years | 50 (100.0%) | 9 (100.0%) |
| 55 to 64 Years | 42 (100.0%) | 47 (100.0%) |
| 65 to 74 Years | 20 (100.0%) | 15 (100.0%) |
| 75 Years and over | 0 (0.0%) | 23 (100.0%) |
| Total | 268 (100.0%) | 205 (100.0%) |
Income Below Poverty Among Married-Couple Families in Millerville
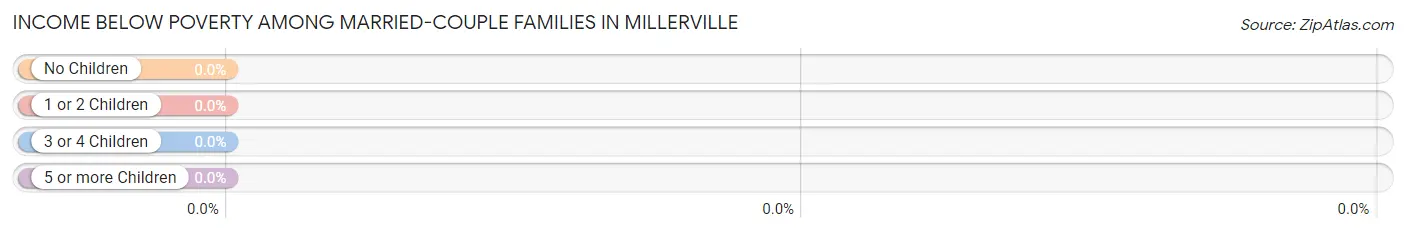
| Children | Above Poverty | Below Poverty |
| No Children | 65 (100.0%) | 0 (0.0%) |
| 1 or 2 Children | 6 (100.0%) | 0 (0.0%) |
| 3 or 4 Children | 0 (0.0%) | 0 (0.0%) |
| 5 or more Children | 16 (100.0%) | 0 (0.0%) |
| Total | 87 (100.0%) | 0 (0.0%) |
Income Below Poverty Among Single-Parent Households in Millerville
| Children | Single Father | Single Mother |
| No Children | 0 (0.0%) | 0 (0.0%) |
| 1 or 2 Children | 0 (0.0%) | 0 (0.0%) |
| 3 or 4 Children | 0 (0.0%) | 0 (0.0%) |
| 5 or more Children | 0 (0.0%) | 0 (0.0%) |
| Total | 0 (0.0%) | 0 (0.0%) |
Income Below Poverty Among Married-Couple vs Single-Parent Households in Millerville
| Children | Married-Couple Families | Single-Parent Households |
| No Children | 0 (0.0%) | 0 (0.0%) |
| 1 or 2 Children | 0 (0.0%) | 0 (0.0%) |
| 3 or 4 Children | 0 (0.0%) | 0 (0.0%) |
| 5 or more Children | 0 (0.0%) | 0 (0.0%) |
| Total | 0 (0.0%) | 0 (0.0%) |
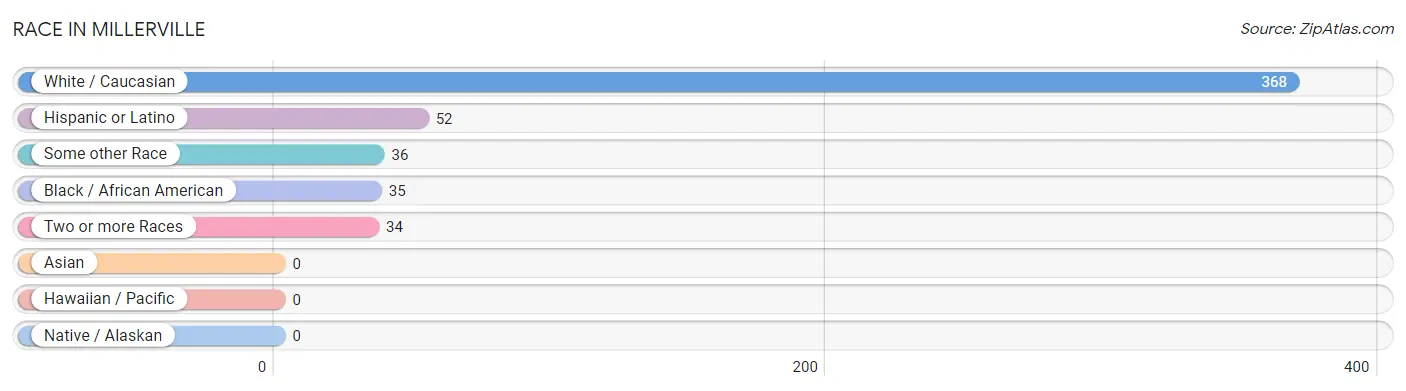
Race in Millerville
The most populous races in Millerville are White / Caucasian (368 | 77.8%), Hispanic or Latino (52 | 11.0%), and Some other Race (36 | 7.6%).
| Race | # Population | % Population |
| Asian | 0 | 0.0% |
| Black / African American | 35 | 7.4% |
| Hawaiian / Pacific | 0 | 0.0% |
| Hispanic or Latino | 52 | 11.0% |
| Native / Alaskan | 0 | 0.0% |
| White / Caucasian | 368 | 77.8% |
| Two or more Races | 34 | 7.2% |
| Some other Race | 36 | 7.6% |
| Total | 473 | 100.0% |
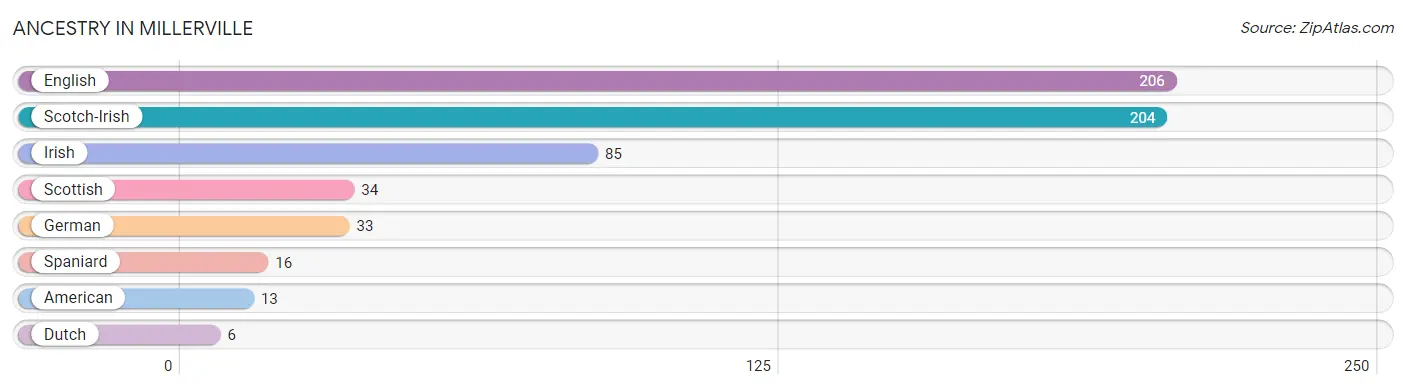
Ancestry in Millerville
The most populous ancestries reported in Millerville are English (206 | 43.5%), Scotch-Irish (204 | 43.1%), Irish (85 | 18.0%), Scottish (34 | 7.2%), and German (33 | 7.0%), together accounting for 118.8% of all Millerville residents.
| Ancestry | # Population | % Population |
| American | 13 | 2.8% |
| Dutch | 6 | 1.3% |
| English | 206 | 43.5% |
| German | 33 | 7.0% |
| Irish | 85 | 18.0% |
| Scotch-Irish | 204 | 43.1% |
| Scottish | 34 | 7.2% |
| Spaniard | 16 | 3.4% | View All 8 Rows |
Immigrants in Millerville

| Immigration Origin | # Population | % Population | View All 0 Rows |
Sex and Age in Millerville
Sex and Age in Millerville
The most populous age groups in Millerville are Under 5 Years (68 | 25.4%) for men and 25 to 29 Years (66 | 32.2%) for women.
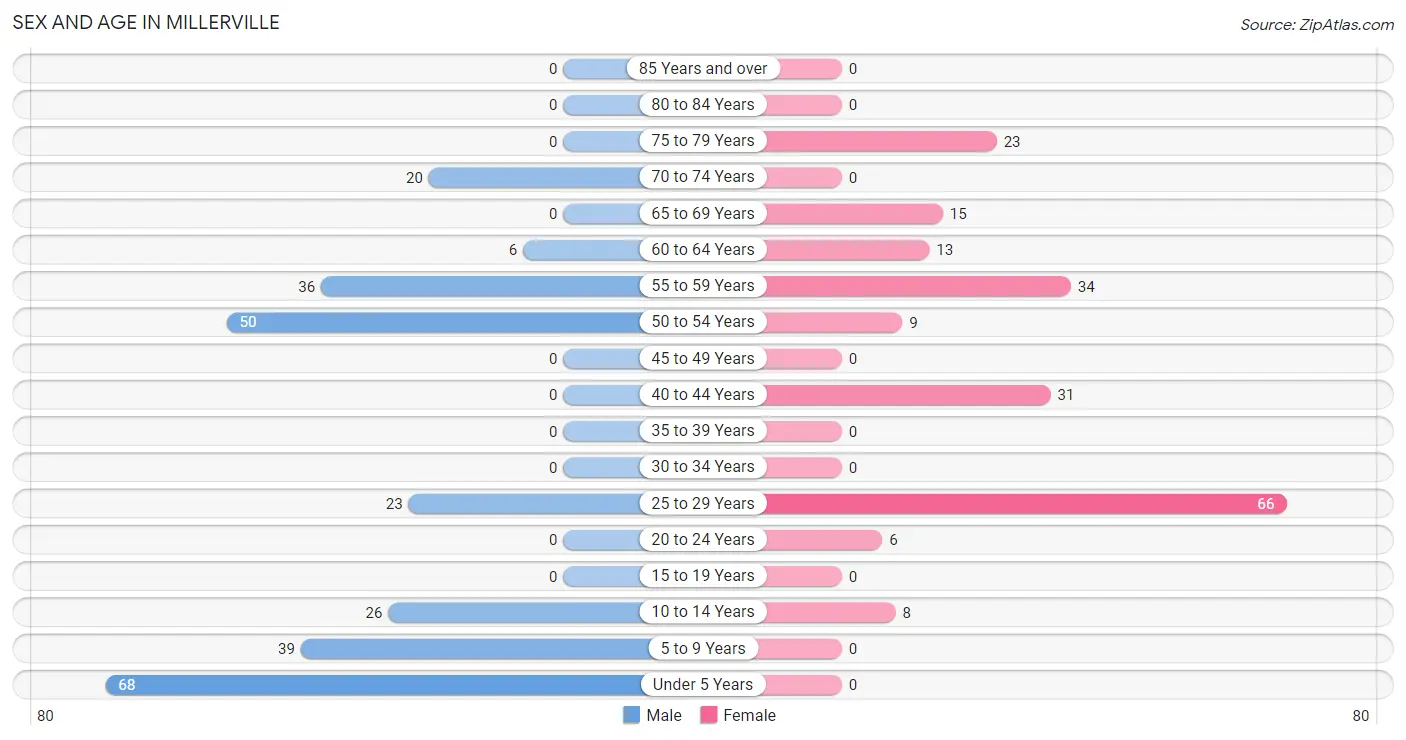
| Age Bracket | Male | Female |
| Under 5 Years | 68 (25.4%) | 0 (0.0%) |
| 5 to 9 Years | 39 (14.5%) | 0 (0.0%) |
| 10 to 14 Years | 26 (9.7%) | 8 (3.9%) |
| 15 to 19 Years | 0 (0.0%) | 0 (0.0%) |
| 20 to 24 Years | 0 (0.0%) | 6 (2.9%) |
| 25 to 29 Years | 23 (8.6%) | 66 (32.2%) |
| 30 to 34 Years | 0 (0.0%) | 0 (0.0%) |
| 35 to 39 Years | 0 (0.0%) | 0 (0.0%) |
| 40 to 44 Years | 0 (0.0%) | 31 (15.1%) |
| 45 to 49 Years | 0 (0.0%) | 0 (0.0%) |
| 50 to 54 Years | 50 (18.7%) | 9 (4.4%) |
| 55 to 59 Years | 36 (13.4%) | 34 (16.6%) |
| 60 to 64 Years | 6 (2.2%) | 13 (6.3%) |
| 65 to 69 Years | 0 (0.0%) | 15 (7.3%) |
| 70 to 74 Years | 20 (7.5%) | 0 (0.0%) |
| 75 to 79 Years | 0 (0.0%) | 23 (11.2%) |
| 80 to 84 Years | 0 (0.0%) | 0 (0.0%) |
| 85 Years and over | 0 (0.0%) | 0 (0.0%) |
| Total | 268 (100.0%) | 205 (100.0%) |
Families and Households in Millerville
Median Family Size in Millerville
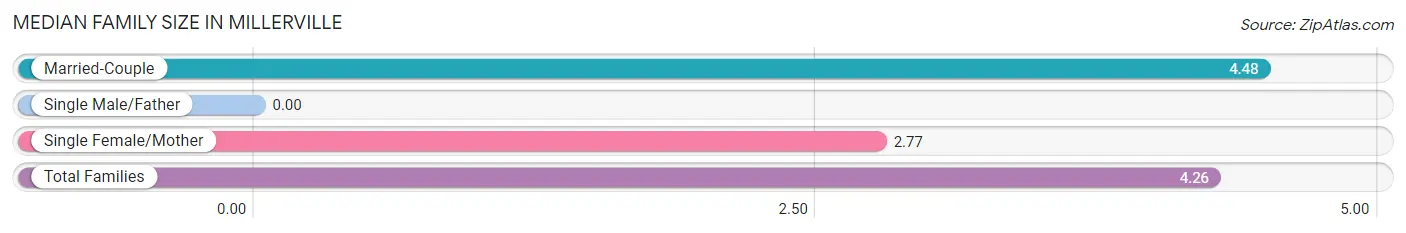
| Family Type | # Families | Family Size |
| Married-Couple | 87 (87.0%) | 4.48 |
| Single Male/Father | 0 (0.0%) | - |
| Single Female/Mother | 13 (13.0%) | 2.77 |
| Total Families | 100 (100.0%) | 4.26 |
Median Household Size in Millerville
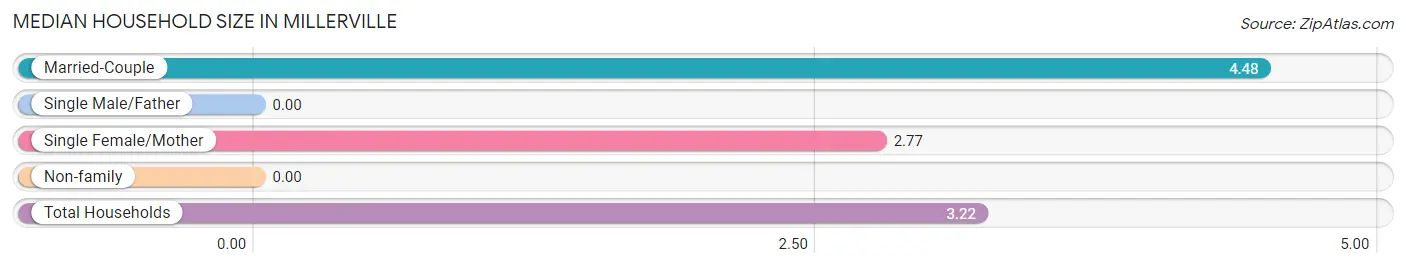
| Household Type | # Households | Household Size |
| Married-Couple | 87 (59.2%) | 4.48 |
| Single Male/Father | 0 (0.0%) | - |
| Single Female/Mother | 13 (8.8%) | 2.77 |
| Non-family | 47 (32.0%) | - |
| Total Households | 147 (100.0%) | 3.22 |
Household Size by Marriage Status in Millerville
Out of a total of 147 households in Millerville, 100 (68.0%) are family households, while 47 (32.0%) are nonfamily households. The most numerous type of family households are 2-person households, comprising 78, and the most common type of nonfamily households are 1-person households, comprising 47.
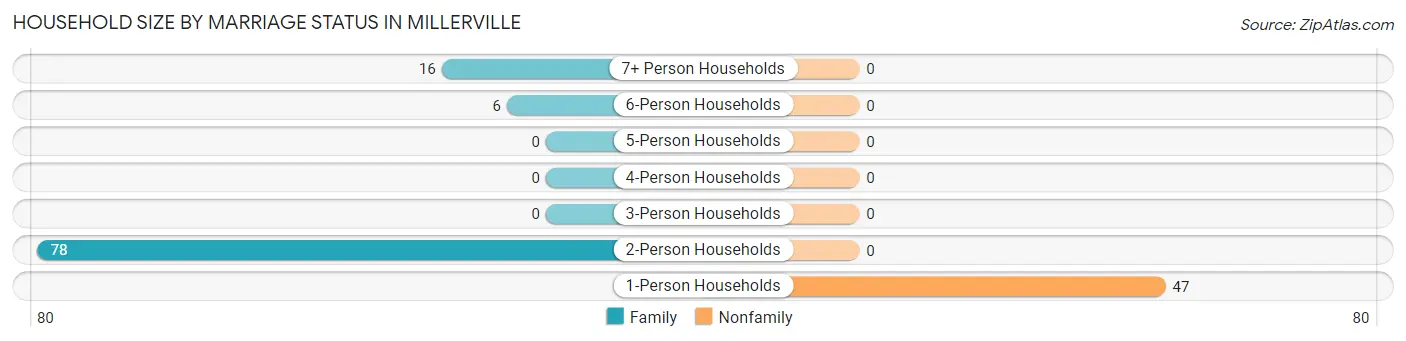
| Household Size | Family Households | Nonfamily Households |
| 1-Person Households | - | 47 (32.0%) |
| 2-Person Households | 78 (53.1%) | 0 (0.0%) |
| 3-Person Households | 0 (0.0%) | 0 (0.0%) |
| 4-Person Households | 0 (0.0%) | 0 (0.0%) |
| 5-Person Households | 0 (0.0%) | 0 (0.0%) |
| 6-Person Households | 6 (4.1%) | 0 (0.0%) |
| 7+ Person Households | 16 (10.9%) | 0 (0.0%) |
| Total | 100 (68.0%) | 47 (32.0%) |
Female Fertility in Millerville
Fertility by Age in Millerville
Average fertility rate in Millerville is 175.0 births per 1,000 women. Women in the age bracket of 35 to 50 years have the highest fertility rate with 581.0 births per 1,000 women. Women in the age bracket of 35 to 50 years acount for 100.0% of all women with births.
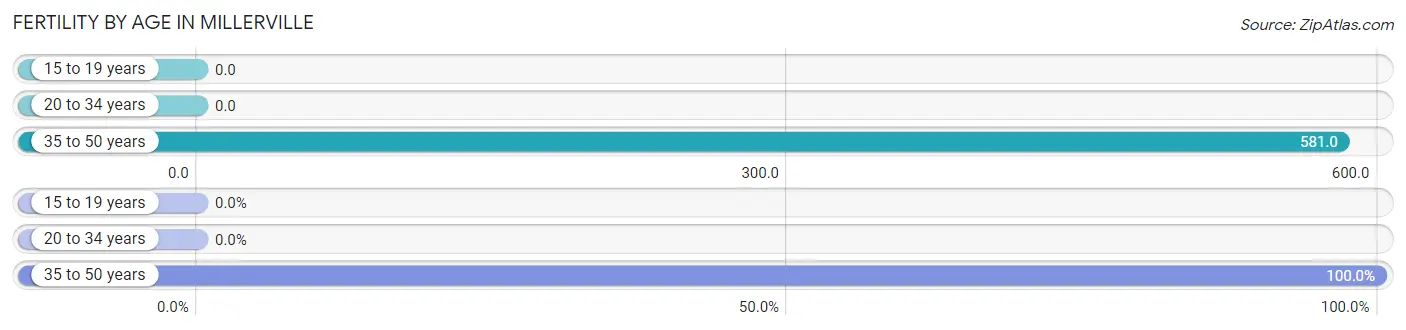
| Age Bracket | Women with Births | Births / 1,000 Women |
| 15 to 19 years | 0 (0.0%) | 0.0 |
| 20 to 34 years | 0 (0.0%) | 0.0 |
| 35 to 50 years | 18 (100.0%) | 581.0 |
| Total | 18 (100.0%) | 175.0 |
Fertility by Age by Marriage Status in Millerville
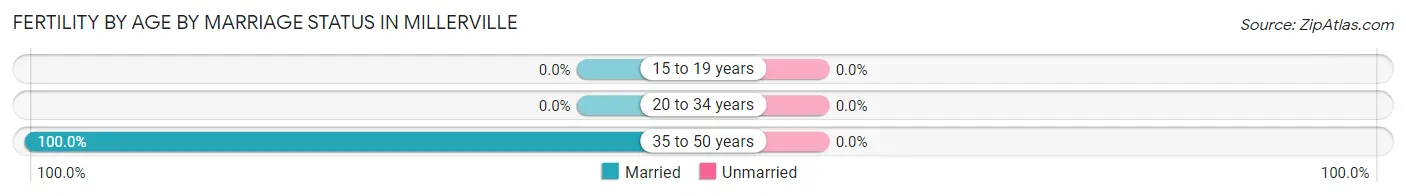
| Age Bracket | Married | Unmarried |
| 15 to 19 years | 0 (0.0%) | 0 (0.0%) |
| 20 to 34 years | 0 (0.0%) | 0 (0.0%) |
| 35 to 50 years | 18 (100.0%) | 0 (0.0%) |
| Total | 18 (100.0%) | 0 (0.0%) |
Fertility by Education in Millerville
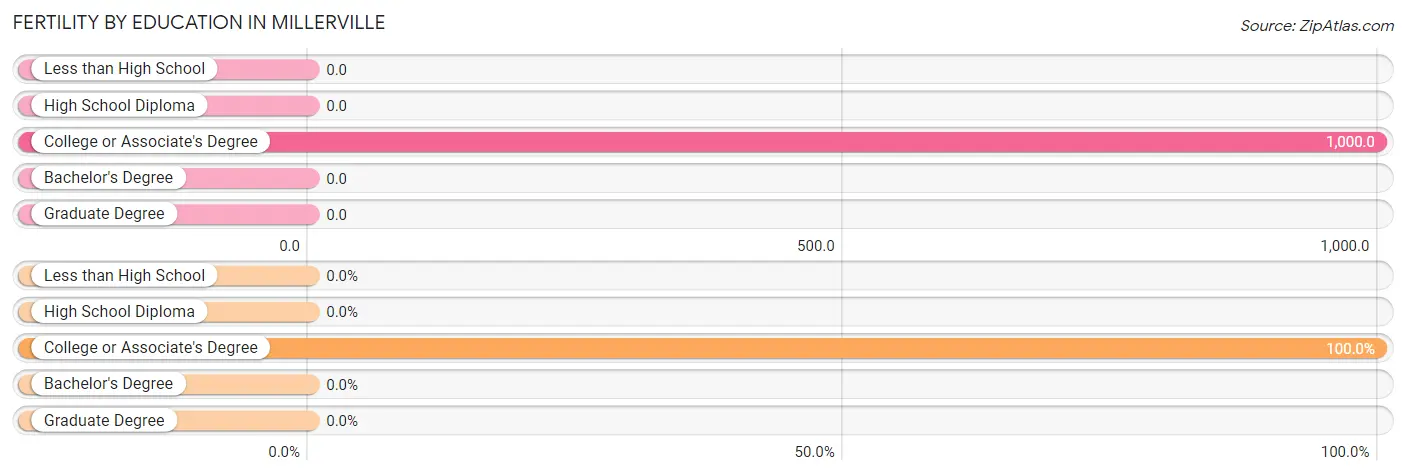
| Educational Attainment | Women with Births | Births / 1,000 Women |
| Less than High School | 0 (0.0%) | 0.0 |
| High School Diploma | 0 (0.0%) | 0.0 |
| College or Associate's Degree | 18 (100.0%) | 1,000.0 |
| Bachelor's Degree | 0 (0.0%) | 0.0 |
| Graduate Degree | 0 (0.0%) | 0.0 |
| Total | 18 (100.0%) | 175.0 |
Fertility by Education by Marriage Status in Millerville
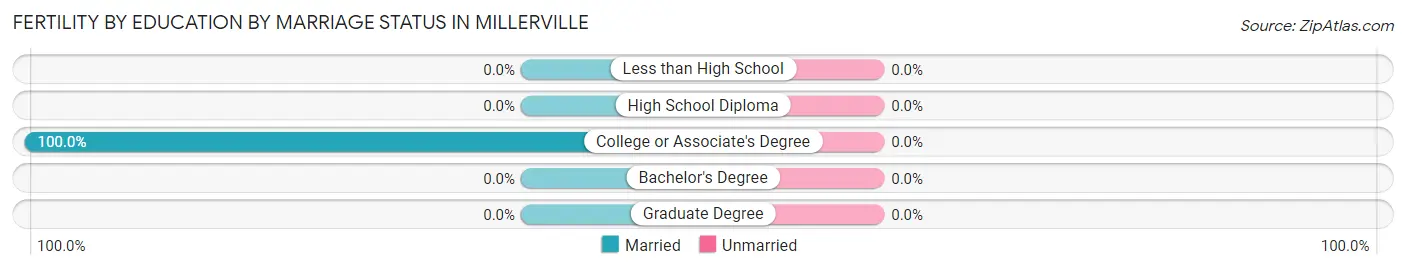
| Educational Attainment | Married | Unmarried |
| Less than High School | 0 (0.0%) | 0 (0.0%) |
| High School Diploma | 0 (0.0%) | 0 (0.0%) |
| College or Associate's Degree | 18 (100.0%) | 0 (0.0%) |
| Bachelor's Degree | 0 (0.0%) | 0 (0.0%) |
| Graduate Degree | 0 (0.0%) | 0 (0.0%) |
| Total | 18 (100.0%) | 0 (0.0%) |
Employment Characteristics in Millerville
Employment by Class of Employer in Millerville
Among the 174 employed individuals in Millerville, private company employees (98 | 56.3%), not-for-profit organizations (45 | 25.9%), and federal government employees (16 | 9.2%) make up the most common classes of employment.
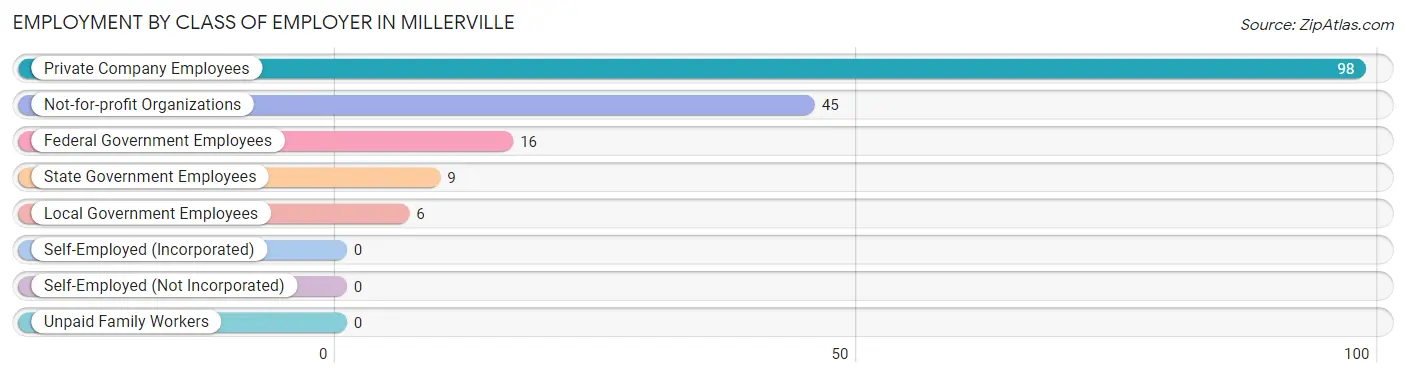
| Employer Class | # Employees | % Employees |
| Private Company Employees | 98 | 56.3% |
| Self-Employed (Incorporated) | 0 | 0.0% |
| Self-Employed (Not Incorporated) | 0 | 0.0% |
| Not-for-profit Organizations | 45 | 25.9% |
| Local Government Employees | 6 | 3.5% |
| State Government Employees | 9 | 5.2% |
| Federal Government Employees | 16 | 9.2% |
| Unpaid Family Workers | 0 | 0.0% |
| Total | 174 | 100.0% |
Employment Status by Age in Millerville
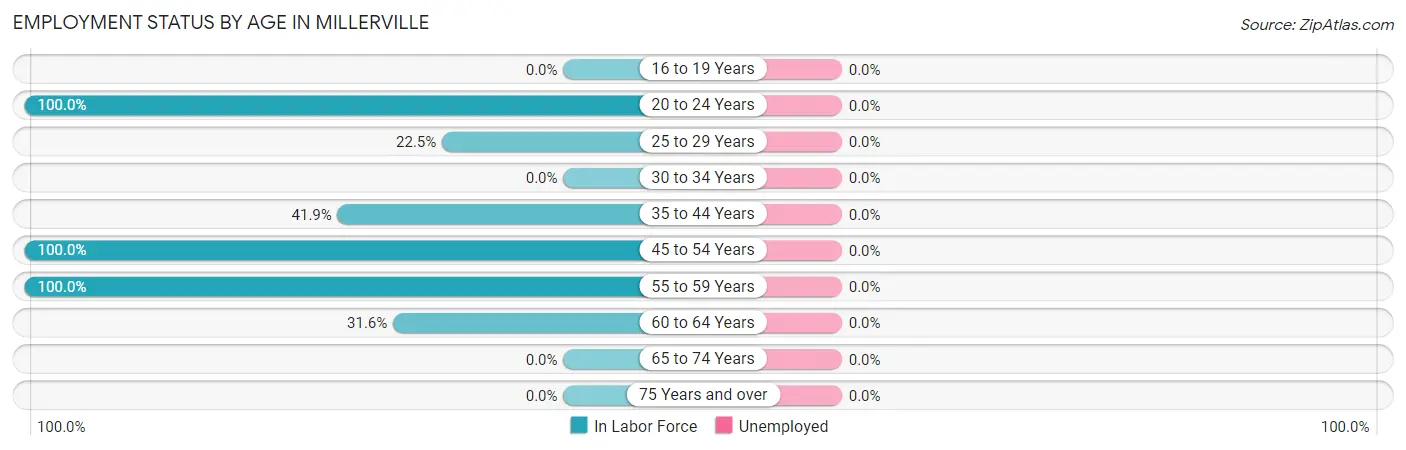
| Age Bracket | In Labor Force | Unemployed |
| 16 to 19 Years | 0 (0.0%) | 0 (0.0%) |
| 20 to 24 Years | 6 (100.0%) | 0 (0.0%) |
| 25 to 29 Years | 20 (22.5%) | 0 (0.0%) |
| 30 to 34 Years | 0 (0.0%) | 0 (0.0%) |
| 35 to 44 Years | 13 (41.9%) | 0 (0.0%) |
| 45 to 54 Years | 59 (100.0%) | 0 (0.0%) |
| 55 to 59 Years | 70 (100.0%) | 0 (0.0%) |
| 60 to 64 Years | 6 (31.6%) | 0 (0.0%) |
| 65 to 74 Years | 0 (0.0%) | 0 (0.0%) |
| 75 Years and over | 0 (0.0%) | 0 (0.0%) |
| Total | 174 (52.4%) | 0 (0.0%) |
Employment Status by Educational Attainment in Millerville
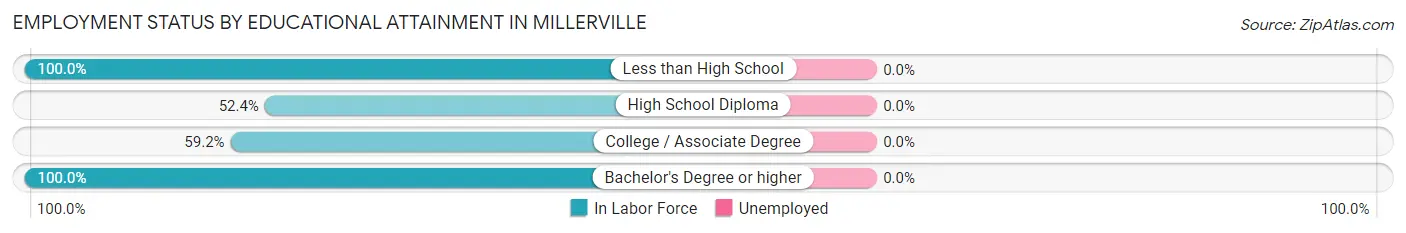
| Educational Attainment | In Labor Force | Unemployed |
| Less than High School | 13 (100.0%) | 0 (0.0%) |
| High School Diploma | 76 (52.4%) | 0 (0.0%) |
| College / Associate Degree | 45 (59.2%) | 0 (0.0%) |
| Bachelor's Degree or higher | 34 (100.0%) | 0 (0.0%) |
| Total | 168 (62.7%) | 0 (0.0%) |
Employment Occupations by Sex in Millerville
Management, Business, Science and Arts Occupations
The most common Management, Business, Science and Arts occupations in Millerville are Management (49 | 28.2%), Community & Social Service (40 | 23.0%), Education, Arts & Media (34 | 19.5%), and Education Instruction & Library (6 | 3.5%).
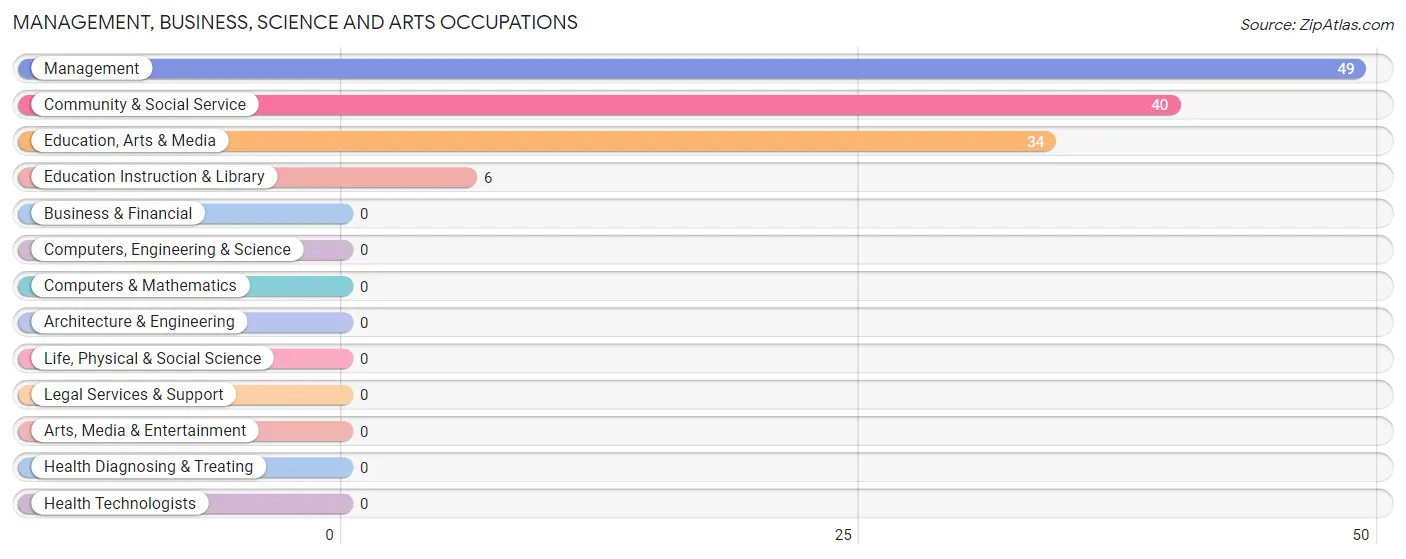
Management, Business, Science and Arts Occupations by Sex
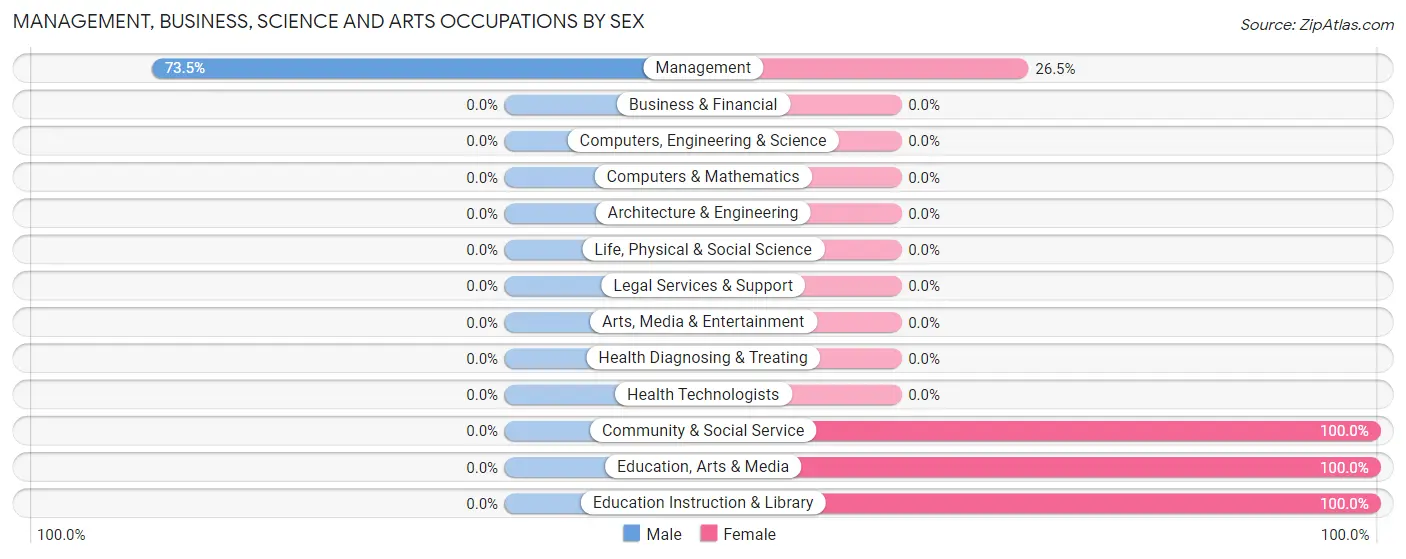
| Occupation | Male | Female |
| Management | 36 (73.5%) | 13 (26.5%) |
| Business & Financial | 0 (0.0%) | 0 (0.0%) |
| Computers, Engineering & Science | 0 (0.0%) | 0 (0.0%) |
| Computers & Mathematics | 0 (0.0%) | 0 (0.0%) |
| Architecture & Engineering | 0 (0.0%) | 0 (0.0%) |
| Life, Physical & Social Science | 0 (0.0%) | 0 (0.0%) |
| Community & Social Service | 0 (0.0%) | 40 (100.0%) |
| Education, Arts & Media | 0 (0.0%) | 34 (100.0%) |
| Legal Services & Support | 0 (0.0%) | 0 (0.0%) |
| Education Instruction & Library | 0 (0.0%) | 6 (100.0%) |
| Arts, Media & Entertainment | 0 (0.0%) | 0 (0.0%) |
| Health Diagnosing & Treating | 0 (0.0%) | 0 (0.0%) |
| Health Technologists | 0 (0.0%) | 0 (0.0%) |
| Total (Category) | 36 (40.5%) | 53 (59.6%) |
| Total (Overall) | 101 (58.1%) | 73 (41.9%) |
Services Occupations
The most common Services occupations in Millerville are Security & Protection (16 | 9.2%), and Law Enforcement (16 | 9.2%).
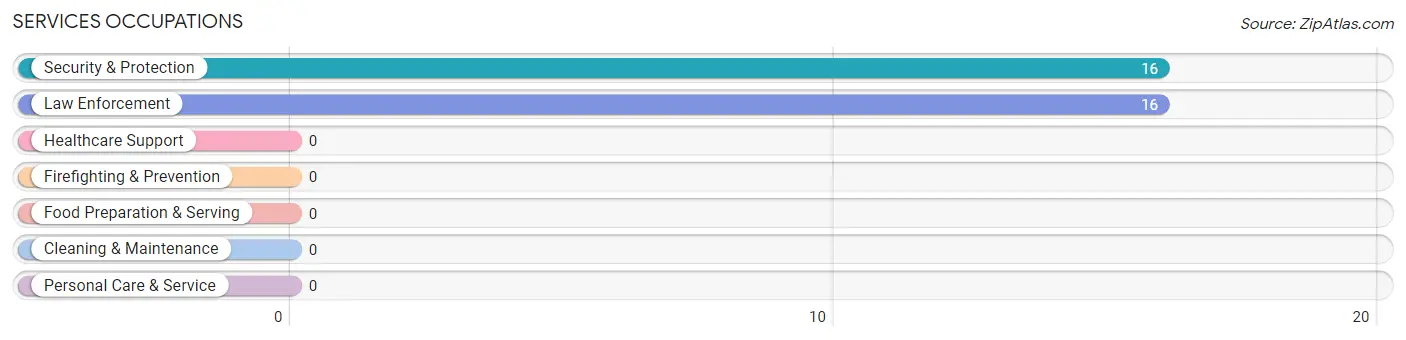
Services Occupations by Sex
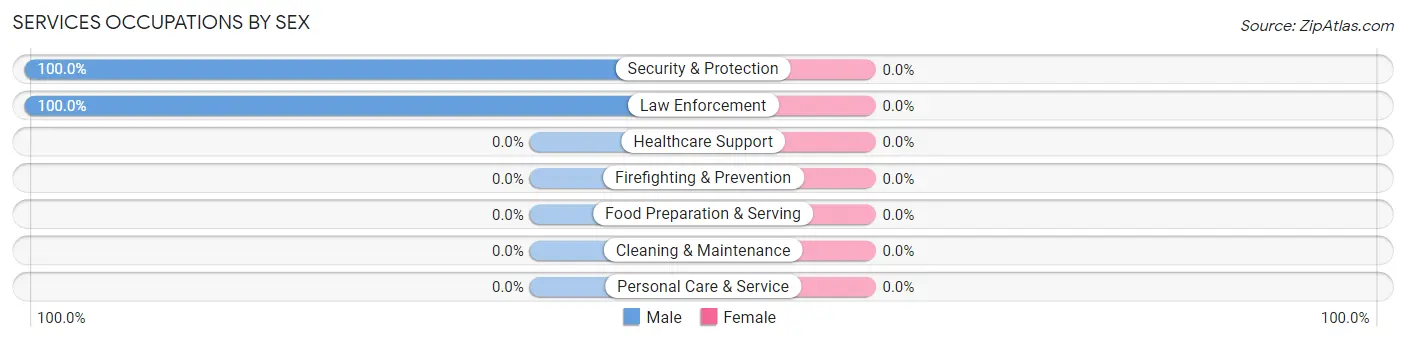
| Occupation | Male | Female |
| Healthcare Support | 0 (0.0%) | 0 (0.0%) |
| Security & Protection | 16 (100.0%) | 0 (0.0%) |
| Firefighting & Prevention | 0 (0.0%) | 0 (0.0%) |
| Law Enforcement | 16 (100.0%) | 0 (0.0%) |
| Food Preparation & Serving | 0 (0.0%) | 0 (0.0%) |
| Cleaning & Maintenance | 0 (0.0%) | 0 (0.0%) |
| Personal Care & Service | 0 (0.0%) | 0 (0.0%) |
| Total (Category) | 16 (100.0%) | 0 (0.0%) |
| Total (Overall) | 101 (58.1%) | 73 (41.9%) |
Sales and Office Occupations
The most common Sales and Office occupations in Millerville are , and Office & Administration (20 | 11.5%).
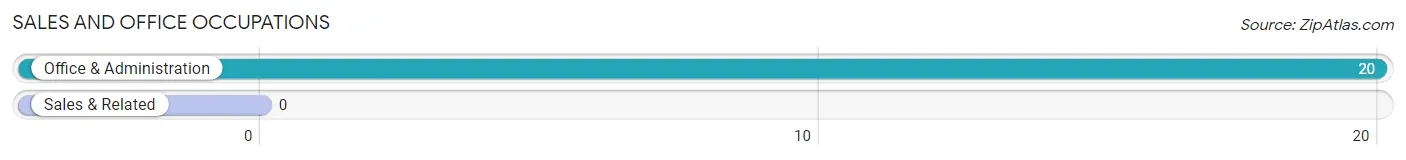
Sales and Office Occupations by Sex
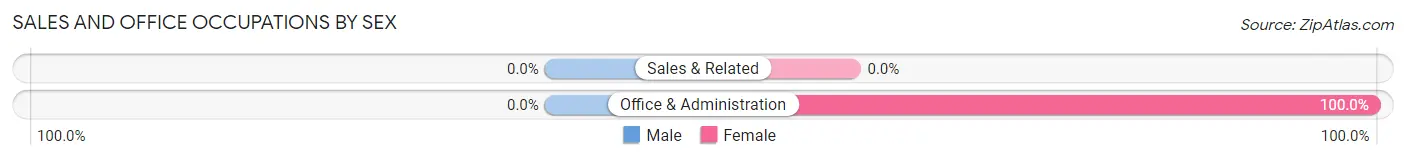
| Occupation | Male | Female |
| Sales & Related | 0 (0.0%) | 0 (0.0%) |
| Office & Administration | 0 (0.0%) | 20 (100.0%) |
| Total (Category) | 0 (0.0%) | 20 (100.0%) |
| Total (Overall) | 101 (58.1%) | 73 (41.9%) |
Natural Resources, Construction and Maintenance Occupations
The most common Natural Resources, Construction and Maintenance occupations in Millerville are , and Installation, Maintenance & Repair (6 | 3.5%).
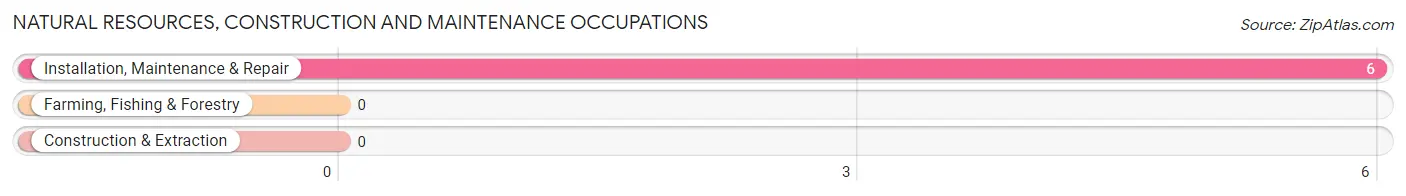
Natural Resources, Construction and Maintenance Occupations by Sex
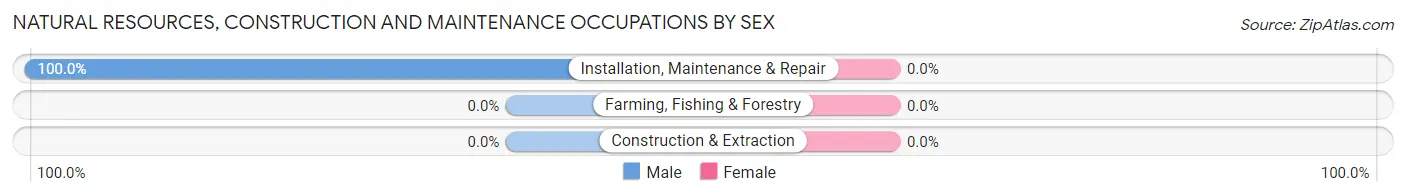
| Occupation | Male | Female |
| Farming, Fishing & Forestry | 0 (0.0%) | 0 (0.0%) |
| Construction & Extraction | 0 (0.0%) | 0 (0.0%) |
| Installation, Maintenance & Repair | 6 (100.0%) | 0 (0.0%) |
| Total (Category) | 6 (100.0%) | 0 (0.0%) |
| Total (Overall) | 101 (58.1%) | 73 (41.9%) |
Production, Transportation and Moving Occupations
The most common Production, Transportation and Moving occupations in Millerville are , and Production (43 | 24.7%).
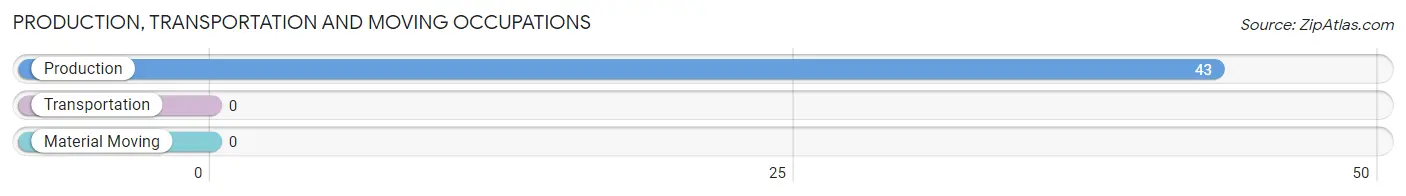
Production, Transportation and Moving Occupations by Sex
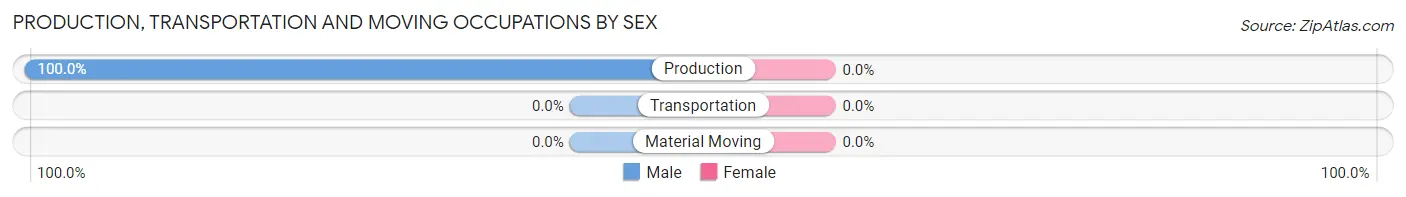
| Occupation | Male | Female |
| Production | 43 (100.0%) | 0 (0.0%) |
| Transportation | 0 (0.0%) | 0 (0.0%) |
| Material Moving | 0 (0.0%) | 0 (0.0%) |
| Total (Category) | 43 (100.0%) | 0 (0.0%) |
| Total (Overall) | 101 (58.1%) | 73 (41.9%) |
Employment Industries by Sex in Millerville
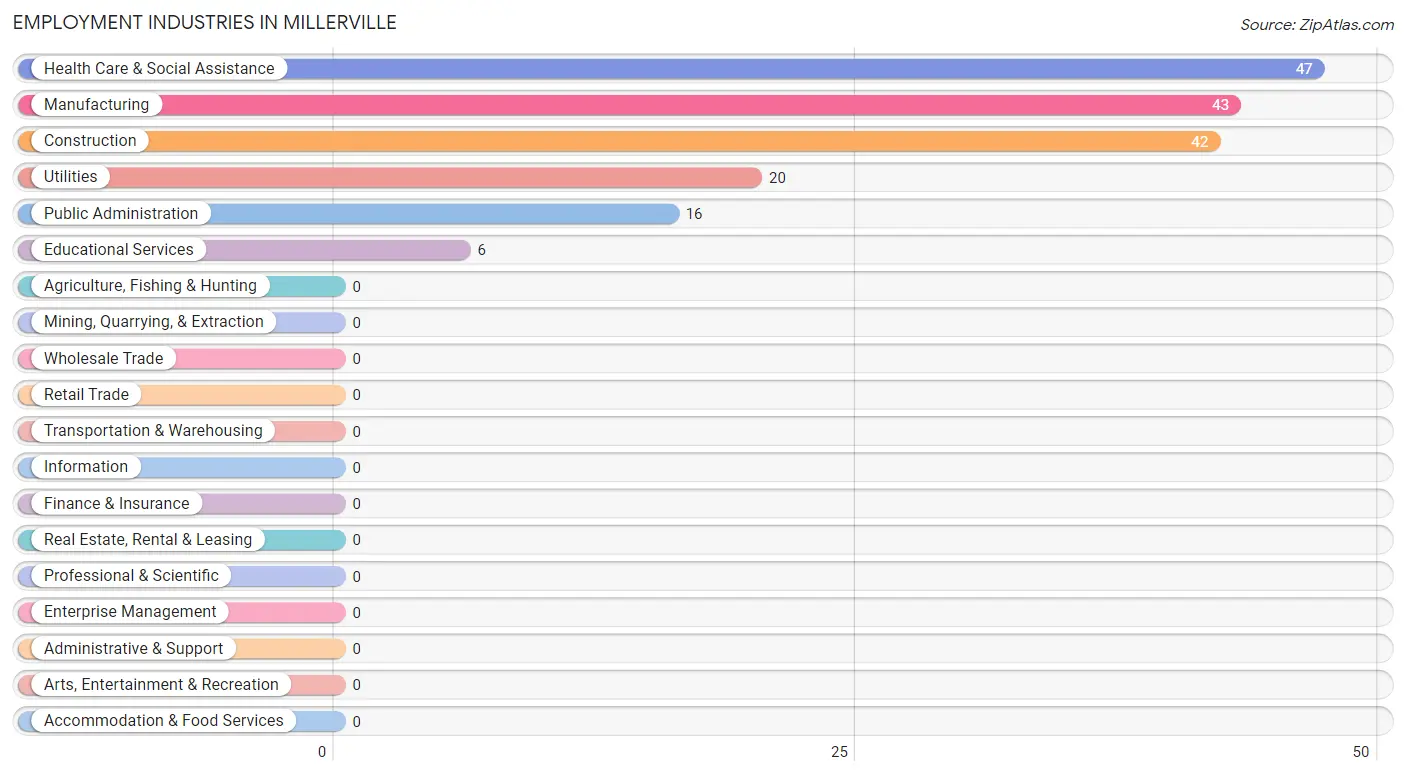
Employment Industries in Millerville
The major employment industries in Millerville include Health Care & Social Assistance (47 | 27.0%), Manufacturing (43 | 24.7%), Construction (42 | 24.1%), Utilities (20 | 11.5%), and Public Administration (16 | 9.2%).
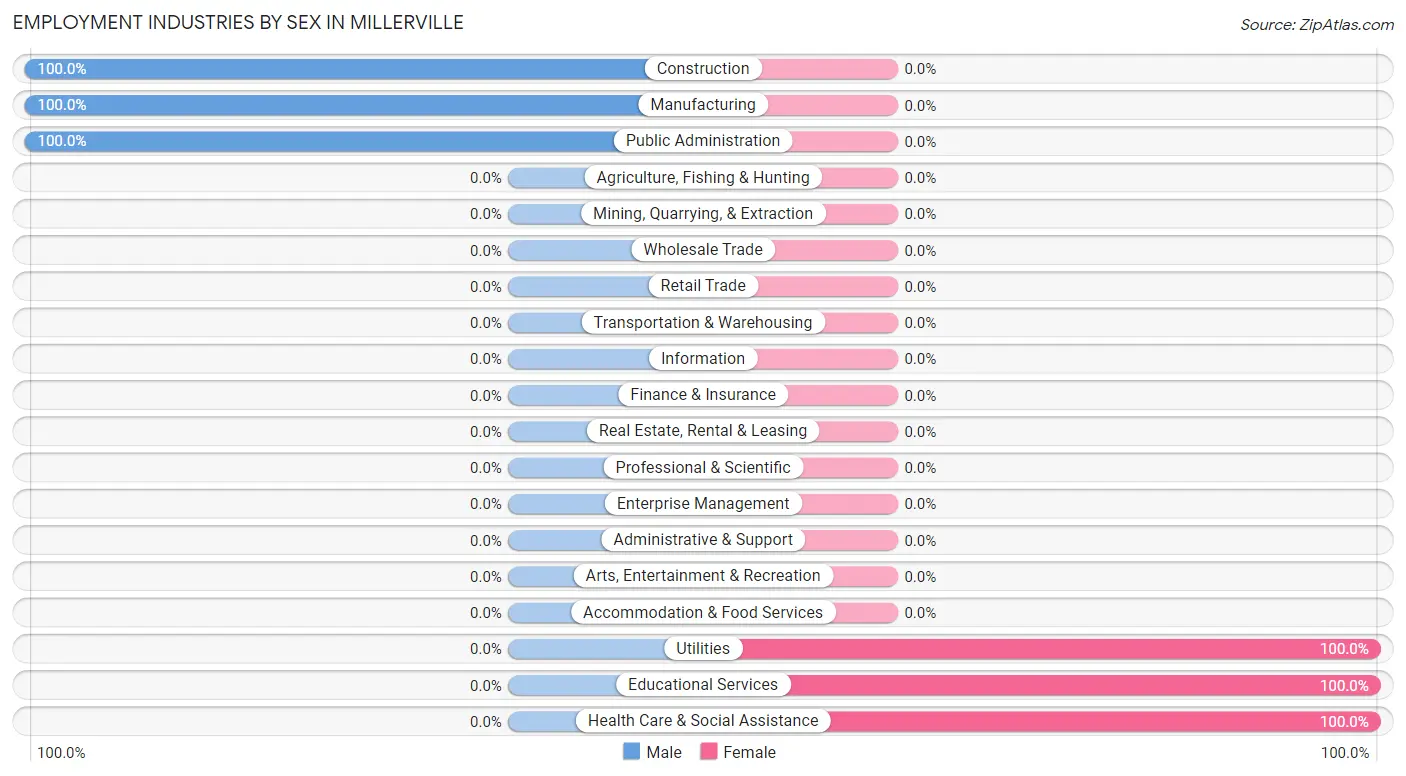
Employment Industries by Sex in Millerville
The Millerville industries that see more men than women are Construction (100.0%), Manufacturing (100.0%), and Public Administration (100.0%), whereas the industries that tend to have a higher number of women are Utilities (100.0%), Educational Services (100.0%), and Health Care & Social Assistance (100.0%).
| Industry | Male | Female |
| Agriculture, Fishing & Hunting | 0 (0.0%) | 0 (0.0%) |
| Mining, Quarrying, & Extraction | 0 (0.0%) | 0 (0.0%) |
| Construction | 42 (100.0%) | 0 (0.0%) |
| Manufacturing | 43 (100.0%) | 0 (0.0%) |
| Wholesale Trade | 0 (0.0%) | 0 (0.0%) |
| Retail Trade | 0 (0.0%) | 0 (0.0%) |
| Transportation & Warehousing | 0 (0.0%) | 0 (0.0%) |
| Utilities | 0 (0.0%) | 20 (100.0%) |
| Information | 0 (0.0%) | 0 (0.0%) |
| Finance & Insurance | 0 (0.0%) | 0 (0.0%) |
| Real Estate, Rental & Leasing | 0 (0.0%) | 0 (0.0%) |
| Professional & Scientific | 0 (0.0%) | 0 (0.0%) |
| Enterprise Management | 0 (0.0%) | 0 (0.0%) |
| Administrative & Support | 0 (0.0%) | 0 (0.0%) |
| Educational Services | 0 (0.0%) | 6 (100.0%) |
| Health Care & Social Assistance | 0 (0.0%) | 47 (100.0%) |
| Arts, Entertainment & Recreation | 0 (0.0%) | 0 (0.0%) |
| Accommodation & Food Services | 0 (0.0%) | 0 (0.0%) |
| Public Administration | 16 (100.0%) | 0 (0.0%) |
| Total | 101 (58.1%) | 73 (41.9%) |
Education in Millerville
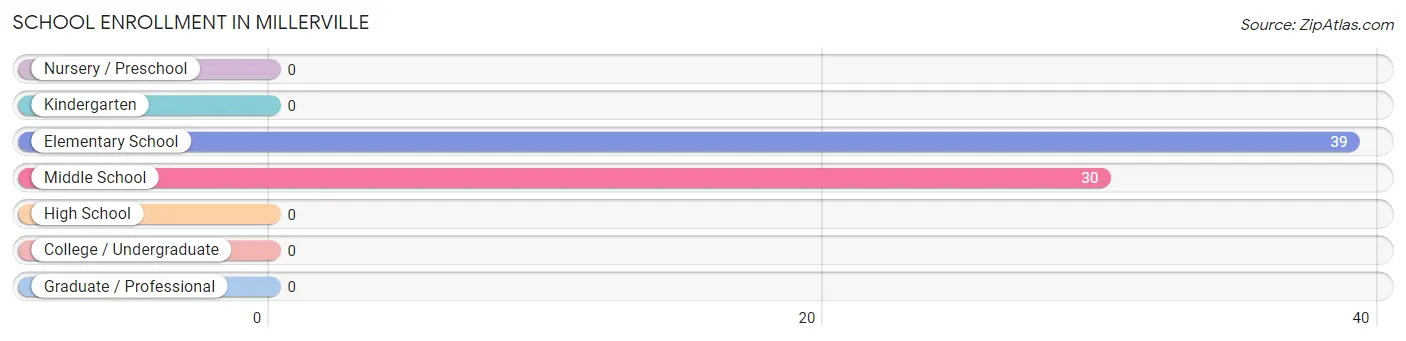
School Enrollment in Millerville
The most common levels of schooling among the 69 students in Millerville are elementary school (39 | 56.5%), and middle school (30 | 43.5%).
| School Level | # Students | % Students |
| Nursery / Preschool | 0 | 0.0% |
| Kindergarten | 0 | 0.0% |
| Elementary School | 39 | 56.5% |
| Middle School | 30 | 43.5% |
| High School | 0 | 0.0% |
| College / Undergraduate | 0 | 0.0% |
| Graduate / Professional | 0 | 0.0% |
| Total | 69 | 100.0% |
School Enrollment by Age by Funding Source in Millerville
Out of a total of 69 students who are enrolled in schools in Millerville, 65 (94.2%) attend a private institution, while the remaining 4 (5.8%) are enrolled in public schools. The age group of 5 to 9 year old has the highest likelihood of being enrolled in private schools, with 39 (100.0% in the age bracket) enrolled. Conversely, the age group of 10 to 14 year olds has the lowest likelihood of being enrolled in a private school, with 4 (13.3% in the age bracket) attending a public institution.
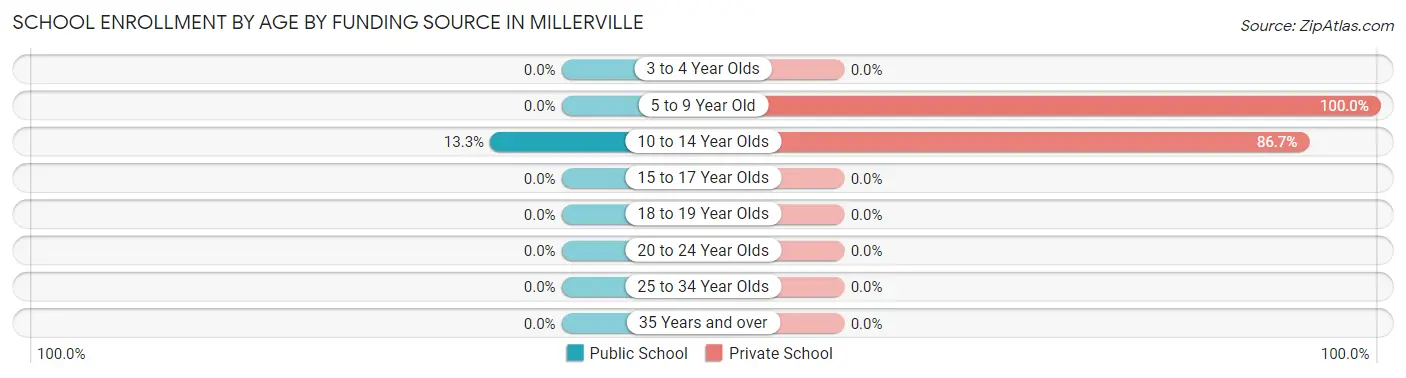
| Age Bracket | Public School | Private School |
| 3 to 4 Year Olds | 0 (0.0%) | 0 (0.0%) |
| 5 to 9 Year Old | 0 (0.0%) | 39 (100.0%) |
| 10 to 14 Year Olds | 4 (13.3%) | 26 (86.7%) |
| 15 to 17 Year Olds | 0 (0.0%) | 0 (0.0%) |
| 18 to 19 Year Olds | 0 (0.0%) | 0 (0.0%) |
| 20 to 24 Year Olds | 0 (0.0%) | 0 (0.0%) |
| 25 to 34 Year Olds | 0 (0.0%) | 0 (0.0%) |
| 35 Years and over | 0 (0.0%) | 0 (0.0%) |
| Total | 4 (5.8%) | 65 (94.2%) |
Educational Attainment by Field of Study in Millerville
, and arts & humanities (34 | 100.0%) are the most common fields of study among 34 individuals in Millerville who have obtained a bachelor's degree or higher.
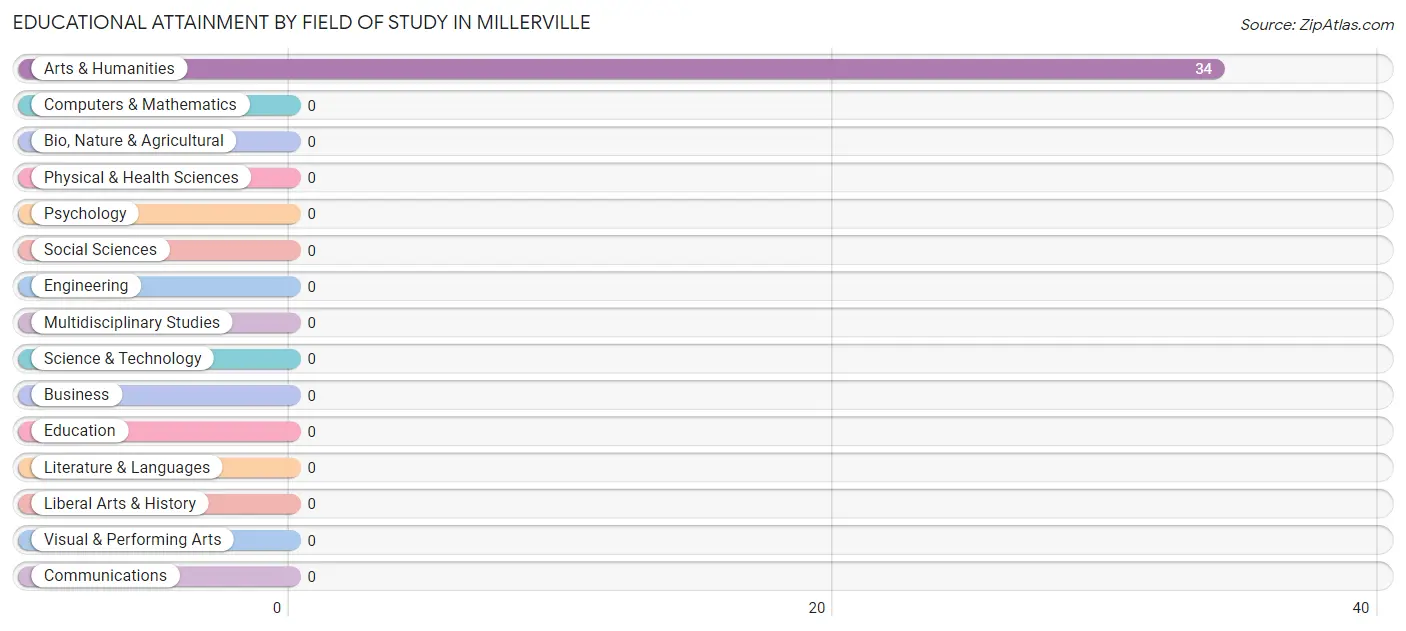
| Field of Study | # Graduates | % Graduates |
| Computers & Mathematics | 0 | 0.0% |
| Bio, Nature & Agricultural | 0 | 0.0% |
| Physical & Health Sciences | 0 | 0.0% |
| Psychology | 0 | 0.0% |
| Social Sciences | 0 | 0.0% |
| Engineering | 0 | 0.0% |
| Multidisciplinary Studies | 0 | 0.0% |
| Science & Technology | 0 | 0.0% |
| Business | 0 | 0.0% |
| Education | 0 | 0.0% |
| Literature & Languages | 0 | 0.0% |
| Liberal Arts & History | 0 | 0.0% |
| Visual & Performing Arts | 0 | 0.0% |
| Communications | 0 | 0.0% |
| Arts & Humanities | 34 | 100.0% |
| Total | 34 | 100.0% |
Transportation & Commute in Millerville
Vehicle Availability by Sex in Millerville
The most prevalent vehicle ownership categories in Millerville are males with 2 vehicles (59, accounting for 58.4%) and females with 2 vehicles (6, making up 80.8%).
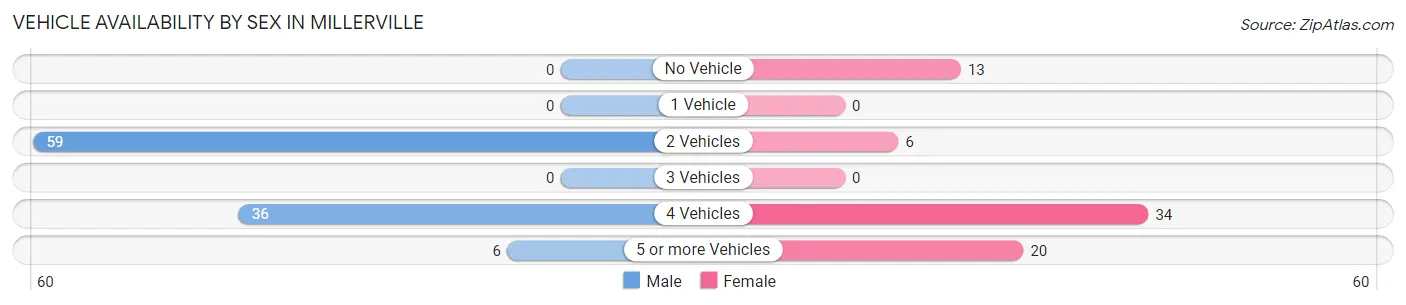
| Vehicles Available | Male | Female |
| No Vehicle | 0 (0.0%) | 13 (17.8%) |
| 1 Vehicle | 0 (0.0%) | 0 (0.0%) |
| 2 Vehicles | 59 (58.4%) | 6 (8.2%) |
| 3 Vehicles | 0 (0.0%) | 0 (0.0%) |
| 4 Vehicles | 36 (35.6%) | 34 (46.6%) |
| 5 or more Vehicles | 6 (5.9%) | 20 (27.4%) |
| Total | 101 (100.0%) | 73 (100.0%) |
Commute Time in Millerville
The most frequently occuring commute durations in Millerville are 10 to 14 minutes (43 commuters, 24.7%), 45 to 59 minutes (36 commuters, 20.7%), and 15 to 19 minutes (34 commuters, 19.5%).
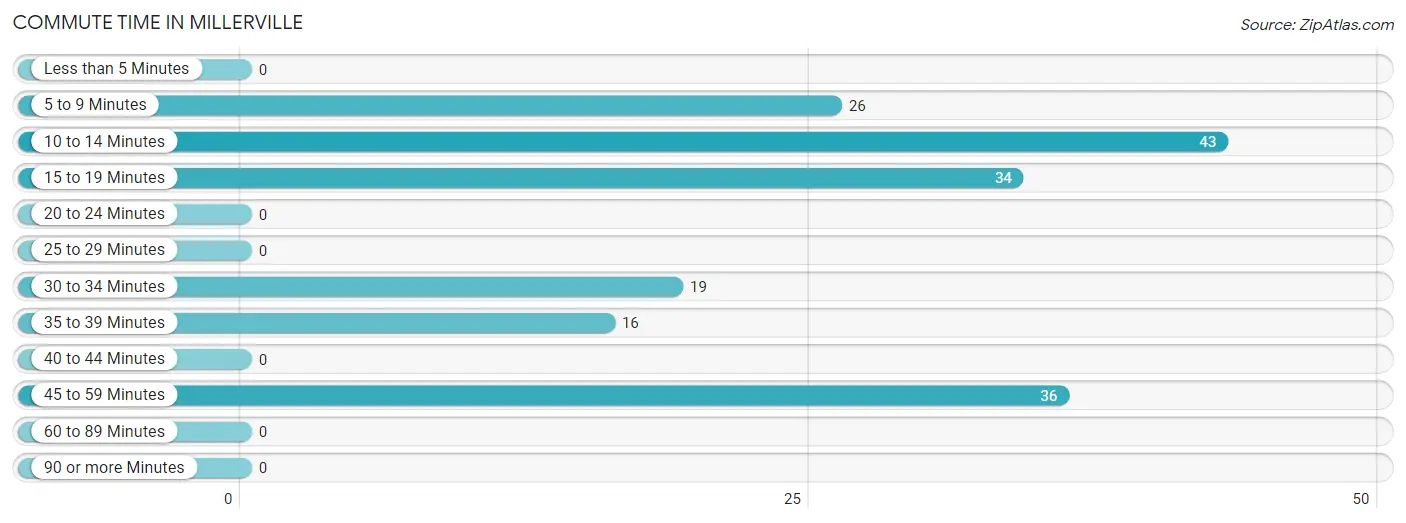
| Commute Time | # Commuters | % Commuters |
| Less than 5 Minutes | 0 | 0.0% |
| 5 to 9 Minutes | 26 | 14.9% |
| 10 to 14 Minutes | 43 | 24.7% |
| 15 to 19 Minutes | 34 | 19.5% |
| 20 to 24 Minutes | 0 | 0.0% |
| 25 to 29 Minutes | 0 | 0.0% |
| 30 to 34 Minutes | 19 | 10.9% |
| 35 to 39 Minutes | 16 | 9.2% |
| 40 to 44 Minutes | 0 | 0.0% |
| 45 to 59 Minutes | 36 | 20.7% |
| 60 to 89 Minutes | 0 | 0.0% |
| 90 or more Minutes | 0 | 0.0% |
Commute Time by Sex in Millerville
The most common commute times in Millerville are 45 to 59 minutes (36 commuters, 35.6%) for males and 10 to 14 minutes (34 commuters, 46.6%) for females.
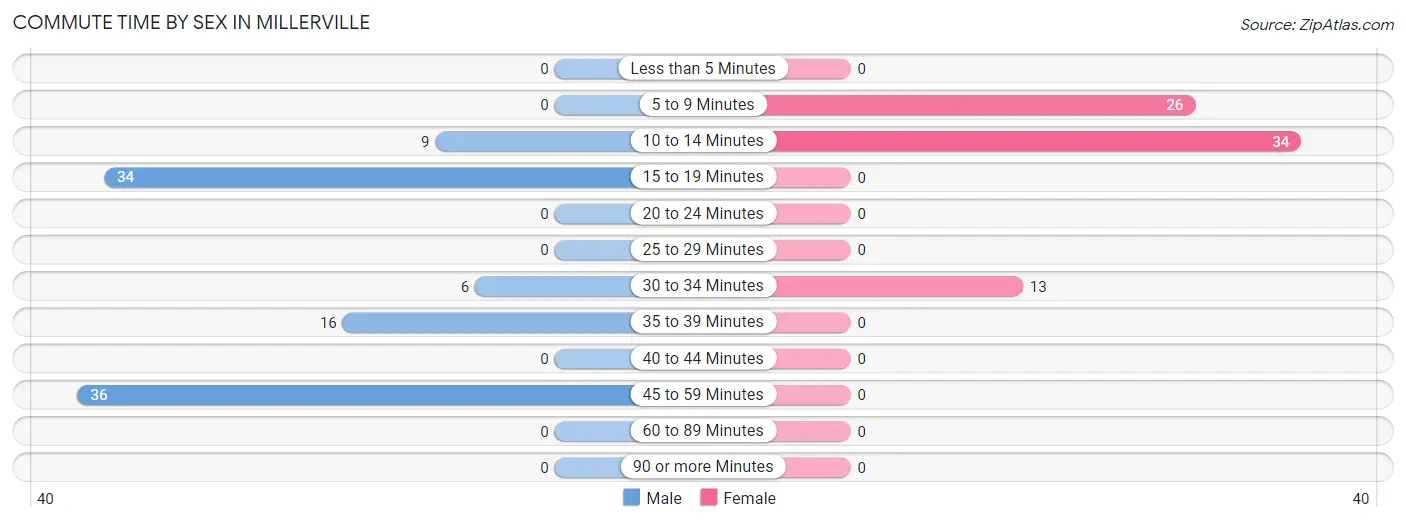
| Commute Time | Male | Female |
| Less than 5 Minutes | 0 (0.0%) | 0 (0.0%) |
| 5 to 9 Minutes | 0 (0.0%) | 26 (35.6%) |
| 10 to 14 Minutes | 9 (8.9%) | 34 (46.6%) |
| 15 to 19 Minutes | 34 (33.7%) | 0 (0.0%) |
| 20 to 24 Minutes | 0 (0.0%) | 0 (0.0%) |
| 25 to 29 Minutes | 0 (0.0%) | 0 (0.0%) |
| 30 to 34 Minutes | 6 (5.9%) | 13 (17.8%) |
| 35 to 39 Minutes | 16 (15.8%) | 0 (0.0%) |
| 40 to 44 Minutes | 0 (0.0%) | 0 (0.0%) |
| 45 to 59 Minutes | 36 (35.6%) | 0 (0.0%) |
| 60 to 89 Minutes | 0 (0.0%) | 0 (0.0%) |
| 90 or more Minutes | 0 (0.0%) | 0 (0.0%) |
Time of Departure to Work by Sex in Millerville
The most frequent times of departure to work in Millerville are 12:00 AM to 4:59 AM (79, 78.2%) for males and 8:30 AM to 8:59 AM (34, 46.6%) for females.
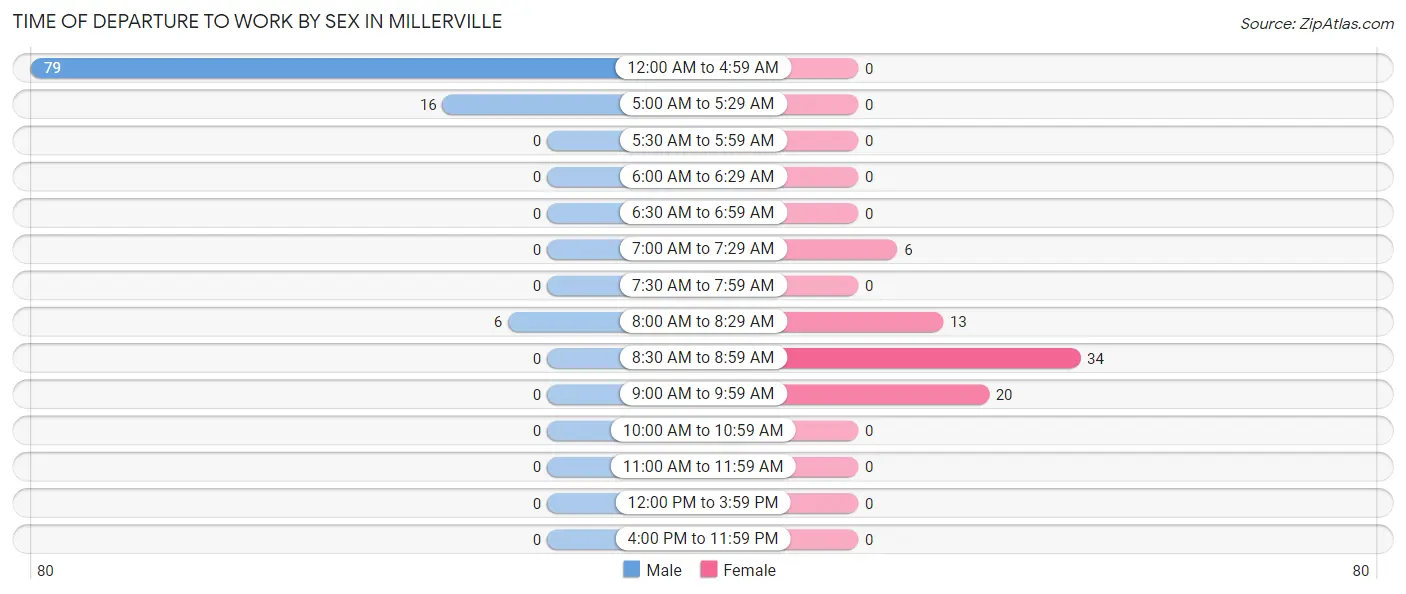
| Time of Departure | Male | Female |
| 12:00 AM to 4:59 AM | 79 (78.2%) | 0 (0.0%) |
| 5:00 AM to 5:29 AM | 16 (15.8%) | 0 (0.0%) |
| 5:30 AM to 5:59 AM | 0 (0.0%) | 0 (0.0%) |
| 6:00 AM to 6:29 AM | 0 (0.0%) | 0 (0.0%) |
| 6:30 AM to 6:59 AM | 0 (0.0%) | 0 (0.0%) |
| 7:00 AM to 7:29 AM | 0 (0.0%) | 6 (8.2%) |
| 7:30 AM to 7:59 AM | 0 (0.0%) | 0 (0.0%) |
| 8:00 AM to 8:29 AM | 6 (5.9%) | 13 (17.8%) |
| 8:30 AM to 8:59 AM | 0 (0.0%) | 34 (46.6%) |
| 9:00 AM to 9:59 AM | 0 (0.0%) | 20 (27.4%) |
| 10:00 AM to 10:59 AM | 0 (0.0%) | 0 (0.0%) |
| 11:00 AM to 11:59 AM | 0 (0.0%) | 0 (0.0%) |
| 12:00 PM to 3:59 PM | 0 (0.0%) | 0 (0.0%) |
| 4:00 PM to 11:59 PM | 0 (0.0%) | 0 (0.0%) |
| Total | 101 (100.0%) | 73 (100.0%) |
Housing Occupancy in Millerville
Occupancy by Ownership in Millerville
Of the total 147 dwellings in Millerville, owner-occupied units account for 138 (93.9%), while renter-occupied units make up 9 (6.1%).
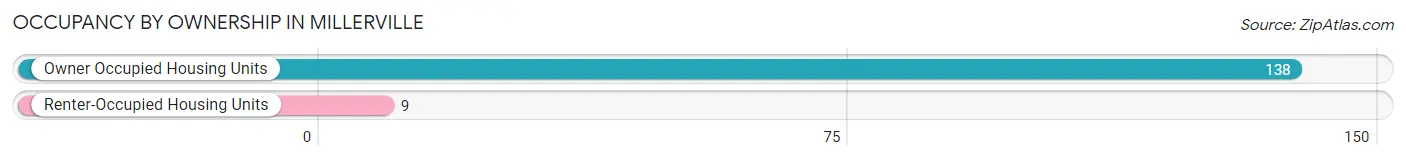
| Occupancy | # Housing Units | % Housing Units |
| Owner Occupied Housing Units | 138 | 93.9% |
| Renter-Occupied Housing Units | 9 | 6.1% |
| Total Occupied Housing Units | 147 | 100.0% |
Occupancy by Household Size in Millerville
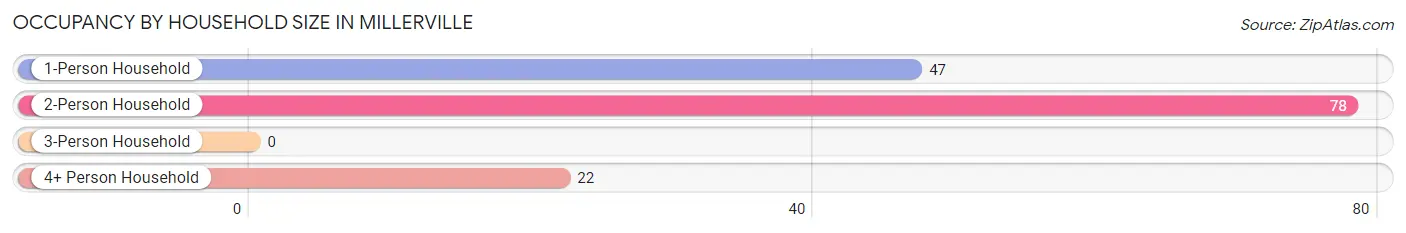
| Household Size | # Housing Units | % Housing Units |
| 1-Person Household | 47 | 32.0% |
| 2-Person Household | 78 | 53.1% |
| 3-Person Household | 0 | 0.0% |
| 4+ Person Household | 22 | 15.0% |
| Total Housing Units | 147 | 100.0% |
Occupancy by Ownership by Household Size in Millerville
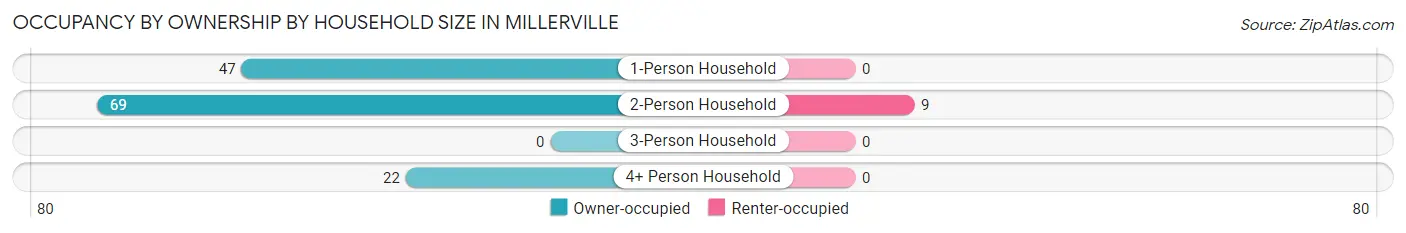
| Household Size | Owner-occupied | Renter-occupied |
| 1-Person Household | 47 (100.0%) | 0 (0.0%) |
| 2-Person Household | 69 (88.5%) | 9 (11.5%) |
| 3-Person Household | 0 (0.0%) | 0 (0.0%) |
| 4+ Person Household | 22 (100.0%) | 0 (0.0%) |
| Total Housing Units | 138 (93.9%) | 9 (6.1%) |
Occupancy by Educational Attainment in Millerville
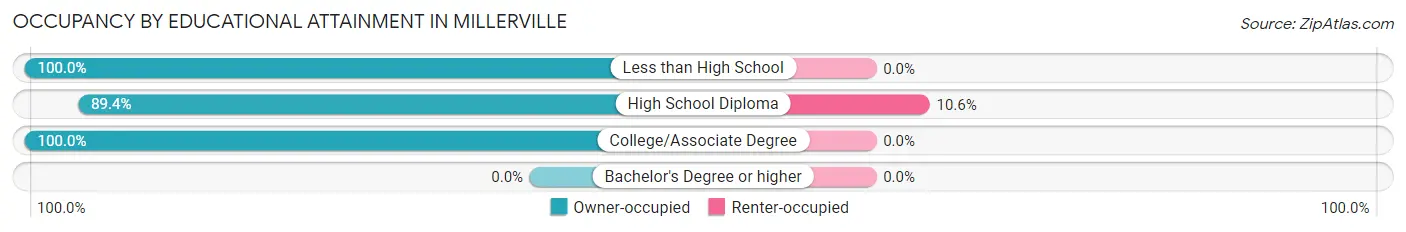
| Household Size | Owner-occupied | Renter-occupied |
| Less than High School | 13 (100.0%) | 0 (0.0%) |
| High School Diploma | 76 (89.4%) | 9 (10.6%) |
| College/Associate Degree | 49 (100.0%) | 0 (0.0%) |
| Bachelor's Degree or higher | 0 (0.0%) | 0 (0.0%) |
Occupancy by Age of Householder in Millerville
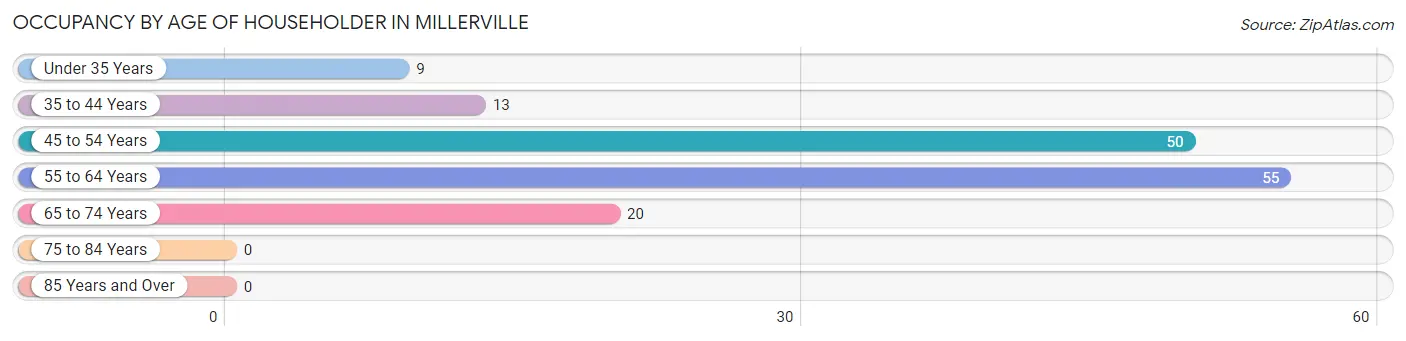
| Age Bracket | # Households | % Households |
| Under 35 Years | 9 | 6.1% |
| 35 to 44 Years | 13 | 8.8% |
| 45 to 54 Years | 50 | 34.0% |
| 55 to 64 Years | 55 | 37.4% |
| 65 to 74 Years | 20 | 13.6% |
| 75 to 84 Years | 0 | 0.0% |
| 85 Years and Over | 0 | 0.0% |
| Total | 147 | 100.0% |
Housing Finances in Millerville
Median Income by Occupancy in Millerville
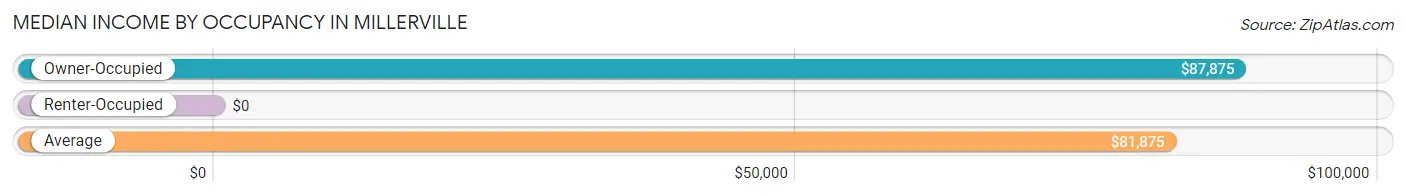
| Occupancy Type | # Households | Median Income |
| Owner-Occupied | 138 (93.9%) | $87,875 |
| Renter-Occupied | 9 (6.1%) | $0 |
| Average | 147 (100.0%) | $81,875 |
Occupancy by Householder Income Bracket in Millerville
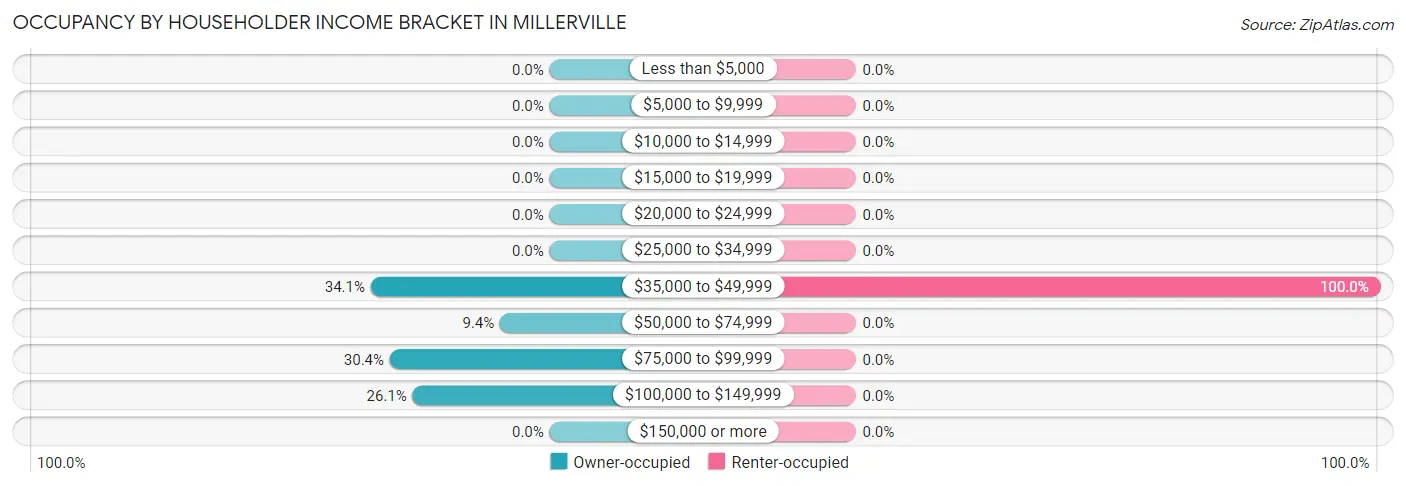
| Income Bracket | Owner-occupied | Renter-occupied |
| Less than $5,000 | 0 (0.0%) | 0 (0.0%) |
| $5,000 to $9,999 | 0 (0.0%) | 0 (0.0%) |
| $10,000 to $14,999 | 0 (0.0%) | 0 (0.0%) |
| $15,000 to $19,999 | 0 (0.0%) | 0 (0.0%) |
| $20,000 to $24,999 | 0 (0.0%) | 0 (0.0%) |
| $25,000 to $34,999 | 0 (0.0%) | 0 (0.0%) |
| $35,000 to $49,999 | 47 (34.1%) | 9 (100.0%) |
| $50,000 to $74,999 | 13 (9.4%) | 0 (0.0%) |
| $75,000 to $99,999 | 42 (30.4%) | 0 (0.0%) |
| $100,000 to $149,999 | 36 (26.1%) | 0 (0.0%) |
| $150,000 or more | 0 (0.0%) | 0 (0.0%) |
| Total | 138 (100.0%) | 9 (100.0%) |
Monthly Housing Cost Tiers in Millerville
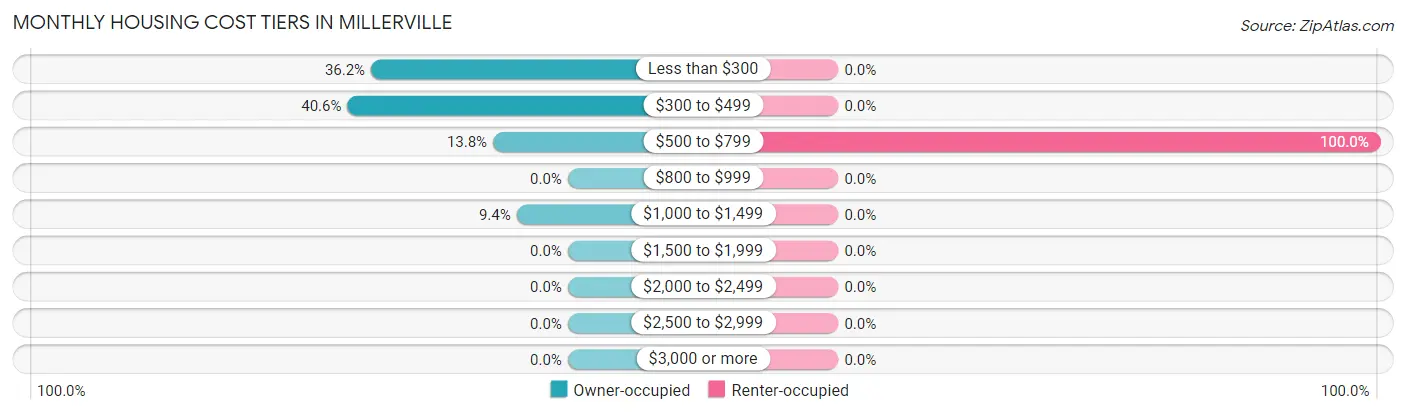
| Monthly Cost | Owner-occupied | Renter-occupied |
| Less than $300 | 50 (36.2%) | 0 (0.0%) |
| $300 to $499 | 56 (40.6%) | 0 (0.0%) |
| $500 to $799 | 19 (13.8%) | 9 (100.0%) |
| $800 to $999 | 0 (0.0%) | 0 (0.0%) |
| $1,000 to $1,499 | 13 (9.4%) | 0 (0.0%) |
| $1,500 to $1,999 | 0 (0.0%) | 0 (0.0%) |
| $2,000 to $2,499 | 0 (0.0%) | 0 (0.0%) |
| $2,500 to $2,999 | 0 (0.0%) | 0 (0.0%) |
| $3,000 or more | 0 (0.0%) | 0 (0.0%) |
| Total | 138 (100.0%) | 9 (100.0%) |
Physical Housing Characteristics in Millerville
Housing Structures in Millerville
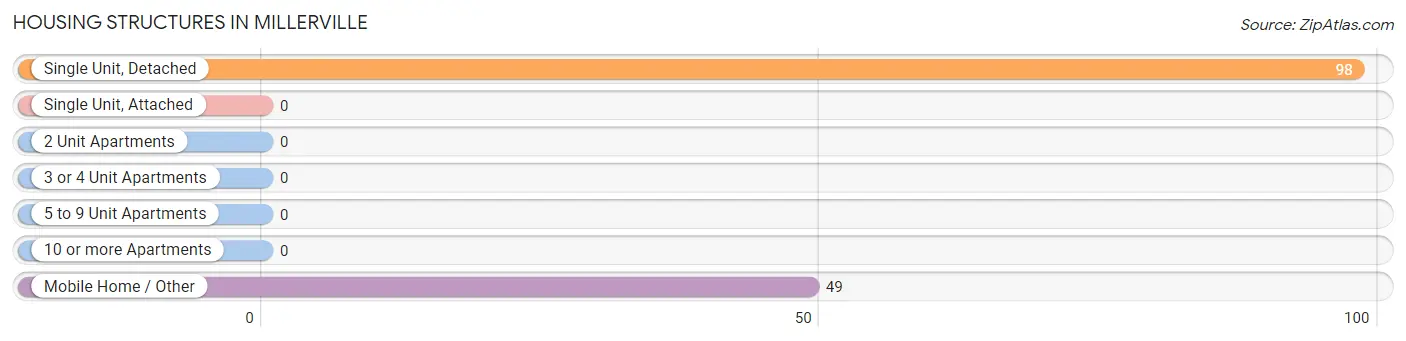
| Structure Type | # Housing Units | % Housing Units |
| Single Unit, Detached | 98 | 66.7% |
| Single Unit, Attached | 0 | 0.0% |
| 2 Unit Apartments | 0 | 0.0% |
| 3 or 4 Unit Apartments | 0 | 0.0% |
| 5 to 9 Unit Apartments | 0 | 0.0% |
| 10 or more Apartments | 0 | 0.0% |
| Mobile Home / Other | 49 | 33.3% |
| Total | 147 | 100.0% |
Housing Structures by Occupancy in Millerville
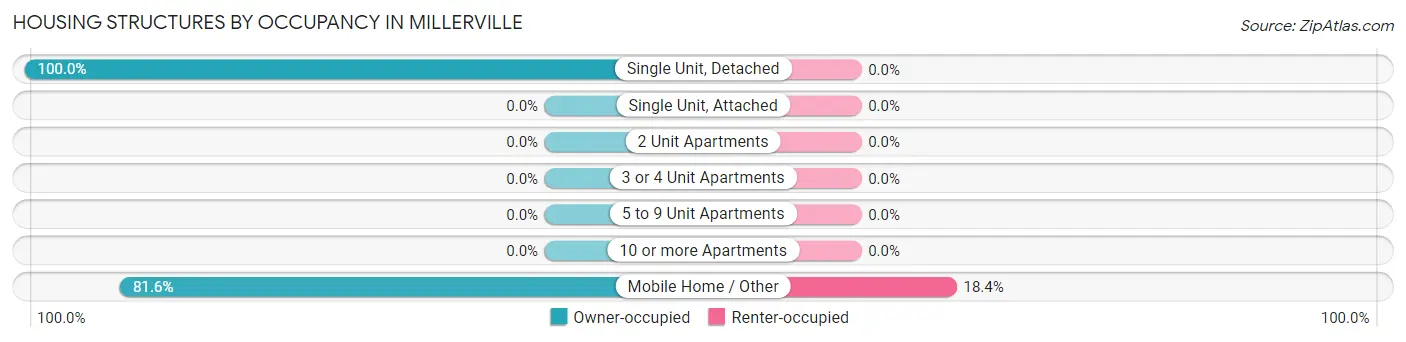
| Structure Type | Owner-occupied | Renter-occupied |
| Single Unit, Detached | 98 (100.0%) | 0 (0.0%) |
| Single Unit, Attached | 0 (0.0%) | 0 (0.0%) |
| 2 Unit Apartments | 0 (0.0%) | 0 (0.0%) |
| 3 or 4 Unit Apartments | 0 (0.0%) | 0 (0.0%) |
| 5 to 9 Unit Apartments | 0 (0.0%) | 0 (0.0%) |
| 10 or more Apartments | 0 (0.0%) | 0 (0.0%) |
| Mobile Home / Other | 40 (81.6%) | 9 (18.4%) |
| Total | 138 (93.9%) | 9 (6.1%) |
Housing Structures by Number of Rooms in Millerville
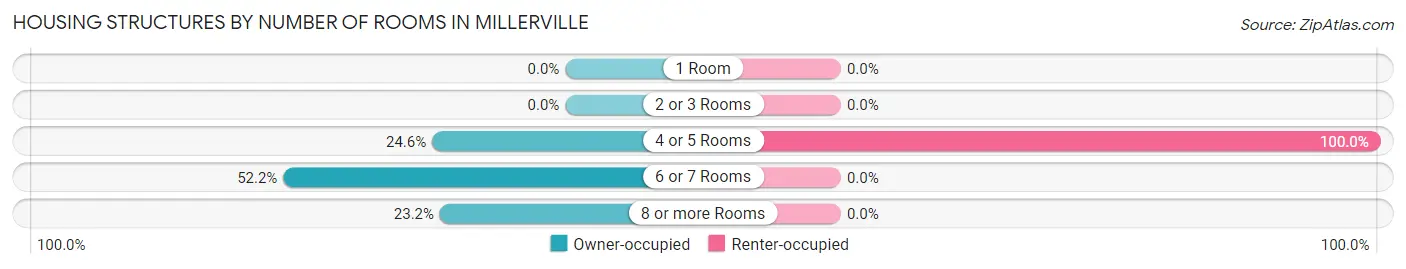
| Number of Rooms | Owner-occupied | Renter-occupied |
| 1 Room | 0 (0.0%) | 0 (0.0%) |
| 2 or 3 Rooms | 0 (0.0%) | 0 (0.0%) |
| 4 or 5 Rooms | 34 (24.6%) | 9 (100.0%) |
| 6 or 7 Rooms | 72 (52.2%) | 0 (0.0%) |
| 8 or more Rooms | 32 (23.2%) | 0 (0.0%) |
| Total | 138 (100.0%) | 9 (100.0%) |
Housing Structure by Heating Type in Millerville
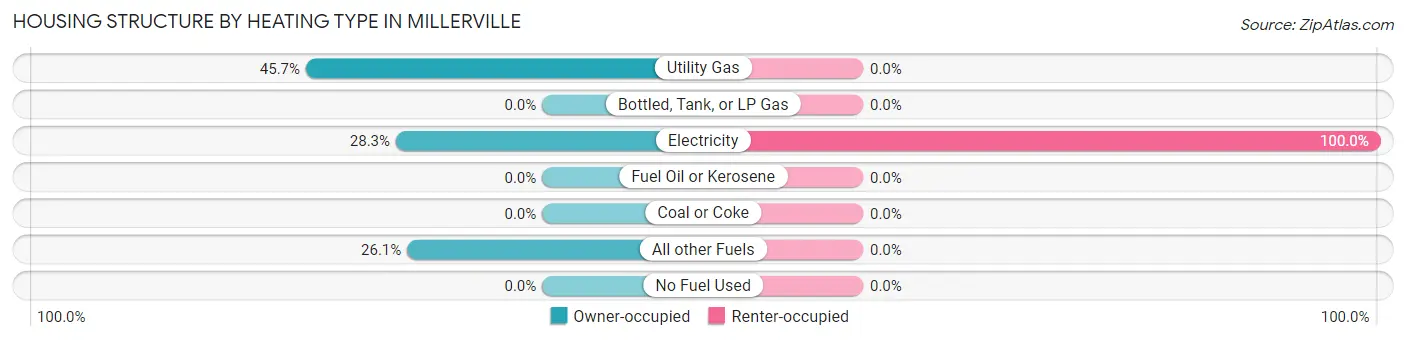
| Heating Type | Owner-occupied | Renter-occupied |
| Utility Gas | 63 (45.7%) | 0 (0.0%) |
| Bottled, Tank, or LP Gas | 0 (0.0%) | 0 (0.0%) |
| Electricity | 39 (28.3%) | 9 (100.0%) |
| Fuel Oil or Kerosene | 0 (0.0%) | 0 (0.0%) |
| Coal or Coke | 0 (0.0%) | 0 (0.0%) |
| All other Fuels | 36 (26.1%) | 0 (0.0%) |
| No Fuel Used | 0 (0.0%) | 0 (0.0%) |
| Total | 138 (100.0%) | 9 (100.0%) |
Household Vehicle Usage in Millerville
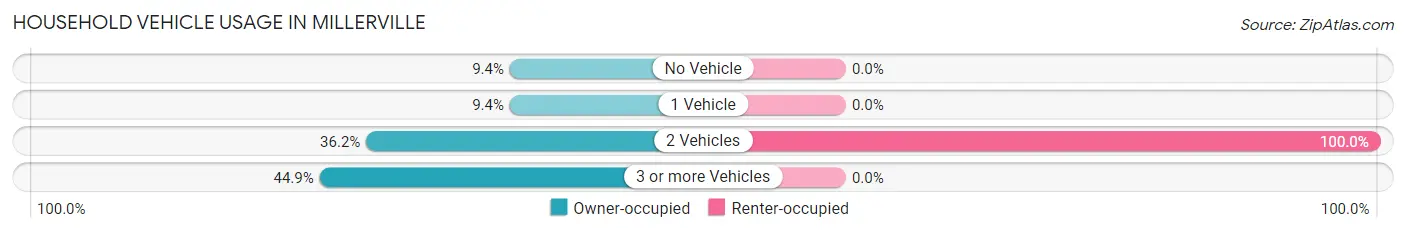
| Vehicles per Household | Owner-occupied | Renter-occupied |
| No Vehicle | 13 (9.4%) | 0 (0.0%) |
| 1 Vehicle | 13 (9.4%) | 0 (0.0%) |
| 2 Vehicles | 50 (36.2%) | 9 (100.0%) |
| 3 or more Vehicles | 62 (44.9%) | 0 (0.0%) |
| Total | 138 (100.0%) | 9 (100.0%) |
Real Estate & Mortgages in Millerville
Real Estate and Mortgage Overview in Millerville
| Characteristic | Without Mortgage | With Mortgage |
| Housing Units | 90 | 48 |
| Median Property Value | - | - |
| Median Household Income | - | - |
| Monthly Housing Costs | $378 | $0 |
| Real Estate Taxes | $231 | $0 |
Property Value by Mortgage Status in Millerville
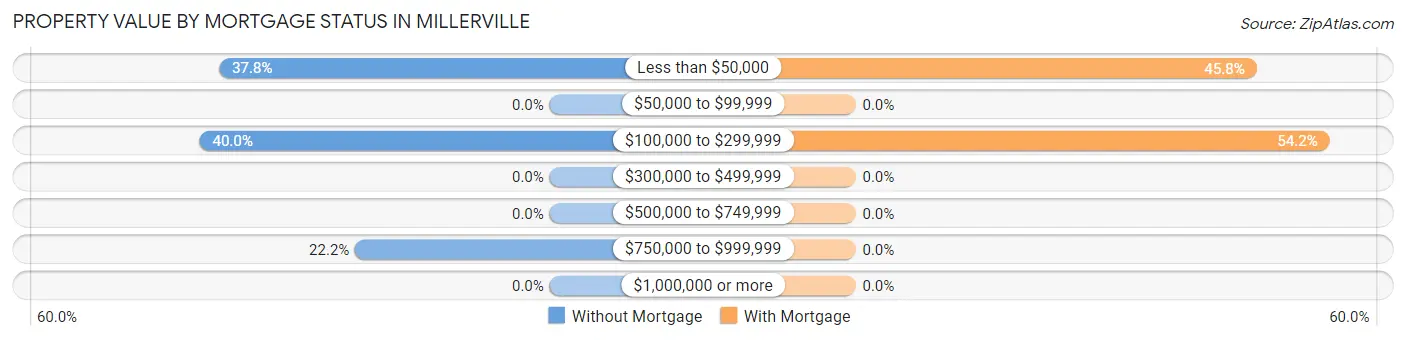
| Property Value | Without Mortgage | With Mortgage |
| Less than $50,000 | 34 (37.8%) | 22 (45.8%) |
| $50,000 to $99,999 | 0 (0.0%) | 0 (0.0%) |
| $100,000 to $299,999 | 36 (40.0%) | 26 (54.2%) |
| $300,000 to $499,999 | 0 (0.0%) | 0 (0.0%) |
| $500,000 to $749,999 | 0 (0.0%) | 0 (0.0%) |
| $750,000 to $999,999 | 20 (22.2%) | 0 (0.0%) |
| $1,000,000 or more | 0 (0.0%) | 0 (0.0%) |
| Total | 90 (100.0%) | 48 (100.0%) |
Household Income by Mortgage Status in Millerville
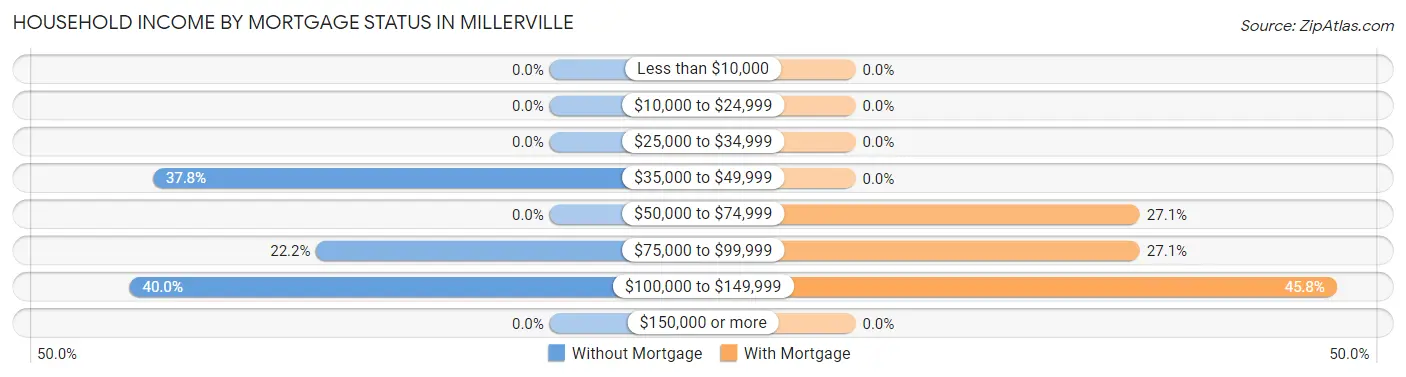
| Household Income | Without Mortgage | With Mortgage |
| Less than $10,000 | 0 (0.0%) | 0 (0.0%) |
| $10,000 to $24,999 | 0 (0.0%) | 0 (0.0%) |
| $25,000 to $34,999 | 0 (0.0%) | 0 (0.0%) |
| $35,000 to $49,999 | 34 (37.8%) | 0 (0.0%) |
| $50,000 to $74,999 | 0 (0.0%) | 13 (27.1%) |
| $75,000 to $99,999 | 20 (22.2%) | 13 (27.1%) |
| $100,000 to $149,999 | 36 (40.0%) | 22 (45.8%) |
| $150,000 or more | 0 (0.0%) | 0 (0.0%) |
| Total | 90 (100.0%) | 48 (100.0%) |
Property Value to Household Income Ratio in Millerville
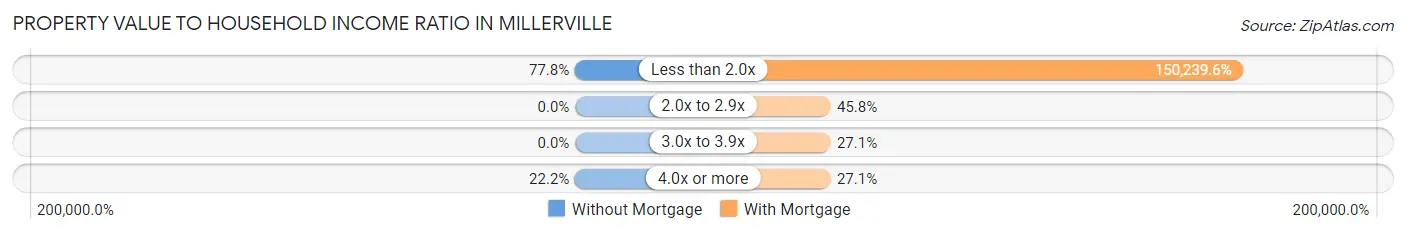
| Value-to-Income Ratio | Without Mortgage | With Mortgage |
| Less than 2.0x | 70 (77.8%) | 72,115 (150,239.6%) |
| 2.0x to 2.9x | 0 (0.0%) | 22 (45.8%) |
| 3.0x to 3.9x | 0 (0.0%) | 13 (27.1%) |
| 4.0x or more | 20 (22.2%) | 13 (27.1%) |
| Total | 90 (100.0%) | 48 (100.0%) |
Real Estate Taxes by Mortgage Status in Millerville
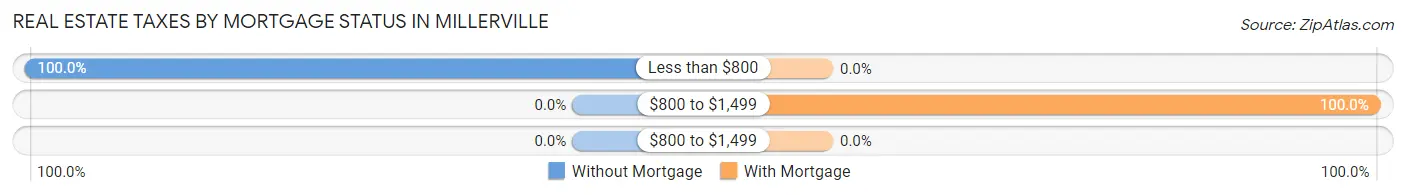
| Property Taxes | Without Mortgage | With Mortgage |
| Less than $800 | 90 (100.0%) | 0 (0.0%) |
| $800 to $1,499 | 0 (0.0%) | 48 (100.0%) |
| $800 to $1,499 | 0 (0.0%) | 0 (0.0%) |
| Total | 90 (100.0%) | 48 (100.0%) |
Health & Disability in Millerville
Health Insurance Coverage by Age in Millerville
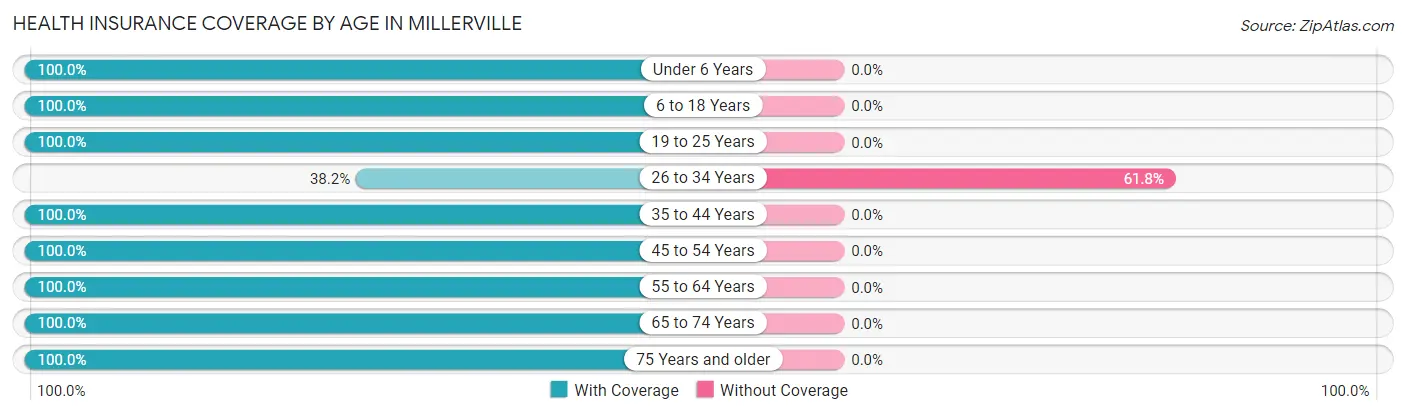
| Age Bracket | With Coverage | Without Coverage |
| Under 6 Years | 68 (100.0%) | 0 (0.0%) |
| 6 to 18 Years | 73 (100.0%) | 0 (0.0%) |
| 19 to 25 Years | 6 (100.0%) | 0 (0.0%) |
| 26 to 34 Years | 34 (38.2%) | 55 (61.8%) |
| 35 to 44 Years | 31 (100.0%) | 0 (0.0%) |
| 45 to 54 Years | 59 (100.0%) | 0 (0.0%) |
| 55 to 64 Years | 89 (100.0%) | 0 (0.0%) |
| 65 to 74 Years | 35 (100.0%) | 0 (0.0%) |
| 75 Years and older | 23 (100.0%) | 0 (0.0%) |
| Total | 418 (88.4%) | 55 (11.6%) |
Health Insurance Coverage by Citizenship Status in Millerville
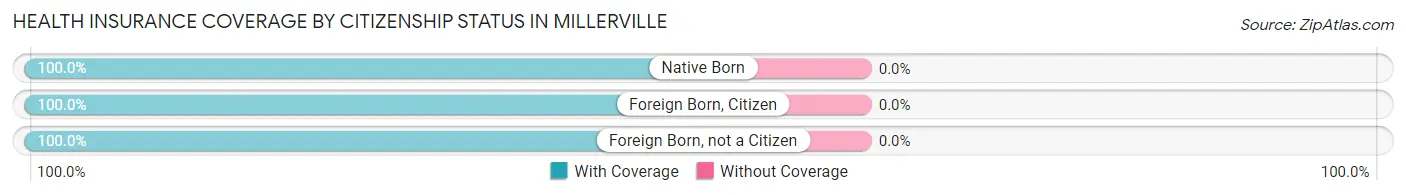
| Citizenship Status | With Coverage | Without Coverage |
| Native Born | 68 (100.0%) | 0 (0.0%) |
| Foreign Born, Citizen | 73 (100.0%) | 0 (0.0%) |
| Foreign Born, not a Citizen | 6 (100.0%) | 0 (0.0%) |
Health Insurance Coverage by Household Income in Millerville
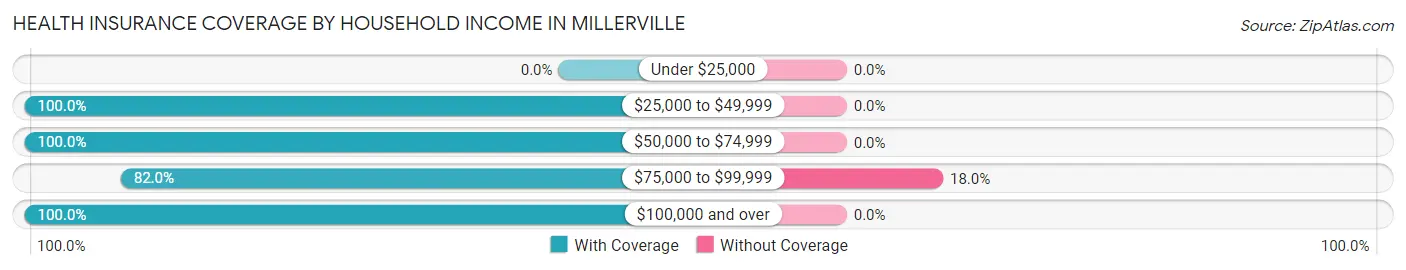
| Household Income | With Coverage | Without Coverage |
| Under $25,000 | 0 (0.0%) | 0 (0.0%) |
| $25,000 to $49,999 | 62 (100.0%) | 0 (0.0%) |
| $50,000 to $74,999 | 36 (100.0%) | 0 (0.0%) |
| $75,000 to $99,999 | 250 (82.0%) | 55 (18.0%) |
| $100,000 and over | 70 (100.0%) | 0 (0.0%) |
Public vs Private Health Insurance Coverage by Age in Millerville
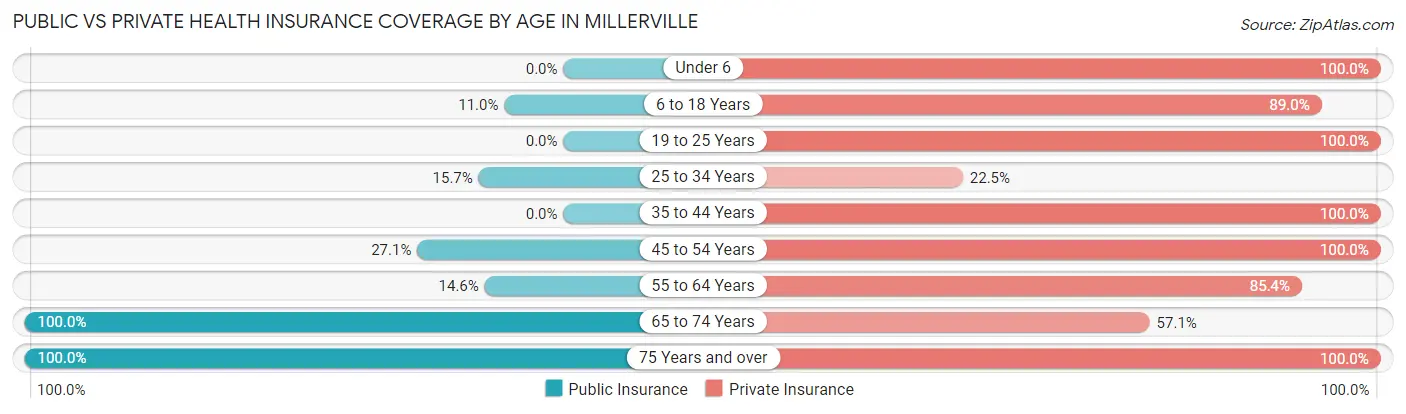
| Age Bracket | Public Insurance | Private Insurance |
| Under 6 | 0 (0.0%) | 68 (100.0%) |
| 6 to 18 Years | 8 (11.0%) | 65 (89.0%) |
| 19 to 25 Years | 0 (0.0%) | 6 (100.0%) |
| 25 to 34 Years | 14 (15.7%) | 20 (22.5%) |
| 35 to 44 Years | 0 (0.0%) | 31 (100.0%) |
| 45 to 54 Years | 16 (27.1%) | 59 (100.0%) |
| 55 to 64 Years | 13 (14.6%) | 76 (85.4%) |
| 65 to 74 Years | 35 (100.0%) | 20 (57.1%) |
| 75 Years and over | 23 (100.0%) | 23 (100.0%) |
| Total | 109 (23.0%) | 368 (77.8%) |
Disability Status by Sex by Age in Millerville
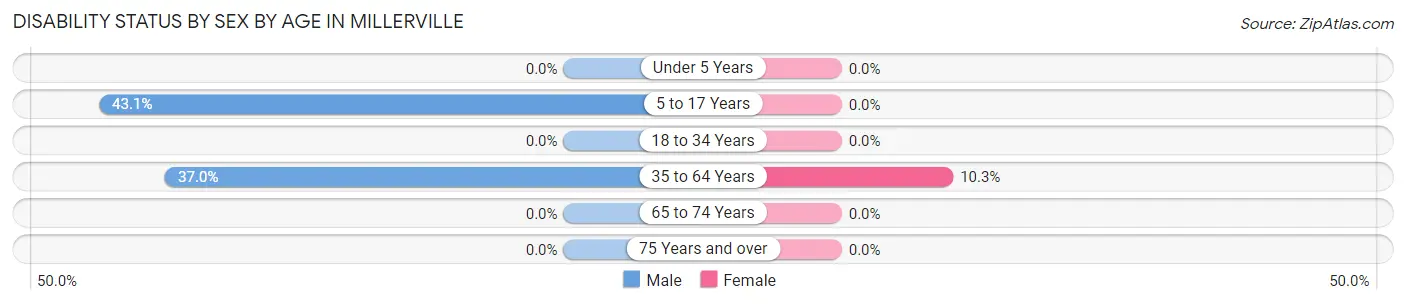
| Age Bracket | Male | Female |
| Under 5 Years | 0 (0.0%) | 0 (0.0%) |
| 5 to 17 Years | 28 (43.1%) | 0 (0.0%) |
| 18 to 34 Years | 0 (0.0%) | 0 (0.0%) |
| 35 to 64 Years | 34 (37.0%) | 9 (10.3%) |
| 65 to 74 Years | 0 (0.0%) | 0 (0.0%) |
| 75 Years and over | 0 (0.0%) | 0 (0.0%) |
Disability Class by Sex by Age in Millerville
Disability Class: Hearing Difficulty
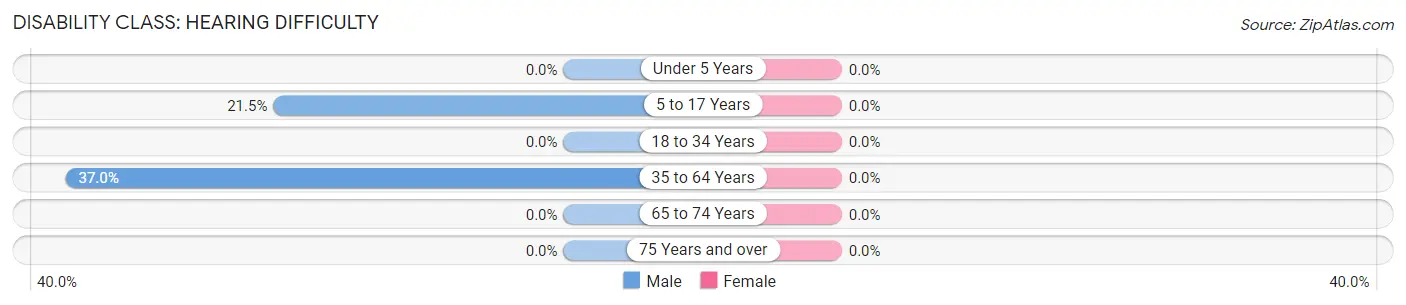
| Age Bracket | Male | Female |
| Under 5 Years | 0 (0.0%) | 0 (0.0%) |
| 5 to 17 Years | 14 (21.5%) | 0 (0.0%) |
| 18 to 34 Years | 0 (0.0%) | 0 (0.0%) |
| 35 to 64 Years | 34 (37.0%) | 0 (0.0%) |
| 65 to 74 Years | 0 (0.0%) | 0 (0.0%) |
| 75 Years and over | 0 (0.0%) | 0 (0.0%) |
Disability Class: Vision Difficulty
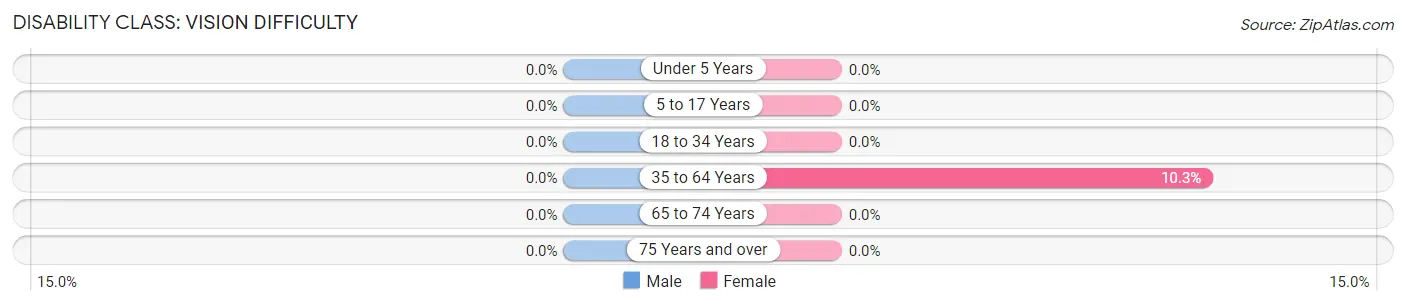
| Age Bracket | Male | Female |
| Under 5 Years | 0 (0.0%) | 0 (0.0%) |
| 5 to 17 Years | 0 (0.0%) | 0 (0.0%) |
| 18 to 34 Years | 0 (0.0%) | 0 (0.0%) |
| 35 to 64 Years | 0 (0.0%) | 9 (10.3%) |
| 65 to 74 Years | 0 (0.0%) | 0 (0.0%) |
| 75 Years and over | 0 (0.0%) | 0 (0.0%) |
Disability Class: Cognitive Difficulty
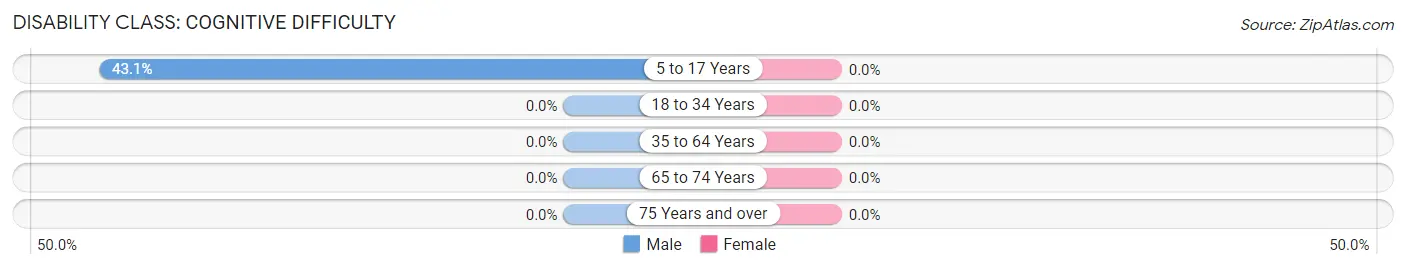
| Age Bracket | Male | Female |
| 5 to 17 Years | 28 (43.1%) | 0 (0.0%) |
| 18 to 34 Years | 0 (0.0%) | 0 (0.0%) |
| 35 to 64 Years | 0 (0.0%) | 0 (0.0%) |
| 65 to 74 Years | 0 (0.0%) | 0 (0.0%) |
| 75 Years and over | 0 (0.0%) | 0 (0.0%) |
Disability Class: Ambulatory Difficulty
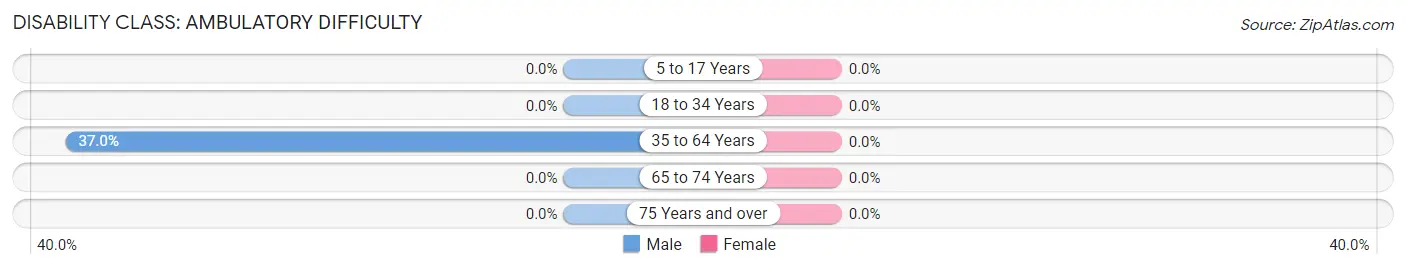
| Age Bracket | Male | Female |
| 5 to 17 Years | 0 (0.0%) | 0 (0.0%) |
| 18 to 34 Years | 0 (0.0%) | 0 (0.0%) |
| 35 to 64 Years | 34 (37.0%) | 0 (0.0%) |
| 65 to 74 Years | 0 (0.0%) | 0 (0.0%) |
| 75 Years and over | 0 (0.0%) | 0 (0.0%) |
Disability Class: Self-Care Difficulty

| Age Bracket | Male | Female |
| 5 to 17 Years | 14 (21.5%) | 0 (0.0%) |
| 18 to 34 Years | 0 (0.0%) | 0 (0.0%) |
| 35 to 64 Years | 0 (0.0%) | 0 (0.0%) |
| 65 to 74 Years | 0 (0.0%) | 0 (0.0%) |
| 75 Years and over | 0 (0.0%) | 0 (0.0%) |
Technology Access in Millerville
Computing Device Access in Millerville
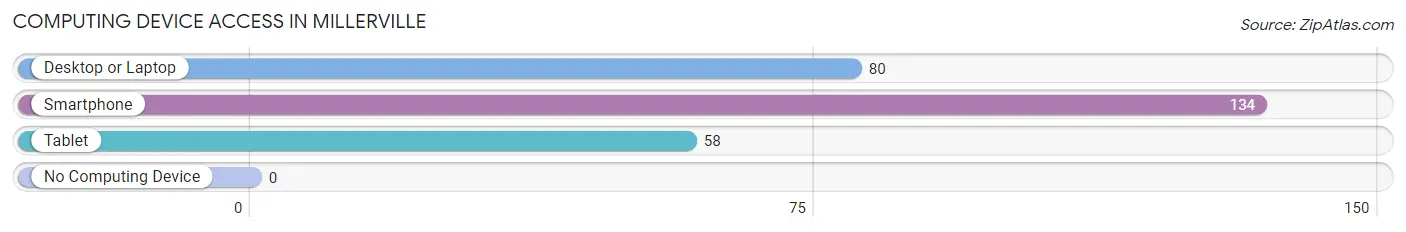
| Device Type | # Households | % Households |
| Desktop or Laptop | 80 | 54.4% |
| Smartphone | 134 | 91.2% |
| Tablet | 58 | 39.5% |
| No Computing Device | 0 | 0.0% |
| Total | 147 | 100.0% |
Internet Access in Millerville
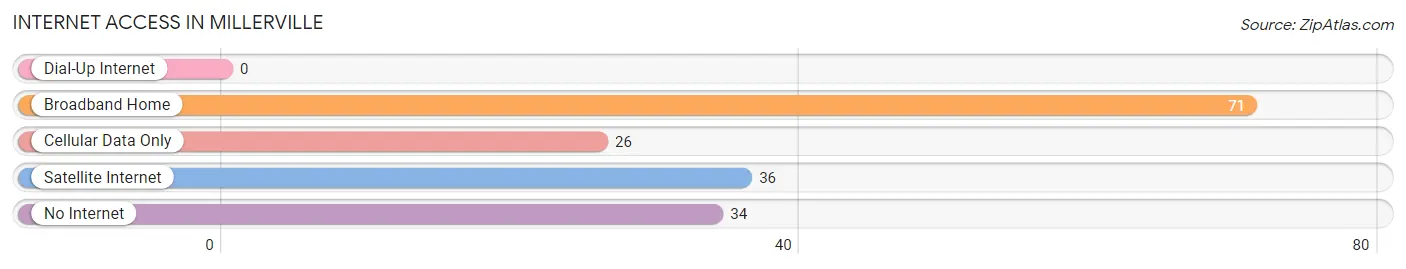
| Internet Type | # Households | % Households |
| Dial-Up Internet | 0 | 0.0% |
| Broadband Home | 71 | 48.3% |
| Cellular Data Only | 26 | 17.7% |
| Satellite Internet | 36 | 24.5% |
| No Internet | 34 | 23.1% |
| Total | 147 | 100.0% |
Millerville Summary
Millerville is a small town located in the state of Alabama, in the United States. It is situated in the northwest corner of the state, in the foothills of the Appalachian Mountains. The town is located in DeKalb County, and is part of the Fort Payne Metropolitan Statistical Area. As of the 2010 census, the population of Millerville was 1,845.
History
Millerville was founded in 1836 by a group of settlers from North Carolina. The town was named after the local mill, which was built by the settlers to grind their grain. The mill was powered by a nearby creek, and was the first of its kind in the area. The town quickly grew, and by the time of the Civil War, it had become a thriving community. During the war, the town was occupied by Union forces, and the mill was destroyed. After the war, the town was rebuilt, and the mill was replaced by a larger one.
In the late 19th century, Millerville became a popular tourist destination, due to its proximity to the nearby Lookout Mountain. The town was also home to several large factories, which produced textiles, furniture, and other goods. The town continued to grow throughout the 20th century, and by the 2000 census, the population had reached 1,845.
Geography
Millerville is located in the northwest corner of Alabama, in the foothills of the Appalachian Mountains. The town is situated in DeKalb County, and is part of the Fort Payne Metropolitan Statistical Area. The town is located at the intersection of U.S. Route 11 and Alabama State Route 75. The town is situated at an elevation of 1,068 feet (325 m) above sea level.
The climate in Millerville is humid subtropical, with hot, humid summers and mild winters. The average annual temperature is 64°F (18°C), and the average annual precipitation is 52 inches (132 cm).
Economy
The economy of Millerville is largely based on agriculture and manufacturing. The town is home to several large factories, which produce textiles, furniture, and other goods. The town is also home to several small businesses, including restaurants, shops, and other services.
The town is also home to several tourist attractions, including the Lookout Mountain, which is located nearby. The town is also home to several parks, including the Millerville Park, which features a playground, picnic areas, and a walking trail.
Demographics
As of the 2010 census, the population of Millerville was 1,845. The racial makeup of the town was 95.3% White, 0.7% African American, 0.3% Native American, 0.2% Asian, 0.1% Pacific Islander, 1.7% from other races, and 1.9% from two or more races. Hispanic or Latino of any race were 3.2% of the population.
The median income for a household in Millerville was $30,938, and the median income for a family was $37,917. The per capita income for the town was $15,945. About 17.2% of families and 20.2% of the population were below the poverty line, including 28.3% of those under age 18 and 11.2% of those age 65 or over.
Common Questions
What is Per Capita Income in Millerville?
Per Capita income in Millerville is $25,847.
What is the Median Family Income in Millerville?
Median Family Income in Millerville is $95,313.
What is the Median Household income in Millerville?
Median Household Income in Millerville is $81,875.
What is Inequality or Gini Index in Millerville?
Inequality or Gini Index in Millerville is 0.26.
What is the Total Population of Millerville?
Total Population of Millerville is 473.
What is the Total Male Population of Millerville?
Total Male Population of Millerville is 268.
What is the Total Female Population of Millerville?
Total Female Population of Millerville is 205.
What is the Ratio of Males per 100 Females in Millerville?
There are 130.73 Males per 100 Females in Millerville.
What is the Ratio of Females per 100 Males in Millerville?
There are 76.49 Females per 100 Males in Millerville.
What is the Median Population Age in Millerville?
Median Population Age in Millerville is 40.0 Years.
What is the Average Family Size in Millerville
Average Family Size in Millerville is 4.3 People.
What is the Average Household Size in Millerville
Average Household Size in Millerville is 3.2 People.
How Large is the Labor Force in Millerville?
There are 174 People in the Labor Forcein in Millerville.
What is the Percentage of People in the Labor Force in Millerville?
52.4% of People are in the Labor Force in Millerville.