Lineville, AL
Lineville Map
Lineville Overview
2,733
TOTAL POPULATION
1,265
MALE POPULATION
1,468
FEMALE POPULATION
86.17
MALES / 100 FEMALES
116.05
FEMALES / 100 MALES
53.0
MEDIAN AGE
3.0
AVG FAMILY SIZE
2.2
AVG HOUSEHOLD SIZE
$25,789
PER CAPITA INCOME
$60,403
AVG FAMILY INCOME
$35,435
AVG HOUSEHOLD INCOME
38.6%
WAGE / INCOME GAP [ % ]
61.4¢/ $1
WAGE / INCOME GAP [ $ ]
0.48
INEQUALITY / GINI INDEX
1,010
LABOR FORCE [ PEOPLE ]
44.7%
PERCENT IN LABOR FORCE
7.2%
UNEMPLOYMENT RATE
Lineville Zip Codes
Lineville Area Codes
Race in Lineville
The most populous races in Lineville are White / Caucasian (1,616 | 59.1%), Black / African American (969 | 35.5%), and Some other Race (83 | 3.0%).
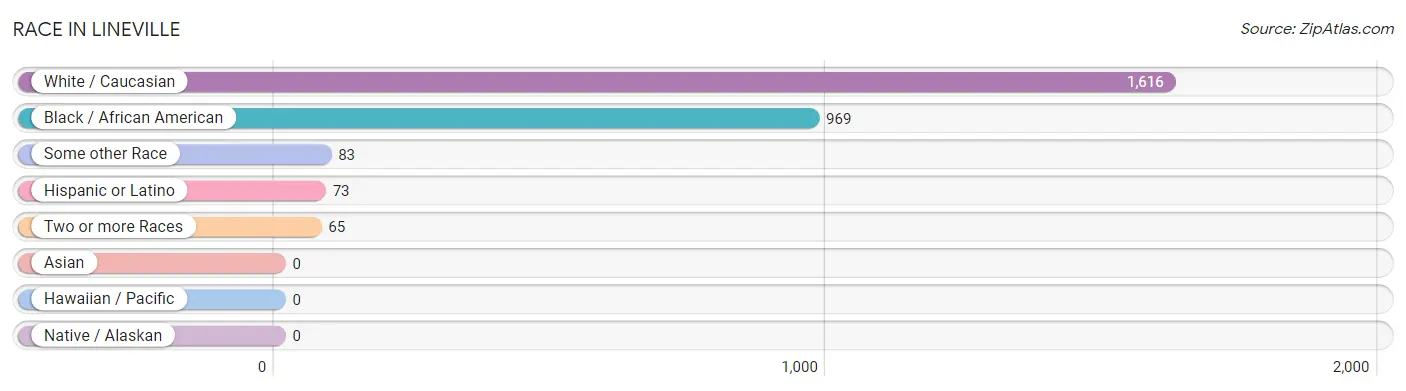
| Race | # Population | % Population |
| Asian | 0 | 0.0% |
| Black / African American | 969 | 35.5% |
| Hawaiian / Pacific | 0 | 0.0% |
| Hispanic or Latino | 73 | 2.7% |
| Native / Alaskan | 0 | 0.0% |
| White / Caucasian | 1,616 | 59.1% |
| Two or more Races | 65 | 2.4% |
| Some other Race | 83 | 3.0% |
| Total | 2,733 | 100.0% |
Ancestry in Lineville
The most populous ancestries reported in Lineville are American (446 | 16.3%), English (330 | 12.1%), Irish (238 | 8.7%), German (97 | 3.5%), and European (73 | 2.7%), together accounting for 43.3% of all Lineville residents.
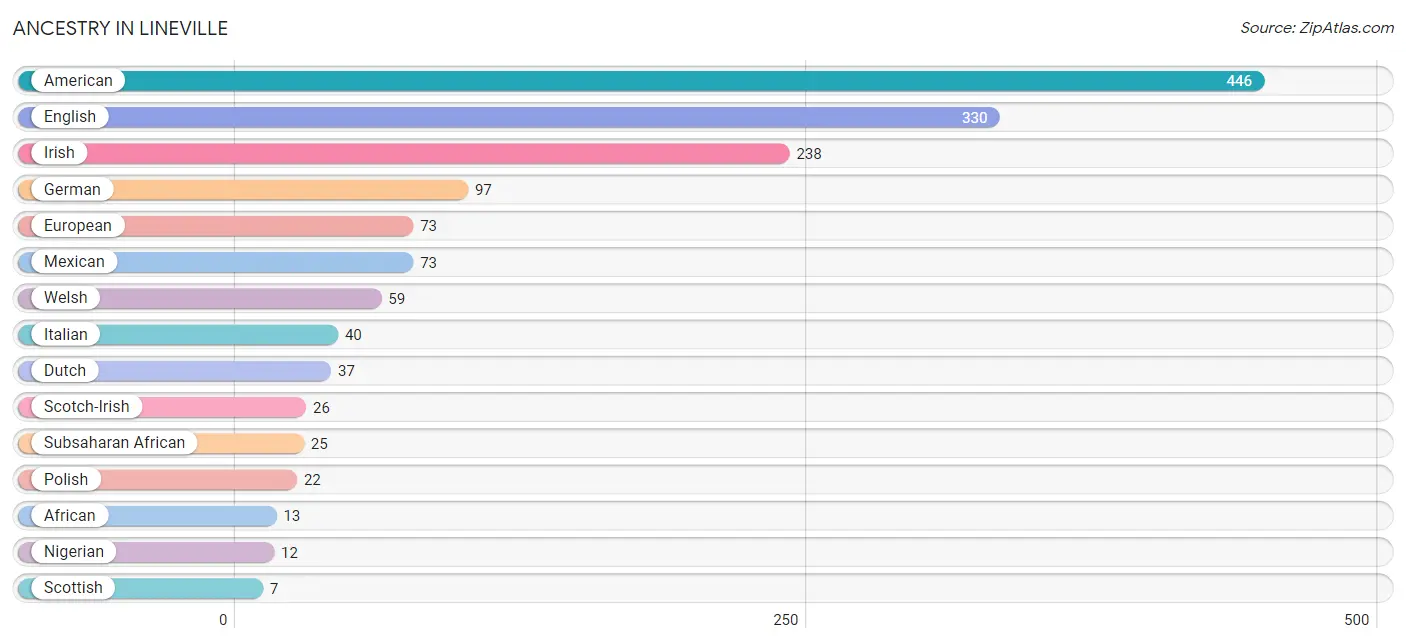
| Ancestry | # Population | % Population |
| African | 13 | 0.5% |
| American | 446 | 16.3% |
| Dutch | 37 | 1.3% |
| English | 330 | 12.1% |
| European | 73 | 2.7% |
| French | 4 | 0.2% |
| German | 97 | 3.5% |
| Irish | 238 | 8.7% |
| Italian | 40 | 1.5% |
| Mexican | 73 | 2.7% |
| Nigerian | 12 | 0.4% |
| Norwegian | 5 | 0.2% |
| Polish | 22 | 0.8% |
| Romanian | 5 | 0.2% |
| Scotch-Irish | 26 | 0.9% |
| Scottish | 7 | 0.3% |
| Subsaharan African | 25 | 0.9% |
| Swedish | 6 | 0.2% |
| Welsh | 59 | 2.2% | View All 19 Rows |
Immigrants in Lineville
The most numerous immigrant groups reported in Lineville came from Central America (30 | 1.1%), Latin America (30 | 1.1%), and Mexico (30 | 1.1%), together accounting for 3.3% of all Lineville residents.
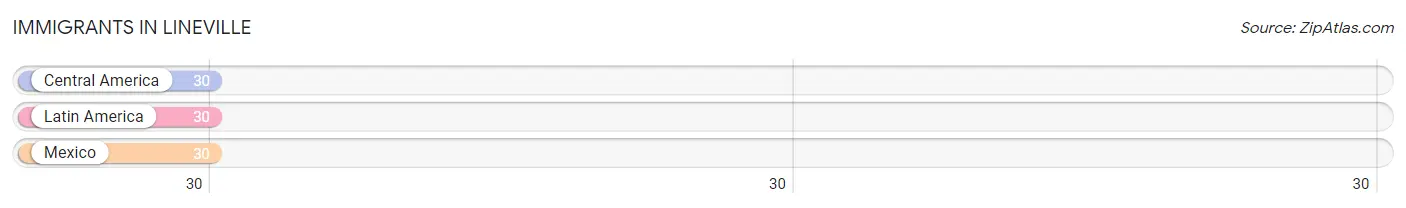
| Immigration Origin | # Population | % Population |
| Central America | 30 | 1.1% |
| Latin America | 30 | 1.1% |
| Mexico | 30 | 1.1% | View All 3 Rows |
Sex and Age in Lineville
Sex and Age in Lineville
The most populous age groups in Lineville are 60 to 64 Years (204 | 16.1%) for men and 55 to 59 Years (182 | 12.4%) for women.
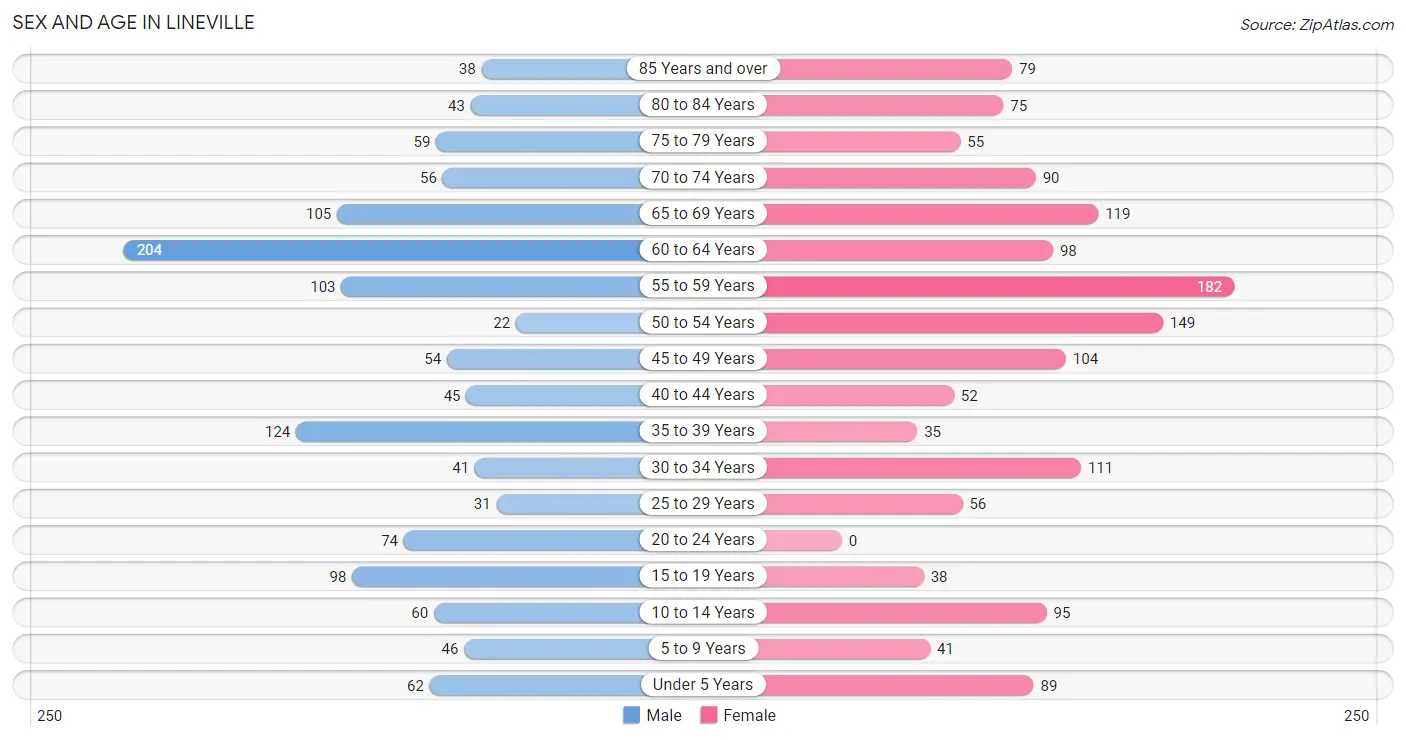
| Age Bracket | Male | Female |
| Under 5 Years | 62 (4.9%) | 89 (6.1%) |
| 5 to 9 Years | 46 (3.6%) | 41 (2.8%) |
| 10 to 14 Years | 60 (4.7%) | 95 (6.5%) |
| 15 to 19 Years | 98 (7.7%) | 38 (2.6%) |
| 20 to 24 Years | 74 (5.9%) | 0 (0.0%) |
| 25 to 29 Years | 31 (2.5%) | 56 (3.8%) |
| 30 to 34 Years | 41 (3.2%) | 111 (7.6%) |
| 35 to 39 Years | 124 (9.8%) | 35 (2.4%) |
| 40 to 44 Years | 45 (3.6%) | 52 (3.5%) |
| 45 to 49 Years | 54 (4.3%) | 104 (7.1%) |
| 50 to 54 Years | 22 (1.7%) | 149 (10.2%) |
| 55 to 59 Years | 103 (8.1%) | 182 (12.4%) |
| 60 to 64 Years | 204 (16.1%) | 98 (6.7%) |
| 65 to 69 Years | 105 (8.3%) | 119 (8.1%) |
| 70 to 74 Years | 56 (4.4%) | 90 (6.1%) |
| 75 to 79 Years | 59 (4.7%) | 55 (3.7%) |
| 80 to 84 Years | 43 (3.4%) | 75 (5.1%) |
| 85 Years and over | 38 (3.0%) | 79 (5.4%) |
| Total | 1,265 (100.0%) | 1,468 (100.0%) |
Families and Households in Lineville
Median Family Size in Lineville
The median family size in Lineville is 2.95 persons per family, with single male/father families (64 | 9.1%) accounting for the largest median family size of 4.52 persons per family. On the other hand, married-couple families (521 | 73.8%) represent the smallest median family size with 2.73 persons per family.
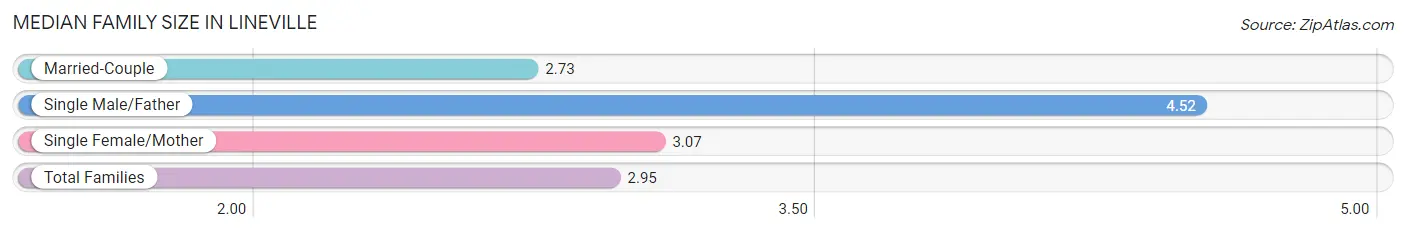
| Family Type | # Families | Family Size |
| Married-Couple | 521 (73.8%) | 2.73 |
| Single Male/Father | 64 (9.1%) | 4.52 |
| Single Female/Mother | 121 (17.1%) | 3.07 |
| Total Families | 706 (100.0%) | 2.95 |
Median Household Size in Lineville
The median household size in Lineville is 2.18 persons per household, with single male/father households (64 | 5.3%) accounting for the largest median household size of 4.73 persons per household. non-family households (490 | 41.0%) represent the smallest median household size with 1.01 persons per household.
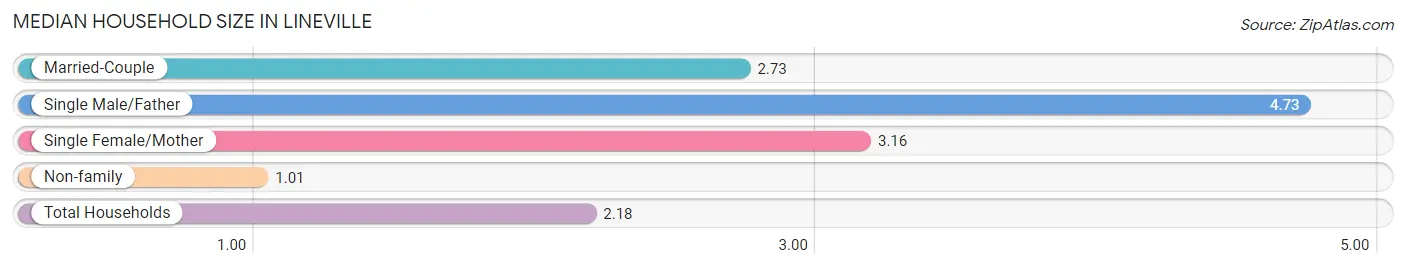
| Household Type | # Households | Household Size |
| Married-Couple | 521 (43.6%) | 2.73 |
| Single Male/Father | 64 (5.3%) | 4.73 |
| Single Female/Mother | 121 (10.1%) | 3.16 |
| Non-family | 490 (41.0%) | 1.01 |
| Total Households | 1,196 (100.0%) | 2.18 |
Household Size by Marriage Status in Lineville
Out of a total of 1,196 households in Lineville, 706 (59.0%) are family households, while 490 (41.0%) are nonfamily households. The most numerous type of family households are 2-person households, comprising 417, and the most common type of nonfamily households are 1-person households, comprising 483.
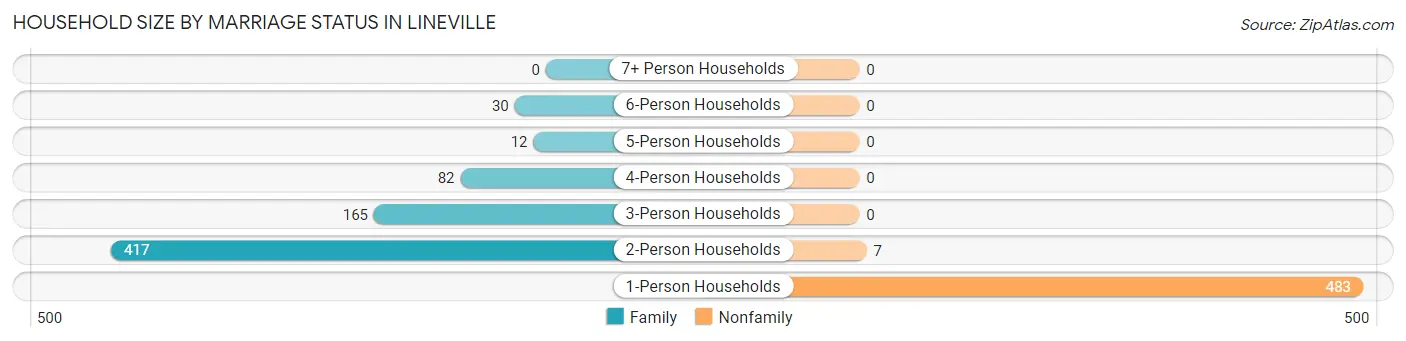
| Household Size | Family Households | Nonfamily Households |
| 1-Person Households | - | 483 (40.4%) |
| 2-Person Households | 417 (34.9%) | 7 (0.6%) |
| 3-Person Households | 165 (13.8%) | 0 (0.0%) |
| 4-Person Households | 82 (6.9%) | 0 (0.0%) |
| 5-Person Households | 12 (1.0%) | 0 (0.0%) |
| 6-Person Households | 30 (2.5%) | 0 (0.0%) |
| 7+ Person Households | 0 (0.0%) | 0 (0.0%) |
| Total | 706 (59.0%) | 490 (41.0%) |
Female Fertility in Lineville
Fertility by Age in Lineville
Average fertility rate in Lineville is 81.0 births per 1,000 women. Women in the age bracket of 20 to 34 years have the highest fertility rate with 210.0 births per 1,000 women. Women in the age bracket of 20 to 34 years acount for 100.0% of all women with births.
| Age Bracket | Women with Births | Births / 1,000 Women |
| 15 to 19 years | 0 (0.0%) | 0.0 |
| 20 to 34 years | 35 (100.0%) | 210.0 |
| 35 to 50 years | 0 (0.0%) | 0.0 |
| Total | 35 (100.0%) | 81.0 |
Fertility by Age by Marriage Status in Lineville
54.3% of women with births (35) in Lineville are married. The highest percentage of unmarried women with births falls into 20 to 34 years age bracket with 45.7% of them unmarried at the time of birth, while the lowest percentage of unmarried women with births belong to 20 to 34 years age bracket with 45.7% of them unmarried.
| Age Bracket | Married | Unmarried |
| 15 to 19 years | 0 (0.0%) | 0 (0.0%) |
| 20 to 34 years | 19 (54.3%) | 16 (45.7%) |
| 35 to 50 years | 0 (0.0%) | 0 (0.0%) |
| Total | 19 (54.3%) | 16 (45.7%) |
Fertility by Education in Lineville
| Educational Attainment | Women with Births | Births / 1,000 Women |
| Less than High School | 0 (0.0%) | 0.0 |
| High School Diploma | 16 (45.7%) | 68.0 |
| College or Associate's Degree | 19 (54.3%) | 209.0 |
| Bachelor's Degree | 0 (0.0%) | 0.0 |
| Graduate Degree | 0 (0.0%) | 0.0 |
| Total | 35 (100.0%) | 81.0 |
Fertility by Education by Marriage Status in Lineville
45.7% of women with births in Lineville are unmarried. Women with the educational attainment of college or associate's degree are most likely to be married with 100.0% of them married at childbirth, while women with the educational attainment of high school diploma are least likely to be married with 100.0% of them unmarried at childbirth.
| Educational Attainment | Married | Unmarried |
| Less than High School | 0 (0.0%) | 0 (0.0%) |
| High School Diploma | 0 (0.0%) | 16 (100.0%) |
| College or Associate's Degree | 19 (100.0%) | 0 (0.0%) |
| Bachelor's Degree | 0 (0.0%) | 0 (0.0%) |
| Graduate Degree | 0 (0.0%) | 0 (0.0%) |
| Total | 19 (54.3%) | 16 (45.7%) |
Income in Lineville
Income Overview in Lineville
Per Capita Income in Lineville is $25,789, while median incomes of families and households are $60,403 and $35,435 respectively.
| Characteristic | Number | Measure |
| Per Capita Income | 2,733 | $25,789 |
| Median Family Income | 706 | $60,403 |
| Mean Family Income | 706 | $71,298 |
| Median Household Income | 1,196 | $35,435 |
| Mean Household Income | 1,196 | $53,547 |
| Income Deficit | 706 | $0 |
| Wage / Income Gap (%) | 2,733 | 38.60% |
| Wage / Income Gap ($) | 2,733 | 61.40¢ per $1 |
| Gini / Inequality Index | 2,733 | 0.48 |
Earnings by Sex in Lineville
Average Earnings in Lineville are $34,524, $41,154 for men and $25,269 for women, a difference of 38.6%.
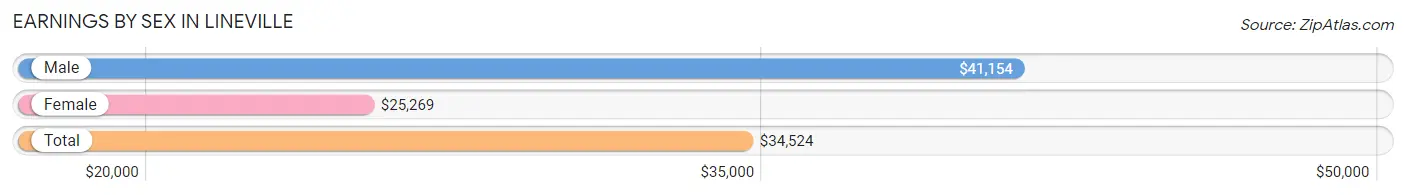
| Sex | Number | Average Earnings |
| Male | 544 (56.8%) | $41,154 |
| Female | 414 (43.2%) | $25,269 |
| Total | 958 (100.0%) | $34,524 |
Earnings by Sex by Income Bracket in Lineville
The most common earnings brackets in Lineville are $75,000 to $99,999 for men (85 | 15.6%) and $22,500 to $24,999 for women (72 | 17.4%).
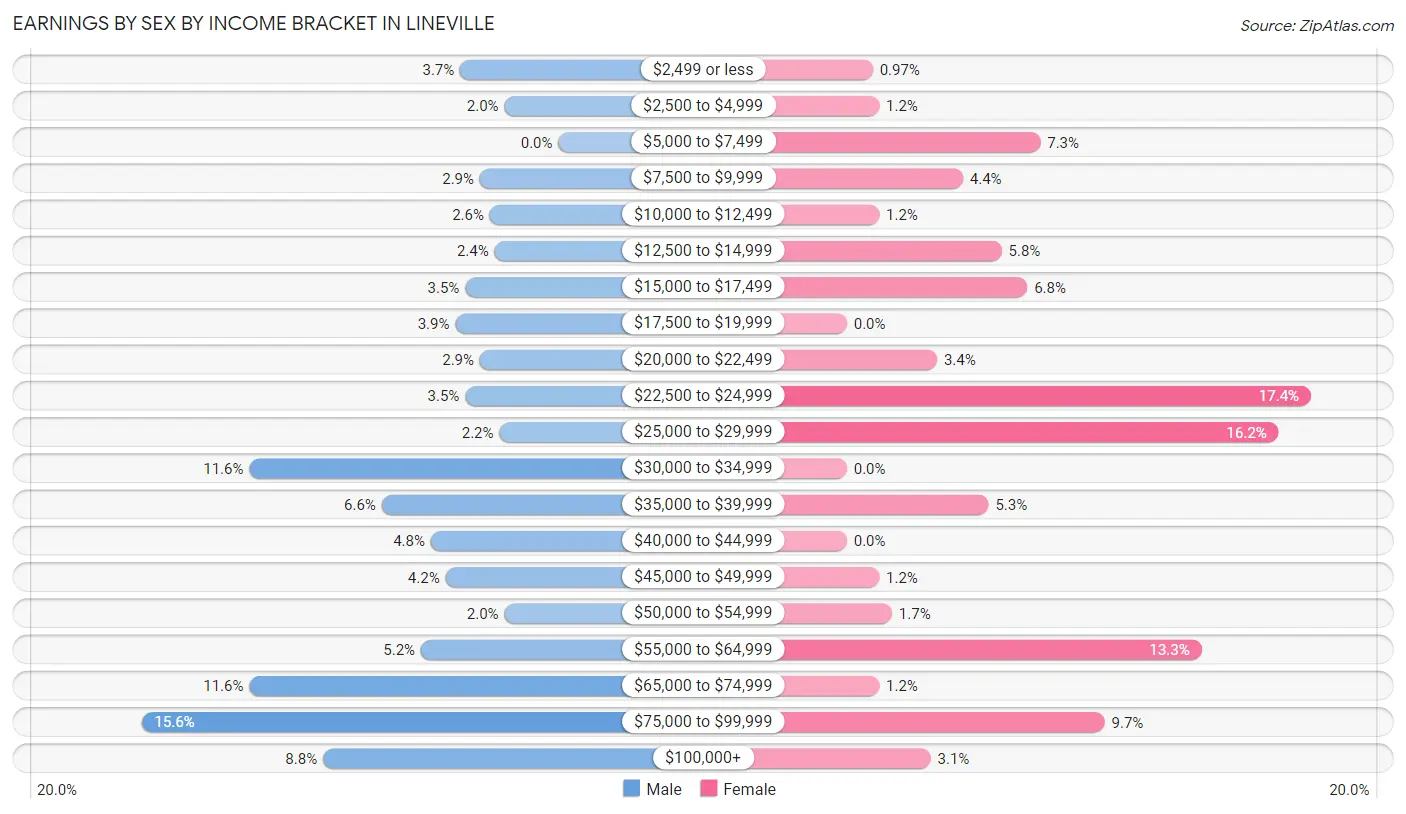
| Income | Male | Female |
| $2,499 or less | 20 (3.7%) | 4 (1.0%) |
| $2,500 to $4,999 | 11 (2.0%) | 5 (1.2%) |
| $5,000 to $7,499 | 0 (0.0%) | 30 (7.2%) |
| $7,500 to $9,999 | 16 (2.9%) | 18 (4.3%) |
| $10,000 to $12,499 | 14 (2.6%) | 5 (1.2%) |
| $12,500 to $14,999 | 13 (2.4%) | 24 (5.8%) |
| $15,000 to $17,499 | 19 (3.5%) | 28 (6.8%) |
| $17,500 to $19,999 | 21 (3.9%) | 0 (0.0%) |
| $20,000 to $22,499 | 16 (2.9%) | 14 (3.4%) |
| $22,500 to $24,999 | 19 (3.5%) | 72 (17.4%) |
| $25,000 to $29,999 | 12 (2.2%) | 67 (16.2%) |
| $30,000 to $34,999 | 63 (11.6%) | 0 (0.0%) |
| $35,000 to $39,999 | 36 (6.6%) | 22 (5.3%) |
| $40,000 to $44,999 | 26 (4.8%) | 0 (0.0%) |
| $45,000 to $49,999 | 23 (4.2%) | 5 (1.2%) |
| $50,000 to $54,999 | 11 (2.0%) | 7 (1.7%) |
| $55,000 to $64,999 | 28 (5.1%) | 55 (13.3%) |
| $65,000 to $74,999 | 63 (11.6%) | 5 (1.2%) |
| $75,000 to $99,999 | 85 (15.6%) | 40 (9.7%) |
| $100,000+ | 48 (8.8%) | 13 (3.1%) |
| Total | 544 (100.0%) | 414 (100.0%) |
Earnings by Sex by Educational Attainment in Lineville
Average earnings in Lineville are $50,000 for men and $25,308 for women, a difference of 49.4%. Men with an educational attainment of graduate degree enjoy the highest average annual earnings of $90,844, while those with high school diploma education earn the least with $39,583. Women with an educational attainment of bachelor's degree earn the most with the average annual earnings of $58,403, while those with less than high school education have the smallest earnings of $14,833.
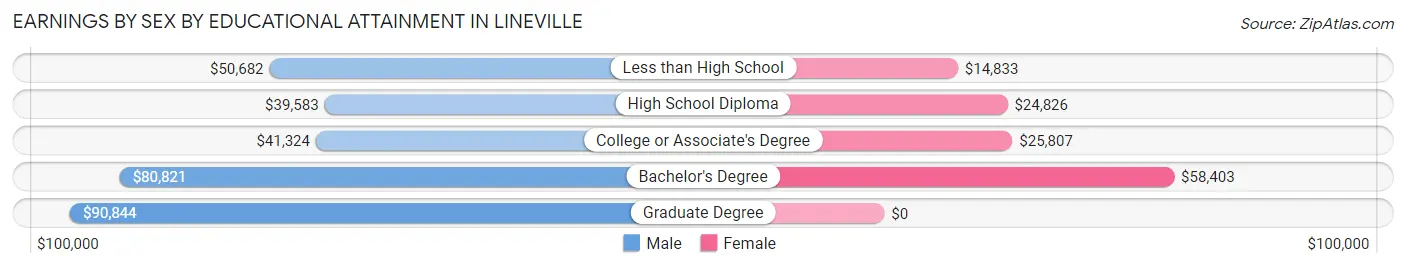
| Educational Attainment | Male Income | Female Income |
| Less than High School | $50,682 | $14,833 |
| High School Diploma | $39,583 | $24,826 |
| College or Associate's Degree | $41,324 | $25,807 |
| Bachelor's Degree | $80,821 | $58,403 |
| Graduate Degree | $90,844 | $0 |
| Total | $50,000 | $25,308 |
Family Income in Lineville
Family Income Brackets in Lineville
According to the Lineville family income data, there are 126 families falling into the $50,000 to $74,999 income range, which is the most common income bracket and makes up 17.8% of all families. Conversely, the $15,000 to $24,999 income bracket is the least frequent group with only 13 families (1.8%) belonging to this category.
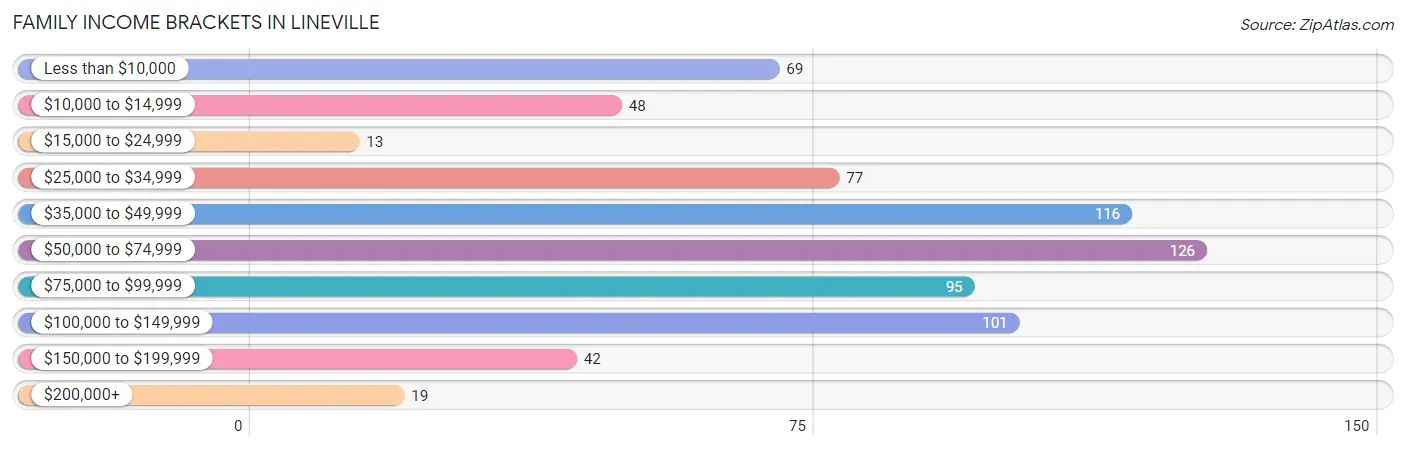
| Income Bracket | # Families | % Families |
| Less than $10,000 | 69 | 9.8% |
| $10,000 to $14,999 | 48 | 6.8% |
| $15,000 to $24,999 | 13 | 1.8% |
| $25,000 to $34,999 | 77 | 10.9% |
| $35,000 to $49,999 | 116 | 16.4% |
| $50,000 to $74,999 | 126 | 17.8% |
| $75,000 to $99,999 | 95 | 13.5% |
| $100,000 to $149,999 | 101 | 14.3% |
| $150,000 to $199,999 | 42 | 5.9% |
| $200,000+ | 19 | 2.7% |
Family Income by Famaliy Size in Lineville
2-person families (421 | 59.6%) account for the highest median family income in Lineville with $62,228 per family, while 2-person families (421 | 59.6%) have the highest median income of $31,114 per family member.
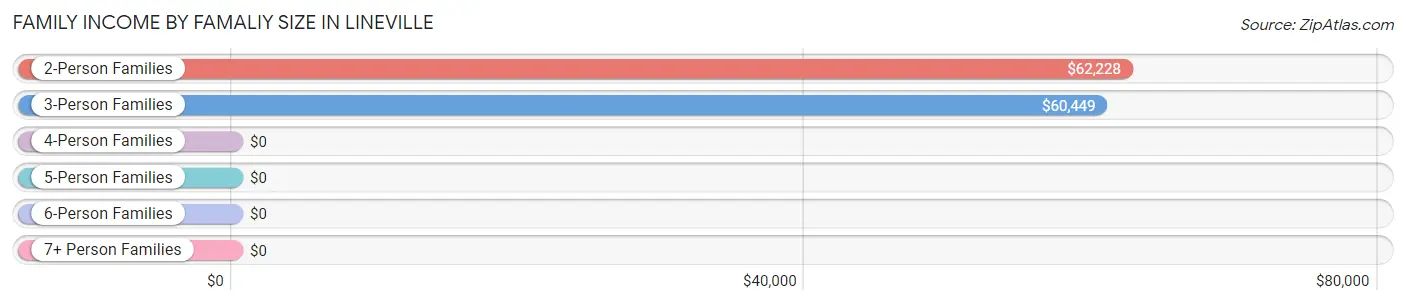
| Income Bracket | # Families | Median Income |
| 2-Person Families | 421 (59.6%) | $62,228 |
| 3-Person Families | 168 (23.8%) | $60,449 |
| 4-Person Families | 75 (10.6%) | $0 |
| 5-Person Families | 25 (3.5%) | $0 |
| 6-Person Families | 17 (2.4%) | $0 |
| 7+ Person Families | 0 (0.0%) | $0 |
| Total | 706 (100.0%) | $60,403 |
Family Income by Number of Earners in Lineville
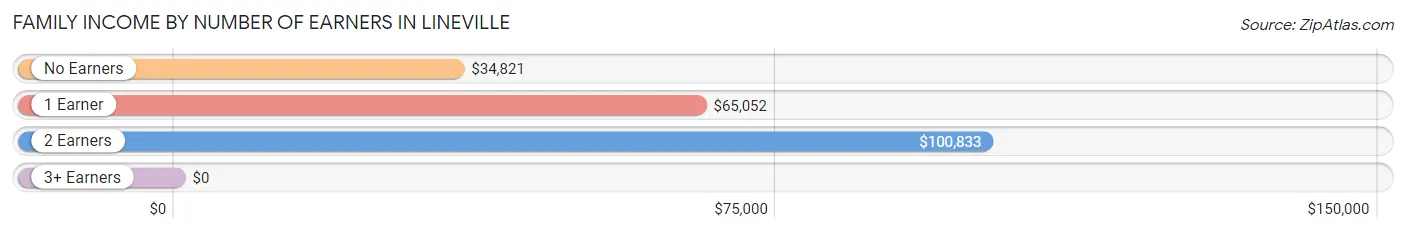
| Number of Earners | # Families | Median Income |
| No Earners | 229 (32.4%) | $34,821 |
| 1 Earner | 313 (44.3%) | $65,052 |
| 2 Earners | 164 (23.2%) | $100,833 |
| 3+ Earners | 0 (0.0%) | $0 |
| Total | 706 (100.0%) | $60,403 |
Household Income in Lineville
Household Income Brackets in Lineville
With 206 households falling in the category, the $50,000 to $74,999 income range is the most frequent in Lineville, accounting for 17.2% of all households. In contrast, only 19 households (1.6%) fall into the $200,000+ income bracket, making it the least populous group.
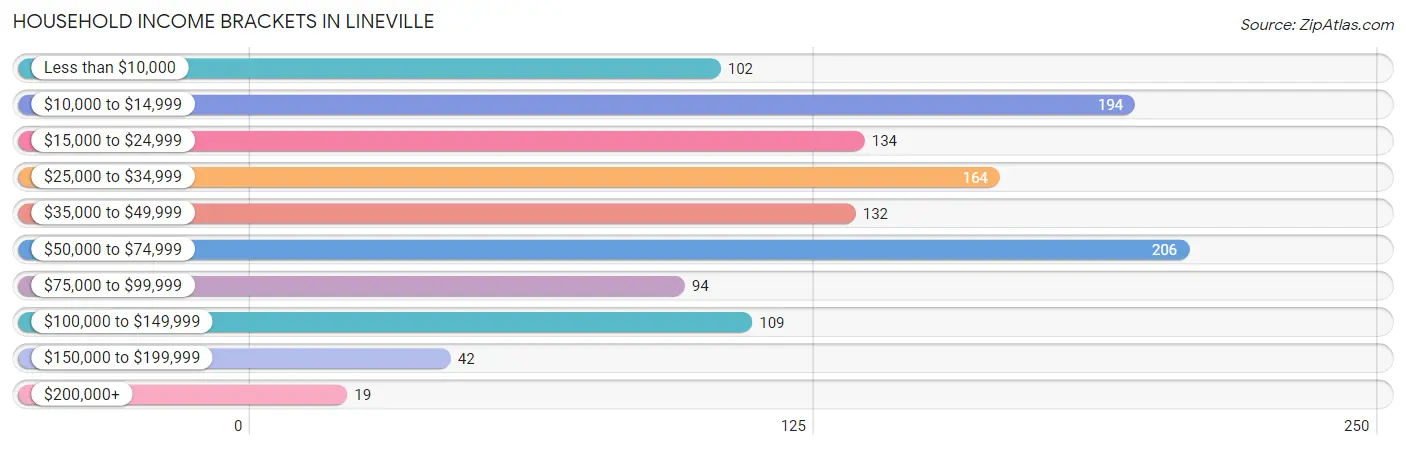
| Income Bracket | # Households | % Households |
| Less than $10,000 | 102 | 8.5% |
| $10,000 to $14,999 | 194 | 16.2% |
| $15,000 to $24,999 | 134 | 11.2% |
| $25,000 to $34,999 | 164 | 13.7% |
| $35,000 to $49,999 | 132 | 11.0% |
| $50,000 to $74,999 | 206 | 17.2% |
| $75,000 to $99,999 | 94 | 7.9% |
| $100,000 to $149,999 | 109 | 9.1% |
| $150,000 to $199,999 | 42 | 3.5% |
| $200,000+ | 19 | 1.6% |
Household Income by Householder Age in Lineville
The median household income in Lineville is $35,435, with the highest median household income of $52,917 found in the 45 to 64 years age bracket for the primary householder. A total of 558 households (46.7%) fall into this category.
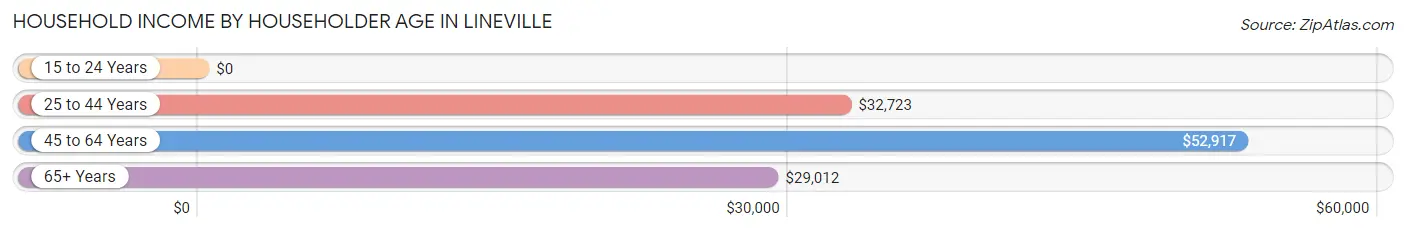
| Income Bracket | # Households | Median Income |
| 15 to 24 Years | 0 (0.0%) | $0 |
| 25 to 44 Years | 265 (22.2%) | $32,723 |
| 45 to 64 Years | 558 (46.7%) | $52,917 |
| 65+ Years | 373 (31.2%) | $29,012 |
| Total | 1,196 (100.0%) | $35,435 |
Poverty in Lineville
Income Below Poverty by Sex and Age in Lineville
With 22.9% poverty level for males and 29.1% for females among the residents of Lineville, 12 to 14 year old males and 6 to 11 year old females are the most vulnerable to poverty, with 19 males (76.0%) and 59 females (100.0%) in their respective age groups living below the poverty level.
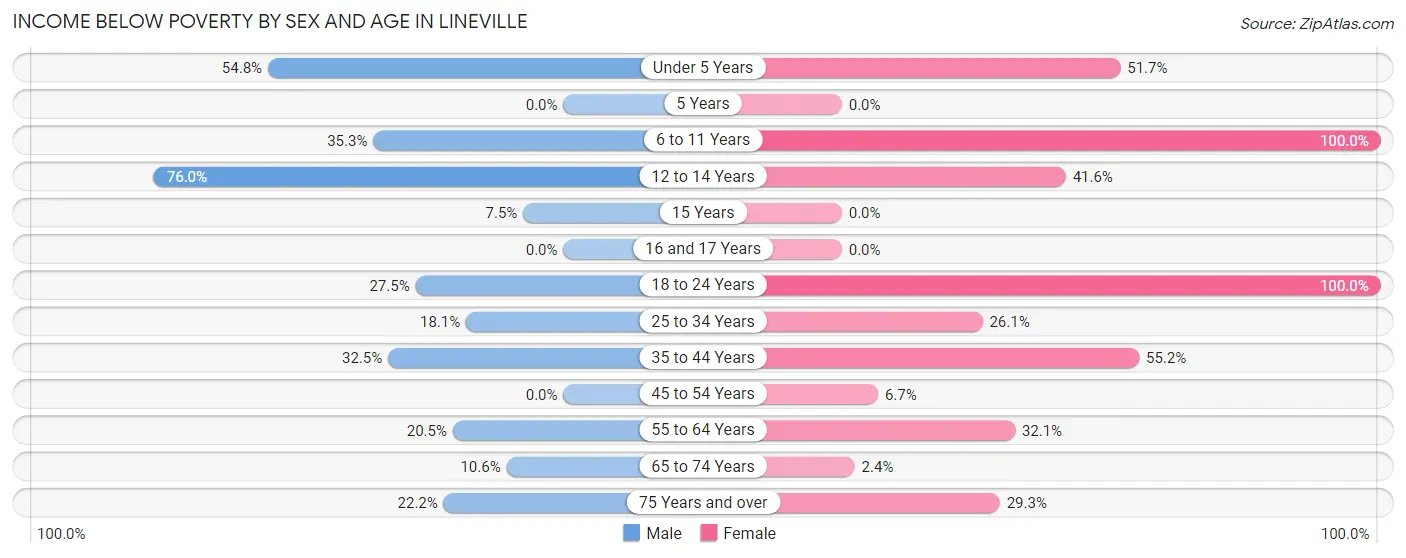
| Age Bracket | Male | Female |
| Under 5 Years | 34 (54.8%) | 46 (51.7%) |
| 5 Years | 0 (0.0%) | 0 (0.0%) |
| 6 to 11 Years | 24 (35.3%) | 59 (100.0%) |
| 12 to 14 Years | 19 (76.0%) | 32 (41.6%) |
| 15 Years | 5 (7.5%) | 0 (0.0%) |
| 16 and 17 Years | 0 (0.0%) | 0 (0.0%) |
| 18 to 24 Years | 28 (27.5%) | 25 (100.0%) |
| 25 to 34 Years | 13 (18.1%) | 41 (26.1%) |
| 35 to 44 Years | 55 (32.5%) | 48 (55.2%) |
| 45 to 54 Years | 0 (0.0%) | 17 (6.7%) |
| 55 to 64 Years | 63 (20.5%) | 90 (32.1%) |
| 65 to 74 Years | 17 (10.6%) | 5 (2.4%) |
| 75 Years and over | 22 (22.2%) | 39 (29.3%) |
| Total | 280 (22.9%) | 402 (29.1%) |
Income Above Poverty by Sex and Age in Lineville
According to the poverty statistics in Lineville, males aged 5 years and females aged 15 years are the age groups that are most secure financially, with 100.0% of males and 100.0% of females in these age groups living above the poverty line.
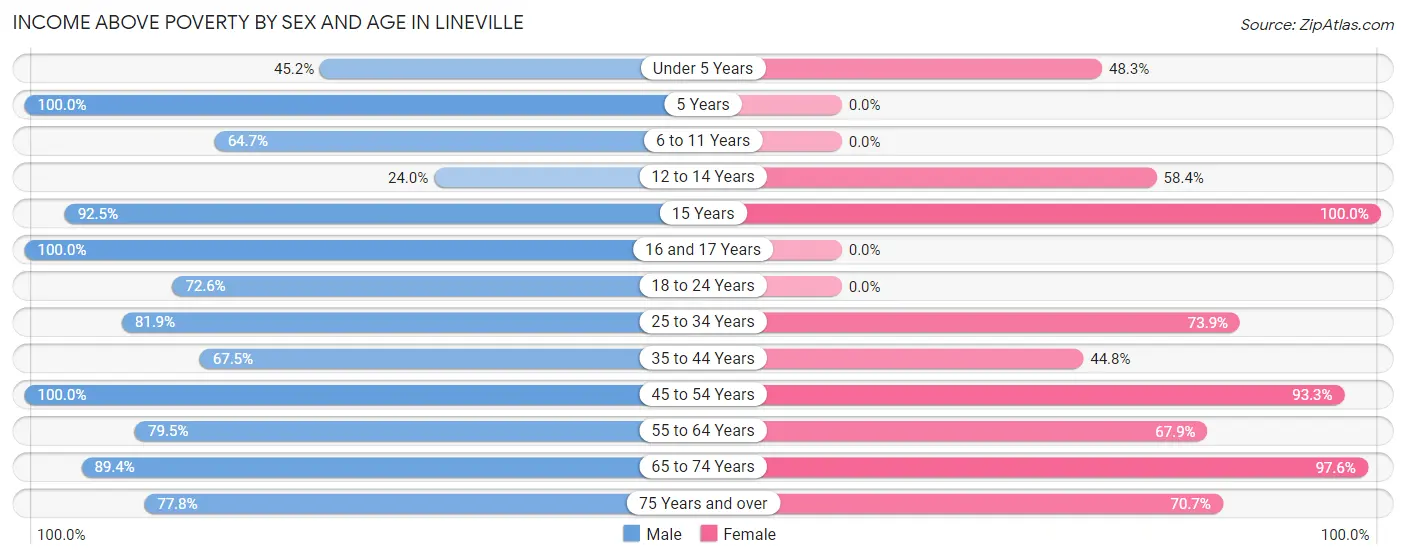
| Age Bracket | Male | Female |
| Under 5 Years | 28 (45.2%) | 43 (48.3%) |
| 5 Years | 13 (100.0%) | 0 (0.0%) |
| 6 to 11 Years | 44 (64.7%) | 0 (0.0%) |
| 12 to 14 Years | 6 (24.0%) | 45 (58.4%) |
| 15 Years | 62 (92.5%) | 13 (100.0%) |
| 16 and 17 Years | 3 (100.0%) | 0 (0.0%) |
| 18 to 24 Years | 74 (72.6%) | 0 (0.0%) |
| 25 to 34 Years | 59 (81.9%) | 116 (73.9%) |
| 35 to 44 Years | 114 (67.5%) | 39 (44.8%) |
| 45 to 54 Years | 76 (100.0%) | 236 (93.3%) |
| 55 to 64 Years | 244 (79.5%) | 190 (67.9%) |
| 65 to 74 Years | 144 (89.4%) | 204 (97.6%) |
| 75 Years and over | 77 (77.8%) | 94 (70.7%) |
| Total | 944 (77.1%) | 980 (70.9%) |
Income Below Poverty Among Married-Couple Families in Lineville
The poverty statistics for married-couple families in Lineville show that 8.6% or 45 of the total 521 families live below the poverty line. Families with 1 or 2 children have the highest poverty rate of 21.5%, comprising of 23 families. On the other hand, families with 3 or 4 children have the lowest poverty rate of 0.0%, which includes 0 families.
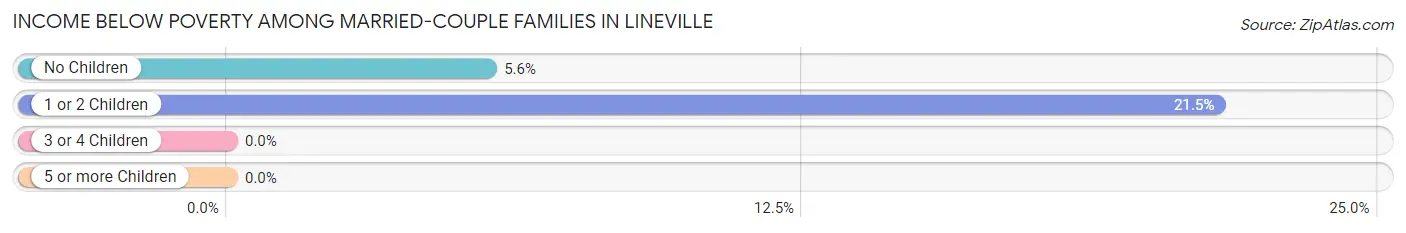
| Children | Above Poverty | Below Poverty |
| No Children | 368 (94.4%) | 22 (5.6%) |
| 1 or 2 Children | 84 (78.5%) | 23 (21.5%) |
| 3 or 4 Children | 24 (100.0%) | 0 (0.0%) |
| 5 or more Children | 0 (0.0%) | 0 (0.0%) |
| Total | 476 (91.4%) | 45 (8.6%) |
Income Below Poverty Among Single-Parent Households in Lineville
According to the poverty data in Lineville, 29.7% or 19 single-father households and 62.8% or 76 single-mother households are living below the poverty line. Among single-father households, those with 3 or 4 children have the highest poverty rate, with 19 households (100.0%) experiencing poverty. Likewise, among single-mother households, those with no children have the highest poverty rate, with 7 households (70.0%) falling below the poverty line.
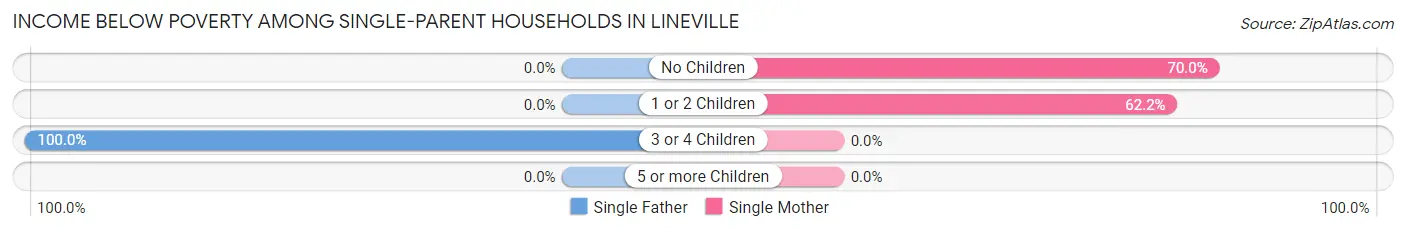
| Children | Single Father | Single Mother |
| No Children | 0 (0.0%) | 7 (70.0%) |
| 1 or 2 Children | 0 (0.0%) | 69 (62.2%) |
| 3 or 4 Children | 19 (100.0%) | 0 (0.0%) |
| 5 or more Children | 0 (0.0%) | 0 (0.0%) |
| Total | 19 (29.7%) | 76 (62.8%) |
Income Below Poverty Among Married-Couple vs Single-Parent Households in Lineville
The poverty data for Lineville shows that 45 of the married-couple family households (8.6%) and 95 of the single-parent households (51.3%) are living below the poverty level. Within the married-couple family households, those with 1 or 2 children have the highest poverty rate, with 23 households (21.5%) falling below the poverty line. Among the single-parent households, those with 3 or 4 children have the highest poverty rate, with 19 household (100.0%) living below poverty.
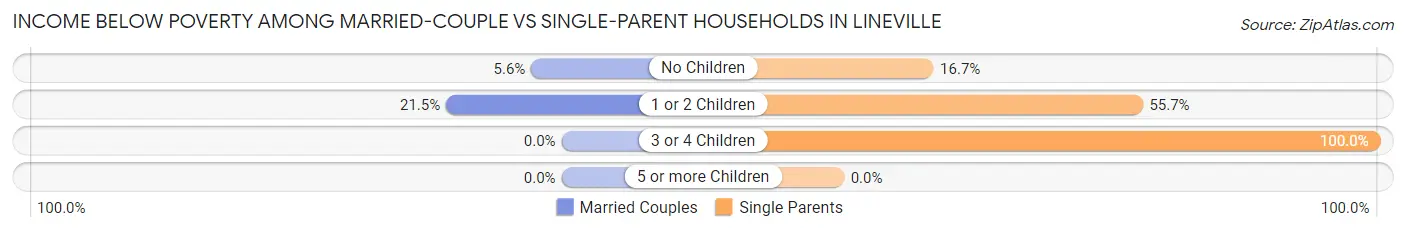
| Children | Married-Couple Families | Single-Parent Households |
| No Children | 22 (5.6%) | 7 (16.7%) |
| 1 or 2 Children | 23 (21.5%) | 69 (55.6%) |
| 3 or 4 Children | 0 (0.0%) | 19 (100.0%) |
| 5 or more Children | 0 (0.0%) | 0 (0.0%) |
| Total | 45 (8.6%) | 95 (51.3%) |
Employment Characteristics in Lineville
Employment by Class of Employer in Lineville
Among the 938 employed individuals in Lineville, private company employees (562 | 59.9%), local government employees (148 | 15.8%), and self-employed (not incorporated) (106 | 11.3%) make up the most common classes of employment.
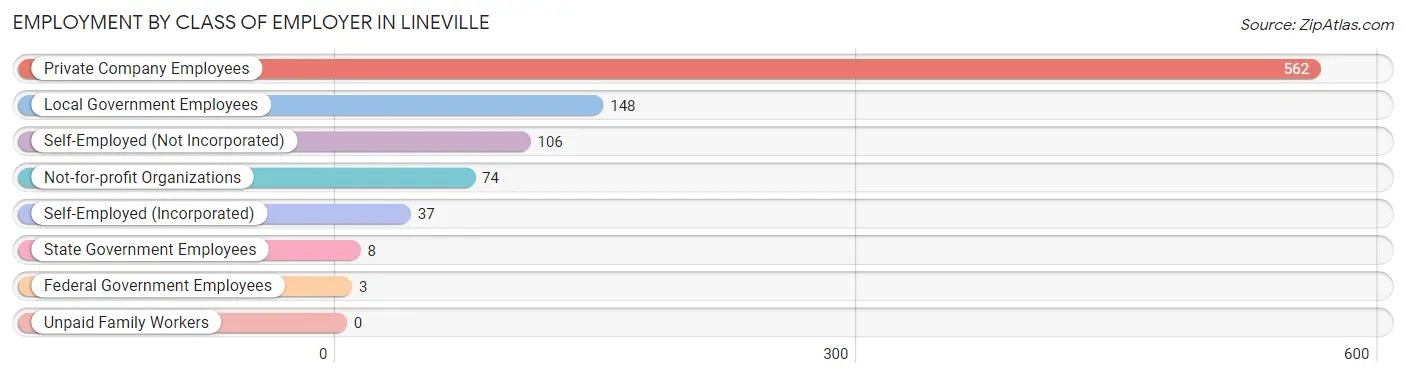
| Employer Class | # Employees | % Employees |
| Private Company Employees | 562 | 59.9% |
| Self-Employed (Incorporated) | 37 | 3.9% |
| Self-Employed (Not Incorporated) | 106 | 11.3% |
| Not-for-profit Organizations | 74 | 7.9% |
| Local Government Employees | 148 | 15.8% |
| State Government Employees | 8 | 0.9% |
| Federal Government Employees | 3 | 0.3% |
| Unpaid Family Workers | 0 | 0.0% |
| Total | 938 | 100.0% |
Employment Status by Age in Lineville
According to the labor force statistics for Lineville, out of the total population over 16 years of age (2,260), 44.7% or 1,010 individuals are in the labor force, with 7.2% or 73 of them unemployed. The age group with the highest labor force participation rate is 20 to 24 years, with 100.0% or 74 individuals in the labor force. Within the labor force, the 16 to 19 years age range has the highest percentage of unemployed individuals, with 100.0% or 28 of them being unemployed.
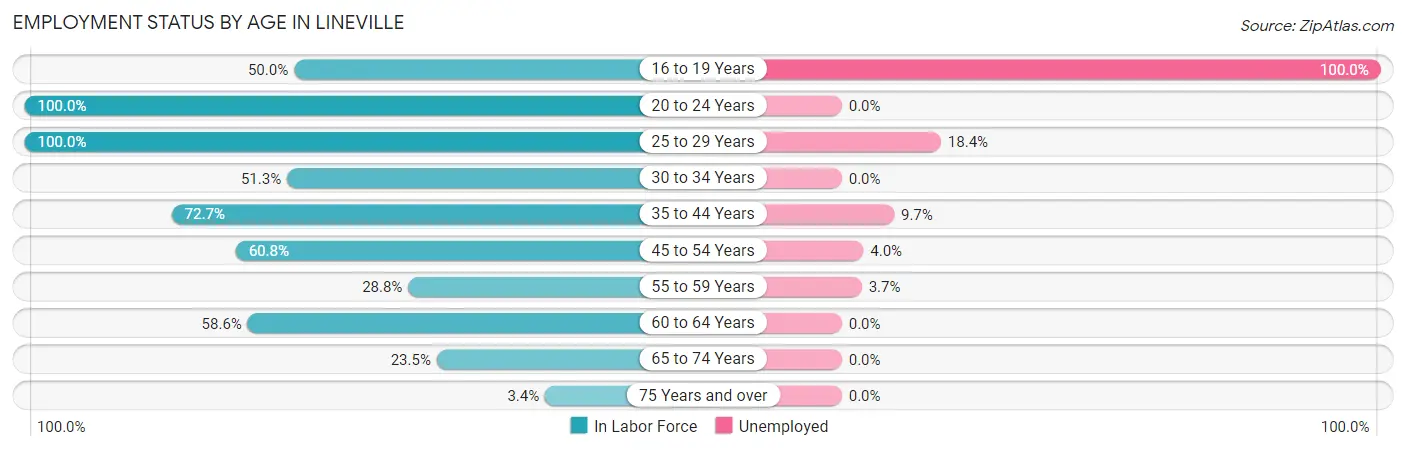
| Age Bracket | In Labor Force | Unemployed |
| 16 to 19 Years | 28 (50.0%) | 28 (100.0%) |
| 20 to 24 Years | 74 (100.0%) | 0 (0.0%) |
| 25 to 29 Years | 87 (100.0%) | 16 (18.4%) |
| 30 to 34 Years | 78 (51.3%) | 0 (0.0%) |
| 35 to 44 Years | 186 (72.7%) | 18 (9.7%) |
| 45 to 54 Years | 200 (60.8%) | 8 (4.0%) |
| 55 to 59 Years | 82 (28.8%) | 3 (3.7%) |
| 60 to 64 Years | 177 (58.6%) | 0 (0.0%) |
| 65 to 74 Years | 87 (23.5%) | 0 (0.0%) |
| 75 Years and over | 12 (3.4%) | 0 (0.0%) |
| Total | 1,010 (44.7%) | 73 (7.2%) |
Employment Status by Educational Attainment in Lineville
According to labor force statistics for Lineville, 57.4% of individuals (810) out of the total population between 25 and 64 years of age (1,411) are in the labor force, with 5.6% or 45 of them being unemployed. The group with the highest labor force participation rate are those with the educational attainment of bachelor's degree or higher, with 97.0% or 161 individuals in the labor force. Within the labor force, individuals with less than high school education have the highest percentage of unemployment, with 15.0% or 17 of them being unemployed.

| Educational Attainment | In Labor Force | Unemployed |
| Less than High School | 113 (55.1%) | 31 (15.0%) |
| High School Diploma | 310 (46.5%) | 35 (5.2%) |
| College / Associate Degree | 226 (60.6%) | 20 (5.3%) |
| Bachelor's Degree or higher | 161 (97.0%) | 0 (0.0%) |
| Total | 810 (57.4%) | 79 (5.6%) |
Employment Occupations by Sex in Lineville
Management, Business, Science and Arts Occupations
The most common Management, Business, Science and Arts occupations in Lineville are Community & Social Service (101 | 10.8%), Management (66 | 7.0%), Health Diagnosing & Treating (58 | 6.2%), Education Instruction & Library (44 | 4.7%), and Legal Services & Support (40 | 4.3%).
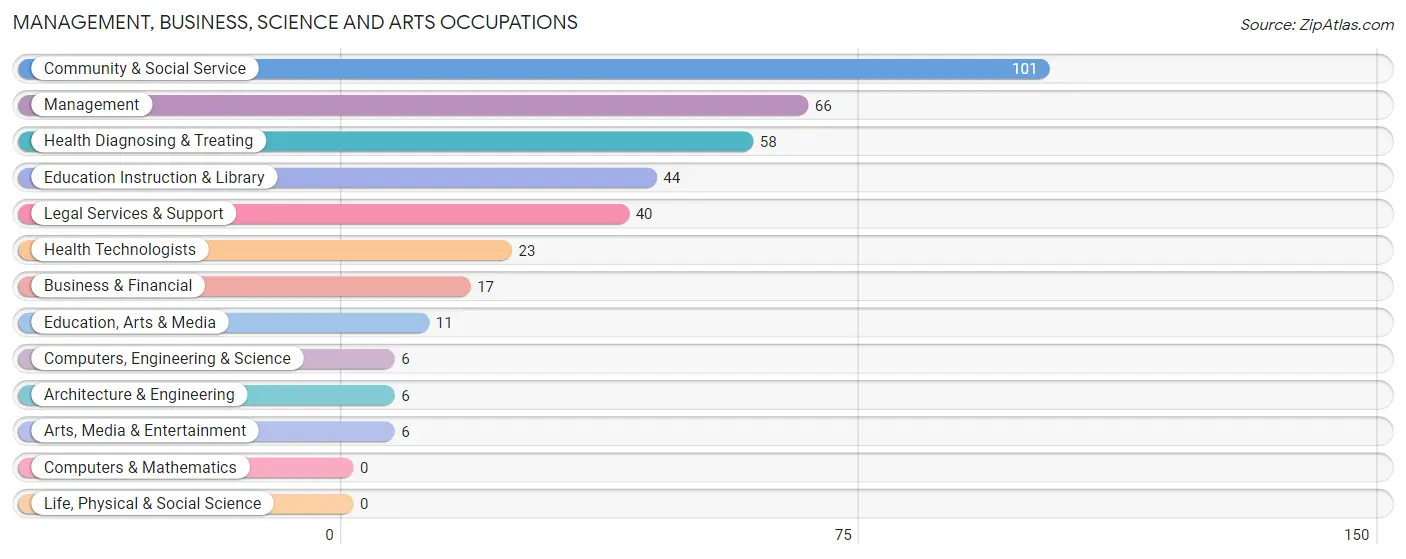
Management, Business, Science and Arts Occupations by Sex
Within the Management, Business, Science and Arts occupations in Lineville, the most male-oriented occupations are Computers, Engineering & Science (100.0%), Architecture & Engineering (100.0%), and Legal Services & Support (100.0%), while the most female-oriented occupations are Education Instruction & Library (100.0%), Health Diagnosing & Treating (100.0%), and Health Technologists (100.0%).
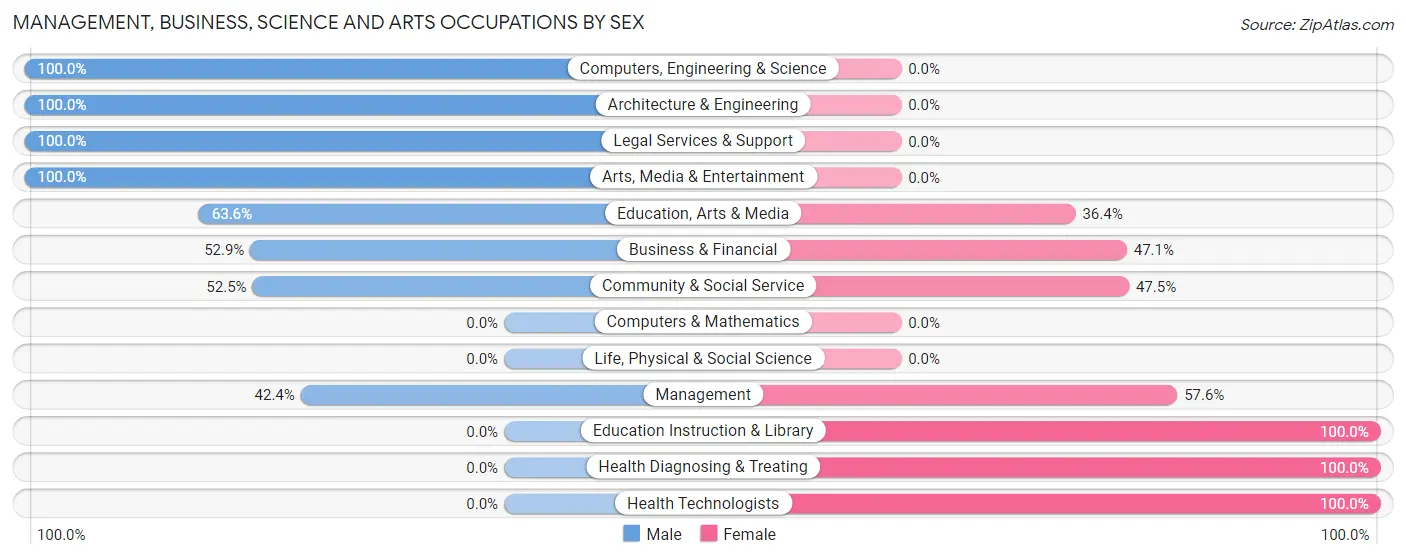
| Occupation | Male | Female |
| Management | 28 (42.4%) | 38 (57.6%) |
| Business & Financial | 9 (52.9%) | 8 (47.1%) |
| Computers, Engineering & Science | 6 (100.0%) | 0 (0.0%) |
| Computers & Mathematics | 0 (0.0%) | 0 (0.0%) |
| Architecture & Engineering | 6 (100.0%) | 0 (0.0%) |
| Life, Physical & Social Science | 0 (0.0%) | 0 (0.0%) |
| Community & Social Service | 53 (52.5%) | 48 (47.5%) |
| Education, Arts & Media | 7 (63.6%) | 4 (36.4%) |
| Legal Services & Support | 40 (100.0%) | 0 (0.0%) |
| Education Instruction & Library | 0 (0.0%) | 44 (100.0%) |
| Arts, Media & Entertainment | 6 (100.0%) | 0 (0.0%) |
| Health Diagnosing & Treating | 0 (0.0%) | 58 (100.0%) |
| Health Technologists | 0 (0.0%) | 23 (100.0%) |
| Total (Category) | 96 (38.7%) | 152 (61.3%) |
| Total (Overall) | 530 (56.5%) | 408 (43.5%) |
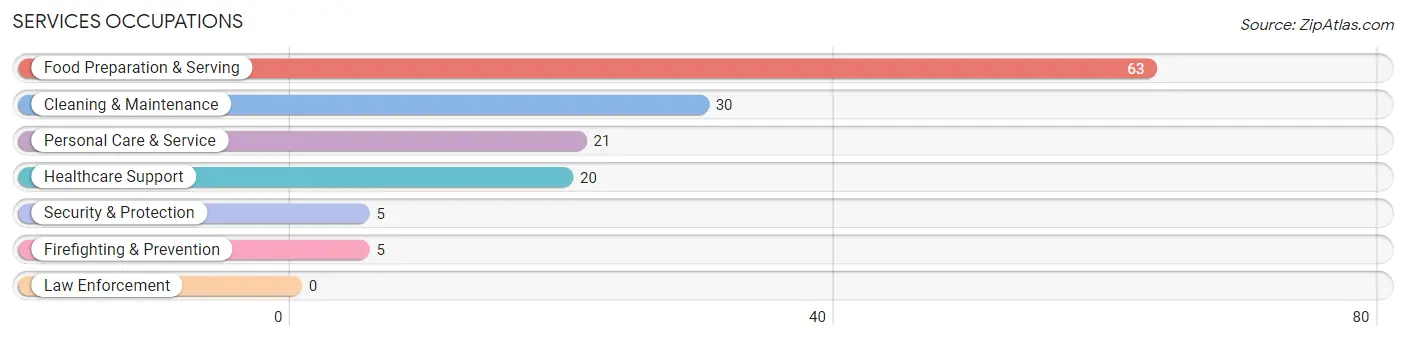
Services Occupations
The most common Services occupations in Lineville are Food Preparation & Serving (63 | 6.7%), Cleaning & Maintenance (30 | 3.2%), Personal Care & Service (21 | 2.2%), Healthcare Support (20 | 2.1%), and Security & Protection (5 | 0.5%).
Services Occupations by Sex
Within the Services occupations in Lineville, the most male-oriented occupations are Food Preparation & Serving (73.0%), Cleaning & Maintenance (60.0%), and Personal Care & Service (28.6%), while the most female-oriented occupations are Healthcare Support (100.0%), Security & Protection (100.0%), and Firefighting & Prevention (100.0%).
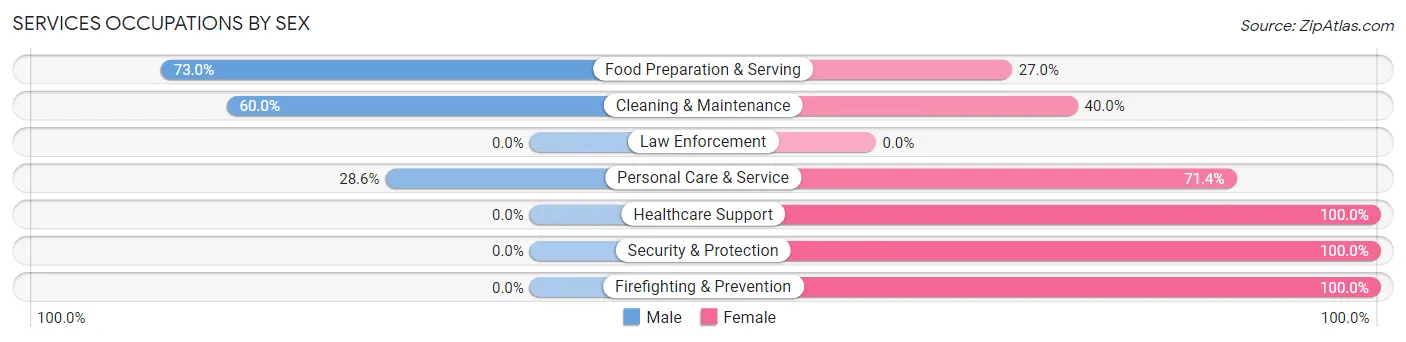
| Occupation | Male | Female |
| Healthcare Support | 0 (0.0%) | 20 (100.0%) |
| Security & Protection | 0 (0.0%) | 5 (100.0%) |
| Firefighting & Prevention | 0 (0.0%) | 5 (100.0%) |
| Law Enforcement | 0 (0.0%) | 0 (0.0%) |
| Food Preparation & Serving | 46 (73.0%) | 17 (27.0%) |
| Cleaning & Maintenance | 18 (60.0%) | 12 (40.0%) |
| Personal Care & Service | 6 (28.6%) | 15 (71.4%) |
| Total (Category) | 70 (50.4%) | 69 (49.6%) |
| Total (Overall) | 530 (56.5%) | 408 (43.5%) |
Sales and Office Occupations
The most common Sales and Office occupations in Lineville are Office & Administration (61 | 6.5%), and Sales & Related (58 | 6.2%).

Sales and Office Occupations by Sex
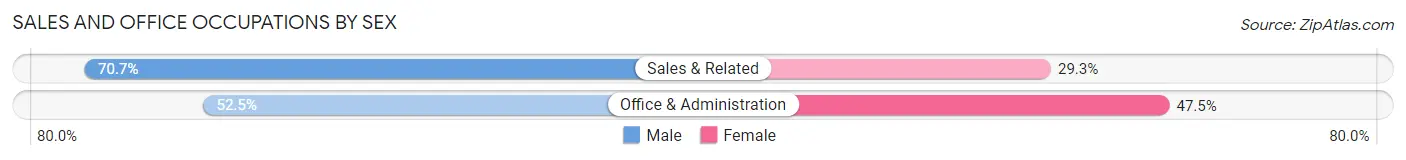
| Occupation | Male | Female |
| Sales & Related | 41 (70.7%) | 17 (29.3%) |
| Office & Administration | 32 (52.5%) | 29 (47.5%) |
| Total (Category) | 73 (61.3%) | 46 (38.7%) |
| Total (Overall) | 530 (56.5%) | 408 (43.5%) |
Natural Resources, Construction and Maintenance Occupations
The most common Natural Resources, Construction and Maintenance occupations in Lineville are Installation, Maintenance & Repair (62 | 6.6%), and Construction & Extraction (36 | 3.8%).

Natural Resources, Construction and Maintenance Occupations by Sex

| Occupation | Male | Female |
| Farming, Fishing & Forestry | 0 (0.0%) | 0 (0.0%) |
| Construction & Extraction | 22 (61.1%) | 14 (38.9%) |
| Installation, Maintenance & Repair | 55 (88.7%) | 7 (11.3%) |
| Total (Category) | 77 (78.6%) | 21 (21.4%) |
| Total (Overall) | 530 (56.5%) | 408 (43.5%) |
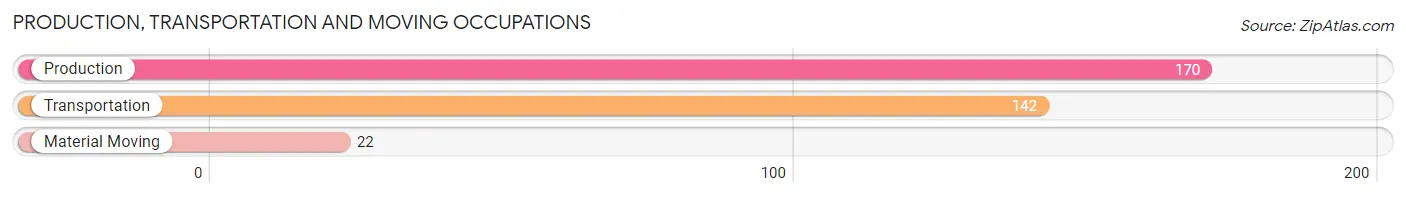
Production, Transportation and Moving Occupations
The most common Production, Transportation and Moving occupations in Lineville are Production (170 | 18.1%), Transportation (142 | 15.1%), and Material Moving (22 | 2.4%).
Production, Transportation and Moving Occupations by Sex
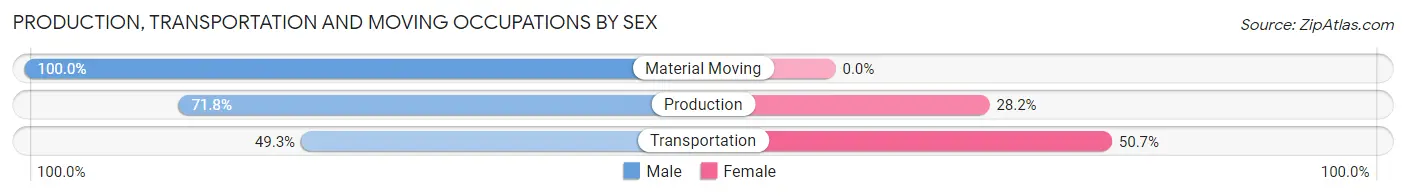
| Occupation | Male | Female |
| Production | 122 (71.8%) | 48 (28.2%) |
| Transportation | 70 (49.3%) | 72 (50.7%) |
| Material Moving | 22 (100.0%) | 0 (0.0%) |
| Total (Category) | 214 (64.1%) | 120 (35.9%) |
| Total (Overall) | 530 (56.5%) | 408 (43.5%) |
Employment Industries by Sex in Lineville
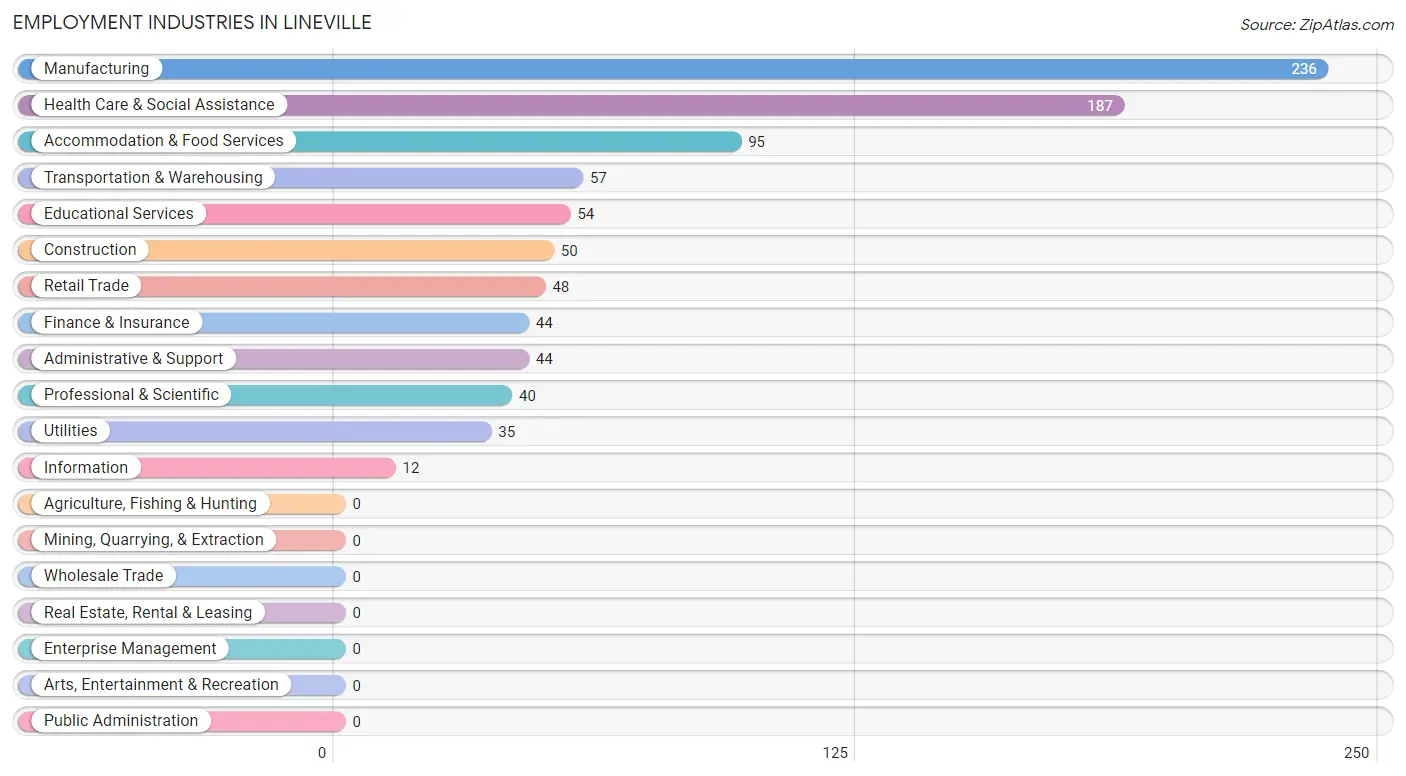
Employment Industries in Lineville
The major employment industries in Lineville include Manufacturing (236 | 25.2%), Health Care & Social Assistance (187 | 19.9%), Accommodation & Food Services (95 | 10.1%), Transportation & Warehousing (57 | 6.1%), and Educational Services (54 | 5.8%).
Employment Industries by Sex in Lineville
The Lineville industries that see more men than women are Utilities (100.0%), Finance & Insurance (100.0%), and Professional & Scientific (100.0%), whereas the industries that tend to have a higher number of women are Health Care & Social Assistance (94.1%), Educational Services (75.9%), and Retail Trade (75.0%).

| Industry | Male | Female |
| Agriculture, Fishing & Hunting | 0 (0.0%) | 0 (0.0%) |
| Mining, Quarrying, & Extraction | 0 (0.0%) | 0 (0.0%) |
| Construction | 43 (86.0%) | 7 (14.0%) |
| Manufacturing | 162 (68.6%) | 74 (31.4%) |
| Wholesale Trade | 0 (0.0%) | 0 (0.0%) |
| Retail Trade | 12 (25.0%) | 36 (75.0%) |
| Transportation & Warehousing | 54 (94.7%) | 3 (5.3%) |
| Utilities | 35 (100.0%) | 0 (0.0%) |
| Information | 7 (58.3%) | 5 (41.7%) |
| Finance & Insurance | 44 (100.0%) | 0 (0.0%) |
| Real Estate, Rental & Leasing | 0 (0.0%) | 0 (0.0%) |
| Professional & Scientific | 40 (100.0%) | 0 (0.0%) |
| Enterprise Management | 0 (0.0%) | 0 (0.0%) |
| Administrative & Support | 18 (40.9%) | 26 (59.1%) |
| Educational Services | 13 (24.1%) | 41 (75.9%) |
| Health Care & Social Assistance | 11 (5.9%) | 176 (94.1%) |
| Arts, Entertainment & Recreation | 0 (0.0%) | 0 (0.0%) |
| Accommodation & Food Services | 61 (64.2%) | 34 (35.8%) |
| Public Administration | 0 (0.0%) | 0 (0.0%) |
| Total | 530 (56.5%) | 408 (43.5%) |
Education in Lineville
School Enrollment in Lineville
The most common levels of schooling among the 497 students in Lineville are middle school (133 | 26.8%), college / undergraduate (127 | 25.6%), and high school (119 | 23.9%).
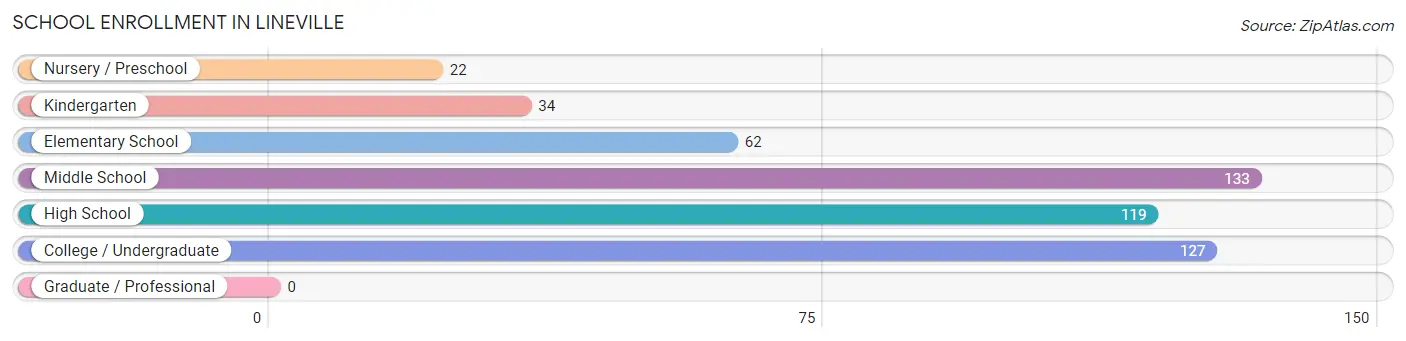
| School Level | # Students | % Students |
| Nursery / Preschool | 22 | 4.4% |
| Kindergarten | 34 | 6.8% |
| Elementary School | 62 | 12.5% |
| Middle School | 133 | 26.8% |
| High School | 119 | 23.9% |
| College / Undergraduate | 127 | 25.6% |
| Graduate / Professional | 0 | 0.0% |
| Total | 497 | 100.0% |
School Enrollment by Age by Funding Source in Lineville
Out of a total of 497 students who are enrolled in schools in Lineville, 46 (9.3%) attend a private institution, while the remaining 451 (90.7%) are enrolled in public schools. The age group of 10 to 14 year olds has the highest likelihood of being enrolled in private schools, with 23 (14.8% in the age bracket) enrolled. Conversely, the age group of 3 to 4 year olds has the lowest likelihood of being enrolled in a private school, with 22 (100.0% in the age bracket) attending a public institution.
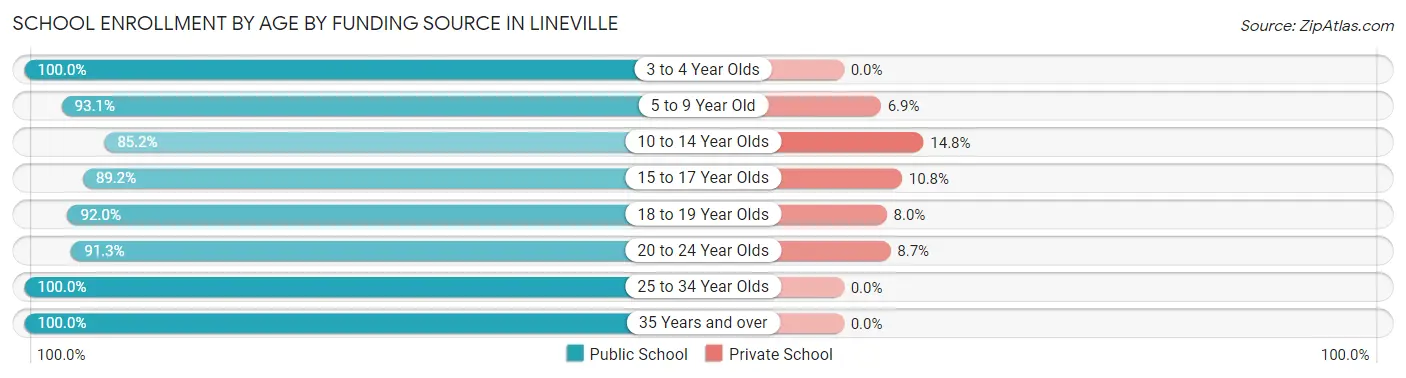
| Age Bracket | Public School | Private School |
| 3 to 4 Year Olds | 22 (100.0%) | 0 (0.0%) |
| 5 to 9 Year Old | 81 (93.1%) | 6 (6.9%) |
| 10 to 14 Year Olds | 132 (85.2%) | 23 (14.8%) |
| 15 to 17 Year Olds | 74 (89.2%) | 9 (10.8%) |
| 18 to 19 Year Olds | 23 (92.0%) | 2 (8.0%) |
| 20 to 24 Year Olds | 63 (91.3%) | 6 (8.7%) |
| 25 to 34 Year Olds | 51 (100.0%) | 0 (0.0%) |
| 35 Years and over | 5 (100.0%) | 0 (0.0%) |
| Total | 451 (90.7%) | 46 (9.3%) |
Educational Attainment by Field of Study in Lineville
Business (57 | 19.1%), social sciences (50 | 16.7%), education (50 | 16.7%), science & technology (49 | 16.4%), and engineering (41 | 13.7%) are the most common fields of study among 299 individuals in Lineville who have obtained a bachelor's degree or higher.
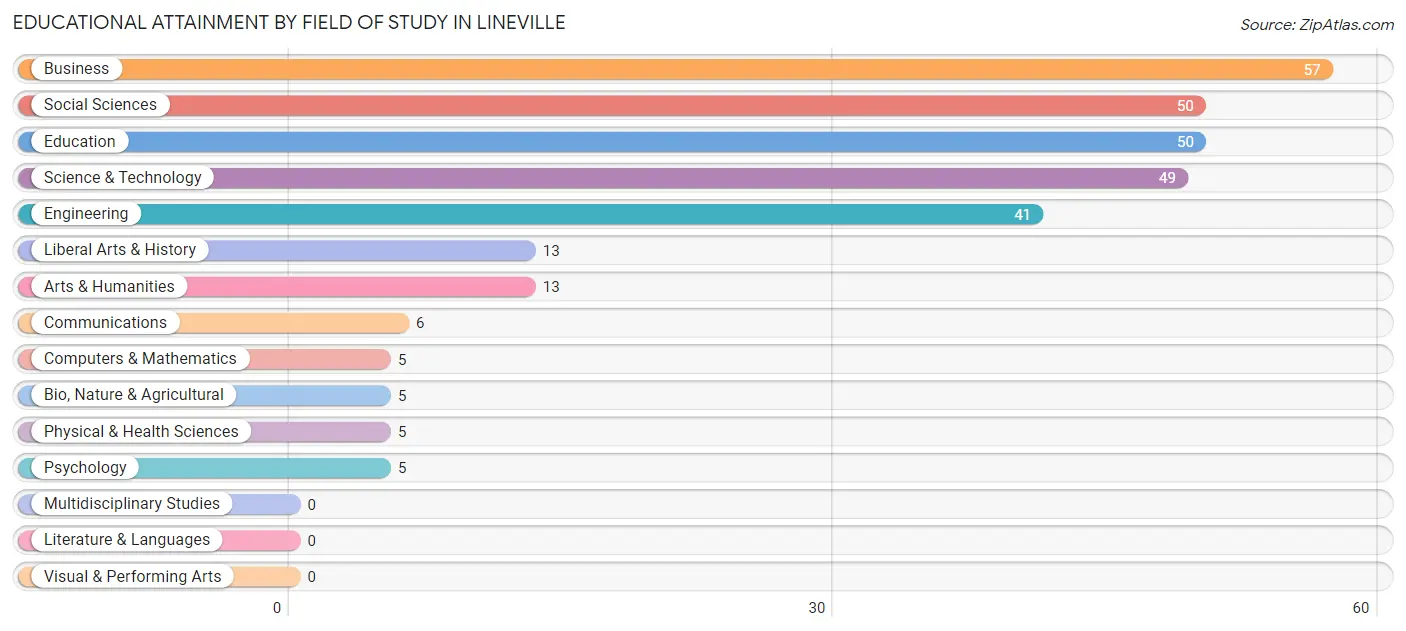
| Field of Study | # Graduates | % Graduates |
| Computers & Mathematics | 5 | 1.7% |
| Bio, Nature & Agricultural | 5 | 1.7% |
| Physical & Health Sciences | 5 | 1.7% |
| Psychology | 5 | 1.7% |
| Social Sciences | 50 | 16.7% |
| Engineering | 41 | 13.7% |
| Multidisciplinary Studies | 0 | 0.0% |
| Science & Technology | 49 | 16.4% |
| Business | 57 | 19.1% |
| Education | 50 | 16.7% |
| Literature & Languages | 0 | 0.0% |
| Liberal Arts & History | 13 | 4.3% |
| Visual & Performing Arts | 0 | 0.0% |
| Communications | 6 | 2.0% |
| Arts & Humanities | 13 | 4.3% |
| Total | 299 | 100.0% |
Transportation & Commute in Lineville
Vehicle Availability by Sex in Lineville
The most prevalent vehicle ownership categories in Lineville are males with 3 vehicles (195, accounting for 36.8%) and females with 3 vehicles (121, making up 47.8%).
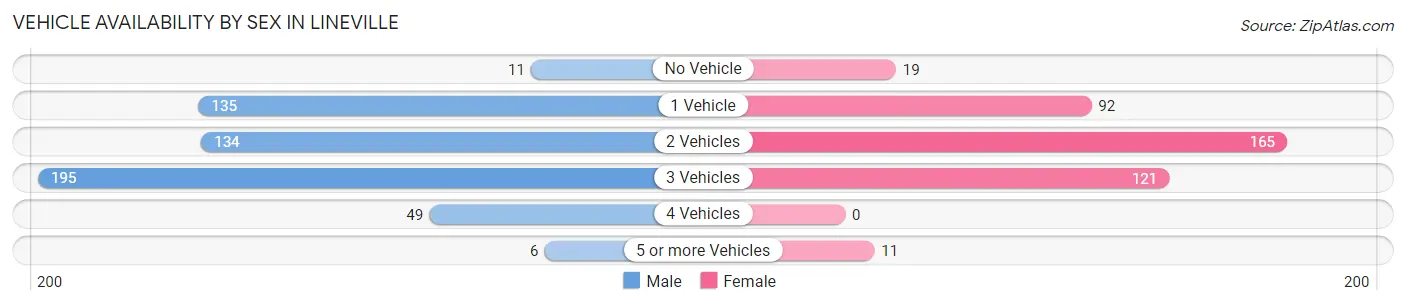
| Vehicles Available | Male | Female |
| No Vehicle | 11 (2.1%) | 19 (4.7%) |
| 1 Vehicle | 135 (25.5%) | 92 (22.6%) |
| 2 Vehicles | 134 (25.3%) | 165 (40.4%) |
| 3 Vehicles | 195 (36.8%) | 121 (29.7%) |
| 4 Vehicles | 49 (9.2%) | 0 (0.0%) |
| 5 or more Vehicles | 6 (1.1%) | 11 (2.7%) |
| Total | 530 (100.0%) | 408 (100.0%) |
Commute Time in Lineville
The most frequently occuring commute durations in Lineville are 10 to 14 minutes (258 commuters, 29.0%), 5 to 9 minutes (146 commuters, 16.4%), and 30 to 34 minutes (113 commuters, 12.7%).
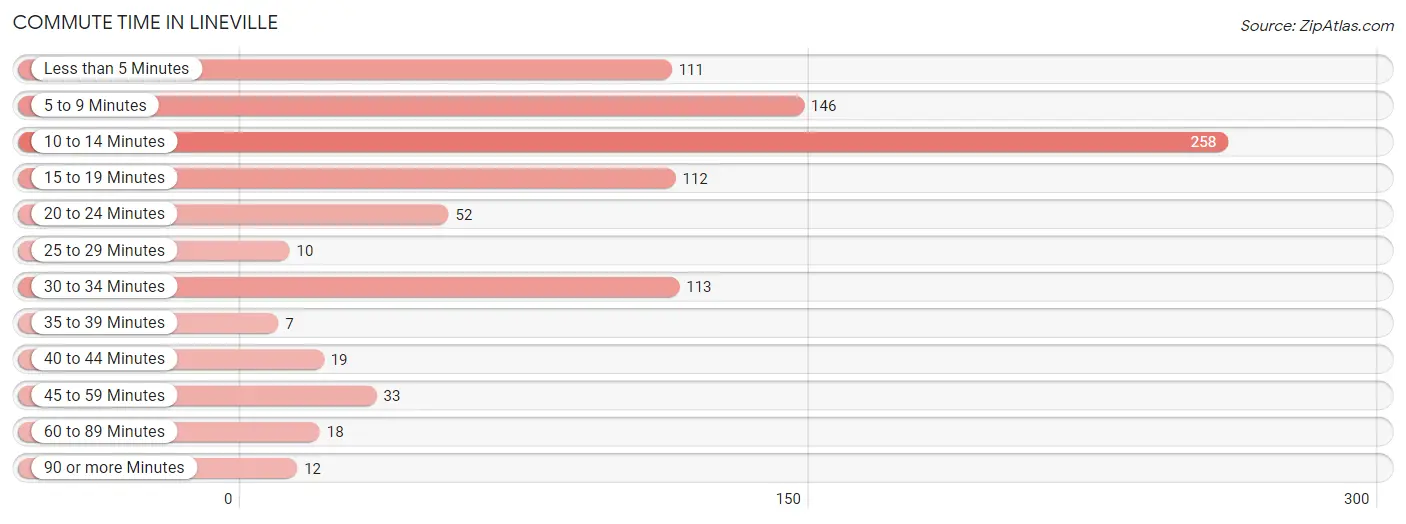
| Commute Time | # Commuters | % Commuters |
| Less than 5 Minutes | 111 | 12.5% |
| 5 to 9 Minutes | 146 | 16.4% |
| 10 to 14 Minutes | 258 | 29.0% |
| 15 to 19 Minutes | 112 | 12.6% |
| 20 to 24 Minutes | 52 | 5.8% |
| 25 to 29 Minutes | 10 | 1.1% |
| 30 to 34 Minutes | 113 | 12.7% |
| 35 to 39 Minutes | 7 | 0.8% |
| 40 to 44 Minutes | 19 | 2.1% |
| 45 to 59 Minutes | 33 | 3.7% |
| 60 to 89 Minutes | 18 | 2.0% |
| 90 or more Minutes | 12 | 1.3% |
Commute Time by Sex in Lineville
The most common commute times in Lineville are 10 to 14 minutes (130 commuters, 26.2%) for males and 10 to 14 minutes (128 commuters, 32.4%) for females.
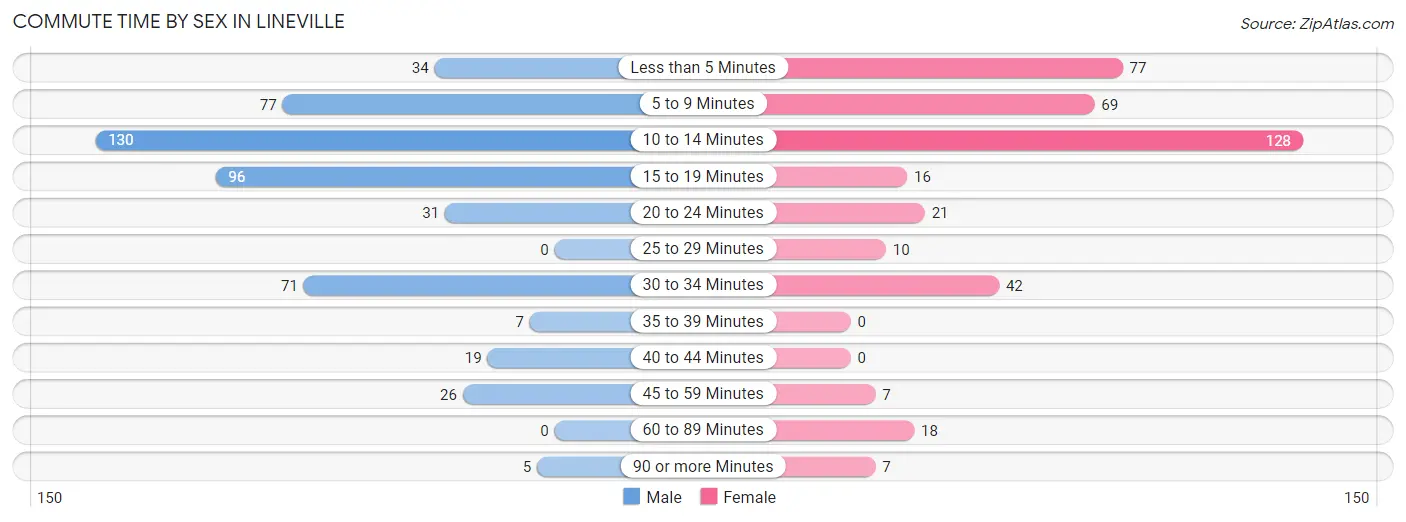
| Commute Time | Male | Female |
| Less than 5 Minutes | 34 (6.9%) | 77 (19.5%) |
| 5 to 9 Minutes | 77 (15.5%) | 69 (17.5%) |
| 10 to 14 Minutes | 130 (26.2%) | 128 (32.4%) |
| 15 to 19 Minutes | 96 (19.4%) | 16 (4.1%) |
| 20 to 24 Minutes | 31 (6.2%) | 21 (5.3%) |
| 25 to 29 Minutes | 0 (0.0%) | 10 (2.5%) |
| 30 to 34 Minutes | 71 (14.3%) | 42 (10.6%) |
| 35 to 39 Minutes | 7 (1.4%) | 0 (0.0%) |
| 40 to 44 Minutes | 19 (3.8%) | 0 (0.0%) |
| 45 to 59 Minutes | 26 (5.2%) | 7 (1.8%) |
| 60 to 89 Minutes | 0 (0.0%) | 18 (4.6%) |
| 90 or more Minutes | 5 (1.0%) | 7 (1.8%) |
Time of Departure to Work by Sex in Lineville
The most frequent times of departure to work in Lineville are 12:00 AM to 4:59 AM (91, 18.3%) for males and 6:00 AM to 6:29 AM (101, 25.6%) for females.
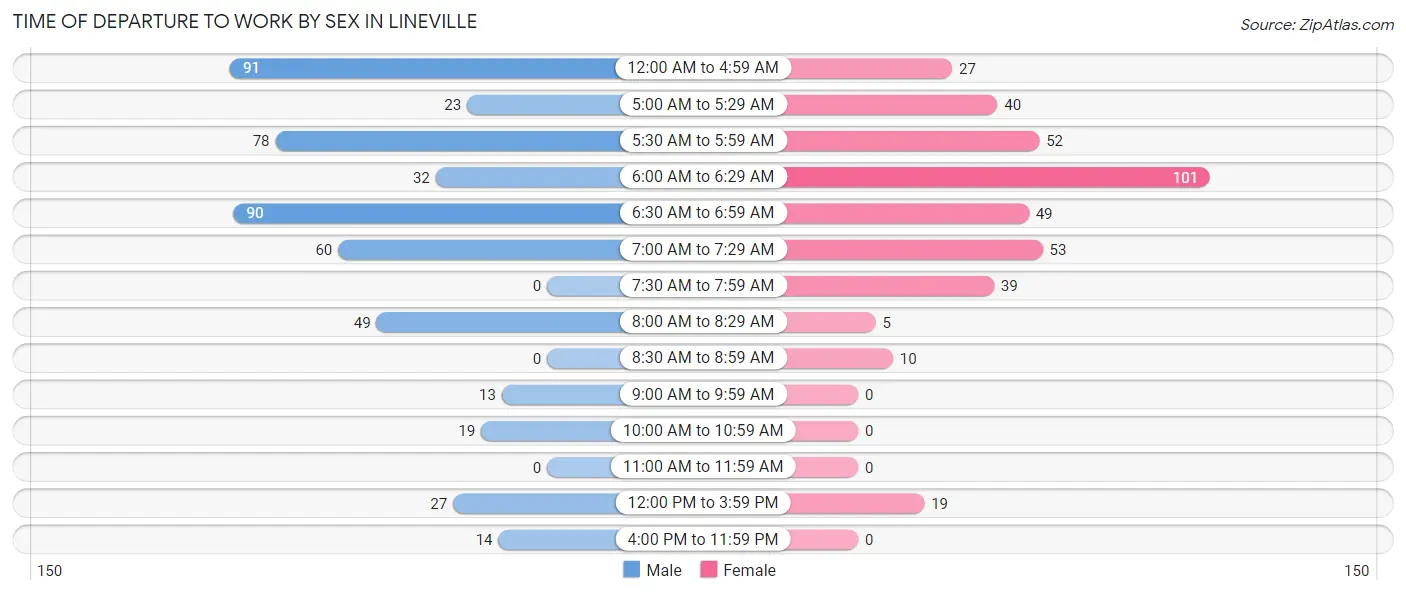
| Time of Departure | Male | Female |
| 12:00 AM to 4:59 AM | 91 (18.3%) | 27 (6.8%) |
| 5:00 AM to 5:29 AM | 23 (4.6%) | 40 (10.1%) |
| 5:30 AM to 5:59 AM | 78 (15.7%) | 52 (13.2%) |
| 6:00 AM to 6:29 AM | 32 (6.5%) | 101 (25.6%) |
| 6:30 AM to 6:59 AM | 90 (18.1%) | 49 (12.4%) |
| 7:00 AM to 7:29 AM | 60 (12.1%) | 53 (13.4%) |
| 7:30 AM to 7:59 AM | 0 (0.0%) | 39 (9.9%) |
| 8:00 AM to 8:29 AM | 49 (9.9%) | 5 (1.3%) |
| 8:30 AM to 8:59 AM | 0 (0.0%) | 10 (2.5%) |
| 9:00 AM to 9:59 AM | 13 (2.6%) | 0 (0.0%) |
| 10:00 AM to 10:59 AM | 19 (3.8%) | 0 (0.0%) |
| 11:00 AM to 11:59 AM | 0 (0.0%) | 0 (0.0%) |
| 12:00 PM to 3:59 PM | 27 (5.4%) | 19 (4.8%) |
| 4:00 PM to 11:59 PM | 14 (2.8%) | 0 (0.0%) |
| Total | 496 (100.0%) | 395 (100.0%) |
Housing Occupancy in Lineville
Occupancy by Ownership in Lineville
Of the total 1,196 dwellings in Lineville, owner-occupied units account for 811 (67.8%), while renter-occupied units make up 385 (32.2%).
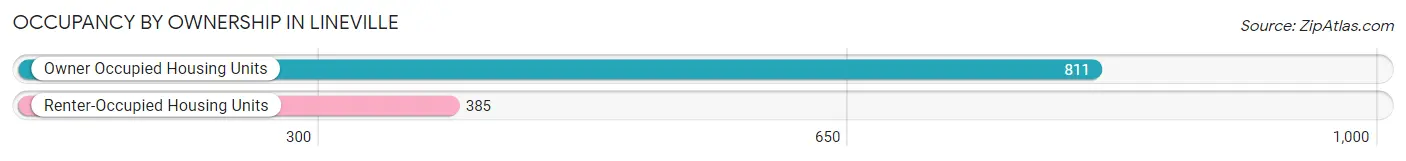
| Occupancy | # Housing Units | % Housing Units |
| Owner Occupied Housing Units | 811 | 67.8% |
| Renter-Occupied Housing Units | 385 | 32.2% |
| Total Occupied Housing Units | 1,196 | 100.0% |
Occupancy by Household Size in Lineville
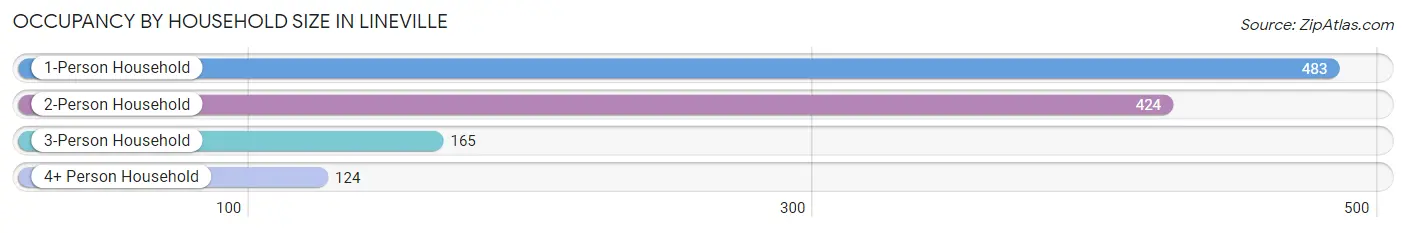
| Household Size | # Housing Units | % Housing Units |
| 1-Person Household | 483 | 40.4% |
| 2-Person Household | 424 | 35.4% |
| 3-Person Household | 165 | 13.8% |
| 4+ Person Household | 124 | 10.4% |
| Total Housing Units | 1,196 | 100.0% |
Occupancy by Ownership by Household Size in Lineville
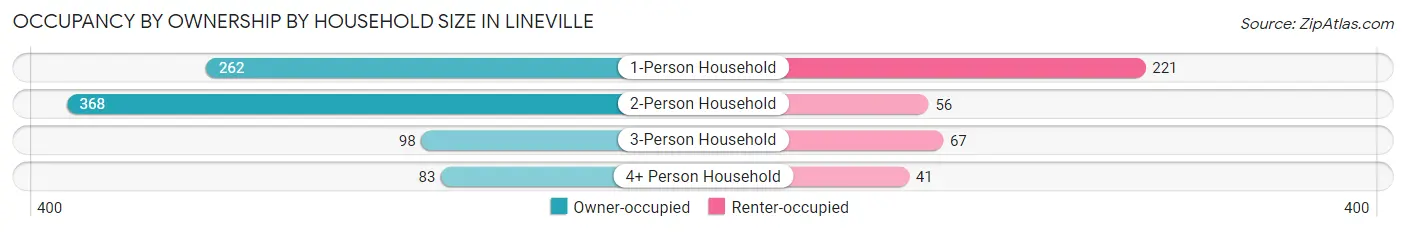
| Household Size | Owner-occupied | Renter-occupied |
| 1-Person Household | 262 (54.2%) | 221 (45.8%) |
| 2-Person Household | 368 (86.8%) | 56 (13.2%) |
| 3-Person Household | 98 (59.4%) | 67 (40.6%) |
| 4+ Person Household | 83 (66.9%) | 41 (33.1%) |
| Total Housing Units | 811 (67.8%) | 385 (32.2%) |
Occupancy by Educational Attainment in Lineville
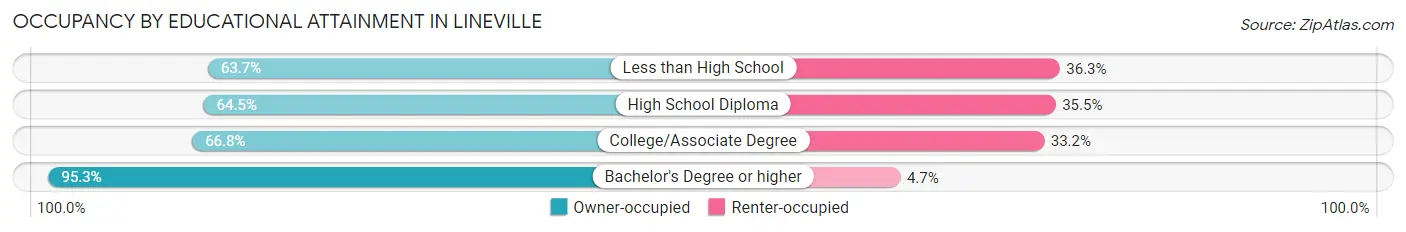
| Household Size | Owner-occupied | Renter-occupied |
| Less than High School | 121 (63.7%) | 69 (36.3%) |
| High School Diploma | 338 (64.5%) | 186 (35.5%) |
| College/Associate Degree | 251 (66.8%) | 125 (33.2%) |
| Bachelor's Degree or higher | 101 (95.3%) | 5 (4.7%) |
Occupancy by Age of Householder in Lineville
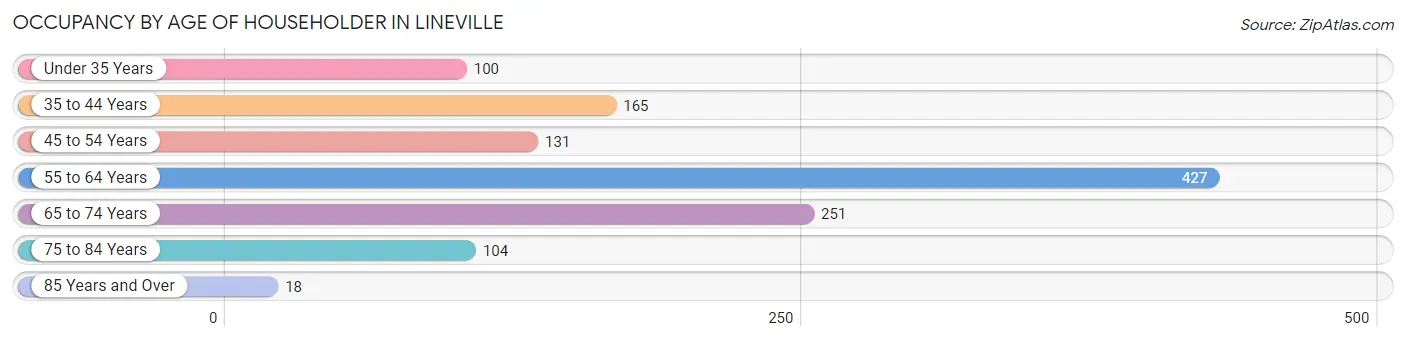
| Age Bracket | # Households | % Households |
| Under 35 Years | 100 | 8.4% |
| 35 to 44 Years | 165 | 13.8% |
| 45 to 54 Years | 131 | 11.0% |
| 55 to 64 Years | 427 | 35.7% |
| 65 to 74 Years | 251 | 21.0% |
| 75 to 84 Years | 104 | 8.7% |
| 85 Years and Over | 18 | 1.5% |
| Total | 1,196 | 100.0% |
Housing Finances in Lineville
Median Income by Occupancy in Lineville
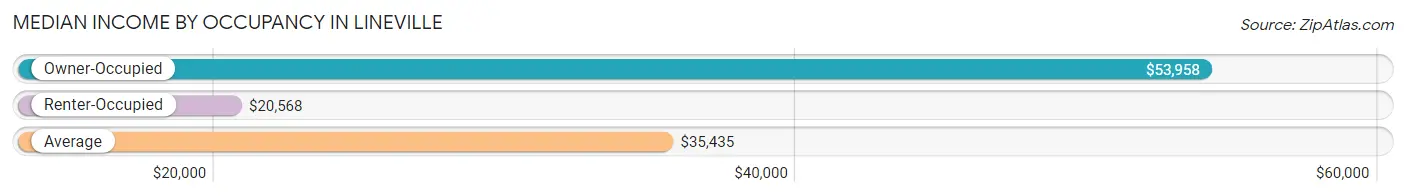
| Occupancy Type | # Households | Median Income |
| Owner-Occupied | 811 (67.8%) | $53,958 |
| Renter-Occupied | 385 (32.2%) | $20,568 |
| Average | 1,196 (100.0%) | $35,435 |
Occupancy by Householder Income Bracket in Lineville
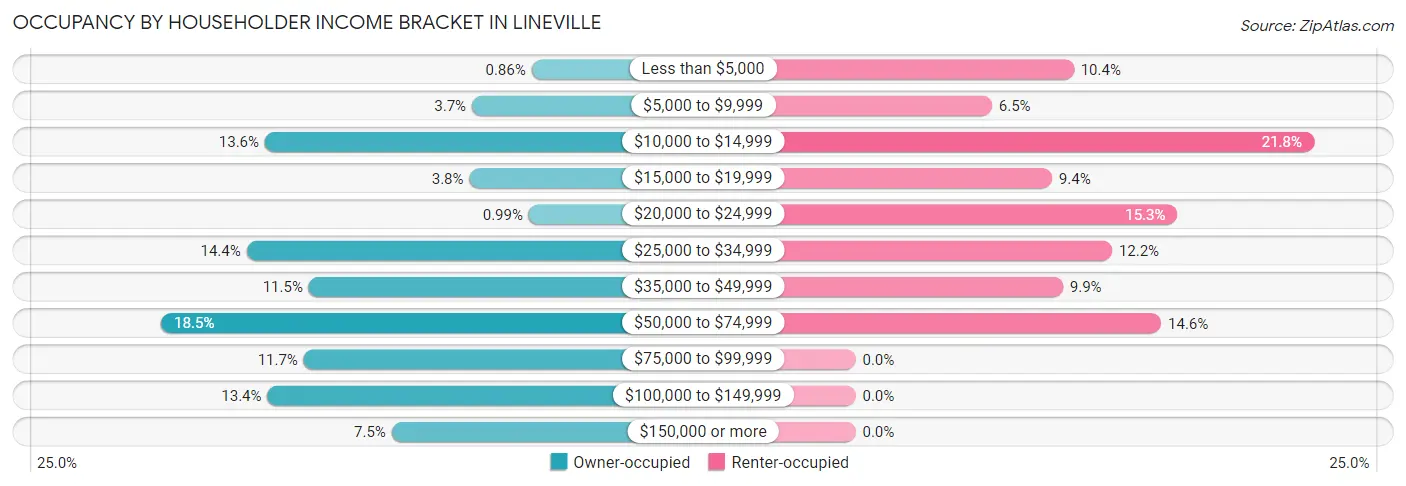
| Income Bracket | Owner-occupied | Renter-occupied |
| Less than $5,000 | 7 (0.9%) | 40 (10.4%) |
| $5,000 to $9,999 | 30 (3.7%) | 25 (6.5%) |
| $10,000 to $14,999 | 110 (13.6%) | 84 (21.8%) |
| $15,000 to $19,999 | 31 (3.8%) | 36 (9.3%) |
| $20,000 to $24,999 | 8 (1.0%) | 59 (15.3%) |
| $25,000 to $34,999 | 117 (14.4%) | 47 (12.2%) |
| $35,000 to $49,999 | 93 (11.5%) | 38 (9.9%) |
| $50,000 to $74,999 | 150 (18.5%) | 56 (14.5%) |
| $75,000 to $99,999 | 95 (11.7%) | 0 (0.0%) |
| $100,000 to $149,999 | 109 (13.4%) | 0 (0.0%) |
| $150,000 or more | 61 (7.5%) | 0 (0.0%) |
| Total | 811 (100.0%) | 385 (100.0%) |
Monthly Housing Cost Tiers in Lineville
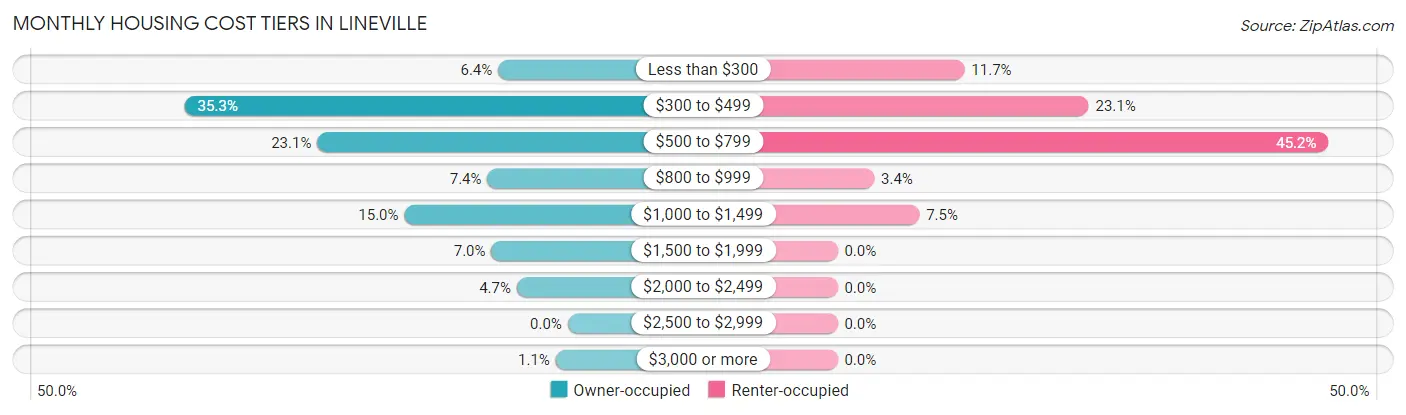
| Monthly Cost | Owner-occupied | Renter-occupied |
| Less than $300 | 52 (6.4%) | 45 (11.7%) |
| $300 to $499 | 286 (35.3%) | 89 (23.1%) |
| $500 to $799 | 187 (23.1%) | 174 (45.2%) |
| $800 to $999 | 60 (7.4%) | 13 (3.4%) |
| $1,000 to $1,499 | 122 (15.0%) | 29 (7.5%) |
| $1,500 to $1,999 | 57 (7.0%) | 0 (0.0%) |
| $2,000 to $2,499 | 38 (4.7%) | 0 (0.0%) |
| $2,500 to $2,999 | 0 (0.0%) | 0 (0.0%) |
| $3,000 or more | 9 (1.1%) | 0 (0.0%) |
| Total | 811 (100.0%) | 385 (100.0%) |
Physical Housing Characteristics in Lineville
Housing Structures in Lineville
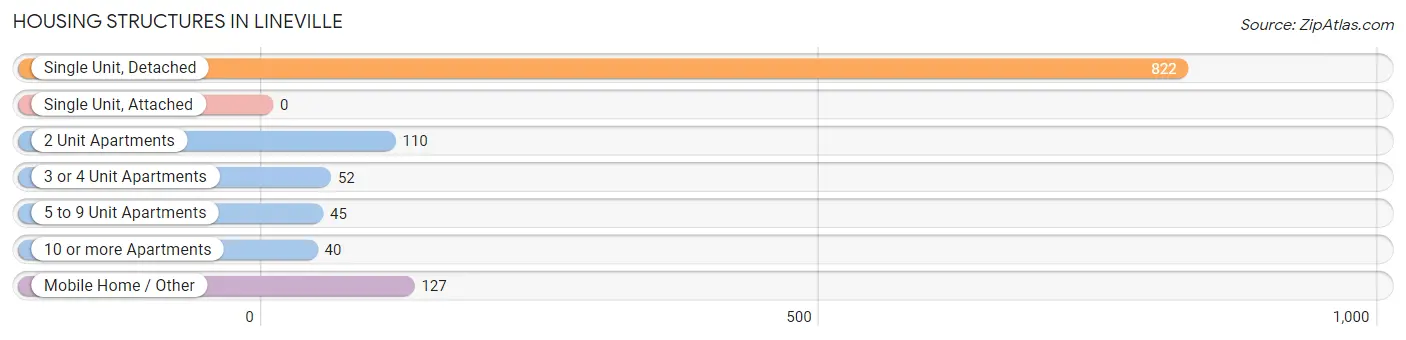
| Structure Type | # Housing Units | % Housing Units |
| Single Unit, Detached | 822 | 68.7% |
| Single Unit, Attached | 0 | 0.0% |
| 2 Unit Apartments | 110 | 9.2% |
| 3 or 4 Unit Apartments | 52 | 4.3% |
| 5 to 9 Unit Apartments | 45 | 3.8% |
| 10 or more Apartments | 40 | 3.3% |
| Mobile Home / Other | 127 | 10.6% |
| Total | 1,196 | 100.0% |
Housing Structures by Occupancy in Lineville
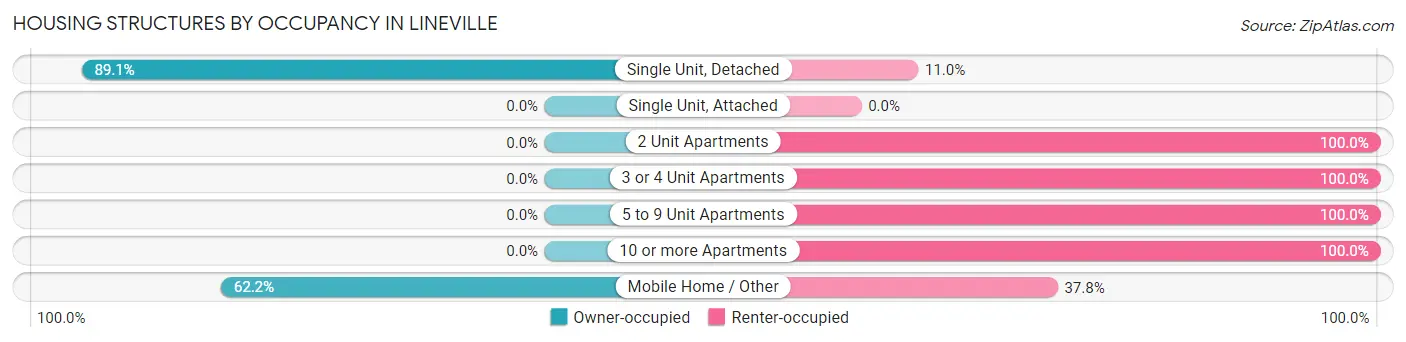
| Structure Type | Owner-occupied | Renter-occupied |
| Single Unit, Detached | 732 (89.0%) | 90 (11.0%) |
| Single Unit, Attached | 0 (0.0%) | 0 (0.0%) |
| 2 Unit Apartments | 0 (0.0%) | 110 (100.0%) |
| 3 or 4 Unit Apartments | 0 (0.0%) | 52 (100.0%) |
| 5 to 9 Unit Apartments | 0 (0.0%) | 45 (100.0%) |
| 10 or more Apartments | 0 (0.0%) | 40 (100.0%) |
| Mobile Home / Other | 79 (62.2%) | 48 (37.8%) |
| Total | 811 (67.8%) | 385 (32.2%) |
Housing Structures by Number of Rooms in Lineville
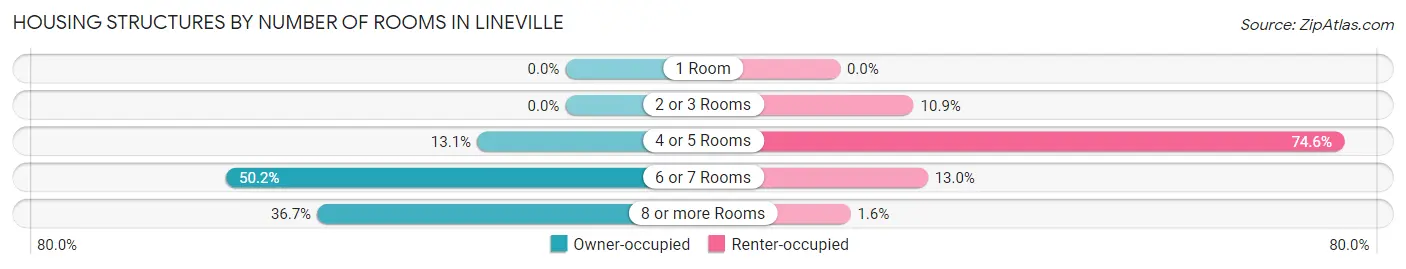
| Number of Rooms | Owner-occupied | Renter-occupied |
| 1 Room | 0 (0.0%) | 0 (0.0%) |
| 2 or 3 Rooms | 0 (0.0%) | 42 (10.9%) |
| 4 or 5 Rooms | 106 (13.1%) | 287 (74.6%) |
| 6 or 7 Rooms | 407 (50.2%) | 50 (13.0%) |
| 8 or more Rooms | 298 (36.7%) | 6 (1.6%) |
| Total | 811 (100.0%) | 385 (100.0%) |
Housing Structure by Heating Type in Lineville
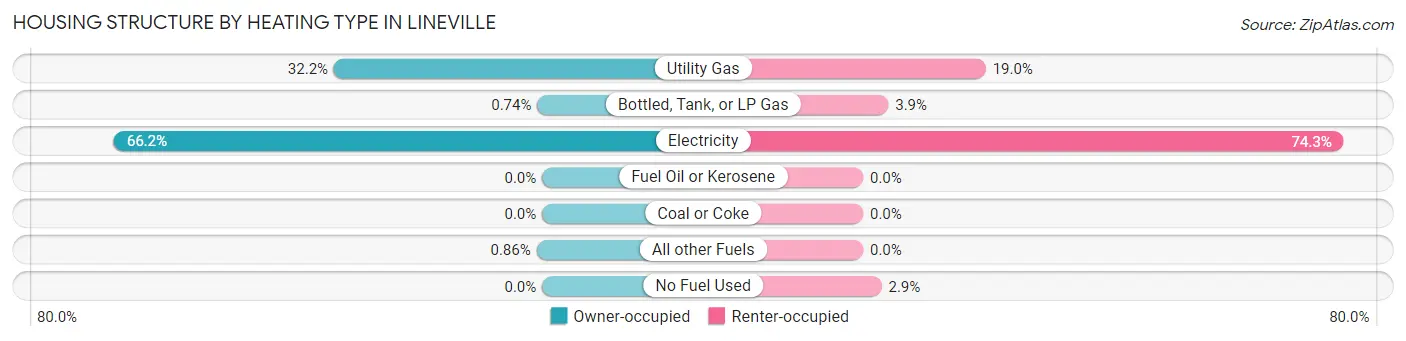
| Heating Type | Owner-occupied | Renter-occupied |
| Utility Gas | 261 (32.2%) | 73 (19.0%) |
| Bottled, Tank, or LP Gas | 6 (0.7%) | 15 (3.9%) |
| Electricity | 537 (66.2%) | 286 (74.3%) |
| Fuel Oil or Kerosene | 0 (0.0%) | 0 (0.0%) |
| Coal or Coke | 0 (0.0%) | 0 (0.0%) |
| All other Fuels | 7 (0.9%) | 0 (0.0%) |
| No Fuel Used | 0 (0.0%) | 11 (2.9%) |
| Total | 811 (100.0%) | 385 (100.0%) |
Household Vehicle Usage in Lineville
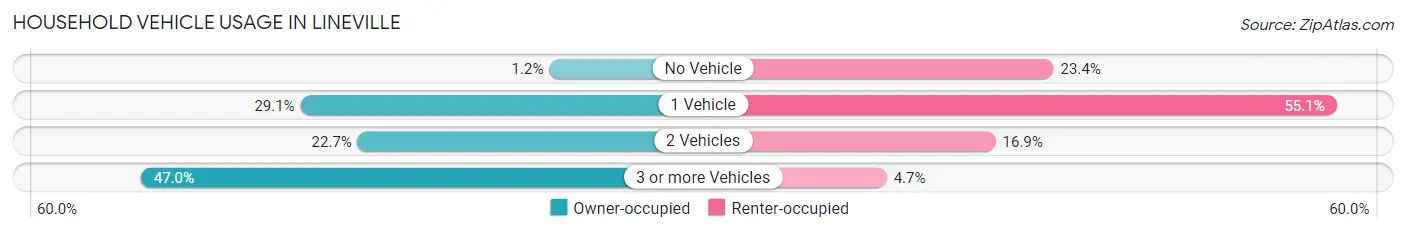
| Vehicles per Household | Owner-occupied | Renter-occupied |
| No Vehicle | 10 (1.2%) | 90 (23.4%) |
| 1 Vehicle | 236 (29.1%) | 212 (55.1%) |
| 2 Vehicles | 184 (22.7%) | 65 (16.9%) |
| 3 or more Vehicles | 381 (47.0%) | 18 (4.7%) |
| Total | 811 (100.0%) | 385 (100.0%) |
Real Estate & Mortgages in Lineville
Real Estate and Mortgage Overview in Lineville
| Characteristic | Without Mortgage | With Mortgage |
| Housing Units | 460 | 351 |
| Median Property Value | $118,000 | $184,400 |
| Median Household Income | $39,583 | $46 |
| Monthly Housing Costs | $448 | $9 |
| Real Estate Taxes | $374 | $96 |
Property Value by Mortgage Status in Lineville
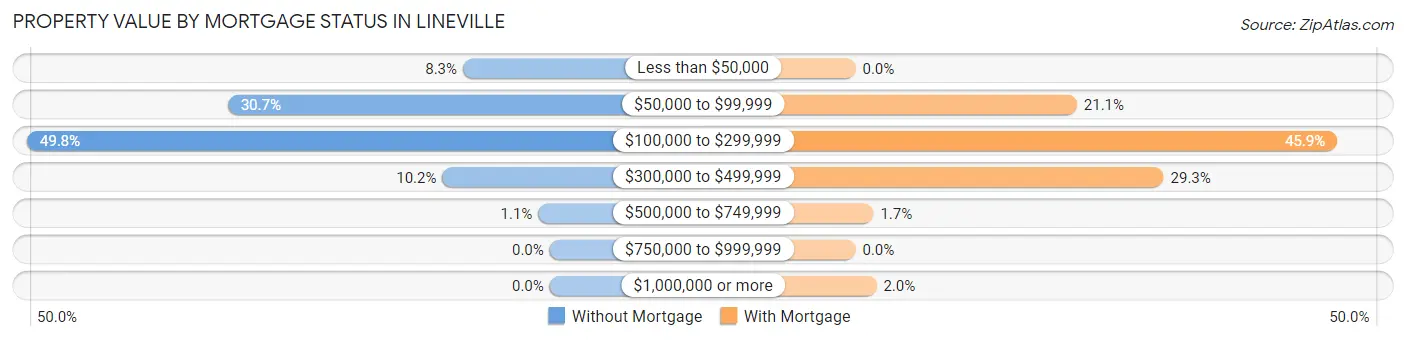
| Property Value | Without Mortgage | With Mortgage |
| Less than $50,000 | 38 (8.3%) | 0 (0.0%) |
| $50,000 to $99,999 | 141 (30.6%) | 74 (21.1%) |
| $100,000 to $299,999 | 229 (49.8%) | 161 (45.9%) |
| $300,000 to $499,999 | 47 (10.2%) | 103 (29.3%) |
| $500,000 to $749,999 | 5 (1.1%) | 6 (1.7%) |
| $750,000 to $999,999 | 0 (0.0%) | 0 (0.0%) |
| $1,000,000 or more | 0 (0.0%) | 7 (2.0%) |
| Total | 460 (100.0%) | 351 (100.0%) |
Household Income by Mortgage Status in Lineville
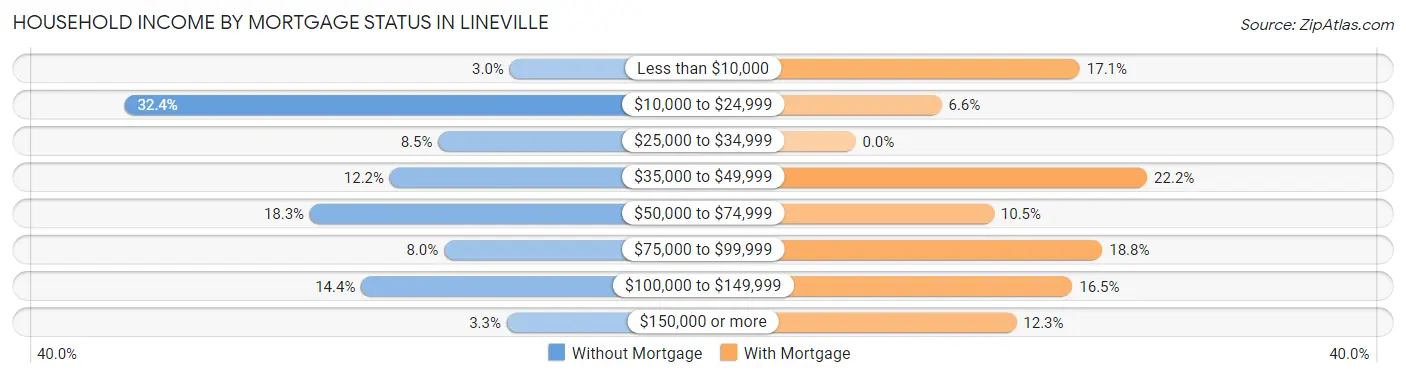
| Household Income | Without Mortgage | With Mortgage |
| Less than $10,000 | 14 (3.0%) | 60 (17.1%) |
| $10,000 to $24,999 | 149 (32.4%) | 23 (6.6%) |
| $25,000 to $34,999 | 39 (8.5%) | 0 (0.0%) |
| $35,000 to $49,999 | 56 (12.2%) | 78 (22.2%) |
| $50,000 to $74,999 | 84 (18.3%) | 37 (10.5%) |
| $75,000 to $99,999 | 37 (8.0%) | 66 (18.8%) |
| $100,000 to $149,999 | 66 (14.3%) | 58 (16.5%) |
| $150,000 or more | 15 (3.3%) | 43 (12.2%) |
| Total | 460 (100.0%) | 351 (100.0%) |
Property Value to Household Income Ratio in Lineville
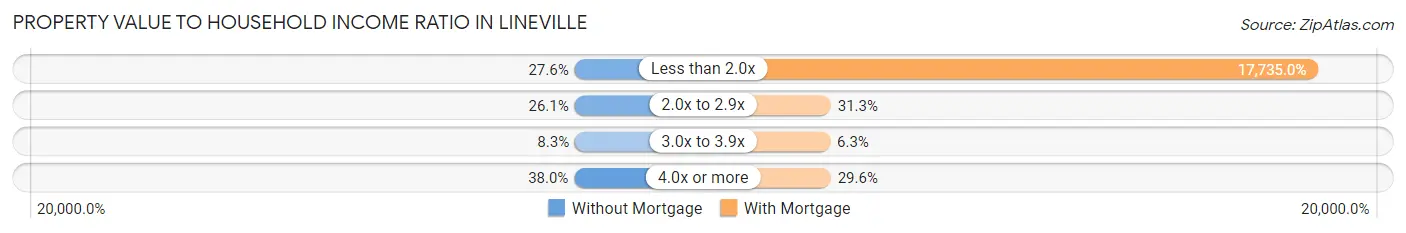
| Value-to-Income Ratio | Without Mortgage | With Mortgage |
| Less than 2.0x | 127 (27.6%) | 62,250 (17,735.0%) |
| 2.0x to 2.9x | 120 (26.1%) | 110 (31.3%) |
| 3.0x to 3.9x | 38 (8.3%) | 22 (6.3%) |
| 4.0x or more | 175 (38.0%) | 104 (29.6%) |
| Total | 460 (100.0%) | 351 (100.0%) |
Real Estate Taxes by Mortgage Status in Lineville
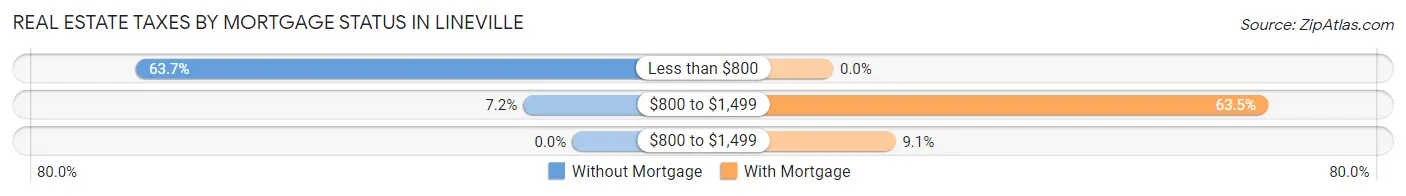
| Property Taxes | Without Mortgage | With Mortgage |
| Less than $800 | 293 (63.7%) | 0 (0.0%) |
| $800 to $1,499 | 33 (7.2%) | 223 (63.5%) |
| $800 to $1,499 | 0 (0.0%) | 32 (9.1%) |
| Total | 460 (100.0%) | 351 (100.0%) |
Health & Disability in Lineville
Health Insurance Coverage by Age in Lineville
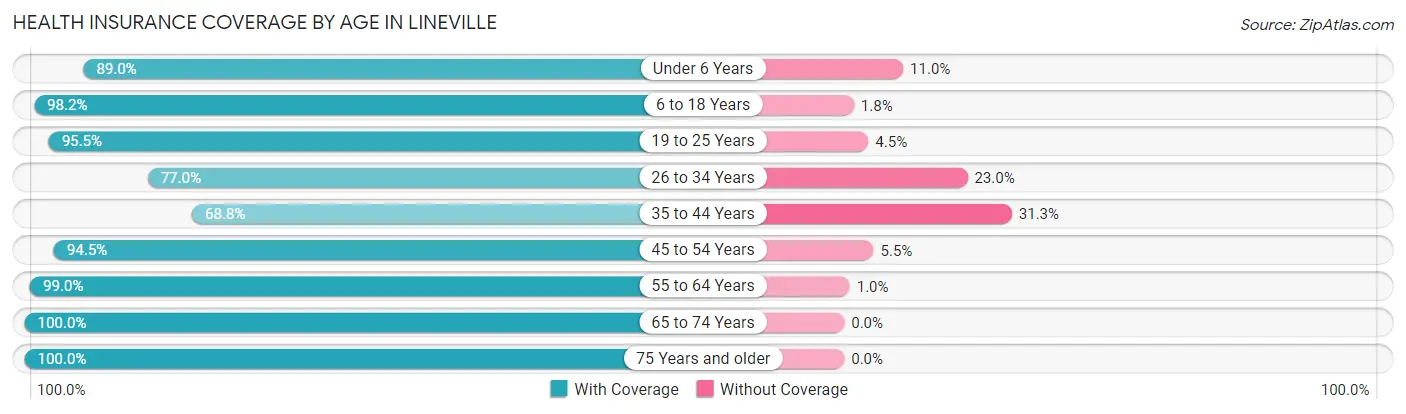
| Age Bracket | With Coverage | Without Coverage |
| Under 6 Years | 146 (89.0%) | 18 (11.0%) |
| 6 to 18 Years | 329 (98.2%) | 6 (1.8%) |
| 19 to 25 Years | 106 (95.5%) | 5 (4.5%) |
| 26 to 34 Years | 171 (77.0%) | 51 (23.0%) |
| 35 to 44 Years | 176 (68.8%) | 80 (31.2%) |
| 45 to 54 Years | 311 (94.5%) | 18 (5.5%) |
| 55 to 64 Years | 581 (99.0%) | 6 (1.0%) |
| 65 to 74 Years | 370 (100.0%) | 0 (0.0%) |
| 75 Years and older | 232 (100.0%) | 0 (0.0%) |
| Total | 2,422 (92.9%) | 184 (7.1%) |
Health Insurance Coverage by Citizenship Status in Lineville

| Citizenship Status | With Coverage | Without Coverage |
| Native Born | 146 (89.0%) | 18 (11.0%) |
| Foreign Born, Citizen | 329 (98.2%) | 6 (1.8%) |
| Foreign Born, not a Citizen | 106 (95.5%) | 5 (4.5%) |
Health Insurance Coverage by Household Income in Lineville
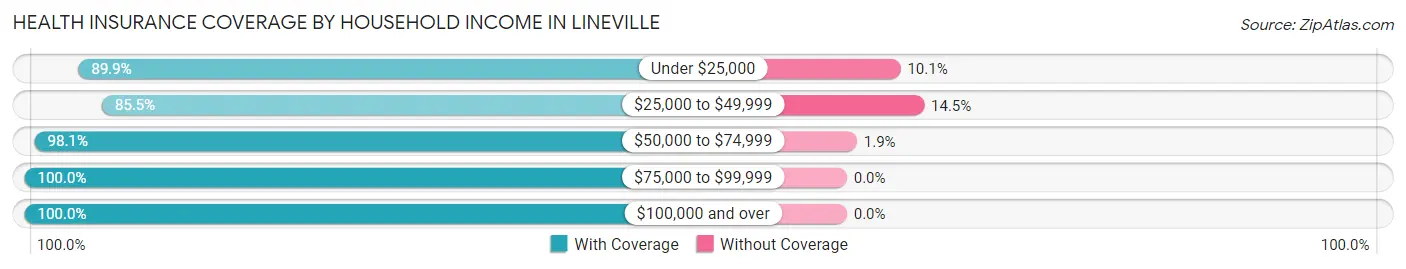
| Household Income | With Coverage | Without Coverage |
| Under $25,000 | 590 (89.9%) | 66 (10.1%) |
| $25,000 to $49,999 | 632 (85.5%) | 107 (14.5%) |
| $50,000 to $74,999 | 573 (98.1%) | 11 (1.9%) |
| $75,000 to $99,999 | 239 (100.0%) | 0 (0.0%) |
| $100,000 and over | 386 (100.0%) | 0 (0.0%) |
Public vs Private Health Insurance Coverage by Age in Lineville
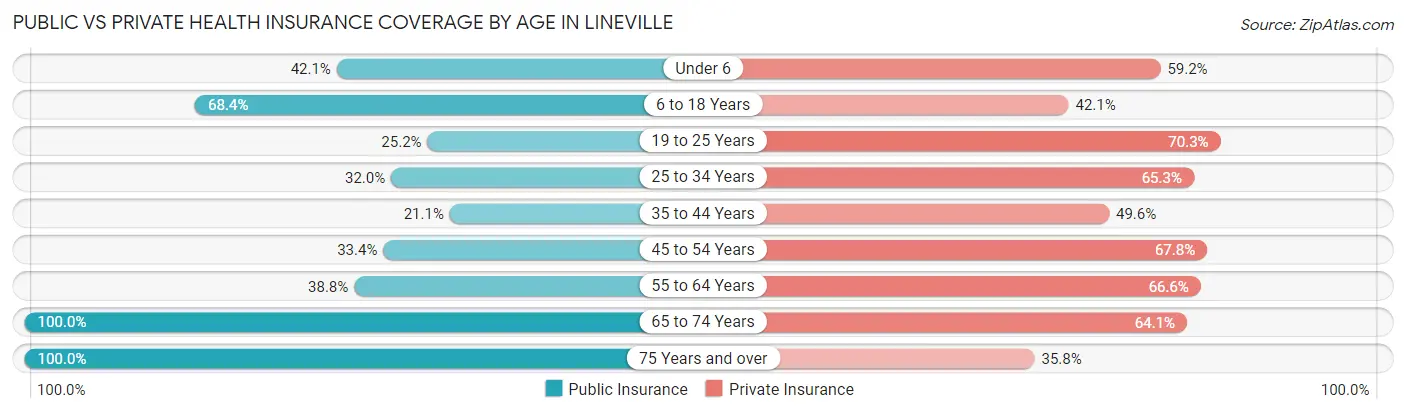
| Age Bracket | Public Insurance | Private Insurance |
| Under 6 | 69 (42.1%) | 97 (59.2%) |
| 6 to 18 Years | 229 (68.4%) | 141 (42.1%) |
| 19 to 25 Years | 28 (25.2%) | 78 (70.3%) |
| 25 to 34 Years | 71 (32.0%) | 145 (65.3%) |
| 35 to 44 Years | 54 (21.1%) | 127 (49.6%) |
| 45 to 54 Years | 110 (33.4%) | 223 (67.8%) |
| 55 to 64 Years | 228 (38.8%) | 391 (66.6%) |
| 65 to 74 Years | 370 (100.0%) | 237 (64.0%) |
| 75 Years and over | 232 (100.0%) | 83 (35.8%) |
| Total | 1,391 (53.4%) | 1,522 (58.4%) |
Disability Status by Sex by Age in Lineville
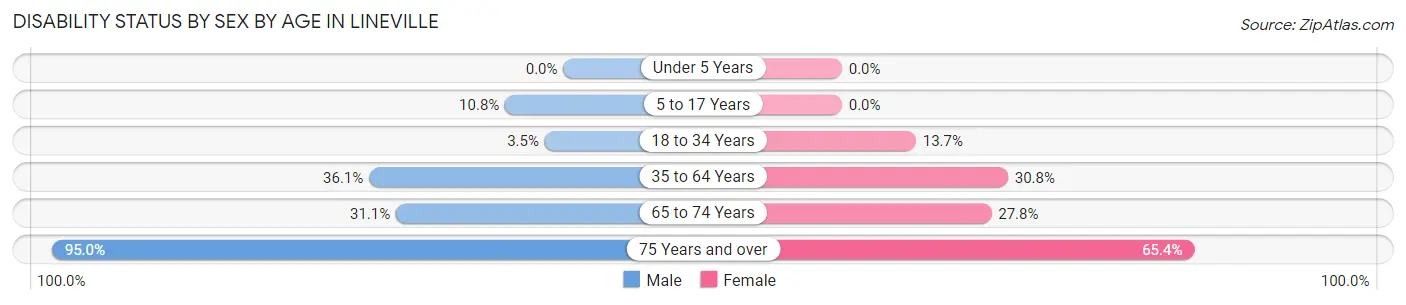
| Age Bracket | Male | Female |
| Under 5 Years | 0 (0.0%) | 0 (0.0%) |
| 5 to 17 Years | 19 (10.8%) | 0 (0.0%) |
| 18 to 34 Years | 6 (3.5%) | 25 (13.7%) |
| 35 to 64 Years | 199 (36.0%) | 191 (30.8%) |
| 65 to 74 Years | 50 (31.1%) | 58 (27.8%) |
| 75 Years and over | 94 (95.0%) | 87 (65.4%) |
Disability Class by Sex by Age in Lineville
Disability Class: Hearing Difficulty
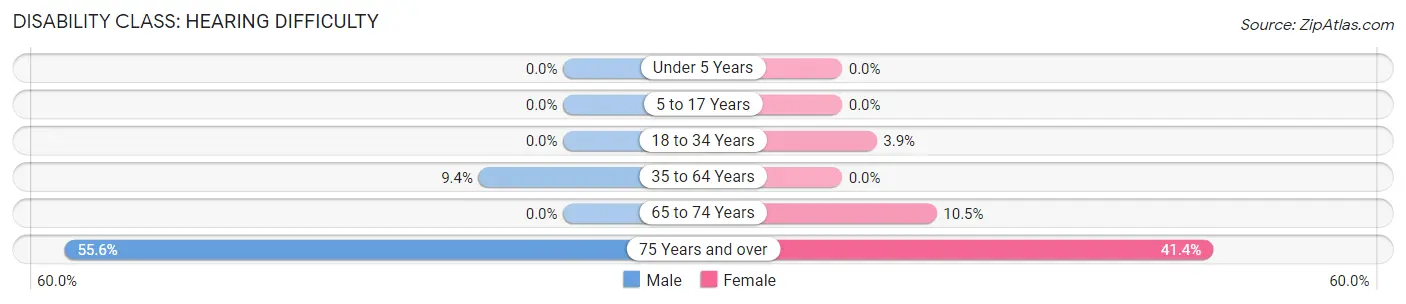
| Age Bracket | Male | Female |
| Under 5 Years | 0 (0.0%) | 0 (0.0%) |
| 5 to 17 Years | 0 (0.0%) | 0 (0.0%) |
| 18 to 34 Years | 0 (0.0%) | 7 (3.8%) |
| 35 to 64 Years | 52 (9.4%) | 0 (0.0%) |
| 65 to 74 Years | 0 (0.0%) | 22 (10.5%) |
| 75 Years and over | 55 (55.6%) | 55 (41.3%) |
Disability Class: Vision Difficulty
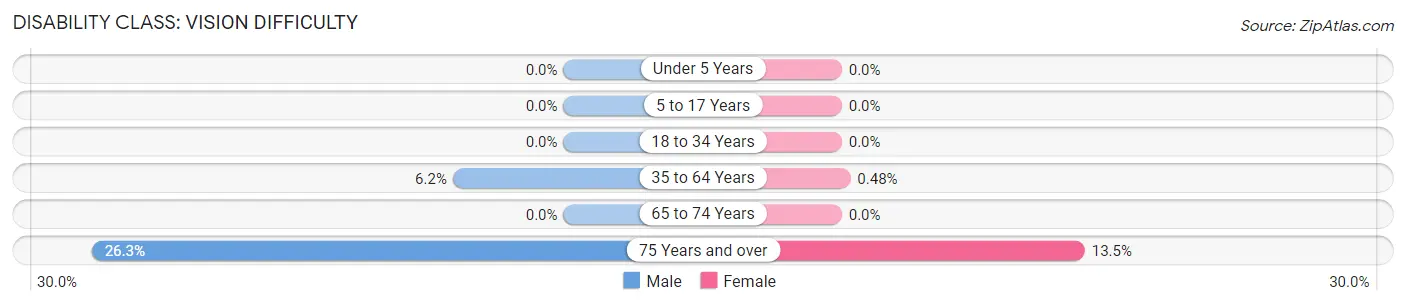
| Age Bracket | Male | Female |
| Under 5 Years | 0 (0.0%) | 0 (0.0%) |
| 5 to 17 Years | 0 (0.0%) | 0 (0.0%) |
| 18 to 34 Years | 0 (0.0%) | 0 (0.0%) |
| 35 to 64 Years | 34 (6.2%) | 3 (0.5%) |
| 65 to 74 Years | 0 (0.0%) | 0 (0.0%) |
| 75 Years and over | 26 (26.3%) | 18 (13.5%) |
Disability Class: Cognitive Difficulty
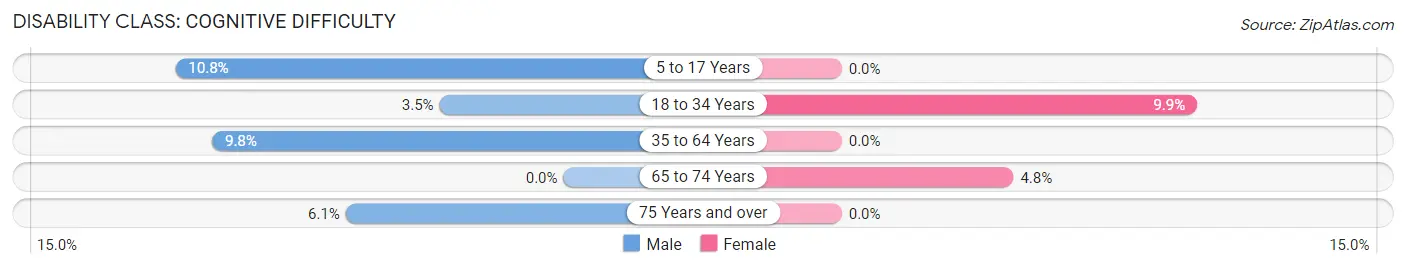
| Age Bracket | Male | Female |
| 5 to 17 Years | 19 (10.8%) | 0 (0.0%) |
| 18 to 34 Years | 6 (3.5%) | 18 (9.9%) |
| 35 to 64 Years | 54 (9.8%) | 0 (0.0%) |
| 65 to 74 Years | 0 (0.0%) | 10 (4.8%) |
| 75 Years and over | 6 (6.1%) | 0 (0.0%) |
Disability Class: Ambulatory Difficulty
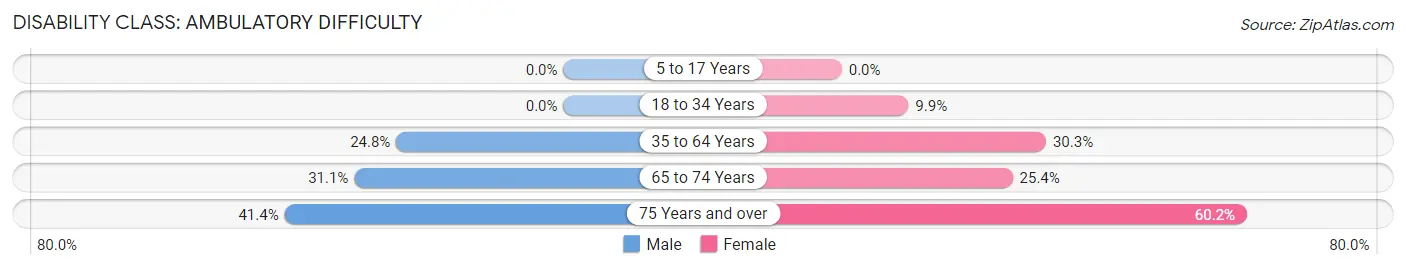
| Age Bracket | Male | Female |
| 5 to 17 Years | 0 (0.0%) | 0 (0.0%) |
| 18 to 34 Years | 0 (0.0%) | 18 (9.9%) |
| 35 to 64 Years | 137 (24.8%) | 188 (30.3%) |
| 65 to 74 Years | 50 (31.1%) | 53 (25.4%) |
| 75 Years and over | 41 (41.4%) | 80 (60.2%) |
Disability Class: Self-Care Difficulty

| Age Bracket | Male | Female |
| 5 to 17 Years | 13 (7.4%) | 0 (0.0%) |
| 18 to 34 Years | 0 (0.0%) | 18 (9.9%) |
| 35 to 64 Years | 29 (5.2%) | 61 (9.8%) |
| 65 to 74 Years | 5 (3.1%) | 10 (4.8%) |
| 75 Years and over | 45 (45.5%) | 4 (3.0%) |
Technology Access in Lineville
Computing Device Access in Lineville
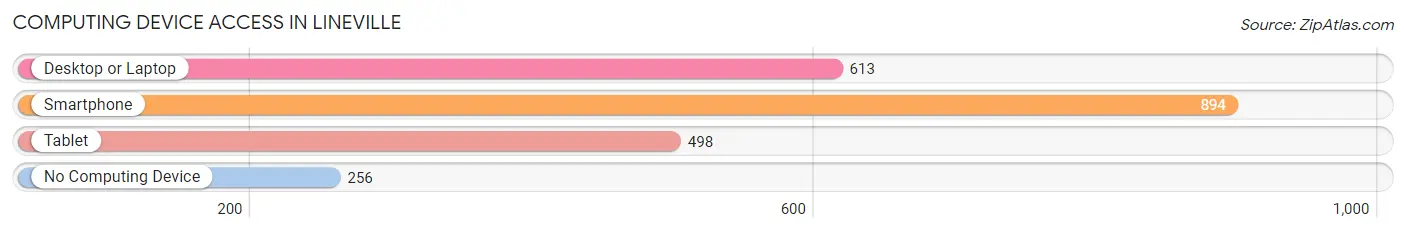
| Device Type | # Households | % Households |
| Desktop or Laptop | 613 | 51.2% |
| Smartphone | 894 | 74.8% |
| Tablet | 498 | 41.6% |
| No Computing Device | 256 | 21.4% |
| Total | 1,196 | 100.0% |
Internet Access in Lineville
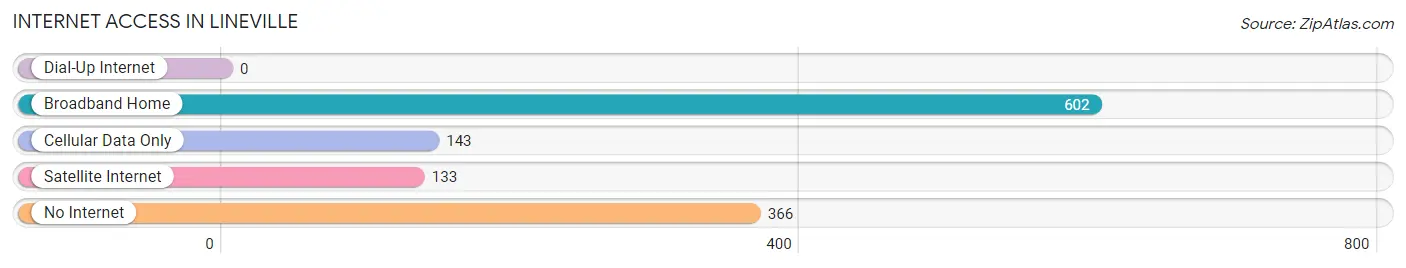
| Internet Type | # Households | % Households |
| Dial-Up Internet | 0 | 0.0% |
| Broadband Home | 602 | 50.3% |
| Cellular Data Only | 143 | 12.0% |
| Satellite Internet | 133 | 11.1% |
| No Internet | 366 | 30.6% |
| Total | 1,196 | 100.0% |
Lineville Summary
Lineville is a small town located in Clay County, Alabama. It is situated in the foothills of the Appalachian Mountains and is part of the Talladega National Forest. The town was founded in 1832 and is the county seat of Clay County. The population of Lineville was 1,845 at the 2010 census.
Geography
Lineville is located at 33°30'25" North, 85°45'25" West (33.506944, -85.756944). It is situated in the foothills of the Appalachian Mountains and is part of the Talladega National Forest. The town is located at the intersection of Alabama State Route 9 and Alabama State Route 49. The town is located approximately 20 miles south of the city of Anniston and approximately 40 miles north of the city of Birmingham.
The town is situated on the banks of the Choccolocco Creek, which is a tributary of the Tallapoosa River. The terrain of the area is mostly hilly and heavily forested. The climate of the area is humid subtropical, with hot summers and mild winters.
History
Lineville was founded in 1832 and is the county seat of Clay County. The town was named after the Line family, who were early settlers in the area. The town was originally a trading post and was a stop on the stagecoach route between Montgomery and Chattanooga.
The town was incorporated in 1837 and the first post office was established in 1838. The town was a center of commerce for the surrounding area and was home to several stores, a hotel, a bank, and a newspaper.
The town was also home to several churches, including the Methodist Episcopal Church, the Baptist Church, and the Presbyterian Church. The town was also home to several schools, including the Lineville Academy, which was established in 1845.
The town was also home to several industries, including a cotton mill, a sawmill, and a gristmill. The town was also home to several mines, including the Lineville Coal Mine, which was established in 1872.
The town was also home to several Confederate veterans, including General John B. Gordon, who was a Confederate general during the Civil War.
Economy
The economy of Lineville is largely based on agriculture and forestry. The town is home to several farms, which produce a variety of crops, including corn, soybeans, cotton, and hay. The town is also home to several timber companies, which harvest timber from the surrounding forests.
The town is also home to several manufacturing companies, which produce a variety of products, including furniture, textiles, and paper products. The town is also home to several retail stores, which sell a variety of goods, including clothing, groceries, and hardware.
Demographics
As of the 2010 census, the population of Lineville was 1,845. The racial makeup of the town was 95.3% White, 2.7% African American, 0.2% Native American, 0.2% Asian, 0.1% Pacific Islander, 0.7% from other races, and 0.9% from two or more races. Hispanic or Latino of any race were 1.7% of the population.
The median income for a household in the town was $30,938, and the median income for a family was $37,917. The per capita income for the town was $15,945. About 17.2% of families and 20.2% of the population were below the poverty line, including 28.3% of those under age 18 and 16.2% of those age 65 or over.
Common Questions
What is the Total Population of Lineville?
Total Population of Lineville is 2,733.
What is the Total Male Population of Lineville?
Total Male Population of Lineville is 1,265.
What is the Total Female Population of Lineville?
Total Female Population of Lineville is 1,468.
What is the Ratio of Males per 100 Females in Lineville?
There are 86.17 Males per 100 Females in Lineville.
What is the Ratio of Females per 100 Males in Lineville?
There are 116.05 Females per 100 Males in Lineville.
What is the Median Population Age in Lineville?
Median Population Age in Lineville is 53.0 Years.
What is the Average Family Size in Lineville
Average Family Size in Lineville is 3.0 People.
What is the Average Household Size in Lineville
Average Household Size in Lineville is 2.2 People.
What is Per Capita Income in Lineville?
Per Capita income in Lineville is $25,789.
What is the Median Family Income in Lineville?
Median Family Income in Lineville is $60,403.
What is the Median Household income in Lineville?
Median Household Income in Lineville is $35,435.
What is Income or Wage Gap in Lineville?
Income or Wage Gap in Lineville is 38.6%.
Women in Lineville earn 61.4 cents for every dollar earned by a man.
What is Inequality or Gini Index in Lineville?
Inequality or Gini Index in Lineville is 0.48.
How Large is the Labor Force in Lineville?
There are 1,010 People in the Labor Forcein in Lineville.
What is the Percentage of People in the Labor Force in Lineville?
44.7% of People are in the Labor Force in Lineville.
What is the Unemployment Rate in Lineville?
Unemployment Rate in Lineville is 7.2%.