Leighton, AL Map & Demographics
Leighton Map
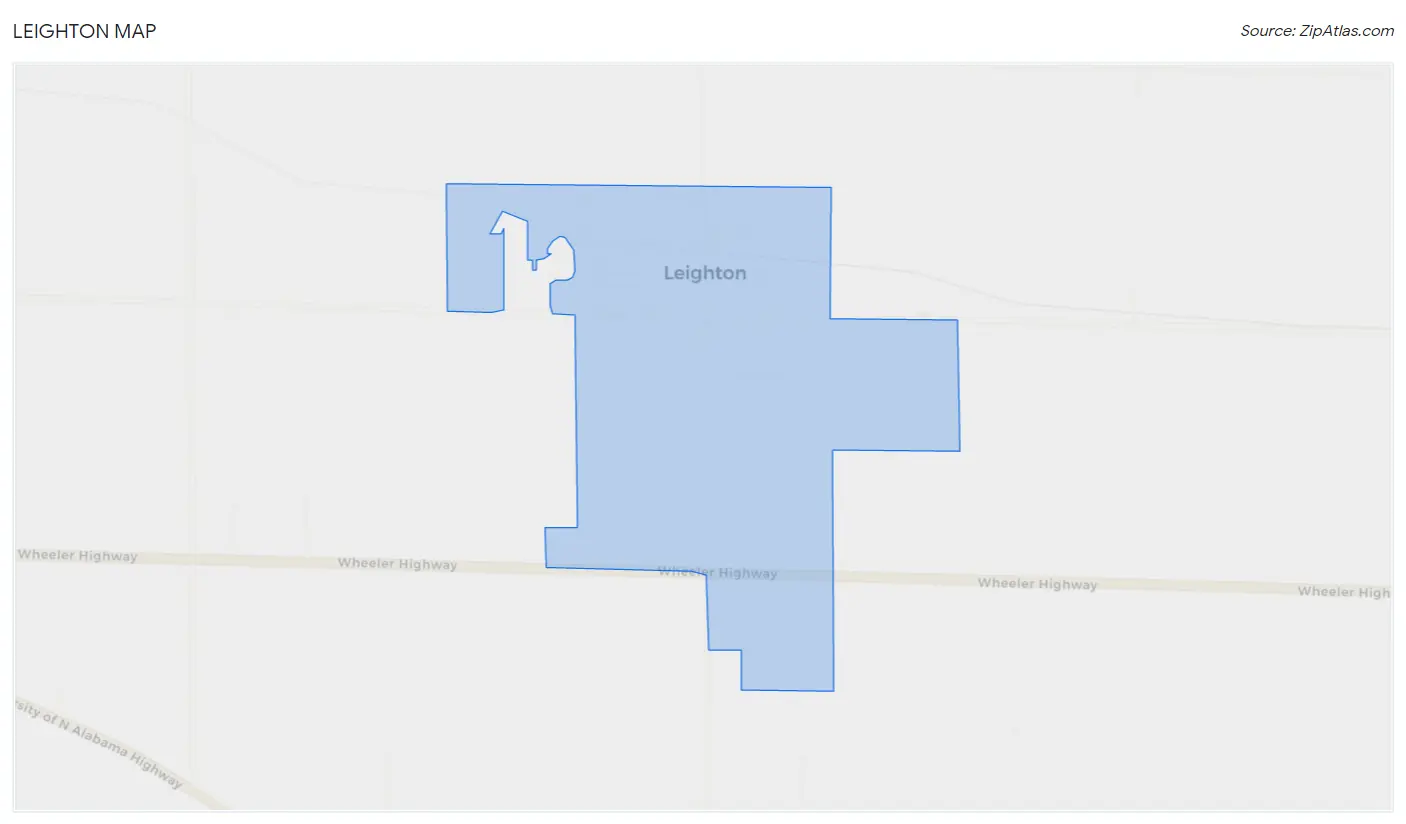
Leighton Overview
$20,644
PER CAPITA INCOME
$42,614
AVG FAMILY INCOME
$29,792
AVG HOUSEHOLD INCOME
37.6%
WAGE / INCOME GAP [ % ]
62.4¢/ $1
WAGE / INCOME GAP [ $ ]
0.50
INEQUALITY / GINI INDEX
734
TOTAL POPULATION
344
MALE POPULATION
390
FEMALE POPULATION
88.21
MALES / 100 FEMALES
113.37
FEMALES / 100 MALES
45.3
MEDIAN AGE
3.2
AVG FAMILY SIZE
2.2
AVG HOUSEHOLD SIZE
305
LABOR FORCE [ PEOPLE ]
44.7%
PERCENT IN LABOR FORCE
3.3%
UNEMPLOYMENT RATE
Leighton Zip Codes
Leighton Area Codes
Income in Leighton
Income Overview in Leighton
Per Capita Income in Leighton is $20,644, while median incomes of families and households are $42,614 and $29,792 respectively.
| Characteristic | Number | Measure |
| Per Capita Income | 734 | $20,644 |
| Median Family Income | 179 | $42,614 |
| Mean Family Income | 179 | $56,385 |
| Median Household Income | 333 | $29,792 |
| Mean Household Income | 333 | $43,016 |
| Income Deficit | 179 | $0 |
| Wage / Income Gap (%) | 734 | 37.58% |
| Wage / Income Gap ($) | 734 | 62.42¢ per $1 |
| Gini / Inequality Index | 734 | 0.50 |
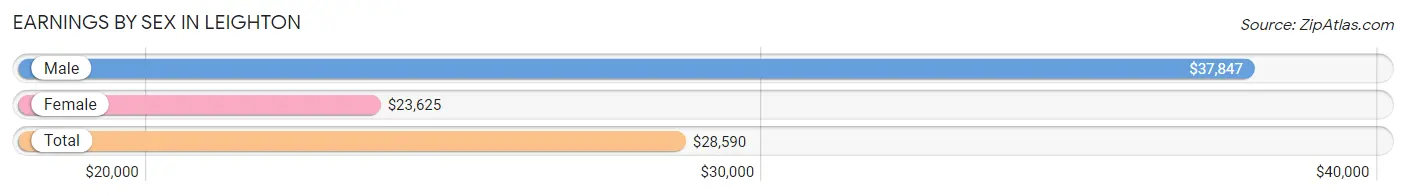
Earnings by Sex in Leighton
Average Earnings in Leighton are $28,590, $37,847 for men and $23,625 for women, a difference of 37.6%.
| Sex | Number | Average Earnings |
| Male | 115 (35.1%) | $37,847 |
| Female | 213 (64.9%) | $23,625 |
| Total | 328 (100.0%) | $28,590 |
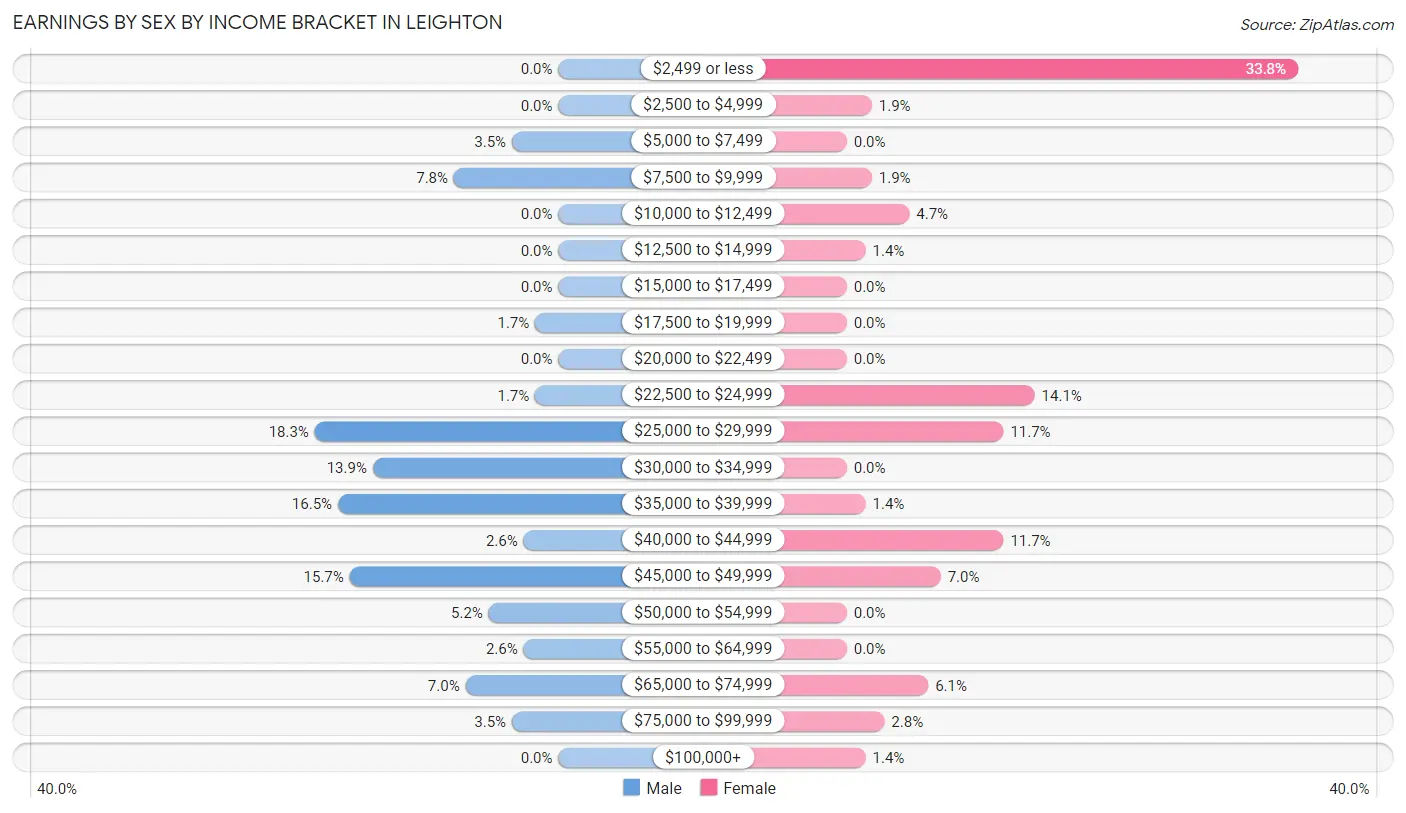
Earnings by Sex by Income Bracket in Leighton
The most common earnings brackets in Leighton are $25,000 to $29,999 for men (21 | 18.3%) and $2,499 or less for women (72 | 33.8%).
| Income | Male | Female |
| $2,499 or less | 0 (0.0%) | 72 (33.8%) |
| $2,500 to $4,999 | 0 (0.0%) | 4 (1.9%) |
| $5,000 to $7,499 | 4 (3.5%) | 0 (0.0%) |
| $7,500 to $9,999 | 9 (7.8%) | 4 (1.9%) |
| $10,000 to $12,499 | 0 (0.0%) | 10 (4.7%) |
| $12,500 to $14,999 | 0 (0.0%) | 3 (1.4%) |
| $15,000 to $17,499 | 0 (0.0%) | 0 (0.0%) |
| $17,500 to $19,999 | 2 (1.7%) | 0 (0.0%) |
| $20,000 to $22,499 | 0 (0.0%) | 0 (0.0%) |
| $22,500 to $24,999 | 2 (1.7%) | 30 (14.1%) |
| $25,000 to $29,999 | 21 (18.3%) | 25 (11.7%) |
| $30,000 to $34,999 | 16 (13.9%) | 0 (0.0%) |
| $35,000 to $39,999 | 19 (16.5%) | 3 (1.4%) |
| $40,000 to $44,999 | 3 (2.6%) | 25 (11.7%) |
| $45,000 to $49,999 | 18 (15.7%) | 15 (7.0%) |
| $50,000 to $54,999 | 6 (5.2%) | 0 (0.0%) |
| $55,000 to $64,999 | 3 (2.6%) | 0 (0.0%) |
| $65,000 to $74,999 | 8 (7.0%) | 13 (6.1%) |
| $75,000 to $99,999 | 4 (3.5%) | 6 (2.8%) |
| $100,000+ | 0 (0.0%) | 3 (1.4%) |
| Total | 115 (100.0%) | 213 (100.0%) |
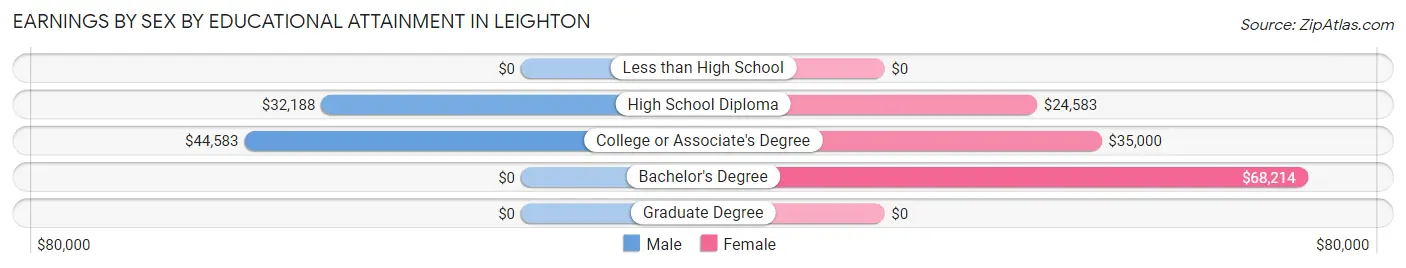
Earnings by Sex by Educational Attainment in Leighton
Average earnings in Leighton are $37,639 for men and $28,026 for women, a difference of 25.5%. Men with an educational attainment of college or associate's degree enjoy the highest average annual earnings of $44,583, while those with high school diploma education earn the least with $32,188. Women with an educational attainment of bachelor's degree earn the most with the average annual earnings of $68,214, while those with high school diploma education have the smallest earnings of $24,583.
| Educational Attainment | Male Income | Female Income |
| Less than High School | - | - |
| High School Diploma | $32,188 | $24,583 |
| College or Associate's Degree | $44,583 | $35,000 |
| Bachelor's Degree | - | - |
| Graduate Degree | - | - |
| Total | $37,639 | $28,026 |
Family Income in Leighton
Family Income Brackets in Leighton
According to the Leighton family income data, there are 35 families falling into the less than $10,000 income range, which is the most common income bracket and makes up 19.6% of all families. Conversely, the $150,000 to $199,999 income bracket is the least frequent group with only 5 families (2.8%) belonging to this category.
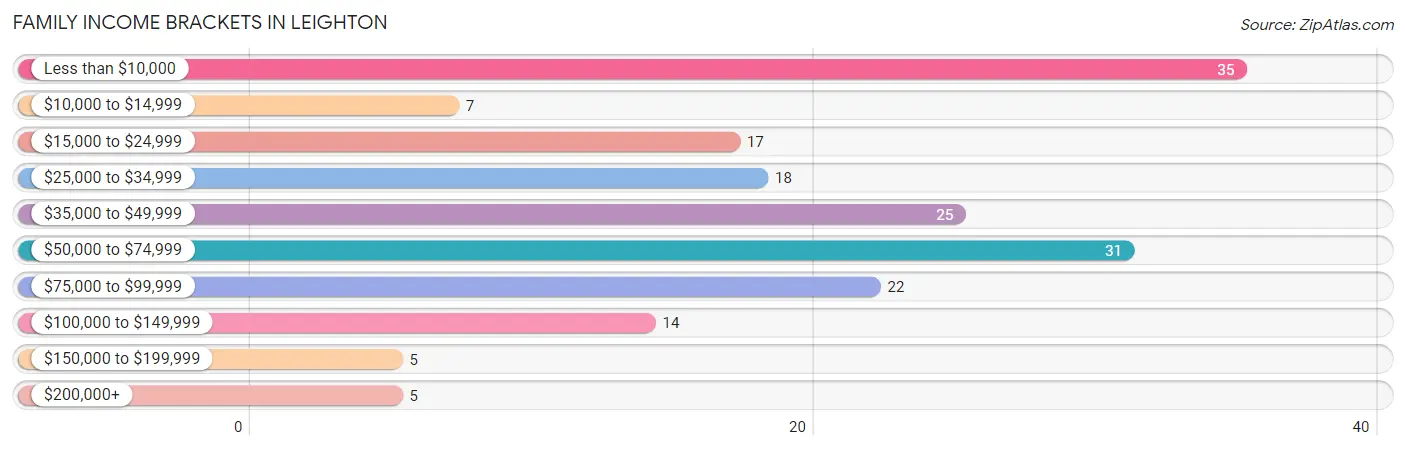
| Income Bracket | # Families | % Families |
| Less than $10,000 | 35 | 19.6% |
| $10,000 to $14,999 | 7 | 3.9% |
| $15,000 to $24,999 | 17 | 9.5% |
| $25,000 to $34,999 | 18 | 10.1% |
| $35,000 to $49,999 | 25 | 14.0% |
| $50,000 to $74,999 | 31 | 17.3% |
| $75,000 to $99,999 | 22 | 12.3% |
| $100,000 to $149,999 | 14 | 7.8% |
| $150,000 to $199,999 | 5 | 2.8% |
| $200,000+ | 5 | 2.8% |
Family Income by Famaliy Size in Leighton
4-person families (33 | 18.4%) account for the highest median family income in Leighton with $74,375 per family, while 3-person families (39 | 21.8%) have the highest median income of $18,625 per family member.
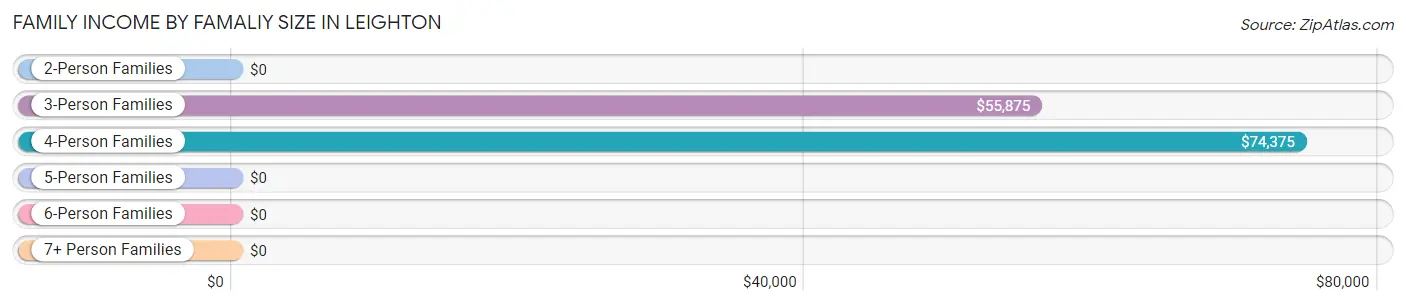
| Income Bracket | # Families | Median Income |
| 2-Person Families | 102 (57.0%) | $0 |
| 3-Person Families | 39 (21.8%) | $55,875 |
| 4-Person Families | 33 (18.4%) | $74,375 |
| 5-Person Families | 4 (2.2%) | $0 |
| 6-Person Families | 1 (0.6%) | $0 |
| 7+ Person Families | 0 (0.0%) | $0 |
| Total | 179 (100.0%) | $42,614 |
Family Income by Number of Earners in Leighton
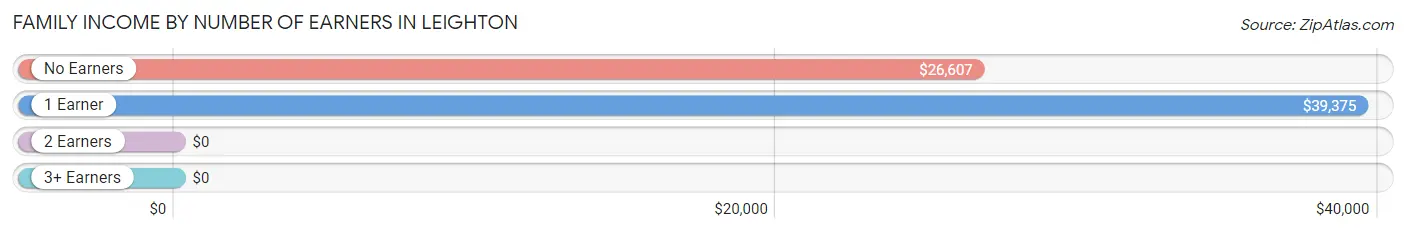
| Number of Earners | # Families | Median Income |
| No Earners | 25 (14.0%) | $26,607 |
| 1 Earner | 63 (35.2%) | $39,375 |
| 2 Earners | 82 (45.8%) | $0 |
| 3+ Earners | 9 (5.0%) | $0 |
| Total | 179 (100.0%) | $42,614 |
Household Income in Leighton
Household Income Brackets in Leighton
With 57 households falling in the category, the less than $10,000 income range is the most frequent in Leighton, accounting for 17.1% of all households. In contrast, only 5 households (1.5%) fall into the $150,000 to $199,999 income bracket, making it the least populous group.
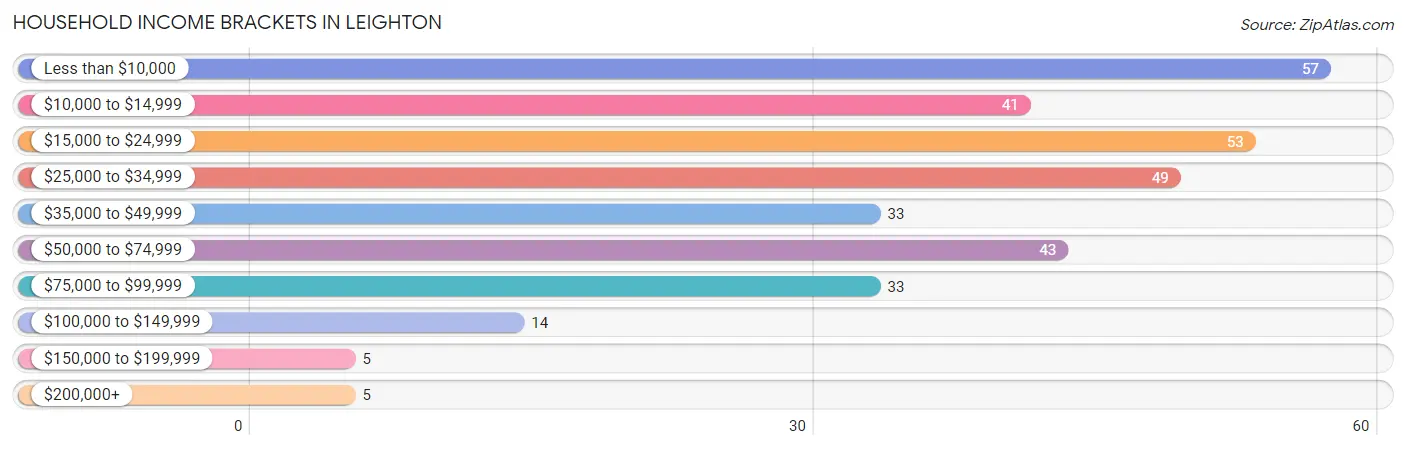
| Income Bracket | # Households | % Households |
| Less than $10,000 | 57 | 17.1% |
| $10,000 to $14,999 | 41 | 12.3% |
| $15,000 to $24,999 | 53 | 15.9% |
| $25,000 to $34,999 | 49 | 14.7% |
| $35,000 to $49,999 | 33 | 9.9% |
| $50,000 to $74,999 | 43 | 12.9% |
| $75,000 to $99,999 | 33 | 9.9% |
| $100,000 to $149,999 | 14 | 4.2% |
| $150,000 to $199,999 | 5 | 1.5% |
| $200,000+ | 5 | 1.5% |
Household Income by Householder Age in Leighton
The median household income in Leighton is $29,792, with the highest median household income of $39,464 found in the 45 to 64 years age bracket for the primary householder. A total of 125 households (37.5%) fall into this category.
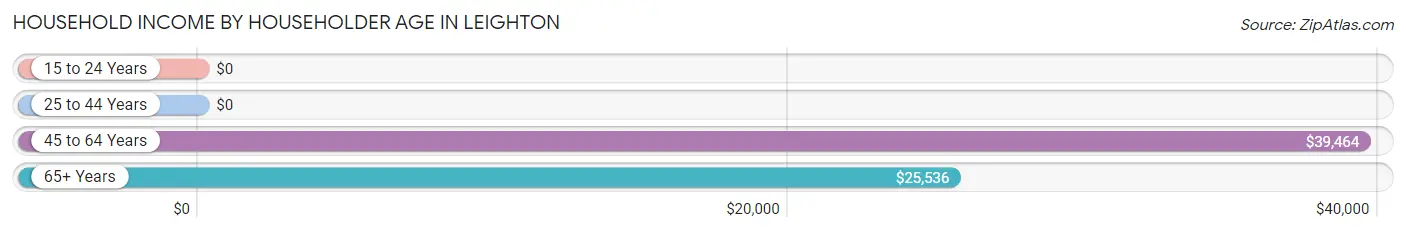
| Income Bracket | # Households | Median Income |
| 15 to 24 Years | 0 (0.0%) | $0 |
| 25 to 44 Years | 69 (20.7%) | $0 |
| 45 to 64 Years | 125 (37.5%) | $39,464 |
| 65+ Years | 139 (41.7%) | $25,536 |
| Total | 333 (100.0%) | $29,792 |
Poverty in Leighton
Income Below Poverty by Sex and Age in Leighton
With 17.4% poverty level for males and 30.0% for females among the residents of Leighton, 15 year old males and 12 to 14 year old females are the most vulnerable to poverty, with 3 males (100.0%) and 4 females (100.0%) in their respective age groups living below the poverty level.
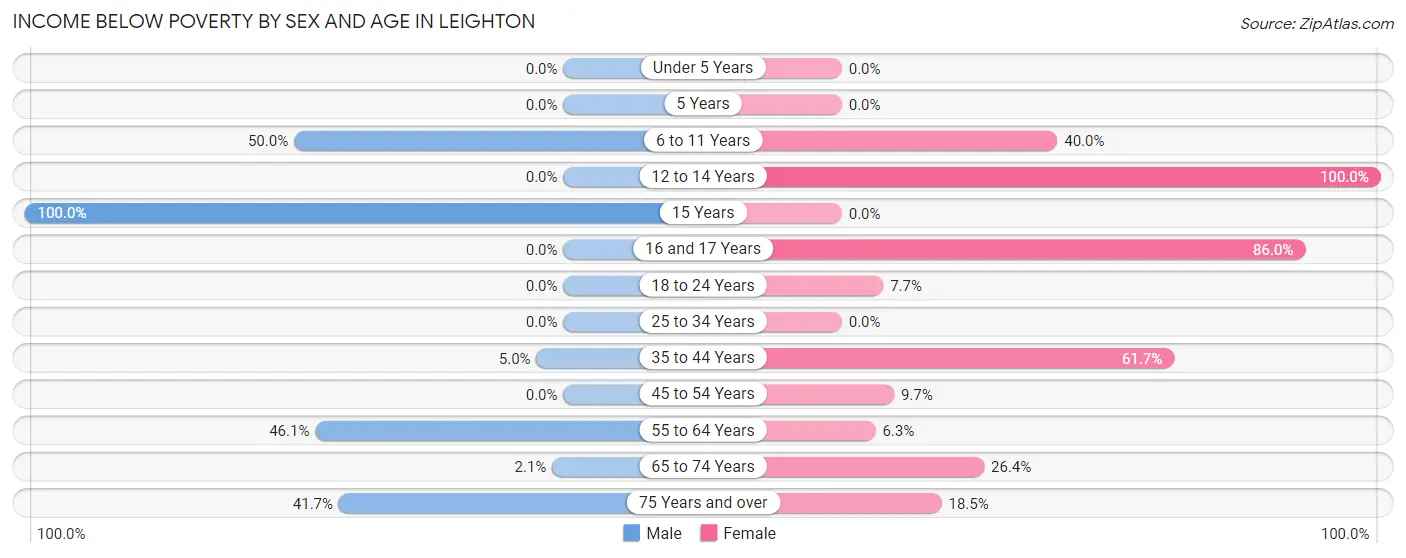
| Age Bracket | Male | Female |
| Under 5 Years | 0 (0.0%) | 0 (0.0%) |
| 5 Years | 0 (0.0%) | 0 (0.0%) |
| 6 to 11 Years | 4 (50.0%) | 2 (40.0%) |
| 12 to 14 Years | 0 (0.0%) | 4 (100.0%) |
| 15 Years | 3 (100.0%) | 0 (0.0%) |
| 16 and 17 Years | 0 (0.0%) | 43 (86.0%) |
| 18 to 24 Years | 0 (0.0%) | 3 (7.7%) |
| 25 to 34 Years | 0 (0.0%) | 0 (0.0%) |
| 35 to 44 Years | 2 (5.0%) | 37 (61.7%) |
| 45 to 54 Years | 0 (0.0%) | 6 (9.7%) |
| 55 to 64 Years | 35 (46.1%) | 3 (6.2%) |
| 65 to 74 Years | 1 (2.1%) | 14 (26.4%) |
| 75 Years and over | 15 (41.7%) | 5 (18.5%) |
| Total | 60 (17.4%) | 117 (30.0%) |
Income Above Poverty by Sex and Age in Leighton
According to the poverty statistics in Leighton, males aged under 5 years and females aged under 5 years are the age groups that are most secure financially, with 100.0% of males and 100.0% of females in these age groups living above the poverty line.
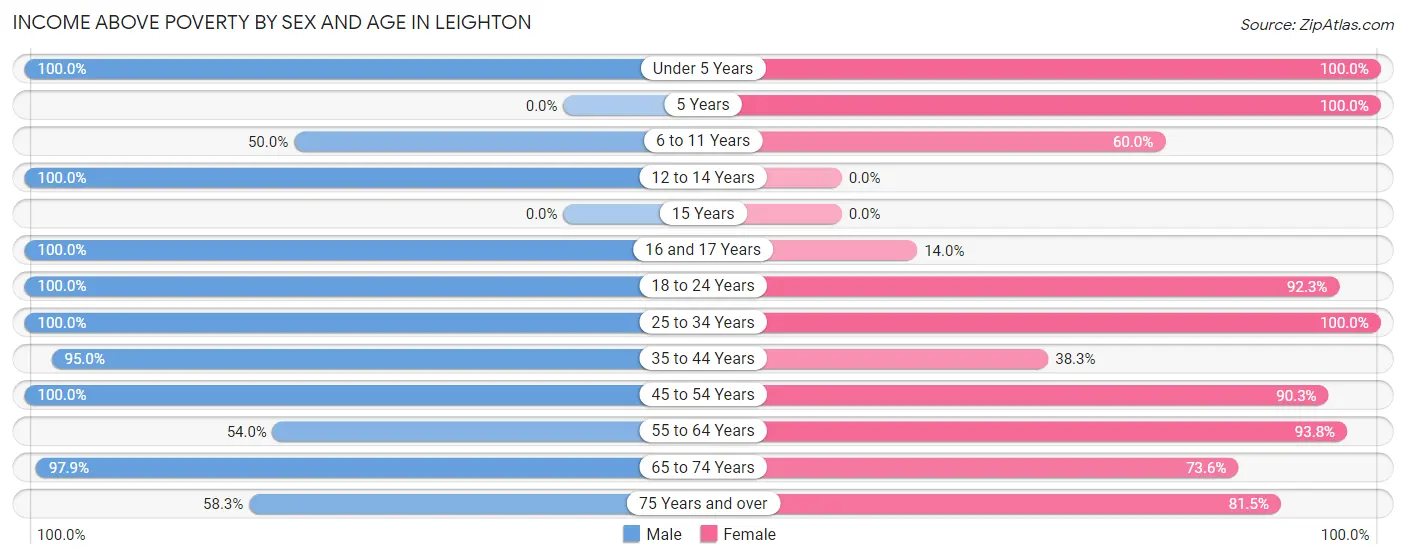
| Age Bracket | Male | Female |
| Under 5 Years | 17 (100.0%) | 8 (100.0%) |
| 5 Years | 0 (0.0%) | 1 (100.0%) |
| 6 to 11 Years | 4 (50.0%) | 3 (60.0%) |
| 12 to 14 Years | 5 (100.0%) | 0 (0.0%) |
| 15 Years | 0 (0.0%) | 0 (0.0%) |
| 16 and 17 Years | 16 (100.0%) | 7 (14.0%) |
| 18 to 24 Years | 38 (100.0%) | 36 (92.3%) |
| 25 to 34 Years | 32 (100.0%) | 33 (100.0%) |
| 35 to 44 Years | 38 (95.0%) | 23 (38.3%) |
| 45 to 54 Years | 25 (100.0%) | 56 (90.3%) |
| 55 to 64 Years | 41 (53.9%) | 45 (93.8%) |
| 65 to 74 Years | 47 (97.9%) | 39 (73.6%) |
| 75 Years and over | 21 (58.3%) | 22 (81.5%) |
| Total | 284 (82.6%) | 273 (70.0%) |
Income Below Poverty Among Married-Couple Families in Leighton
The poverty statistics for married-couple families in Leighton show that 6.9% or 5 of the total 73 families live below the poverty line. Families with 1 or 2 children have the highest poverty rate of 25.0%, comprising of 2 families. On the other hand, families with 3 or 4 children have the lowest poverty rate of 0.0%, which includes 0 families.
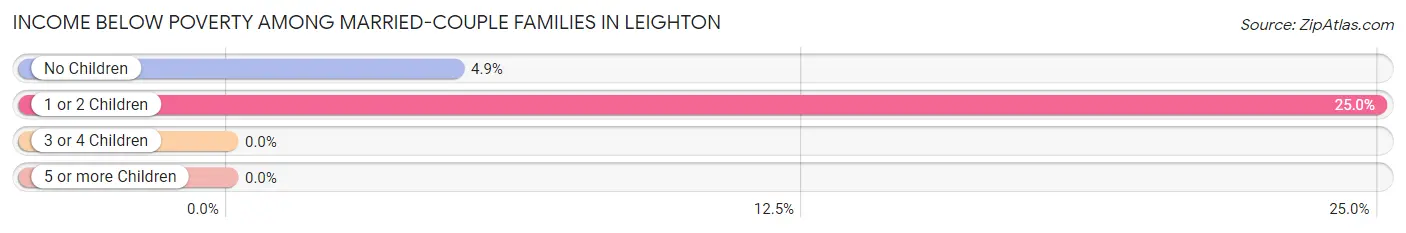
| Children | Above Poverty | Below Poverty |
| No Children | 58 (95.1%) | 3 (4.9%) |
| 1 or 2 Children | 6 (75.0%) | 2 (25.0%) |
| 3 or 4 Children | 4 (100.0%) | 0 (0.0%) |
| 5 or more Children | 0 (0.0%) | 0 (0.0%) |
| Total | 68 (93.1%) | 5 (6.9%) |
Income Below Poverty Among Single-Parent Households in Leighton
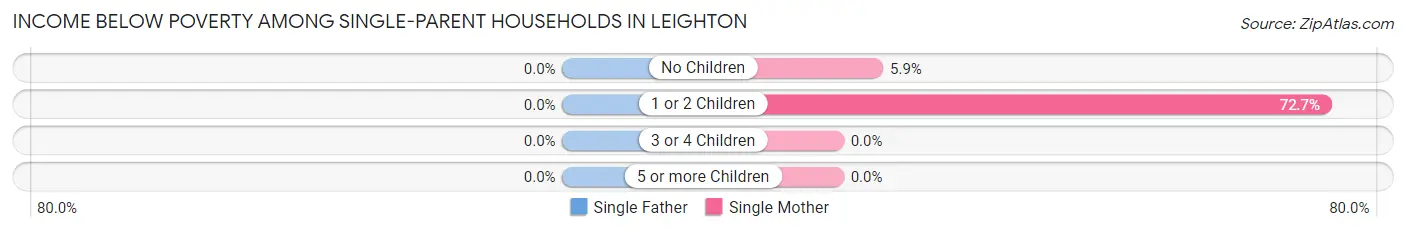
| Children | Single Father | Single Mother |
| No Children | 0 (0.0%) | 2 (5.9%) |
| 1 or 2 Children | 0 (0.0%) | 40 (72.7%) |
| 3 or 4 Children | 0 (0.0%) | 0 (0.0%) |
| 5 or more Children | 0 (0.0%) | 0 (0.0%) |
| Total | 0 (0.0%) | 42 (47.2%) |
Income Below Poverty Among Married-Couple vs Single-Parent Households in Leighton
The poverty data for Leighton shows that 5 of the married-couple family households (6.9%) and 42 of the single-parent households (39.6%) are living below the poverty level. Within the married-couple family households, those with 1 or 2 children have the highest poverty rate, with 2 households (25.0%) falling below the poverty line. Among the single-parent households, those with 1 or 2 children have the highest poverty rate, with 40 household (60.6%) living below poverty.
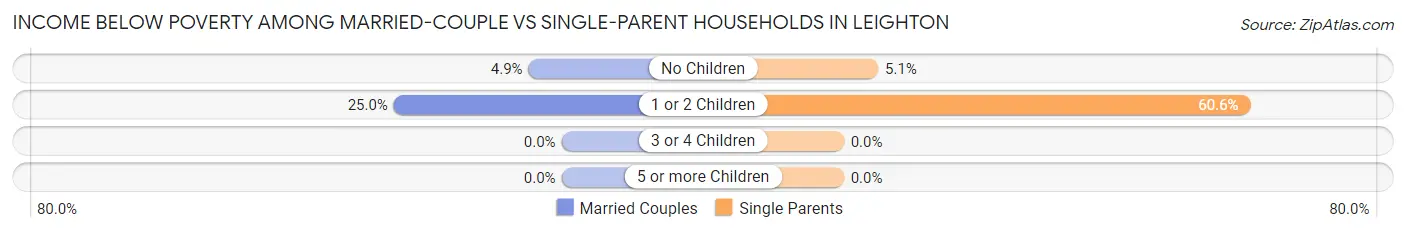
| Children | Married-Couple Families | Single-Parent Households |
| No Children | 3 (4.9%) | 2 (5.1%) |
| 1 or 2 Children | 2 (25.0%) | 40 (60.6%) |
| 3 or 4 Children | 0 (0.0%) | 0 (0.0%) |
| 5 or more Children | 0 (0.0%) | 0 (0.0%) |
| Total | 5 (6.9%) | 42 (39.6%) |
Race in Leighton
The most populous races in Leighton are Black / African American (431 | 58.7%), White / Caucasian (301 | 41.0%), and Two or more Races (2 | 0.3%).
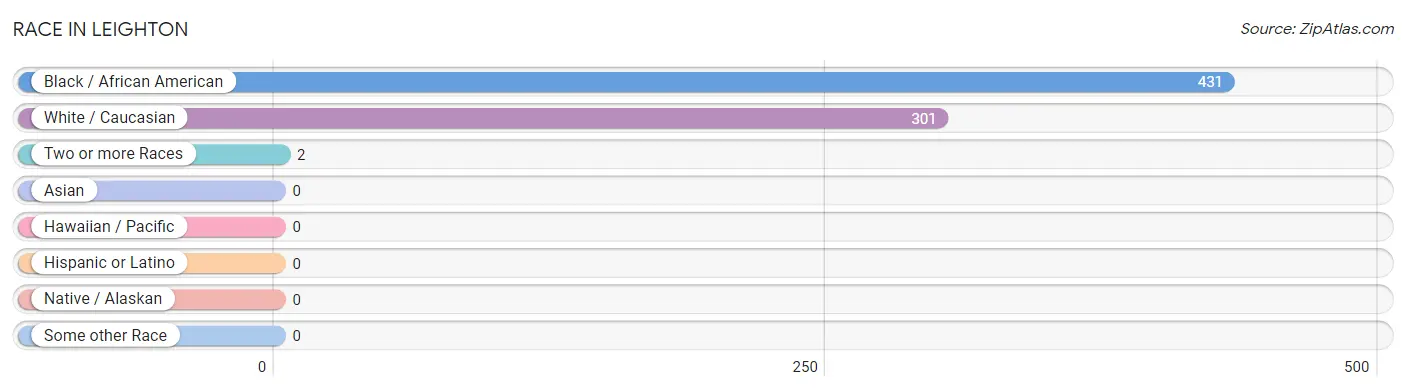
| Race | # Population | % Population |
| Asian | 0 | 0.0% |
| Black / African American | 431 | 58.7% |
| Hawaiian / Pacific | 0 | 0.0% |
| Hispanic or Latino | 0 | 0.0% |
| Native / Alaskan | 0 | 0.0% |
| White / Caucasian | 301 | 41.0% |
| Two or more Races | 2 | 0.3% |
| Some other Race | 0 | 0.0% |
| Total | 734 | 100.0% |
Ancestry in Leighton
The most populous ancestries reported in Leighton are American (184 | 25.1%), English (13 | 1.8%), Irish (12 | 1.6%), European (8 | 1.1%), and Scottish (7 | 0.9%), together accounting for 30.5% of all Leighton residents.
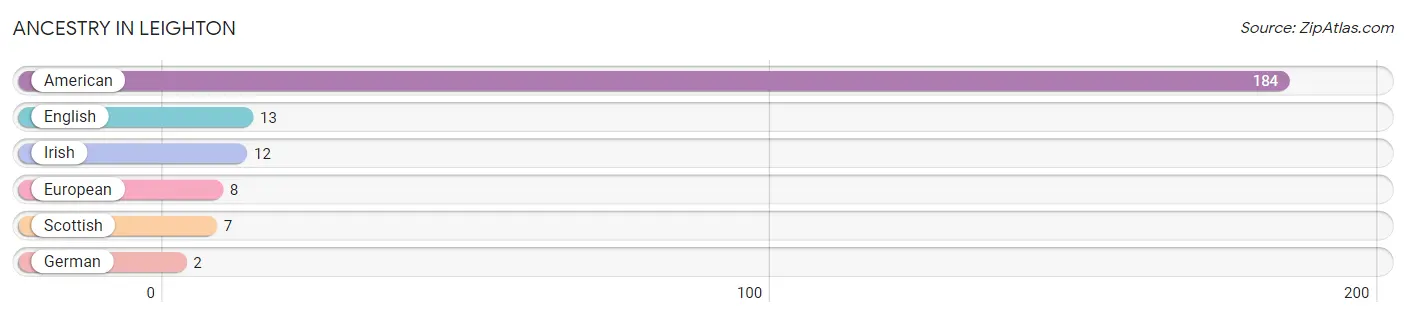
| Ancestry | # Population | % Population |
| American | 184 | 25.1% |
| English | 13 | 1.8% |
| European | 8 | 1.1% |
| German | 2 | 0.3% |
| Irish | 12 | 1.6% |
| Scottish | 7 | 0.9% | View All 6 Rows |
Immigrants in Leighton

| Immigration Origin | # Population | % Population | View All 0 Rows |
Sex and Age in Leighton
Sex and Age in Leighton
The most populous age groups in Leighton are 60 to 64 Years (47 | 13.7%) for men and 15 to 19 Years (50 | 12.8%) for women.
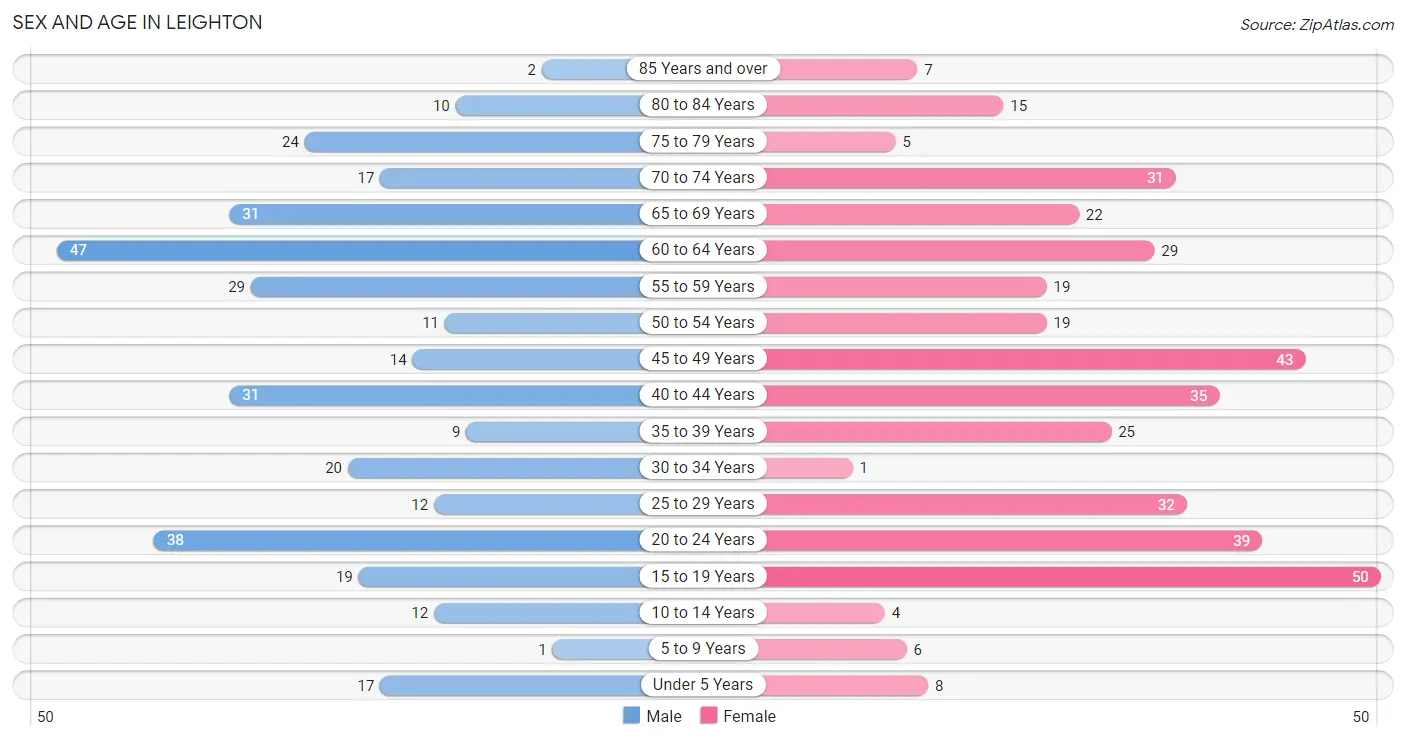
| Age Bracket | Male | Female |
| Under 5 Years | 17 (4.9%) | 8 (2.1%) |
| 5 to 9 Years | 1 (0.3%) | 6 (1.5%) |
| 10 to 14 Years | 12 (3.5%) | 4 (1.0%) |
| 15 to 19 Years | 19 (5.5%) | 50 (12.8%) |
| 20 to 24 Years | 38 (11.1%) | 39 (10.0%) |
| 25 to 29 Years | 12 (3.5%) | 32 (8.2%) |
| 30 to 34 Years | 20 (5.8%) | 1 (0.3%) |
| 35 to 39 Years | 9 (2.6%) | 25 (6.4%) |
| 40 to 44 Years | 31 (9.0%) | 35 (9.0%) |
| 45 to 49 Years | 14 (4.1%) | 43 (11.0%) |
| 50 to 54 Years | 11 (3.2%) | 19 (4.9%) |
| 55 to 59 Years | 29 (8.4%) | 19 (4.9%) |
| 60 to 64 Years | 47 (13.7%) | 29 (7.4%) |
| 65 to 69 Years | 31 (9.0%) | 22 (5.6%) |
| 70 to 74 Years | 17 (4.9%) | 31 (8.0%) |
| 75 to 79 Years | 24 (7.0%) | 5 (1.3%) |
| 80 to 84 Years | 10 (2.9%) | 15 (3.8%) |
| 85 Years and over | 2 (0.6%) | 7 (1.8%) |
| Total | 344 (100.0%) | 390 (100.0%) |
Families and Households in Leighton
Median Family Size in Leighton
The median family size in Leighton is 3.16 persons per family, with single male/father families (17 | 9.5%) accounting for the largest median family size of 5 persons per family. On the other hand, single female/mother families (89 | 49.7%) represent the smallest median family size with 2.83 persons per family.
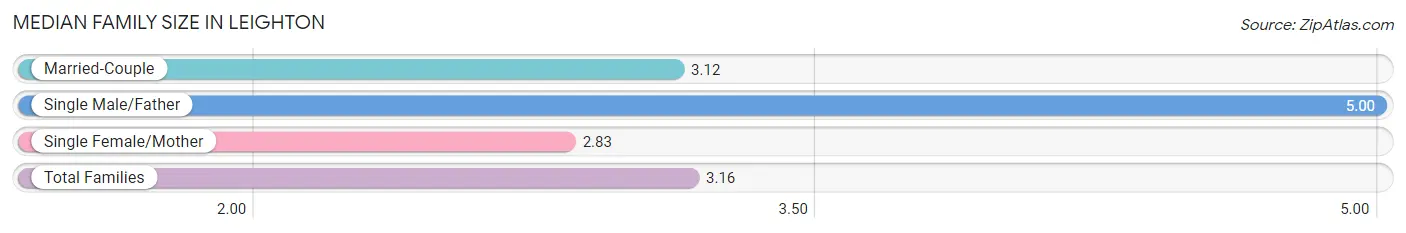
| Family Type | # Families | Family Size |
| Married-Couple | 73 (40.8%) | 3.12 |
| Single Male/Father | 17 (9.5%) | 5.00 |
| Single Female/Mother | 89 (49.7%) | 2.83 |
| Total Families | 179 (100.0%) | 3.16 |
Median Household Size in Leighton
The median household size in Leighton is 2.20 persons per household, with single male/father households (17 | 5.1%) accounting for the largest median household size of 5.76 persons per household. non-family households (154 | 46.3%) represent the smallest median household size with 1.01 persons per household.
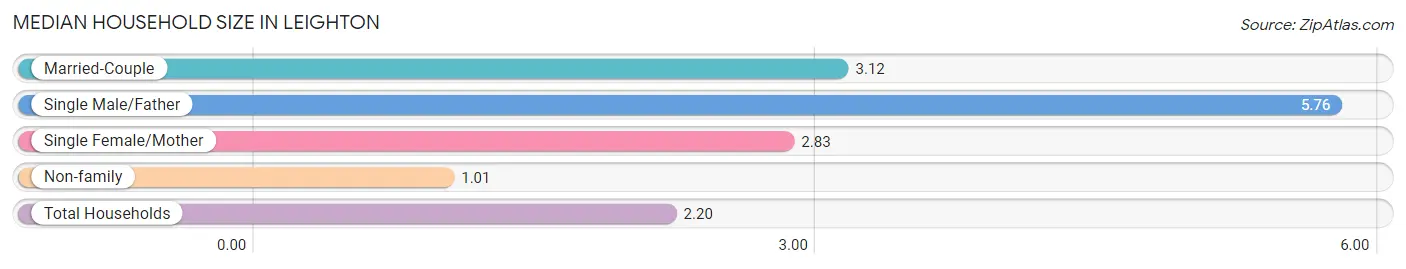
| Household Type | # Households | Household Size |
| Married-Couple | 73 (21.9%) | 3.12 |
| Single Male/Father | 17 (5.1%) | 5.76 |
| Single Female/Mother | 89 (26.7%) | 2.83 |
| Non-family | 154 (46.3%) | 1.01 |
| Total Households | 333 (100.0%) | 2.20 |
Household Size by Marriage Status in Leighton
Out of a total of 333 households in Leighton, 179 (53.7%) are family households, while 154 (46.3%) are nonfamily households. The most numerous type of family households are 2-person households, comprising 99, and the most common type of nonfamily households are 1-person households, comprising 151.
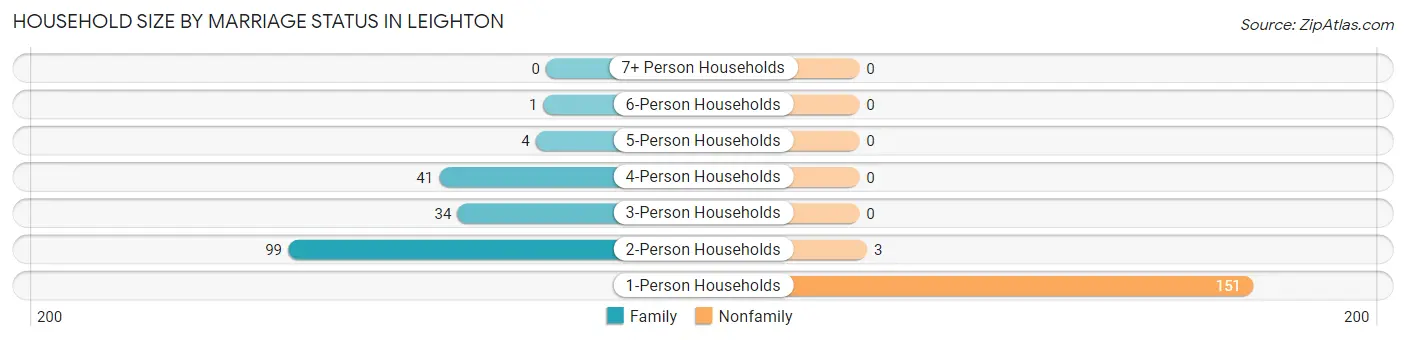
| Household Size | Family Households | Nonfamily Households |
| 1-Person Households | - | 151 (45.4%) |
| 2-Person Households | 99 (29.7%) | 3 (0.9%) |
| 3-Person Households | 34 (10.2%) | 0 (0.0%) |
| 4-Person Households | 41 (12.3%) | 0 (0.0%) |
| 5-Person Households | 4 (1.2%) | 0 (0.0%) |
| 6-Person Households | 1 (0.3%) | 0 (0.0%) |
| 7+ Person Households | 0 (0.0%) | 0 (0.0%) |
| Total | 179 (53.7%) | 154 (46.3%) |
Female Fertility in Leighton
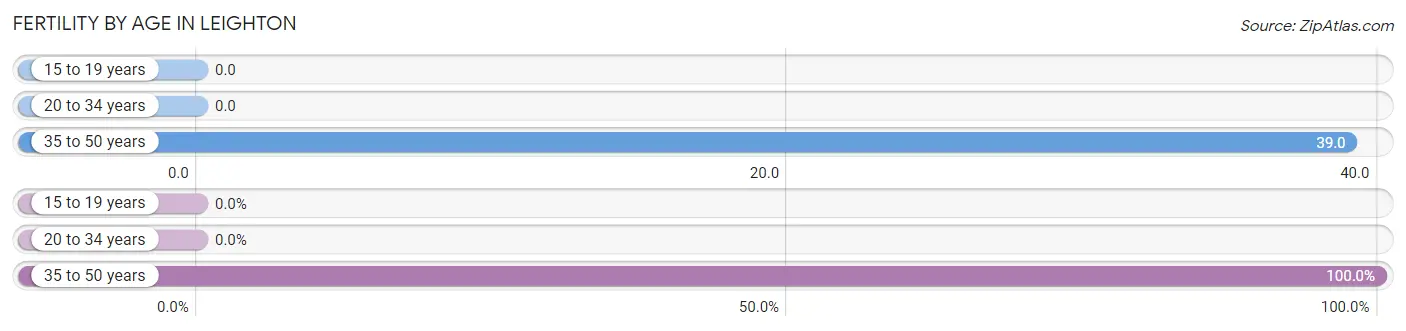
Fertility by Age in Leighton
Average fertility rate in Leighton is 18.0 births per 1,000 women. Women in the age bracket of 35 to 50 years have the highest fertility rate with 39.0 births per 1,000 women. Women in the age bracket of 35 to 50 years acount for 100.0% of all women with births.
| Age Bracket | Women with Births | Births / 1,000 Women |
| 15 to 19 years | 0 (0.0%) | 0.0 |
| 20 to 34 years | 0 (0.0%) | 0.0 |
| 35 to 50 years | 4 (100.0%) | 39.0 |
| Total | 4 (100.0%) | 18.0 |
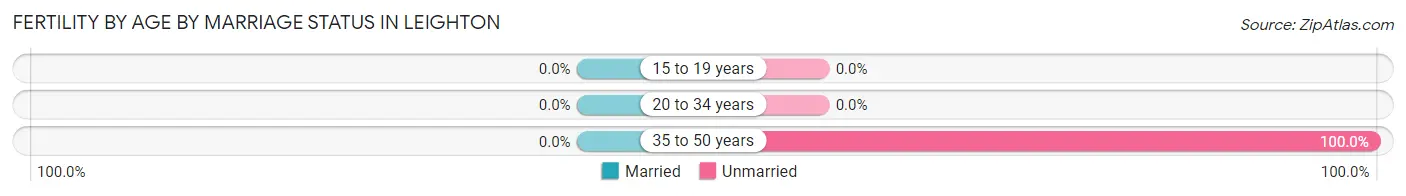
Fertility by Age by Marriage Status in Leighton
| Age Bracket | Married | Unmarried |
| 15 to 19 years | 0 (0.0%) | 0 (0.0%) |
| 20 to 34 years | 0 (0.0%) | 0 (0.0%) |
| 35 to 50 years | 0 (0.0%) | 4 (100.0%) |
| Total | 0 (0.0%) | 4 (100.0%) |
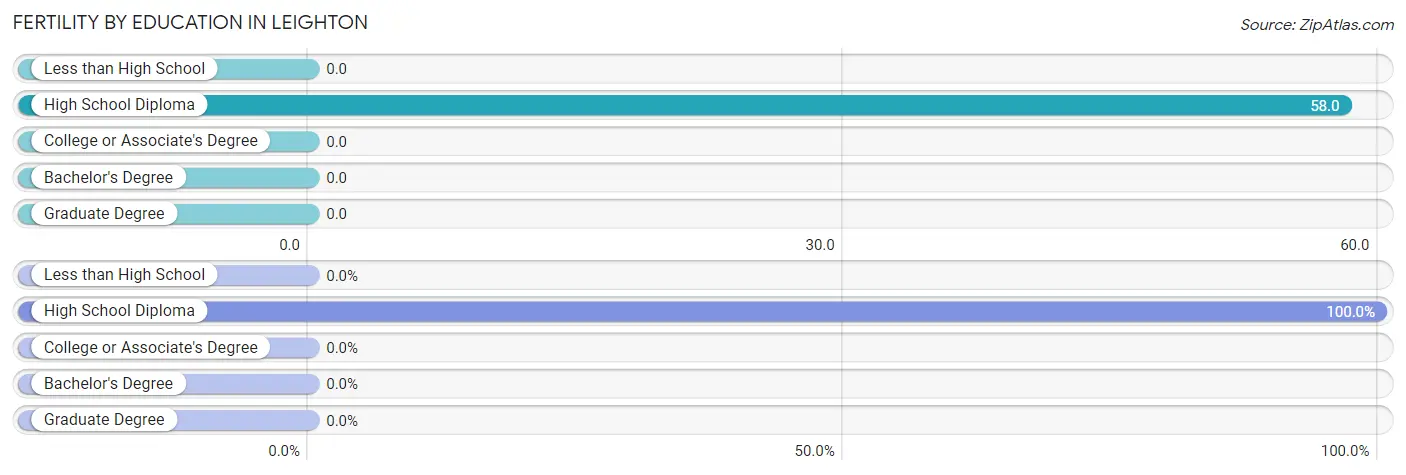
Fertility by Education in Leighton
| Educational Attainment | Women with Births | Births / 1,000 Women |
| Less than High School | 0 (0.0%) | 0.0 |
| High School Diploma | 4 (100.0%) | 58.0 |
| College or Associate's Degree | 0 (0.0%) | 0.0 |
| Bachelor's Degree | 0 (0.0%) | 0.0 |
| Graduate Degree | 0 (0.0%) | 0.0 |
| Total | 4 (100.0%) | 18.0 |
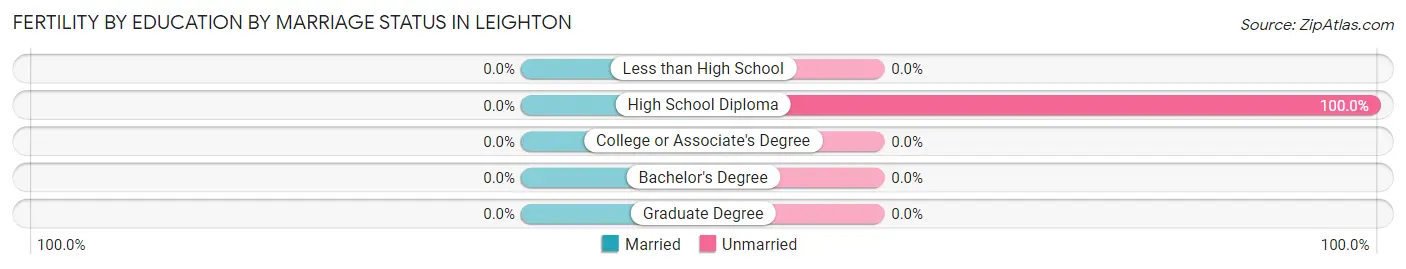
Fertility by Education by Marriage Status in Leighton
| Educational Attainment | Married | Unmarried |
| Less than High School | 0 (0.0%) | 0 (0.0%) |
| High School Diploma | 0 (0.0%) | 4 (100.0%) |
| College or Associate's Degree | 0 (0.0%) | 0 (0.0%) |
| Bachelor's Degree | 0 (0.0%) | 0 (0.0%) |
| Graduate Degree | 0 (0.0%) | 0 (0.0%) |
| Total | 0 (0.0%) | 4 (100.0%) |
Employment Characteristics in Leighton
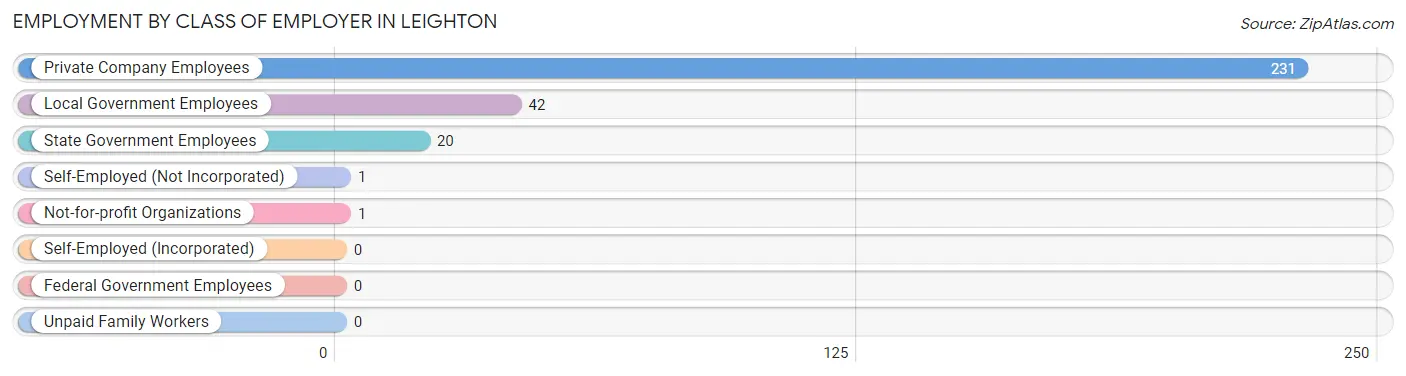
Employment by Class of Employer in Leighton
Among the 295 employed individuals in Leighton, private company employees (231 | 78.3%), local government employees (42 | 14.2%), and state government employees (20 | 6.8%) make up the most common classes of employment.
| Employer Class | # Employees | % Employees |
| Private Company Employees | 231 | 78.3% |
| Self-Employed (Incorporated) | 0 | 0.0% |
| Self-Employed (Not Incorporated) | 1 | 0.3% |
| Not-for-profit Organizations | 1 | 0.3% |
| Local Government Employees | 42 | 14.2% |
| State Government Employees | 20 | 6.8% |
| Federal Government Employees | 0 | 0.0% |
| Unpaid Family Workers | 0 | 0.0% |
| Total | 295 | 100.0% |
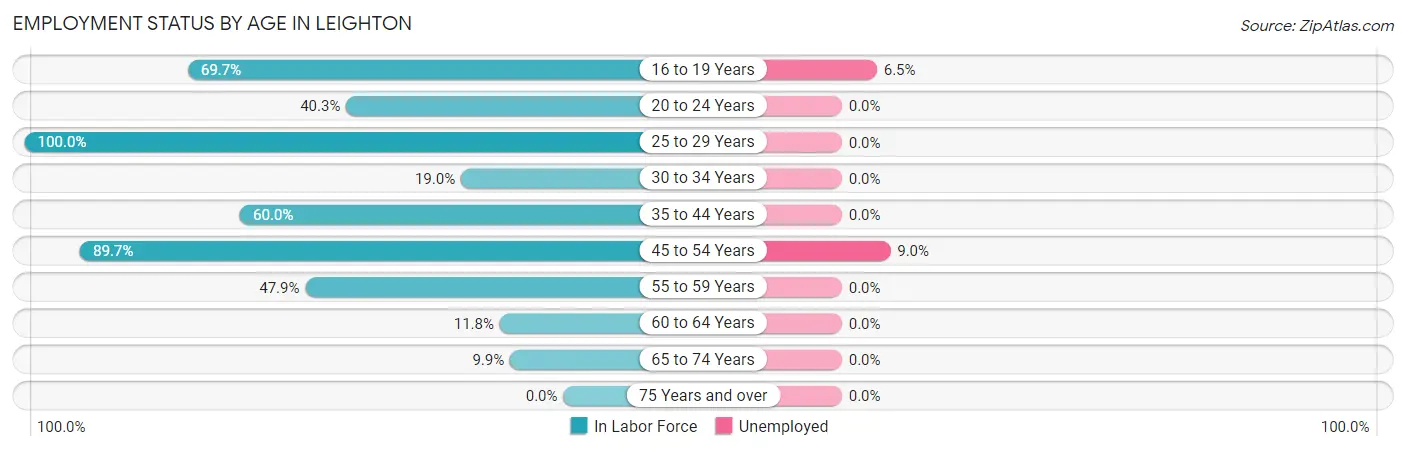
Employment Status by Age in Leighton
According to the labor force statistics for Leighton, out of the total population over 16 years of age (683), 44.7% or 305 individuals are in the labor force, with 3.3% or 10 of them unemployed. The age group with the highest labor force participation rate is 25 to 29 years, with 100.0% or 44 individuals in the labor force. Within the labor force, the 45 to 54 years age range has the highest percentage of unemployed individuals, with 9.0% or 7 of them being unemployed.
| Age Bracket | In Labor Force | Unemployed |
| 16 to 19 Years | 46 (69.7%) | 3 (6.5%) |
| 20 to 24 Years | 31 (40.3%) | 0 (0.0%) |
| 25 to 29 Years | 44 (100.0%) | 0 (0.0%) |
| 30 to 34 Years | 4 (19.0%) | 0 (0.0%) |
| 35 to 44 Years | 60 (60.0%) | 0 (0.0%) |
| 45 to 54 Years | 78 (89.7%) | 7 (9.0%) |
| 55 to 59 Years | 23 (47.9%) | 0 (0.0%) |
| 60 to 64 Years | 9 (11.8%) | 0 (0.0%) |
| 65 to 74 Years | 10 (9.9%) | 0 (0.0%) |
| 75 Years and over | 0 (0.0%) | 0 (0.0%) |
| Total | 305 (44.7%) | 10 (3.3%) |
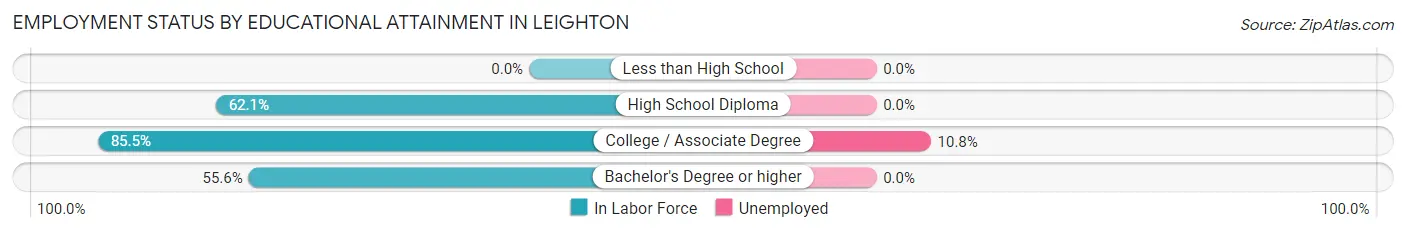
Employment Status by Educational Attainment in Leighton
According to labor force statistics for Leighton, 58.0% of individuals (218) out of the total population between 25 and 64 years of age (376) are in the labor force, with 3.2% or 7 of them being unemployed. The group with the highest labor force participation rate are those with the educational attainment of college / associate degree, with 85.5% or 65 individuals in the labor force. Within the labor force, individuals with college / associate degree education have the highest percentage of unemployment, with 10.8% or 7 of them being unemployed.
| Educational Attainment | In Labor Force | Unemployed |
| Less than High School | 0 (0.0%) | 0 (0.0%) |
| High School Diploma | 123 (62.1%) | 0 (0.0%) |
| College / Associate Degree | 65 (85.5%) | 8 (10.8%) |
| Bachelor's Degree or higher | 30 (55.6%) | 0 (0.0%) |
| Total | 218 (58.0%) | 12 (3.2%) |
Employment Occupations by Sex in Leighton
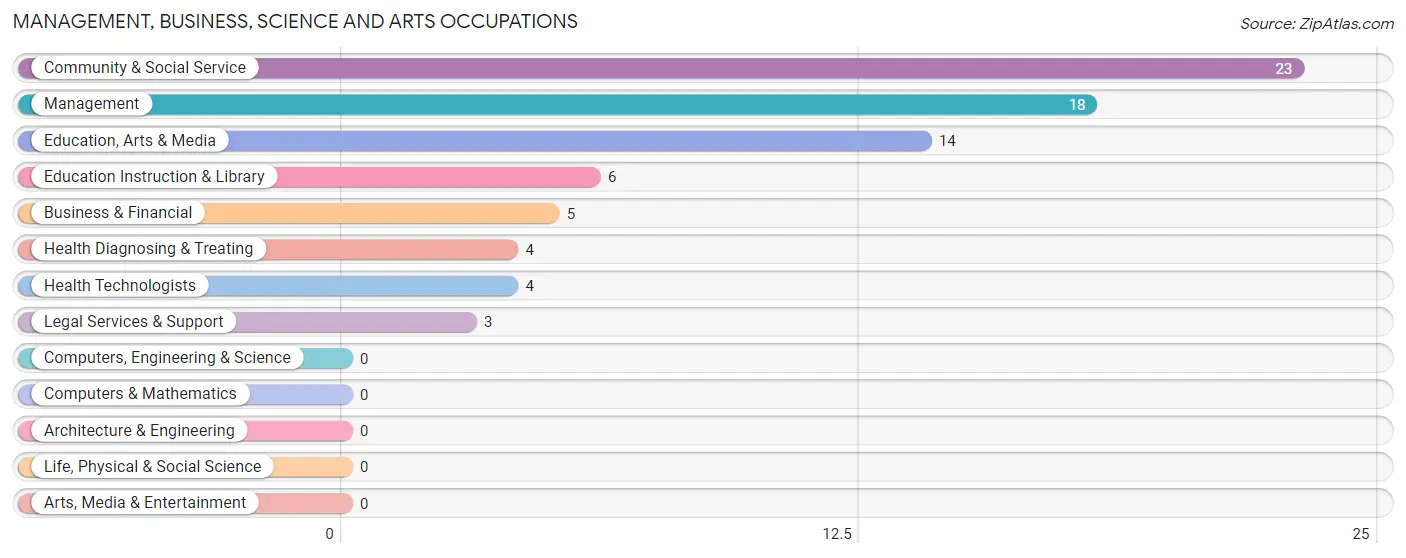
Management, Business, Science and Arts Occupations
The most common Management, Business, Science and Arts occupations in Leighton are Community & Social Service (23 | 7.8%), Management (18 | 6.1%), Education, Arts & Media (14 | 4.8%), Education Instruction & Library (6 | 2.0%), and Business & Financial (5 | 1.7%).
Management, Business, Science and Arts Occupations by Sex
Within the Management, Business, Science and Arts occupations in Leighton, the most male-oriented occupations are Business & Financial (60.0%), Legal Services & Support (33.3%), and Management (16.7%), while the most female-oriented occupations are Education, Arts & Media (100.0%), Education Instruction & Library (100.0%), and Health Diagnosing & Treating (100.0%).
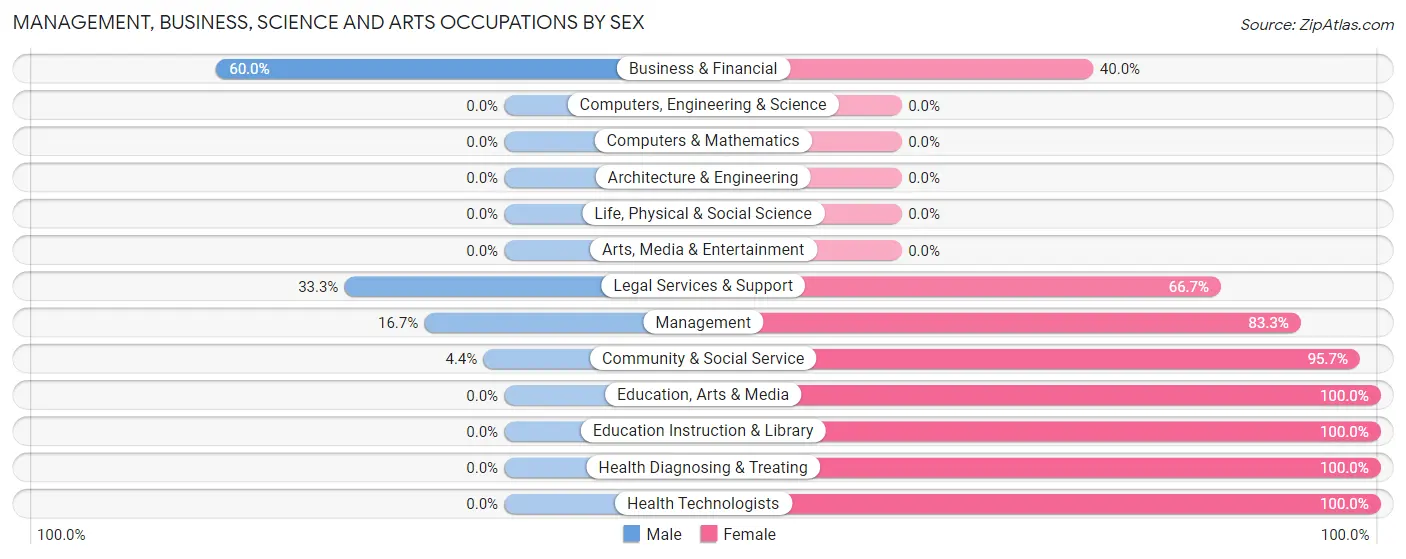
| Occupation | Male | Female |
| Management | 3 (16.7%) | 15 (83.3%) |
| Business & Financial | 3 (60.0%) | 2 (40.0%) |
| Computers, Engineering & Science | 0 (0.0%) | 0 (0.0%) |
| Computers & Mathematics | 0 (0.0%) | 0 (0.0%) |
| Architecture & Engineering | 0 (0.0%) | 0 (0.0%) |
| Life, Physical & Social Science | 0 (0.0%) | 0 (0.0%) |
| Community & Social Service | 1 (4.3%) | 22 (95.7%) |
| Education, Arts & Media | 0 (0.0%) | 14 (100.0%) |
| Legal Services & Support | 1 (33.3%) | 2 (66.7%) |
| Education Instruction & Library | 0 (0.0%) | 6 (100.0%) |
| Arts, Media & Entertainment | 0 (0.0%) | 0 (0.0%) |
| Health Diagnosing & Treating | 0 (0.0%) | 4 (100.0%) |
| Health Technologists | 0 (0.0%) | 4 (100.0%) |
| Total (Category) | 7 (14.0%) | 43 (86.0%) |
| Total (Overall) | 115 (39.0%) | 180 (61.0%) |
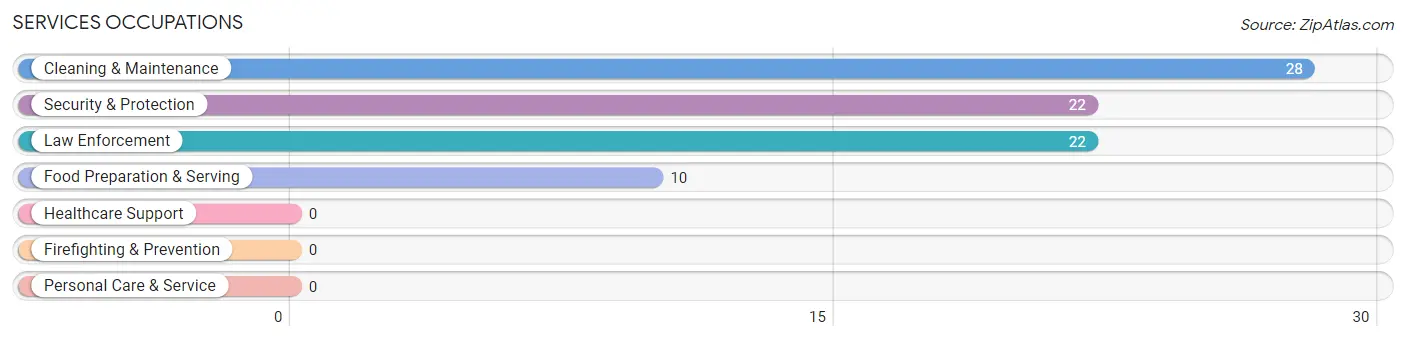
Services Occupations
The most common Services occupations in Leighton are Cleaning & Maintenance (28 | 9.5%), Security & Protection (22 | 7.5%), Law Enforcement (22 | 7.5%), and Food Preparation & Serving (10 | 3.4%).
Services Occupations by Sex
Within the Services occupations in Leighton, the most male-oriented occupations are Security & Protection (63.6%), Law Enforcement (63.6%), and Cleaning & Maintenance (42.9%), while the most female-oriented occupations are Food Preparation & Serving (100.0%), Cleaning & Maintenance (57.1%), and Security & Protection (36.4%).
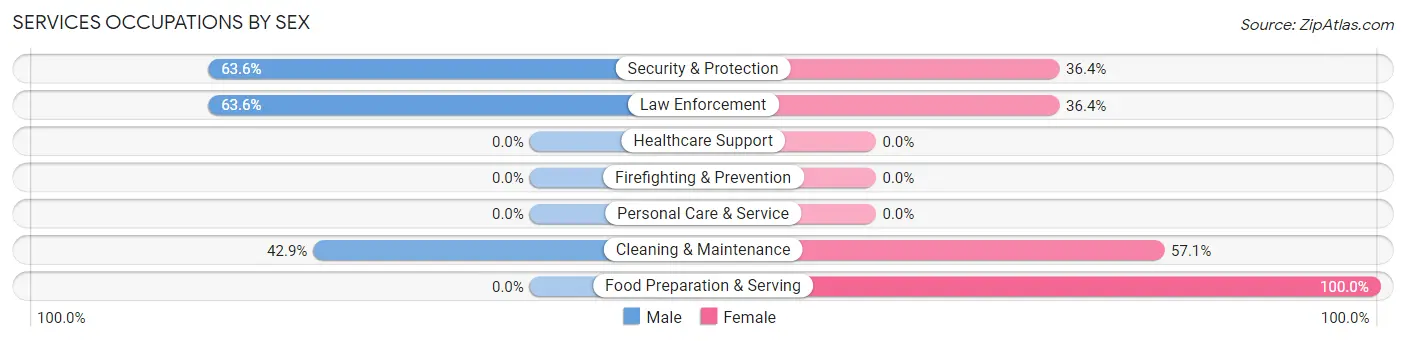
| Occupation | Male | Female |
| Healthcare Support | 0 (0.0%) | 0 (0.0%) |
| Security & Protection | 14 (63.6%) | 8 (36.4%) |
| Firefighting & Prevention | 0 (0.0%) | 0 (0.0%) |
| Law Enforcement | 14 (63.6%) | 8 (36.4%) |
| Food Preparation & Serving | 0 (0.0%) | 10 (100.0%) |
| Cleaning & Maintenance | 12 (42.9%) | 16 (57.1%) |
| Personal Care & Service | 0 (0.0%) | 0 (0.0%) |
| Total (Category) | 26 (43.3%) | 34 (56.7%) |
| Total (Overall) | 115 (39.0%) | 180 (61.0%) |
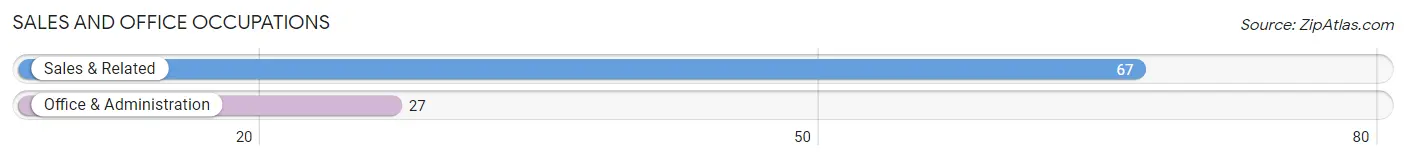
Sales and Office Occupations
The most common Sales and Office occupations in Leighton are Sales & Related (67 | 22.7%), and Office & Administration (27 | 9.1%).
Sales and Office Occupations by Sex
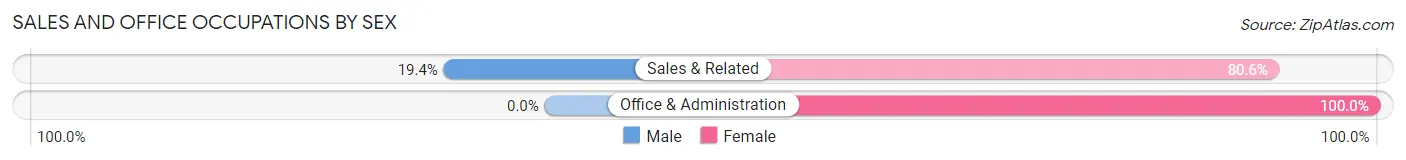
| Occupation | Male | Female |
| Sales & Related | 13 (19.4%) | 54 (80.6%) |
| Office & Administration | 0 (0.0%) | 27 (100.0%) |
| Total (Category) | 13 (13.8%) | 81 (86.2%) |
| Total (Overall) | 115 (39.0%) | 180 (61.0%) |
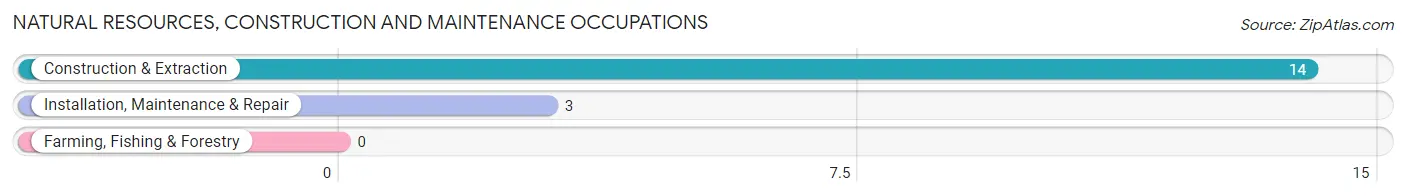
Natural Resources, Construction and Maintenance Occupations
The most common Natural Resources, Construction and Maintenance occupations in Leighton are Construction & Extraction (14 | 4.8%), and Installation, Maintenance & Repair (3 | 1.0%).
Natural Resources, Construction and Maintenance Occupations by Sex
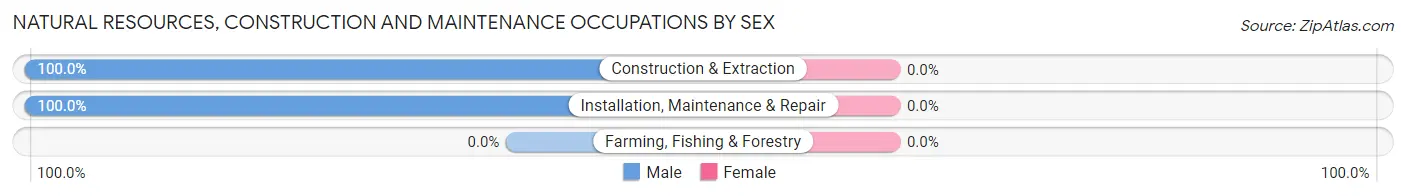
| Occupation | Male | Female |
| Farming, Fishing & Forestry | 0 (0.0%) | 0 (0.0%) |
| Construction & Extraction | 14 (100.0%) | 0 (0.0%) |
| Installation, Maintenance & Repair | 3 (100.0%) | 0 (0.0%) |
| Total (Category) | 17 (100.0%) | 0 (0.0%) |
| Total (Overall) | 115 (39.0%) | 180 (61.0%) |
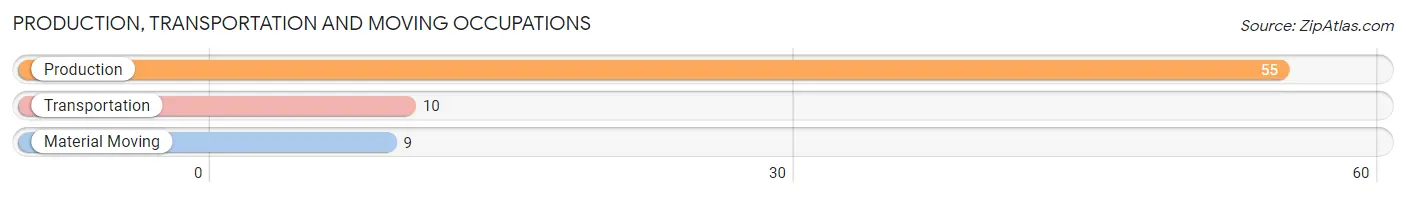
Production, Transportation and Moving Occupations
The most common Production, Transportation and Moving occupations in Leighton are Production (55 | 18.6%), Transportation (10 | 3.4%), and Material Moving (9 | 3.0%).
Production, Transportation and Moving Occupations by Sex
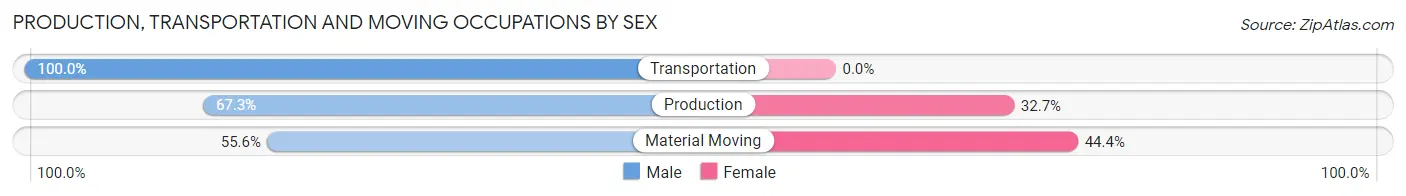
| Occupation | Male | Female |
| Production | 37 (67.3%) | 18 (32.7%) |
| Transportation | 10 (100.0%) | 0 (0.0%) |
| Material Moving | 5 (55.6%) | 4 (44.4%) |
| Total (Category) | 52 (70.3%) | 22 (29.7%) |
| Total (Overall) | 115 (39.0%) | 180 (61.0%) |
Employment Industries by Sex in Leighton
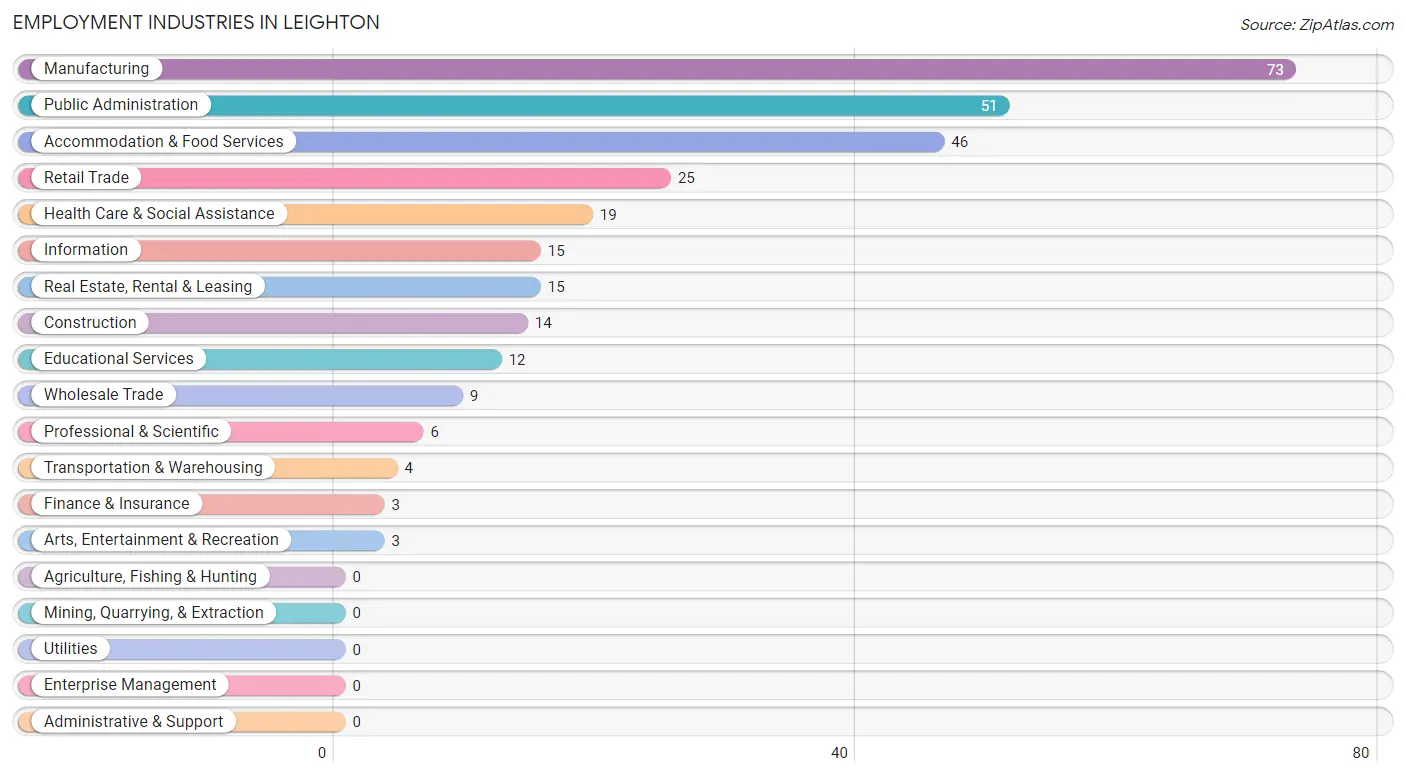
Employment Industries in Leighton
The major employment industries in Leighton include Manufacturing (73 | 24.7%), Public Administration (51 | 17.3%), Accommodation & Food Services (46 | 15.6%), Retail Trade (25 | 8.5%), and Health Care & Social Assistance (19 | 6.4%).
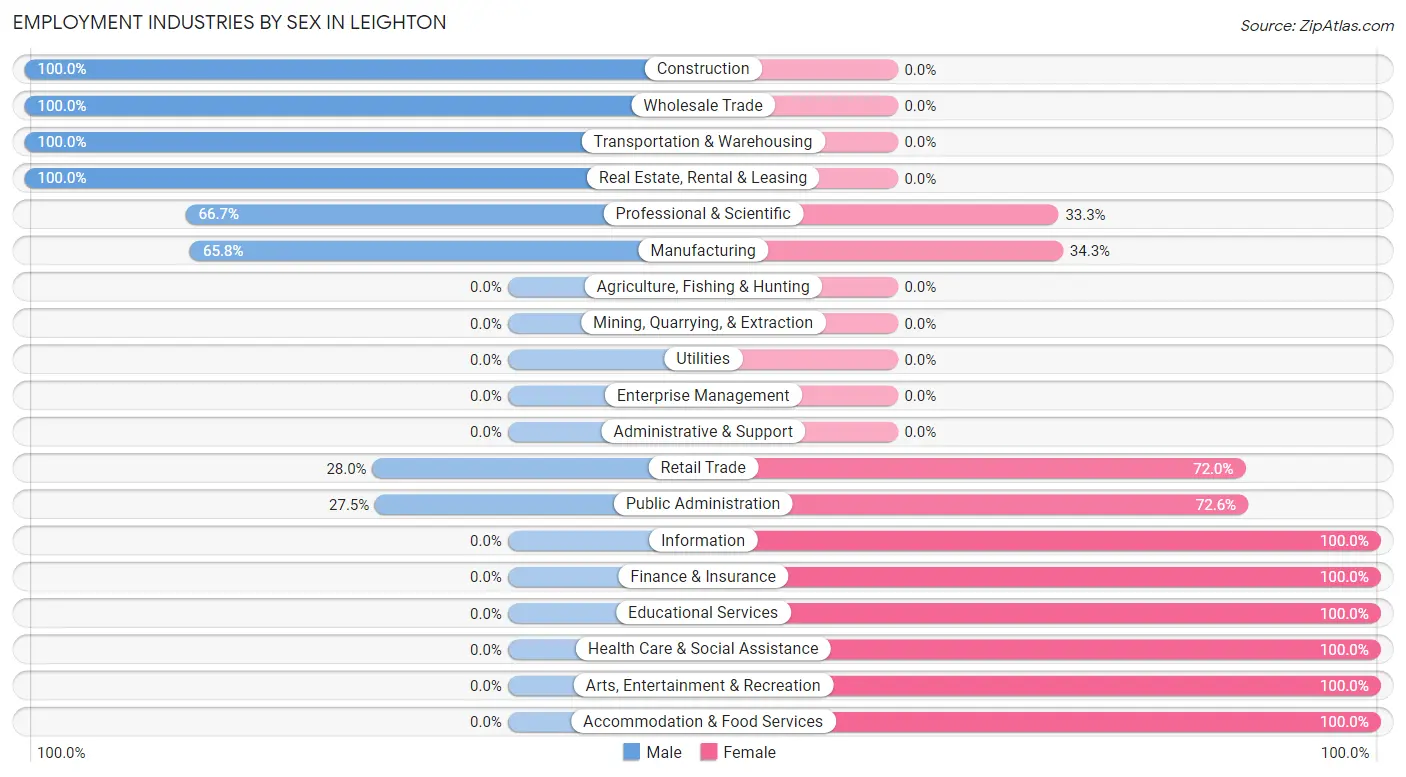
Employment Industries by Sex in Leighton
The Leighton industries that see more men than women are Construction (100.0%), Wholesale Trade (100.0%), and Transportation & Warehousing (100.0%), whereas the industries that tend to have a higher number of women are Information (100.0%), Finance & Insurance (100.0%), and Educational Services (100.0%).
| Industry | Male | Female |
| Agriculture, Fishing & Hunting | 0 (0.0%) | 0 (0.0%) |
| Mining, Quarrying, & Extraction | 0 (0.0%) | 0 (0.0%) |
| Construction | 14 (100.0%) | 0 (0.0%) |
| Manufacturing | 48 (65.7%) | 25 (34.3%) |
| Wholesale Trade | 9 (100.0%) | 0 (0.0%) |
| Retail Trade | 7 (28.0%) | 18 (72.0%) |
| Transportation & Warehousing | 4 (100.0%) | 0 (0.0%) |
| Utilities | 0 (0.0%) | 0 (0.0%) |
| Information | 0 (0.0%) | 15 (100.0%) |
| Finance & Insurance | 0 (0.0%) | 3 (100.0%) |
| Real Estate, Rental & Leasing | 15 (100.0%) | 0 (0.0%) |
| Professional & Scientific | 4 (66.7%) | 2 (33.3%) |
| Enterprise Management | 0 (0.0%) | 0 (0.0%) |
| Administrative & Support | 0 (0.0%) | 0 (0.0%) |
| Educational Services | 0 (0.0%) | 12 (100.0%) |
| Health Care & Social Assistance | 0 (0.0%) | 19 (100.0%) |
| Arts, Entertainment & Recreation | 0 (0.0%) | 3 (100.0%) |
| Accommodation & Food Services | 0 (0.0%) | 46 (100.0%) |
| Public Administration | 14 (27.5%) | 37 (72.6%) |
| Total | 115 (39.0%) | 180 (61.0%) |
Education in Leighton
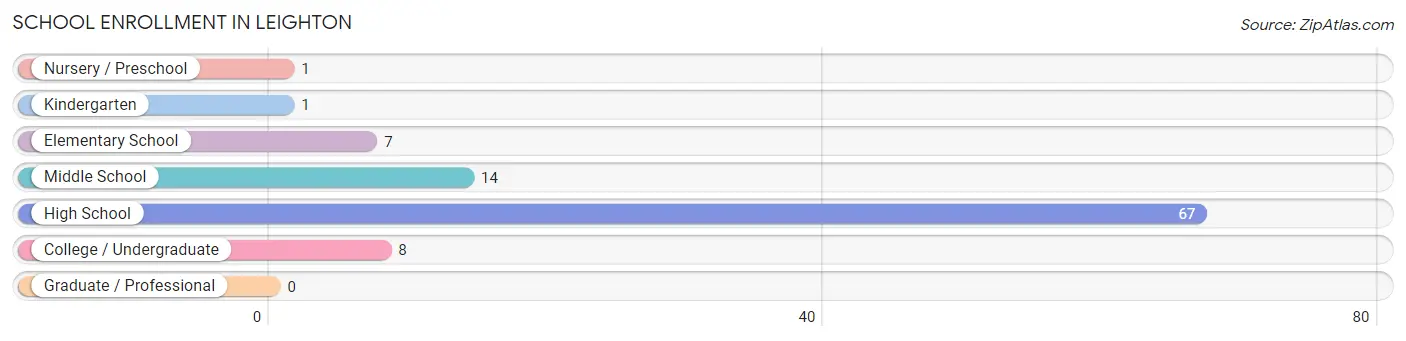
School Enrollment in Leighton
The most common levels of schooling among the 98 students in Leighton are high school (67 | 68.4%), middle school (14 | 14.3%), and college / undergraduate (8 | 8.2%).
| School Level | # Students | % Students |
| Nursery / Preschool | 1 | 1.0% |
| Kindergarten | 1 | 1.0% |
| Elementary School | 7 | 7.1% |
| Middle School | 14 | 14.3% |
| High School | 67 | 68.4% |
| College / Undergraduate | 8 | 8.2% |
| Graduate / Professional | 0 | 0.0% |
| Total | 98 | 100.0% |
School Enrollment by Age by Funding Source in Leighton
Out of a total of 98 students who are enrolled in schools in Leighton, 4 (4.1%) attend a private institution, while the remaining 94 (95.9%) are enrolled in public schools. The age group of 10 to 14 year olds has the highest likelihood of being enrolled in private schools, with 4 (25.0% in the age bracket) enrolled. Conversely, the age group of 5 to 9 year old has the lowest likelihood of being enrolled in a private school, with 7 (100.0% in the age bracket) attending a public institution.
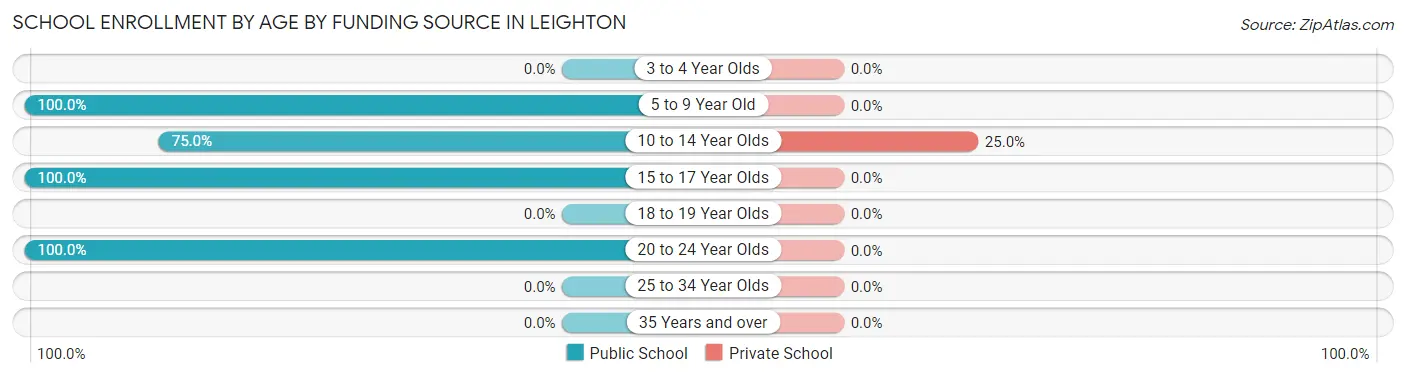
| Age Bracket | Public School | Private School |
| 3 to 4 Year Olds | 0 (0.0%) | 0 (0.0%) |
| 5 to 9 Year Old | 7 (100.0%) | 0 (0.0%) |
| 10 to 14 Year Olds | 12 (75.0%) | 4 (25.0%) |
| 15 to 17 Year Olds | 67 (100.0%) | 0 (0.0%) |
| 18 to 19 Year Olds | 0 (0.0%) | 0 (0.0%) |
| 20 to 24 Year Olds | 8 (100.0%) | 0 (0.0%) |
| 25 to 34 Year Olds | 0 (0.0%) | 0 (0.0%) |
| 35 Years and over | 0 (0.0%) | 0 (0.0%) |
| Total | 94 (95.9%) | 4 (4.1%) |
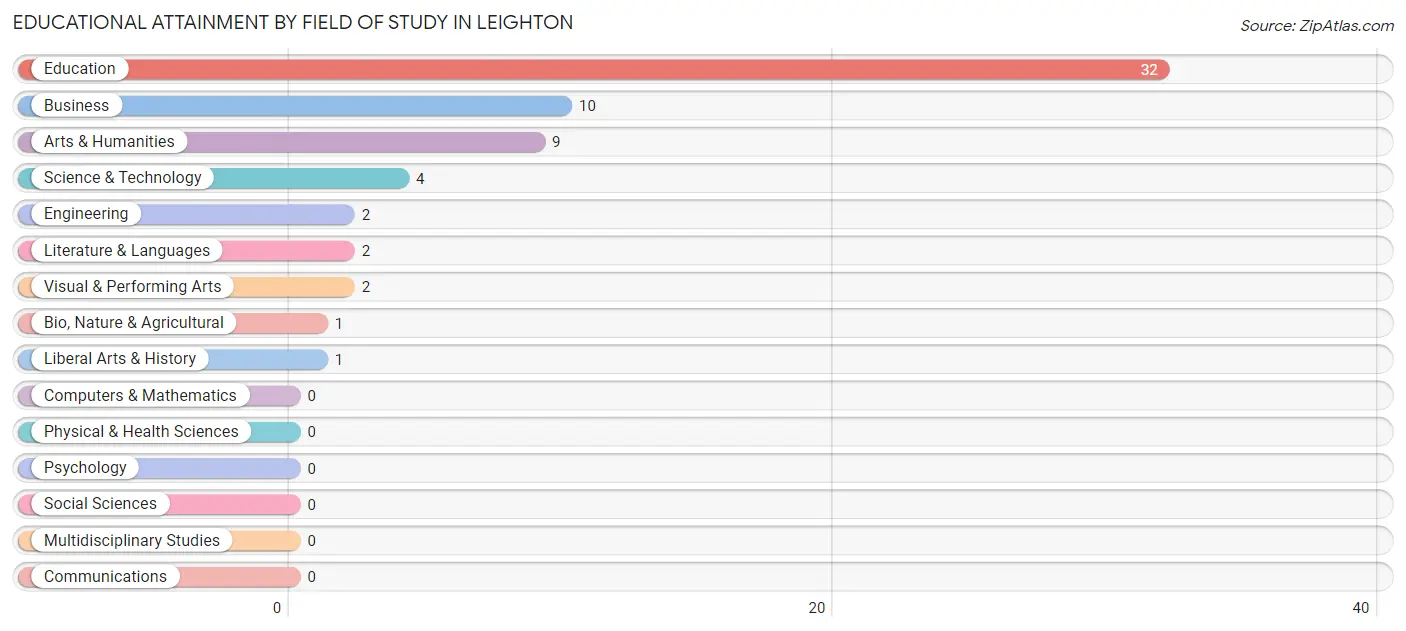
Educational Attainment by Field of Study in Leighton
Education (32 | 50.8%), business (10 | 15.9%), arts & humanities (9 | 14.3%), science & technology (4 | 6.4%), and engineering (2 | 3.2%) are the most common fields of study among 63 individuals in Leighton who have obtained a bachelor's degree or higher.
| Field of Study | # Graduates | % Graduates |
| Computers & Mathematics | 0 | 0.0% |
| Bio, Nature & Agricultural | 1 | 1.6% |
| Physical & Health Sciences | 0 | 0.0% |
| Psychology | 0 | 0.0% |
| Social Sciences | 0 | 0.0% |
| Engineering | 2 | 3.2% |
| Multidisciplinary Studies | 0 | 0.0% |
| Science & Technology | 4 | 6.4% |
| Business | 10 | 15.9% |
| Education | 32 | 50.8% |
| Literature & Languages | 2 | 3.2% |
| Liberal Arts & History | 1 | 1.6% |
| Visual & Performing Arts | 2 | 3.2% |
| Communications | 0 | 0.0% |
| Arts & Humanities | 9 | 14.3% |
| Total | 63 | 100.0% |
Transportation & Commute in Leighton
Vehicle Availability by Sex in Leighton
The most prevalent vehicle ownership categories in Leighton are males with 1 vehicle (44, accounting for 38.3%) and females with 1 vehicle (83, making up 24.4%).
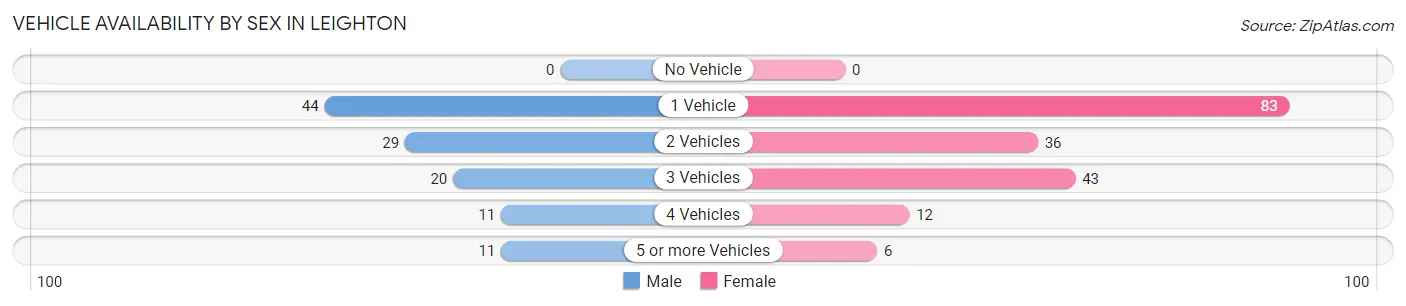
| Vehicles Available | Male | Female |
| No Vehicle | 0 (0.0%) | 0 (0.0%) |
| 1 Vehicle | 44 (38.3%) | 83 (46.1%) |
| 2 Vehicles | 29 (25.2%) | 36 (20.0%) |
| 3 Vehicles | 20 (17.4%) | 43 (23.9%) |
| 4 Vehicles | 11 (9.6%) | 12 (6.7%) |
| 5 or more Vehicles | 11 (9.6%) | 6 (3.3%) |
| Total | 115 (100.0%) | 180 (100.0%) |
Commute Time in Leighton
The most frequently occuring commute durations in Leighton are 20 to 24 minutes (87 commuters, 29.9%), 35 to 39 minutes (43 commuters, 14.8%), and 30 to 34 minutes (31 commuters, 10.6%).
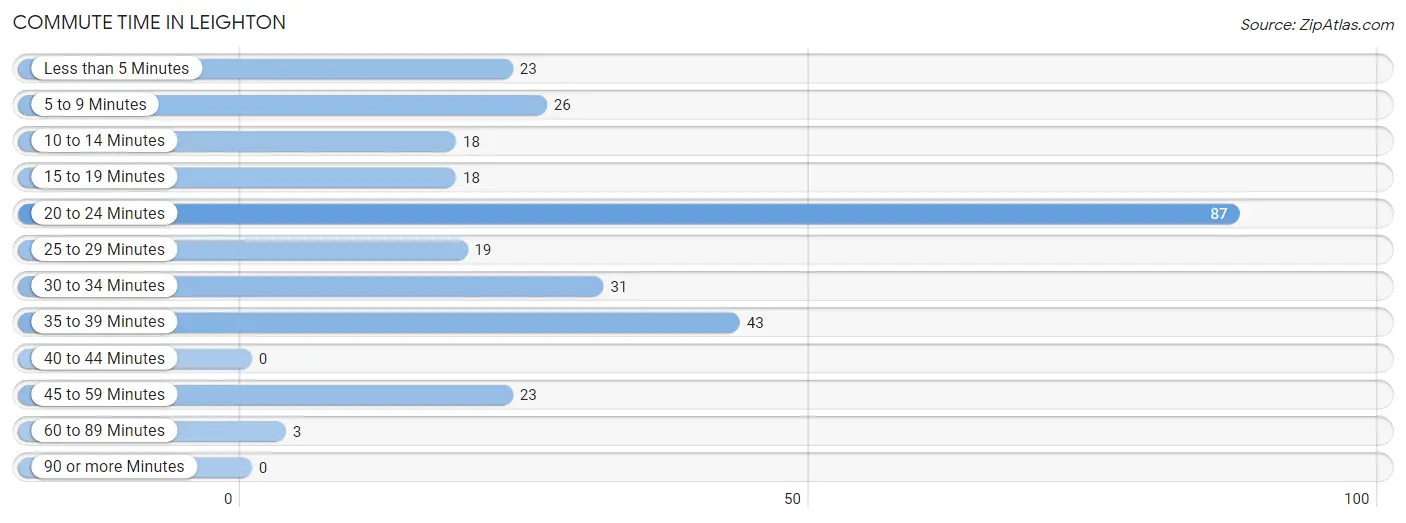
| Commute Time | # Commuters | % Commuters |
| Less than 5 Minutes | 23 | 7.9% |
| 5 to 9 Minutes | 26 | 8.9% |
| 10 to 14 Minutes | 18 | 6.2% |
| 15 to 19 Minutes | 18 | 6.2% |
| 20 to 24 Minutes | 87 | 29.9% |
| 25 to 29 Minutes | 19 | 6.5% |
| 30 to 34 Minutes | 31 | 10.6% |
| 35 to 39 Minutes | 43 | 14.8% |
| 40 to 44 Minutes | 0 | 0.0% |
| 45 to 59 Minutes | 23 | 7.9% |
| 60 to 89 Minutes | 3 | 1.0% |
| 90 or more Minutes | 0 | 0.0% |
Commute Time by Sex in Leighton
The most common commute times in Leighton are 20 to 24 minutes (40 commuters, 34.8%) for males and 20 to 24 minutes (47 commuters, 26.7%) for females.
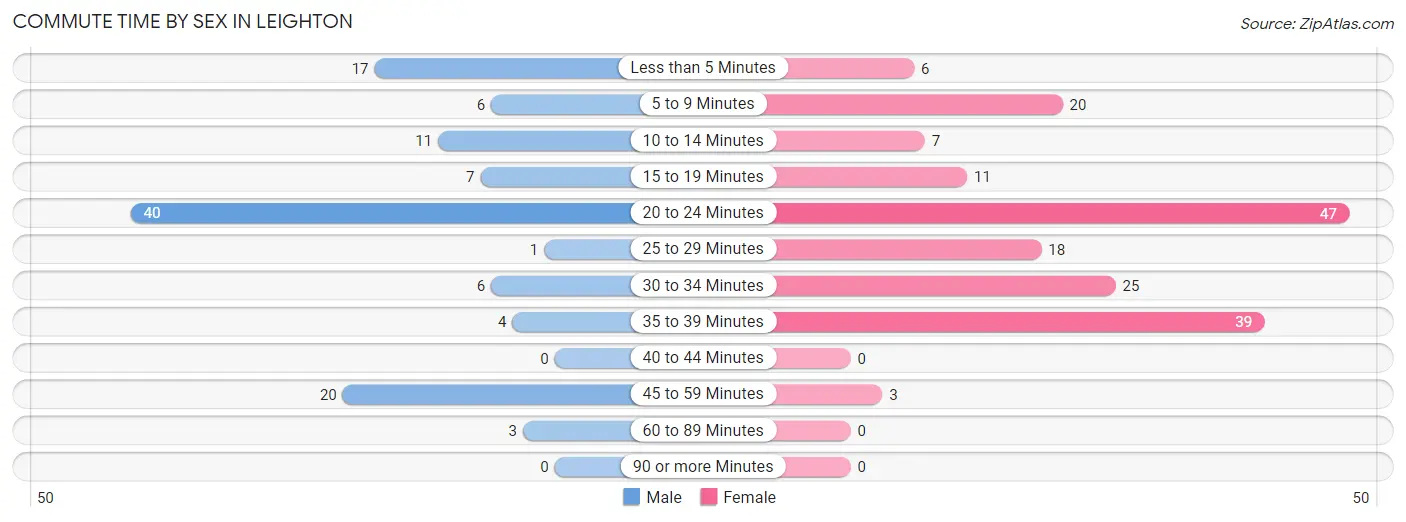
| Commute Time | Male | Female |
| Less than 5 Minutes | 17 (14.8%) | 6 (3.4%) |
| 5 to 9 Minutes | 6 (5.2%) | 20 (11.4%) |
| 10 to 14 Minutes | 11 (9.6%) | 7 (4.0%) |
| 15 to 19 Minutes | 7 (6.1%) | 11 (6.2%) |
| 20 to 24 Minutes | 40 (34.8%) | 47 (26.7%) |
| 25 to 29 Minutes | 1 (0.9%) | 18 (10.2%) |
| 30 to 34 Minutes | 6 (5.2%) | 25 (14.2%) |
| 35 to 39 Minutes | 4 (3.5%) | 39 (22.2%) |
| 40 to 44 Minutes | 0 (0.0%) | 0 (0.0%) |
| 45 to 59 Minutes | 20 (17.4%) | 3 (1.7%) |
| 60 to 89 Minutes | 3 (2.6%) | 0 (0.0%) |
| 90 or more Minutes | 0 (0.0%) | 0 (0.0%) |
Time of Departure to Work by Sex in Leighton
The most frequent times of departure to work in Leighton are 7:30 AM to 7:59 AM (35, 30.4%) for males and 7:30 AM to 7:59 AM (66, 37.5%) for females.
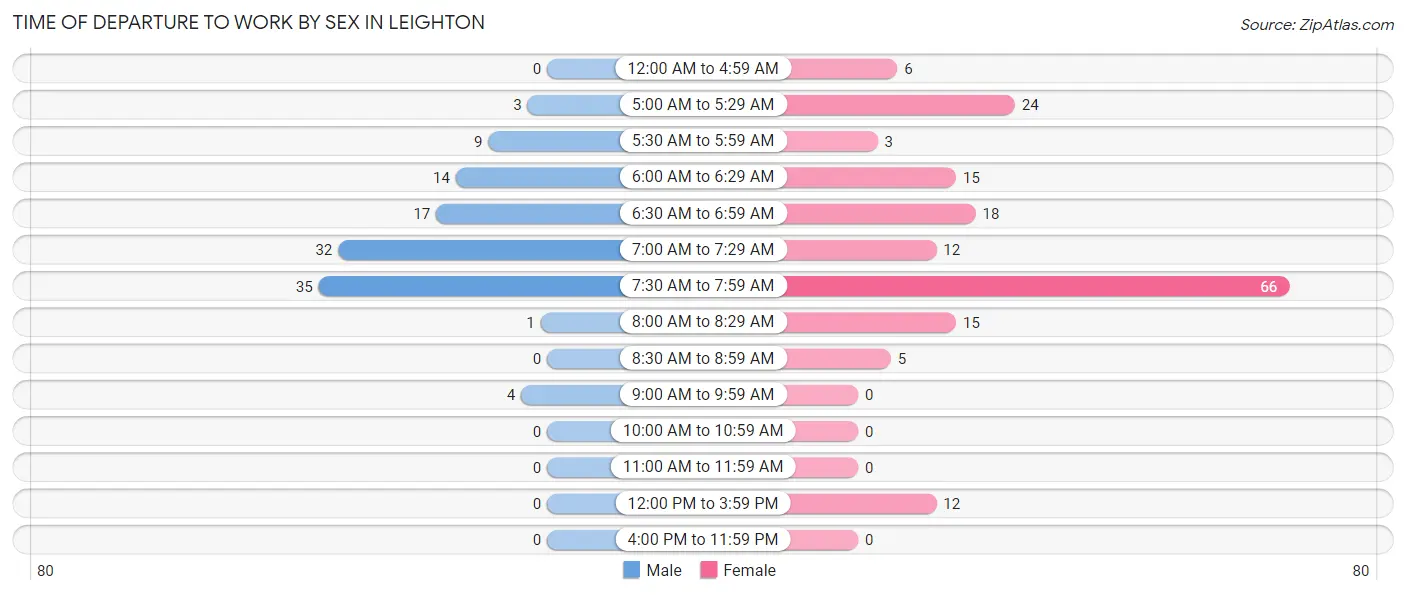
| Time of Departure | Male | Female |
| 12:00 AM to 4:59 AM | 0 (0.0%) | 6 (3.4%) |
| 5:00 AM to 5:29 AM | 3 (2.6%) | 24 (13.6%) |
| 5:30 AM to 5:59 AM | 9 (7.8%) | 3 (1.7%) |
| 6:00 AM to 6:29 AM | 14 (12.2%) | 15 (8.5%) |
| 6:30 AM to 6:59 AM | 17 (14.8%) | 18 (10.2%) |
| 7:00 AM to 7:29 AM | 32 (27.8%) | 12 (6.8%) |
| 7:30 AM to 7:59 AM | 35 (30.4%) | 66 (37.5%) |
| 8:00 AM to 8:29 AM | 1 (0.9%) | 15 (8.5%) |
| 8:30 AM to 8:59 AM | 0 (0.0%) | 5 (2.8%) |
| 9:00 AM to 9:59 AM | 4 (3.5%) | 0 (0.0%) |
| 10:00 AM to 10:59 AM | 0 (0.0%) | 0 (0.0%) |
| 11:00 AM to 11:59 AM | 0 (0.0%) | 0 (0.0%) |
| 12:00 PM to 3:59 PM | 0 (0.0%) | 12 (6.8%) |
| 4:00 PM to 11:59 PM | 0 (0.0%) | 0 (0.0%) |
| Total | 115 (100.0%) | 176 (100.0%) |
Housing Occupancy in Leighton
Occupancy by Ownership in Leighton
Of the total 333 dwellings in Leighton, owner-occupied units account for 207 (62.2%), while renter-occupied units make up 126 (37.8%).
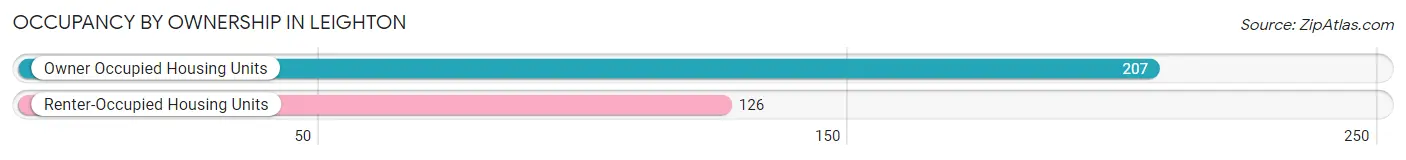
| Occupancy | # Housing Units | % Housing Units |
| Owner Occupied Housing Units | 207 | 62.2% |
| Renter-Occupied Housing Units | 126 | 37.8% |
| Total Occupied Housing Units | 333 | 100.0% |
Occupancy by Household Size in Leighton
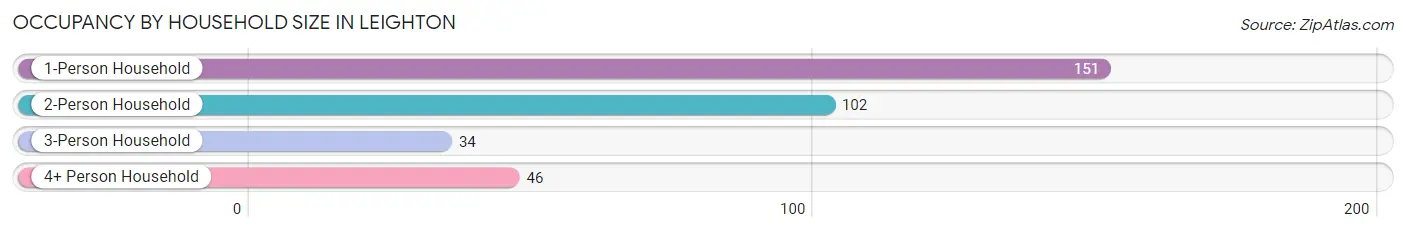
| Household Size | # Housing Units | % Housing Units |
| 1-Person Household | 151 | 45.4% |
| 2-Person Household | 102 | 30.6% |
| 3-Person Household | 34 | 10.2% |
| 4+ Person Household | 46 | 13.8% |
| Total Housing Units | 333 | 100.0% |
Occupancy by Ownership by Household Size in Leighton
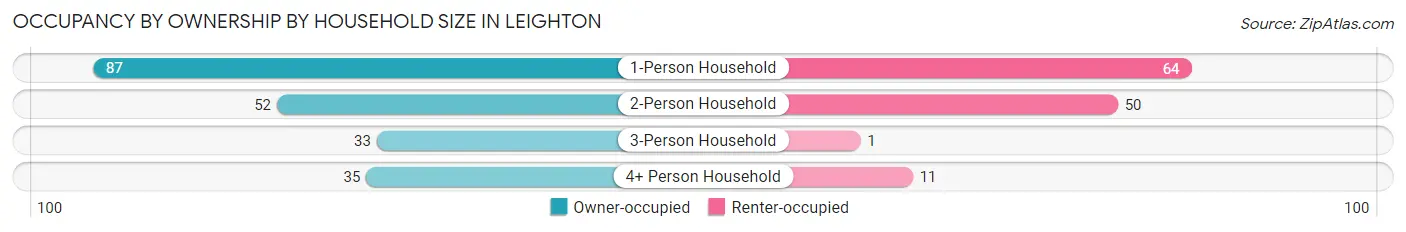
| Household Size | Owner-occupied | Renter-occupied |
| 1-Person Household | 87 (57.6%) | 64 (42.4%) |
| 2-Person Household | 52 (51.0%) | 50 (49.0%) |
| 3-Person Household | 33 (97.1%) | 1 (2.9%) |
| 4+ Person Household | 35 (76.1%) | 11 (23.9%) |
| Total Housing Units | 207 (62.2%) | 126 (37.8%) |
Occupancy by Educational Attainment in Leighton
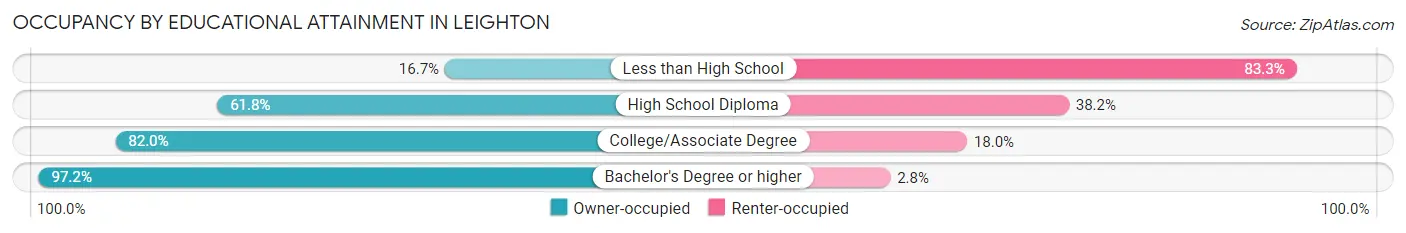
| Household Size | Owner-occupied | Renter-occupied |
| Less than High School | 8 (16.7%) | 40 (83.3%) |
| High School Diploma | 123 (61.8%) | 76 (38.2%) |
| College/Associate Degree | 41 (82.0%) | 9 (18.0%) |
| Bachelor's Degree or higher | 35 (97.2%) | 1 (2.8%) |
Occupancy by Age of Householder in Leighton
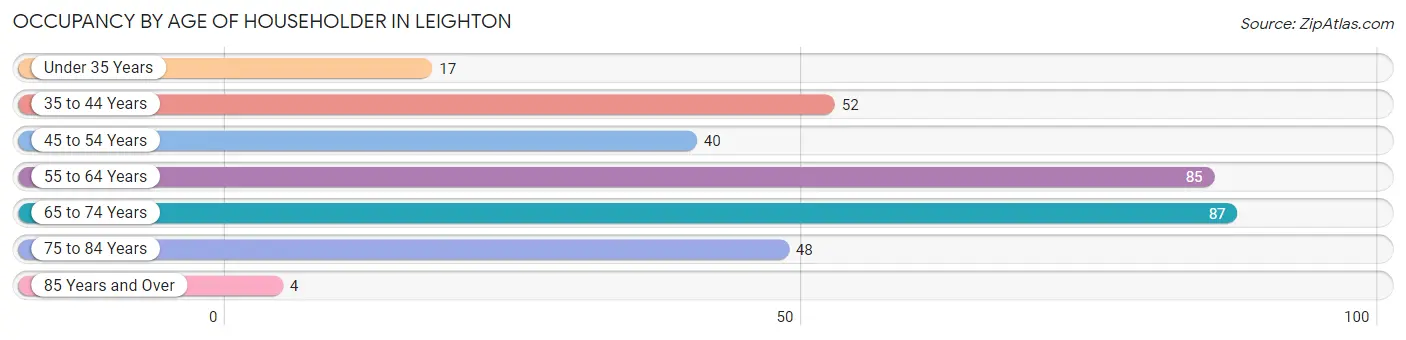
| Age Bracket | # Households | % Households |
| Under 35 Years | 17 | 5.1% |
| 35 to 44 Years | 52 | 15.6% |
| 45 to 54 Years | 40 | 12.0% |
| 55 to 64 Years | 85 | 25.5% |
| 65 to 74 Years | 87 | 26.1% |
| 75 to 84 Years | 48 | 14.4% |
| 85 Years and Over | 4 | 1.2% |
| Total | 333 | 100.0% |
Housing Finances in Leighton
Median Income by Occupancy in Leighton
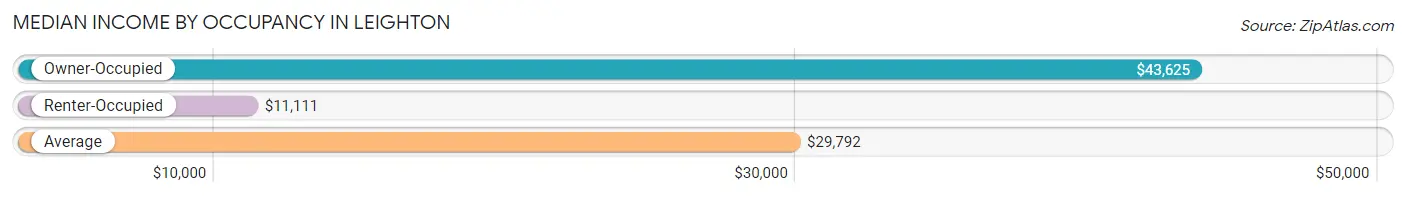
| Occupancy Type | # Households | Median Income |
| Owner-Occupied | 207 (62.2%) | $43,625 |
| Renter-Occupied | 126 (37.8%) | $11,111 |
| Average | 333 (100.0%) | $29,792 |
Occupancy by Householder Income Bracket in Leighton
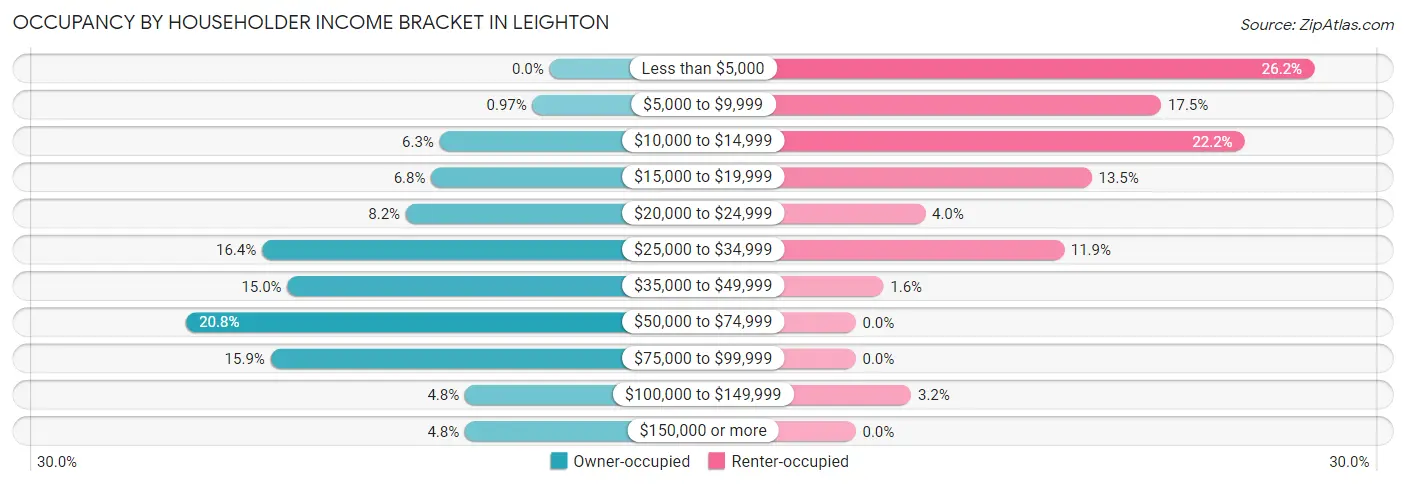
| Income Bracket | Owner-occupied | Renter-occupied |
| Less than $5,000 | 0 (0.0%) | 33 (26.2%) |
| $5,000 to $9,999 | 2 (1.0%) | 22 (17.5%) |
| $10,000 to $14,999 | 13 (6.3%) | 28 (22.2%) |
| $15,000 to $19,999 | 14 (6.8%) | 17 (13.5%) |
| $20,000 to $24,999 | 17 (8.2%) | 5 (4.0%) |
| $25,000 to $34,999 | 34 (16.4%) | 15 (11.9%) |
| $35,000 to $49,999 | 31 (15.0%) | 2 (1.6%) |
| $50,000 to $74,999 | 43 (20.8%) | 0 (0.0%) |
| $75,000 to $99,999 | 33 (15.9%) | 0 (0.0%) |
| $100,000 to $149,999 | 10 (4.8%) | 4 (3.2%) |
| $150,000 or more | 10 (4.8%) | 0 (0.0%) |
| Total | 207 (100.0%) | 126 (100.0%) |
Monthly Housing Cost Tiers in Leighton
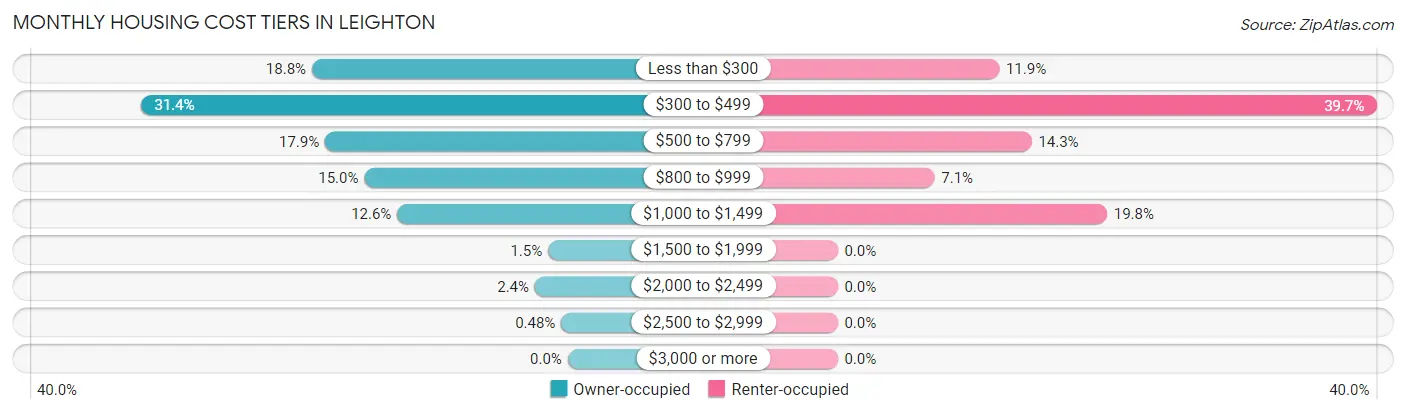
| Monthly Cost | Owner-occupied | Renter-occupied |
| Less than $300 | 39 (18.8%) | 15 (11.9%) |
| $300 to $499 | 65 (31.4%) | 50 (39.7%) |
| $500 to $799 | 37 (17.9%) | 18 (14.3%) |
| $800 to $999 | 31 (15.0%) | 9 (7.1%) |
| $1,000 to $1,499 | 26 (12.6%) | 25 (19.8%) |
| $1,500 to $1,999 | 3 (1.5%) | 0 (0.0%) |
| $2,000 to $2,499 | 5 (2.4%) | 0 (0.0%) |
| $2,500 to $2,999 | 1 (0.5%) | 0 (0.0%) |
| $3,000 or more | 0 (0.0%) | 0 (0.0%) |
| Total | 207 (100.0%) | 126 (100.0%) |
Physical Housing Characteristics in Leighton
Housing Structures in Leighton
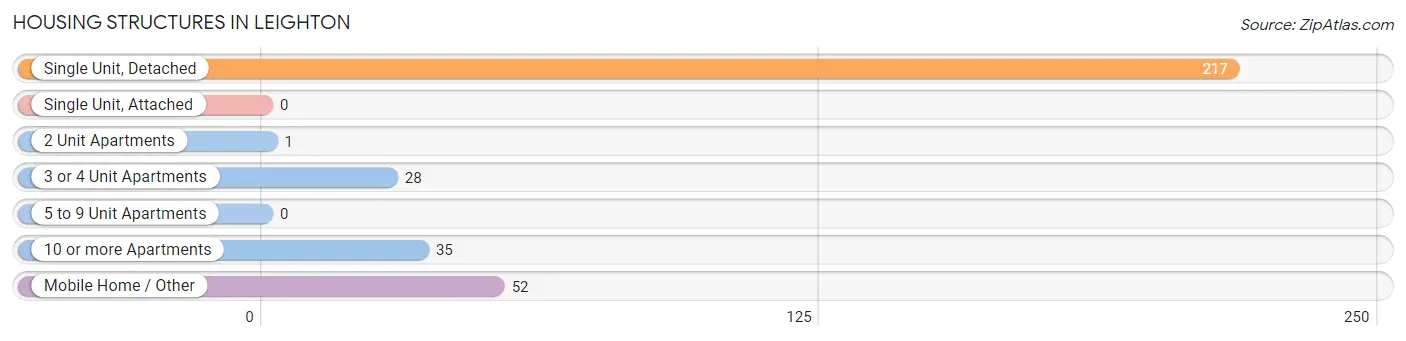
| Structure Type | # Housing Units | % Housing Units |
| Single Unit, Detached | 217 | 65.2% |
| Single Unit, Attached | 0 | 0.0% |
| 2 Unit Apartments | 1 | 0.3% |
| 3 or 4 Unit Apartments | 28 | 8.4% |
| 5 to 9 Unit Apartments | 0 | 0.0% |
| 10 or more Apartments | 35 | 10.5% |
| Mobile Home / Other | 52 | 15.6% |
| Total | 333 | 100.0% |
Housing Structures by Occupancy in Leighton
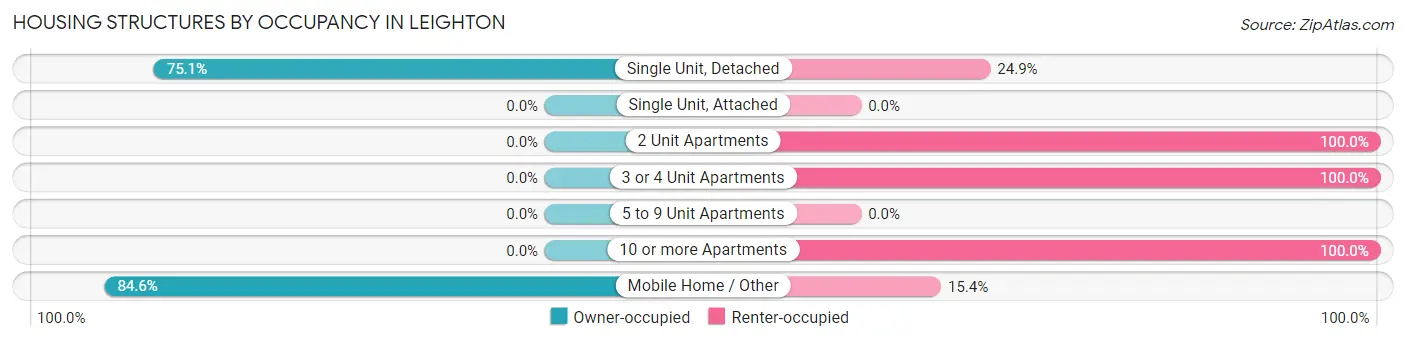
| Structure Type | Owner-occupied | Renter-occupied |
| Single Unit, Detached | 163 (75.1%) | 54 (24.9%) |
| Single Unit, Attached | 0 (0.0%) | 0 (0.0%) |
| 2 Unit Apartments | 0 (0.0%) | 1 (100.0%) |
| 3 or 4 Unit Apartments | 0 (0.0%) | 28 (100.0%) |
| 5 to 9 Unit Apartments | 0 (0.0%) | 0 (0.0%) |
| 10 or more Apartments | 0 (0.0%) | 35 (100.0%) |
| Mobile Home / Other | 44 (84.6%) | 8 (15.4%) |
| Total | 207 (62.2%) | 126 (37.8%) |
Housing Structures by Number of Rooms in Leighton
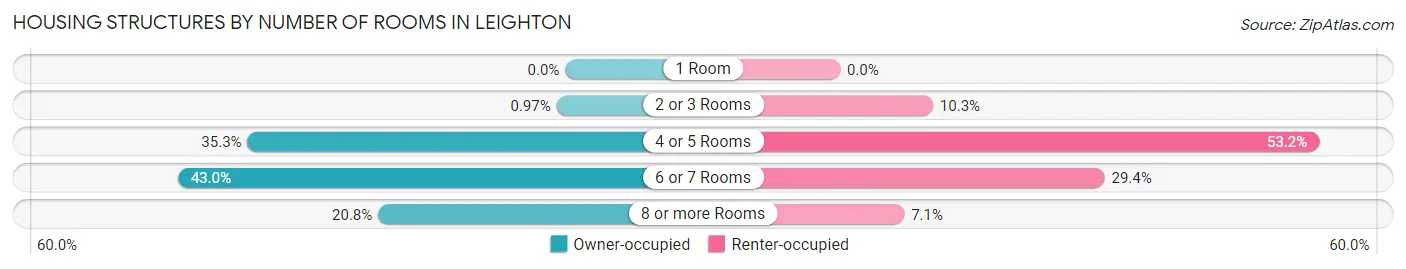
| Number of Rooms | Owner-occupied | Renter-occupied |
| 1 Room | 0 (0.0%) | 0 (0.0%) |
| 2 or 3 Rooms | 2 (1.0%) | 13 (10.3%) |
| 4 or 5 Rooms | 73 (35.3%) | 67 (53.2%) |
| 6 or 7 Rooms | 89 (43.0%) | 37 (29.4%) |
| 8 or more Rooms | 43 (20.8%) | 9 (7.1%) |
| Total | 207 (100.0%) | 126 (100.0%) |
Housing Structure by Heating Type in Leighton
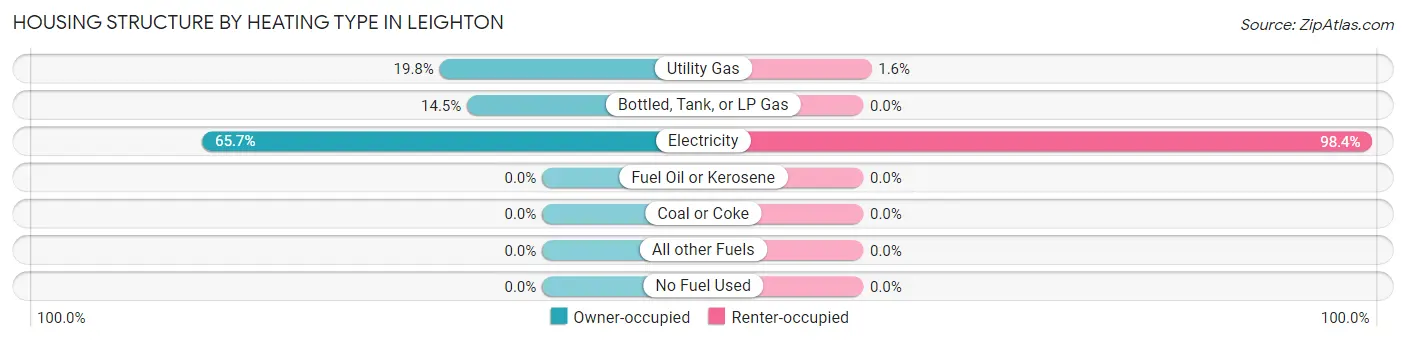
| Heating Type | Owner-occupied | Renter-occupied |
| Utility Gas | 41 (19.8%) | 2 (1.6%) |
| Bottled, Tank, or LP Gas | 30 (14.5%) | 0 (0.0%) |
| Electricity | 136 (65.7%) | 124 (98.4%) |
| Fuel Oil or Kerosene | 0 (0.0%) | 0 (0.0%) |
| Coal or Coke | 0 (0.0%) | 0 (0.0%) |
| All other Fuels | 0 (0.0%) | 0 (0.0%) |
| No Fuel Used | 0 (0.0%) | 0 (0.0%) |
| Total | 207 (100.0%) | 126 (100.0%) |
Household Vehicle Usage in Leighton
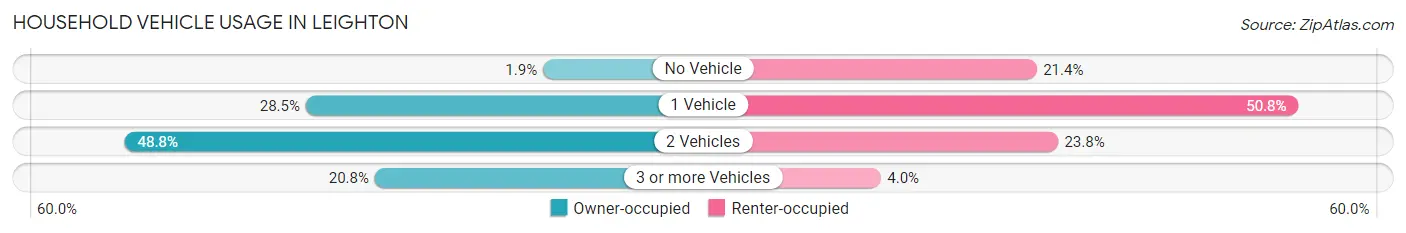
| Vehicles per Household | Owner-occupied | Renter-occupied |
| No Vehicle | 4 (1.9%) | 27 (21.4%) |
| 1 Vehicle | 59 (28.5%) | 64 (50.8%) |
| 2 Vehicles | 101 (48.8%) | 30 (23.8%) |
| 3 or more Vehicles | 43 (20.8%) | 5 (4.0%) |
| Total | 207 (100.0%) | 126 (100.0%) |
Real Estate & Mortgages in Leighton
Real Estate and Mortgage Overview in Leighton
| Characteristic | Without Mortgage | With Mortgage |
| Housing Units | 138 | 69 |
| Median Property Value | $58,300 | $176,800 |
| Median Household Income | $38,250 | $8 |
| Monthly Housing Costs | $392 | $0 |
| Real Estate Taxes | $238 | $12 |
Property Value by Mortgage Status in Leighton
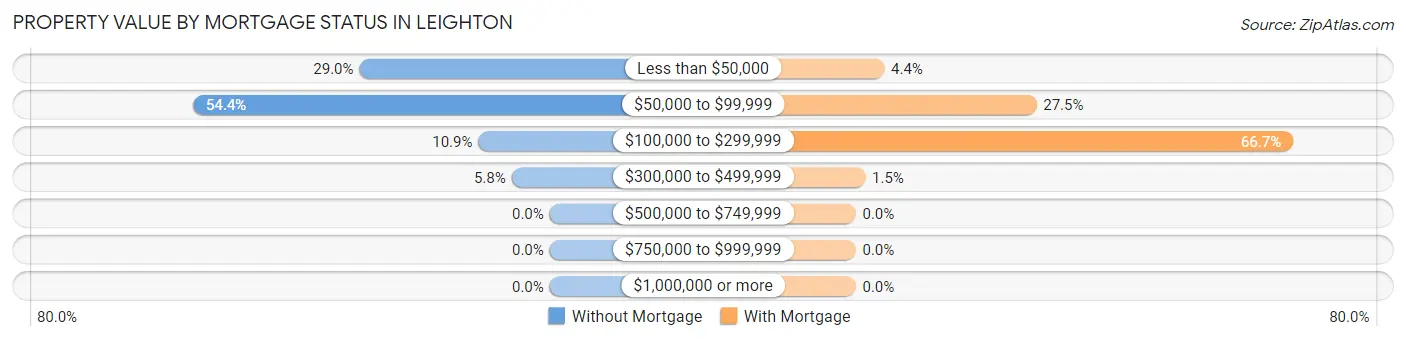
| Property Value | Without Mortgage | With Mortgage |
| Less than $50,000 | 40 (29.0%) | 3 (4.3%) |
| $50,000 to $99,999 | 75 (54.3%) | 19 (27.5%) |
| $100,000 to $299,999 | 15 (10.9%) | 46 (66.7%) |
| $300,000 to $499,999 | 8 (5.8%) | 1 (1.5%) |
| $500,000 to $749,999 | 0 (0.0%) | 0 (0.0%) |
| $750,000 to $999,999 | 0 (0.0%) | 0 (0.0%) |
| $1,000,000 or more | 0 (0.0%) | 0 (0.0%) |
| Total | 138 (100.0%) | 69 (100.0%) |
Household Income by Mortgage Status in Leighton
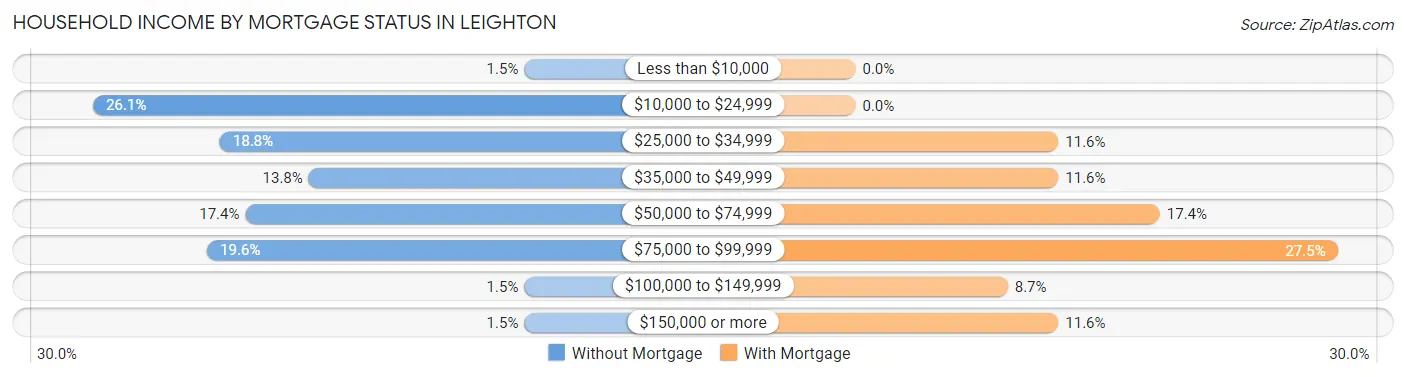
| Household Income | Without Mortgage | With Mortgage |
| Less than $10,000 | 2 (1.5%) | 0 (0.0%) |
| $10,000 to $24,999 | 36 (26.1%) | 0 (0.0%) |
| $25,000 to $34,999 | 26 (18.8%) | 8 (11.6%) |
| $35,000 to $49,999 | 19 (13.8%) | 8 (11.6%) |
| $50,000 to $74,999 | 24 (17.4%) | 12 (17.4%) |
| $75,000 to $99,999 | 27 (19.6%) | 19 (27.5%) |
| $100,000 to $149,999 | 2 (1.5%) | 6 (8.7%) |
| $150,000 or more | 2 (1.5%) | 8 (11.6%) |
| Total | 138 (100.0%) | 69 (100.0%) |
Property Value to Household Income Ratio in Leighton
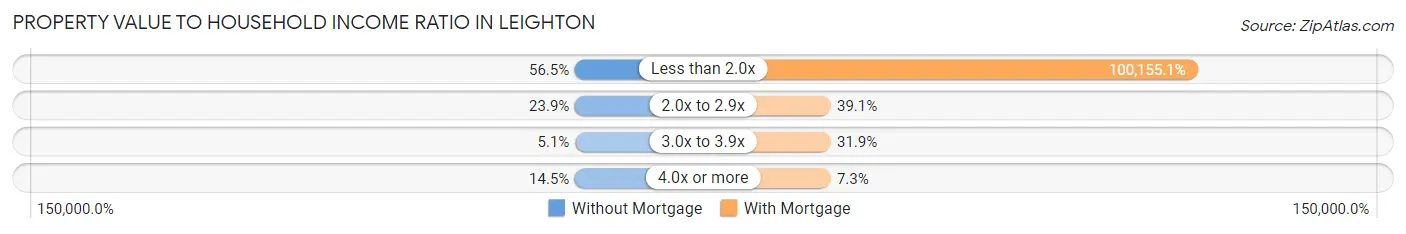
| Value-to-Income Ratio | Without Mortgage | With Mortgage |
| Less than 2.0x | 78 (56.5%) | 69,107 (100,155.1%) |
| 2.0x to 2.9x | 33 (23.9%) | 27 (39.1%) |
| 3.0x to 3.9x | 7 (5.1%) | 22 (31.9%) |
| 4.0x or more | 20 (14.5%) | 5 (7.2%) |
| Total | 138 (100.0%) | 69 (100.0%) |
Real Estate Taxes by Mortgage Status in Leighton
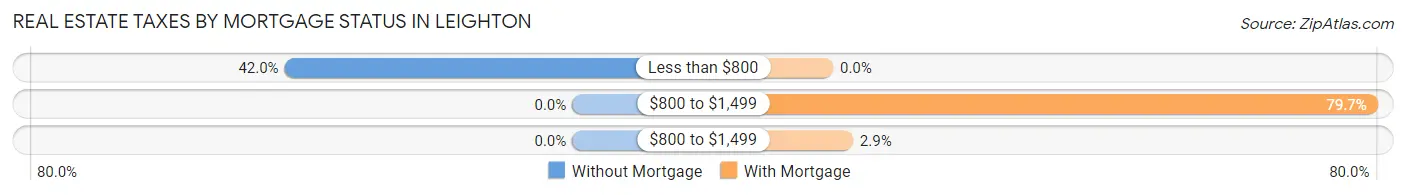
| Property Taxes | Without Mortgage | With Mortgage |
| Less than $800 | 58 (42.0%) | 0 (0.0%) |
| $800 to $1,499 | 0 (0.0%) | 55 (79.7%) |
| $800 to $1,499 | 0 (0.0%) | 2 (2.9%) |
| Total | 138 (100.0%) | 69 (100.0%) |
Health & Disability in Leighton
Health Insurance Coverage by Age in Leighton
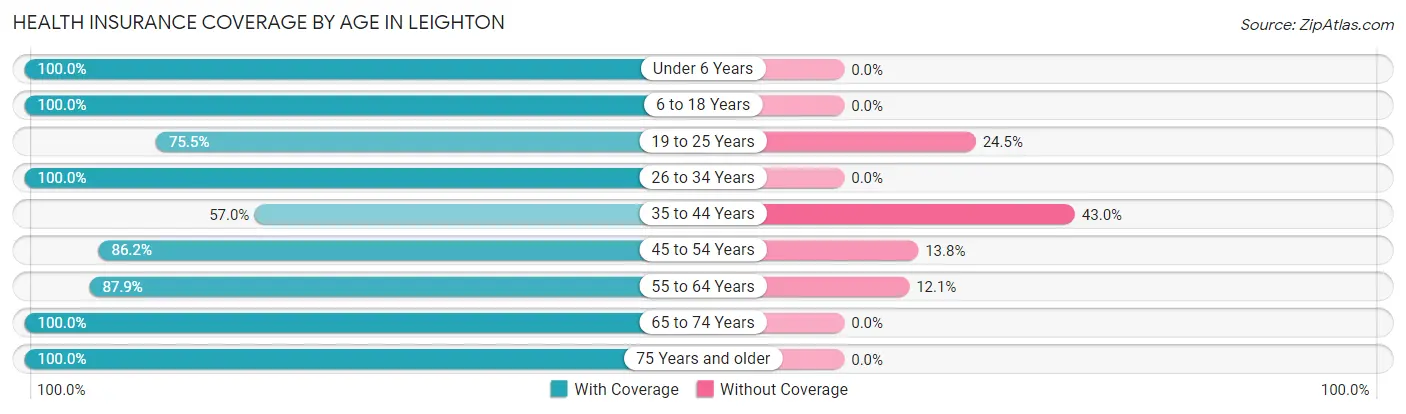
| Age Bracket | With Coverage | Without Coverage |
| Under 6 Years | 26 (100.0%) | 0 (0.0%) |
| 6 to 18 Years | 91 (100.0%) | 0 (0.0%) |
| 19 to 25 Years | 77 (75.5%) | 25 (24.5%) |
| 26 to 34 Years | 40 (100.0%) | 0 (0.0%) |
| 35 to 44 Years | 57 (57.0%) | 43 (43.0%) |
| 45 to 54 Years | 75 (86.2%) | 12 (13.8%) |
| 55 to 64 Years | 109 (87.9%) | 15 (12.1%) |
| 65 to 74 Years | 101 (100.0%) | 0 (0.0%) |
| 75 Years and older | 63 (100.0%) | 0 (0.0%) |
| Total | 639 (87.1%) | 95 (12.9%) |
Health Insurance Coverage by Citizenship Status in Leighton
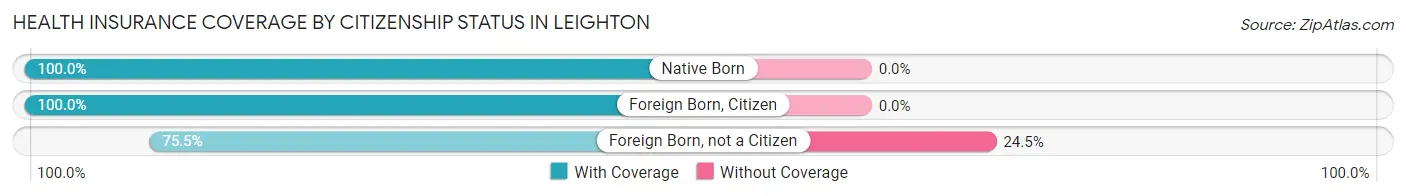
| Citizenship Status | With Coverage | Without Coverage |
| Native Born | 26 (100.0%) | 0 (0.0%) |
| Foreign Born, Citizen | 91 (100.0%) | 0 (0.0%) |
| Foreign Born, not a Citizen | 77 (75.5%) | 25 (24.5%) |
Health Insurance Coverage by Household Income in Leighton
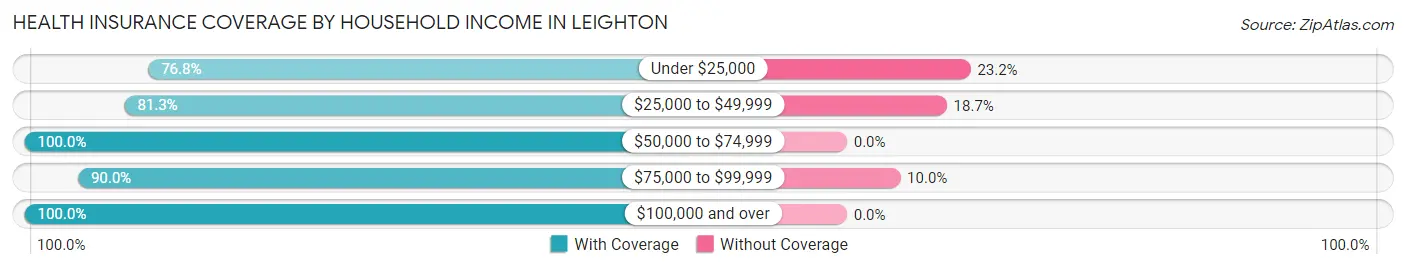
| Household Income | With Coverage | Without Coverage |
| Under $25,000 | 189 (76.8%) | 57 (23.2%) |
| $25,000 to $49,999 | 113 (81.3%) | 26 (18.7%) |
| $50,000 to $74,999 | 151 (100.0%) | 0 (0.0%) |
| $75,000 to $99,999 | 108 (90.0%) | 12 (10.0%) |
| $100,000 and over | 78 (100.0%) | 0 (0.0%) |
Public vs Private Health Insurance Coverage by Age in Leighton
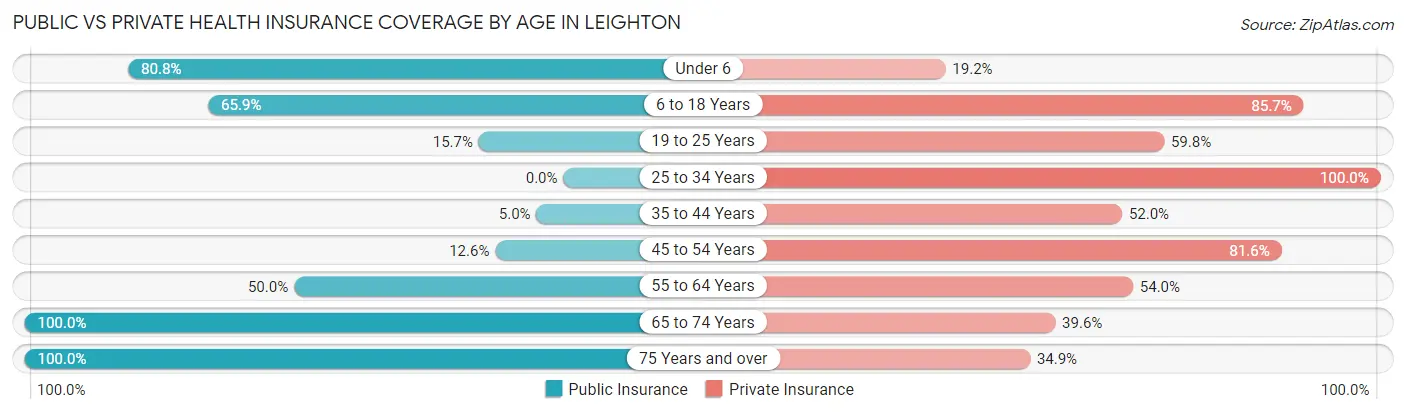
| Age Bracket | Public Insurance | Private Insurance |
| Under 6 | 21 (80.8%) | 5 (19.2%) |
| 6 to 18 Years | 60 (65.9%) | 78 (85.7%) |
| 19 to 25 Years | 16 (15.7%) | 61 (59.8%) |
| 25 to 34 Years | 0 (0.0%) | 40 (100.0%) |
| 35 to 44 Years | 5 (5.0%) | 52 (52.0%) |
| 45 to 54 Years | 11 (12.6%) | 71 (81.6%) |
| 55 to 64 Years | 62 (50.0%) | 67 (54.0%) |
| 65 to 74 Years | 101 (100.0%) | 40 (39.6%) |
| 75 Years and over | 63 (100.0%) | 22 (34.9%) |
| Total | 339 (46.2%) | 436 (59.4%) |
Disability Status by Sex by Age in Leighton
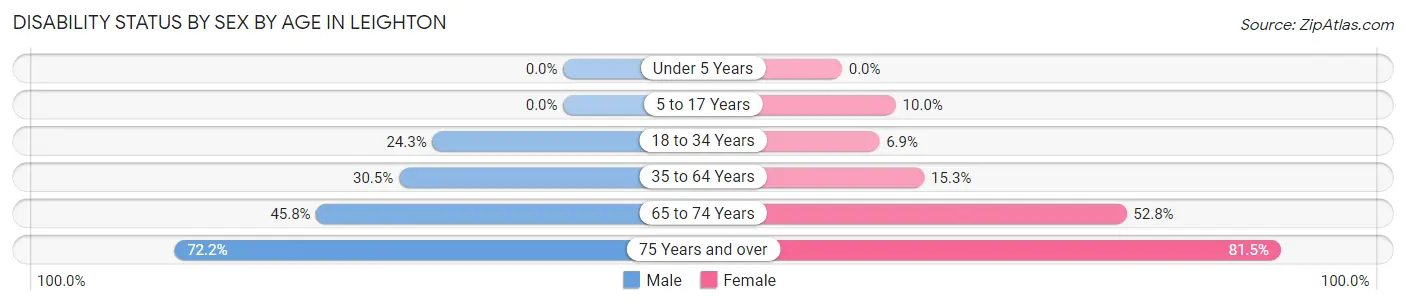
| Age Bracket | Male | Female |
| Under 5 Years | 0 (0.0%) | 0 (0.0%) |
| 5 to 17 Years | 0 (0.0%) | 6 (10.0%) |
| 18 to 34 Years | 17 (24.3%) | 5 (6.9%) |
| 35 to 64 Years | 43 (30.5%) | 26 (15.3%) |
| 65 to 74 Years | 22 (45.8%) | 28 (52.8%) |
| 75 Years and over | 26 (72.2%) | 22 (81.5%) |
Disability Class by Sex by Age in Leighton
Disability Class: Hearing Difficulty
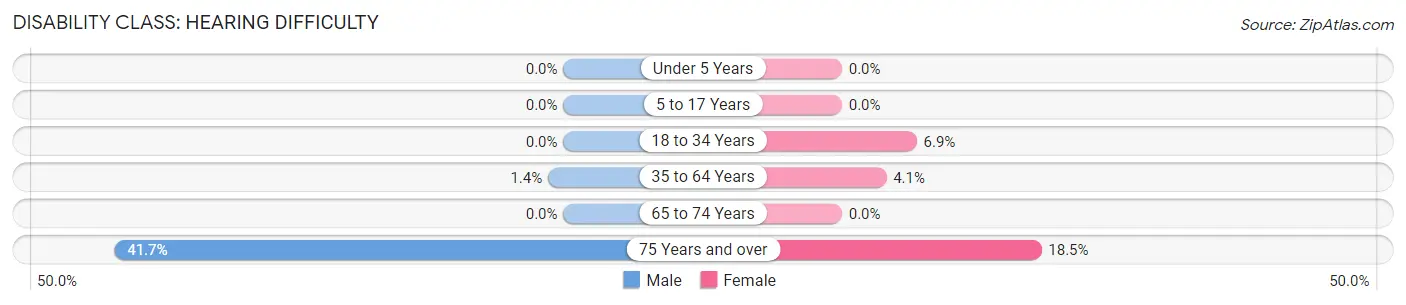
| Age Bracket | Male | Female |
| Under 5 Years | 0 (0.0%) | 0 (0.0%) |
| 5 to 17 Years | 0 (0.0%) | 0 (0.0%) |
| 18 to 34 Years | 0 (0.0%) | 5 (6.9%) |
| 35 to 64 Years | 2 (1.4%) | 7 (4.1%) |
| 65 to 74 Years | 0 (0.0%) | 0 (0.0%) |
| 75 Years and over | 15 (41.7%) | 5 (18.5%) |
Disability Class: Vision Difficulty
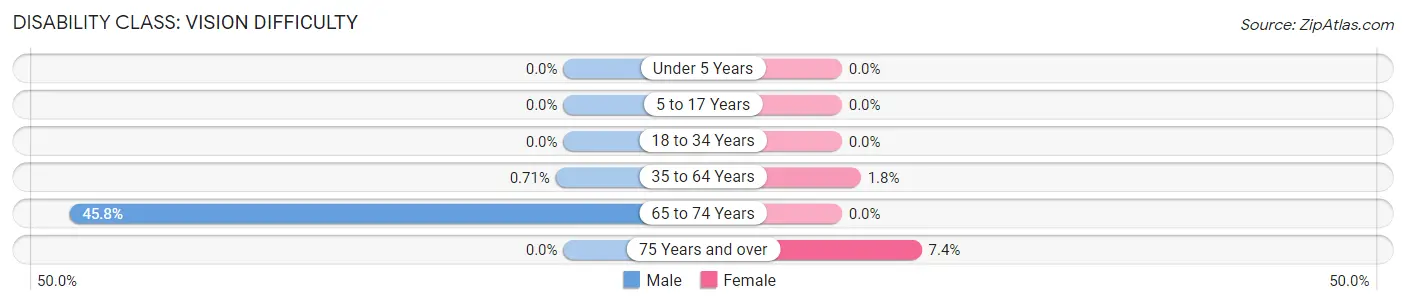
| Age Bracket | Male | Female |
| Under 5 Years | 0 (0.0%) | 0 (0.0%) |
| 5 to 17 Years | 0 (0.0%) | 0 (0.0%) |
| 18 to 34 Years | 0 (0.0%) | 0 (0.0%) |
| 35 to 64 Years | 1 (0.7%) | 3 (1.8%) |
| 65 to 74 Years | 22 (45.8%) | 0 (0.0%) |
| 75 Years and over | 0 (0.0%) | 2 (7.4%) |
Disability Class: Cognitive Difficulty
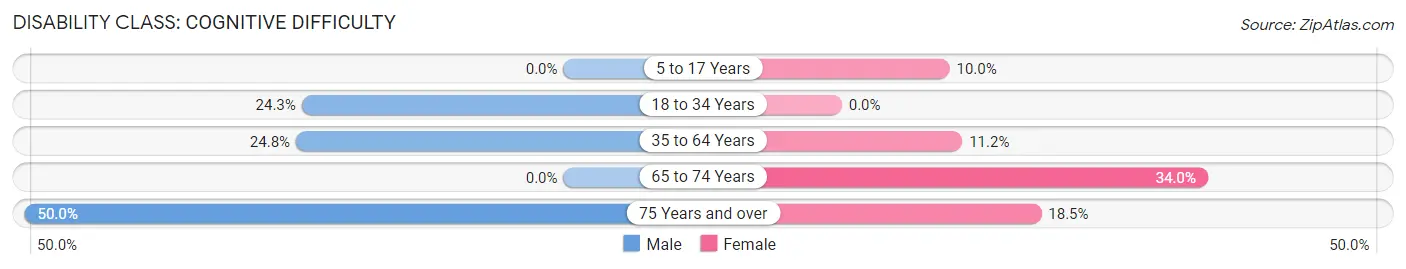
| Age Bracket | Male | Female |
| 5 to 17 Years | 0 (0.0%) | 6 (10.0%) |
| 18 to 34 Years | 17 (24.3%) | 0 (0.0%) |
| 35 to 64 Years | 35 (24.8%) | 19 (11.2%) |
| 65 to 74 Years | 0 (0.0%) | 18 (34.0%) |
| 75 Years and over | 18 (50.0%) | 5 (18.5%) |
Disability Class: Ambulatory Difficulty
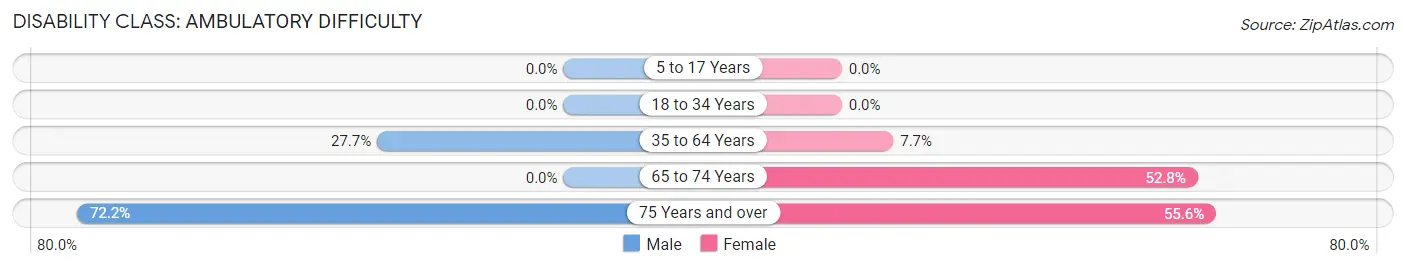
| Age Bracket | Male | Female |
| 5 to 17 Years | 0 (0.0%) | 0 (0.0%) |
| 18 to 34 Years | 0 (0.0%) | 0 (0.0%) |
| 35 to 64 Years | 39 (27.7%) | 13 (7.6%) |
| 65 to 74 Years | 0 (0.0%) | 28 (52.8%) |
| 75 Years and over | 26 (72.2%) | 15 (55.6%) |
Disability Class: Self-Care Difficulty
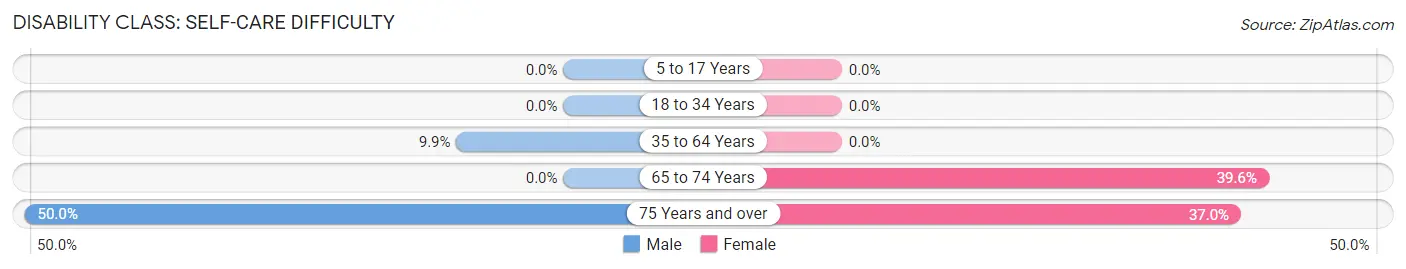
| Age Bracket | Male | Female |
| 5 to 17 Years | 0 (0.0%) | 0 (0.0%) |
| 18 to 34 Years | 0 (0.0%) | 0 (0.0%) |
| 35 to 64 Years | 14 (9.9%) | 0 (0.0%) |
| 65 to 74 Years | 0 (0.0%) | 21 (39.6%) |
| 75 Years and over | 18 (50.0%) | 10 (37.0%) |
Technology Access in Leighton
Computing Device Access in Leighton
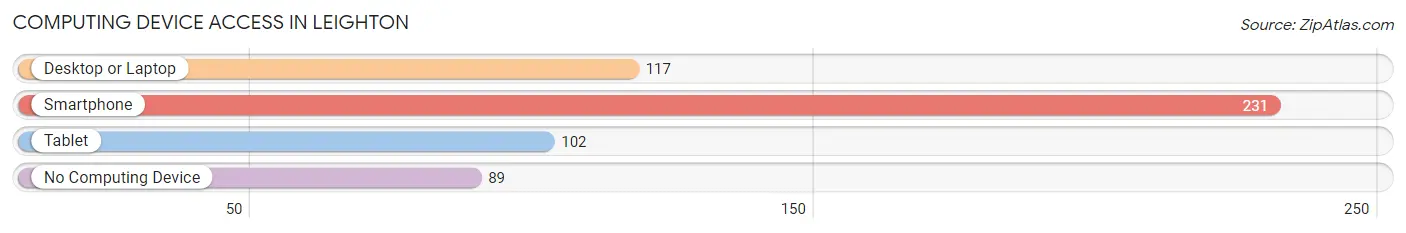
| Device Type | # Households | % Households |
| Desktop or Laptop | 117 | 35.1% |
| Smartphone | 231 | 69.4% |
| Tablet | 102 | 30.6% |
| No Computing Device | 89 | 26.7% |
| Total | 333 | 100.0% |
Internet Access in Leighton
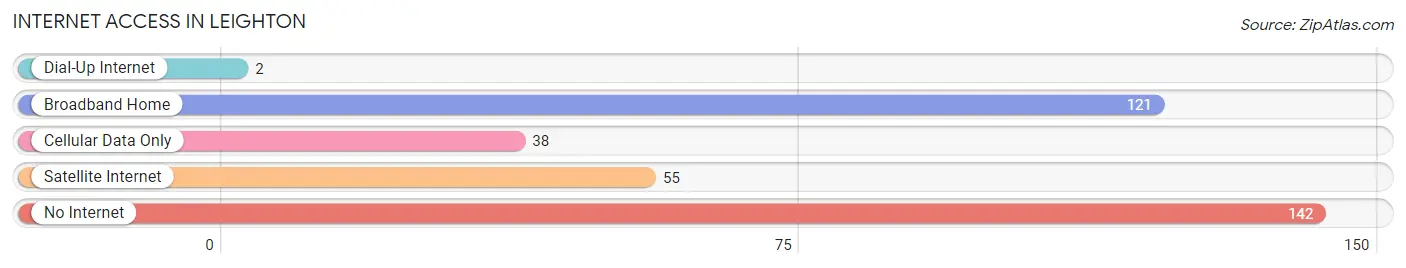
| Internet Type | # Households | % Households |
| Dial-Up Internet | 2 | 0.6% |
| Broadband Home | 121 | 36.3% |
| Cellular Data Only | 38 | 11.4% |
| Satellite Internet | 55 | 16.5% |
| No Internet | 142 | 42.6% |
| Total | 333 | 100.0% |
Leighton Summary
Leighton is a small town located in Colbert County, Alabama. It is situated in the northwest corner of the state, just south of the Tennessee border. The town was founded in 1883 and has a population of approximately 1,500 people.
Geography
Leighton is located in the foothills of the Appalachian Mountains, and is surrounded by rolling hills and lush forests. The town is situated on the banks of the Tennessee River, which provides a scenic backdrop for the town. The climate in Leighton is mild, with temperatures ranging from the mid-50s in the winter to the mid-80s in the summer.
Economy
Leighton’s economy is largely based on agriculture and manufacturing. The town is home to several small businesses, including a feed store, a hardware store, and a few restaurants. The town also has a few larger employers, such as a paper mill and a furniture factory.
Demographics
Leighton is a predominantly white town, with a population that is approximately 95% Caucasian. The town also has a small African American population, which makes up about 4% of the population. The median household income in Leighton is $35,000, and the median age is 38.
History
Leighton was founded in 1883 by a group of settlers from Tennessee. The town was named after a local landowner, and the first post office was established in 1884. The town grew slowly over the years, and by the early 1900s, it had become a thriving agricultural community.
In the 1920s, the town began to experience a period of growth and prosperity. The Great Depression hit the town hard, but it was able to recover and continue to grow. In the 1950s, the town began to experience a decline in population, as many of its residents moved away in search of better economic opportunities.
Today, Leighton is a small, rural town that is home to a tight-knit community. The town is known for its friendly atmosphere and its strong sense of community. The town is also home to a number of historic sites, including the Leighton Historic District, which is listed on the National Register of Historic Places.
Leighton is a small town with a big heart. It is a place where people come together to celebrate their heritage and to enjoy the beauty of the surrounding area. The town is a great place to live, work, and raise a family.
Common Questions
What is Per Capita Income in Leighton?
Per Capita income in Leighton is $20,644.
What is the Median Family Income in Leighton?
Median Family Income in Leighton is $42,614.
What is the Median Household income in Leighton?
Median Household Income in Leighton is $29,792.
What is Income or Wage Gap in Leighton?
Income or Wage Gap in Leighton is 37.6%.
Women in Leighton earn 62.4 cents for every dollar earned by a man.
What is Inequality or Gini Index in Leighton?
Inequality or Gini Index in Leighton is 0.50.
What is the Total Population of Leighton?
Total Population of Leighton is 734.
What is the Total Male Population of Leighton?
Total Male Population of Leighton is 344.
What is the Total Female Population of Leighton?
Total Female Population of Leighton is 390.
What is the Ratio of Males per 100 Females in Leighton?
There are 88.21 Males per 100 Females in Leighton.
What is the Ratio of Females per 100 Males in Leighton?
There are 113.37 Females per 100 Males in Leighton.
What is the Median Population Age in Leighton?
Median Population Age in Leighton is 45.3 Years.
What is the Average Family Size in Leighton
Average Family Size in Leighton is 3.2 People.
What is the Average Household Size in Leighton
Average Household Size in Leighton is 2.2 People.
How Large is the Labor Force in Leighton?
There are 305 People in the Labor Forcein in Leighton.
What is the Percentage of People in the Labor Force in Leighton?
44.7% of People are in the Labor Force in Leighton.
What is the Unemployment Rate in Leighton?
Unemployment Rate in Leighton is 3.3%.