Jacksons Gap, AL Map & Demographics
Jacksons Gap Map
Jacksons Gap Overview
$21,671
PER CAPITA INCOME
$66,875
AVG FAMILY INCOME
$30,417
AVG HOUSEHOLD INCOME
18.4%
WAGE / INCOME GAP [ % ]
81.6¢/ $1
WAGE / INCOME GAP [ $ ]
0.45
INEQUALITY / GINI INDEX
537
TOTAL POPULATION
256
MALE POPULATION
281
FEMALE POPULATION
91.10
MALES / 100 FEMALES
109.77
FEMALES / 100 MALES
43.3
MEDIAN AGE
4.0
AVG FAMILY SIZE
2.5
AVG HOUSEHOLD SIZE
229
LABOR FORCE [ PEOPLE ]
48.7%
PERCENT IN LABOR FORCE
17.9%
UNEMPLOYMENT RATE
Jacksons Gap Zip Codes
Income in Jacksons Gap
Income Overview in Jacksons Gap
Per Capita Income in Jacksons Gap is $21,671, while median incomes of families and households are $66,875 and $30,417 respectively.
| Characteristic | Number | Measure |
| Per Capita Income | 537 | $21,671 |
| Median Family Income | 107 | $66,875 |
| Mean Family Income | 107 | $70,108 |
| Median Household Income | 213 | $30,417 |
| Mean Household Income | 213 | $49,086 |
| Income Deficit | 107 | $0 |
| Wage / Income Gap (%) | 537 | 18.35% |
| Wage / Income Gap ($) | 537 | 81.65¢ per $1 |
| Gini / Inequality Index | 537 | 0.45 |
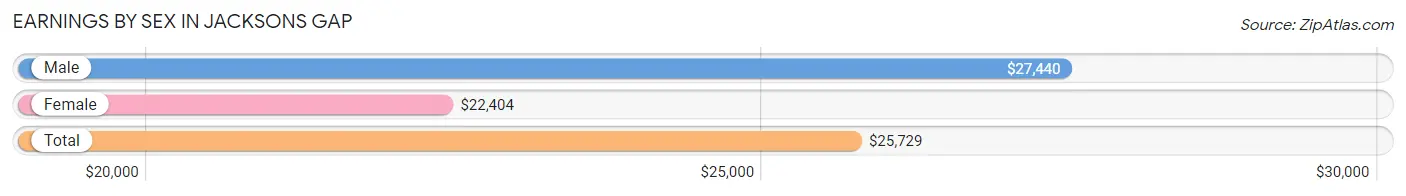
Earnings by Sex in Jacksons Gap
Average Earnings in Jacksons Gap are $25,729, $27,440 for men and $22,404 for women, a difference of 18.3%.
| Sex | Number | Average Earnings |
| Male | 113 (47.9%) | $27,440 |
| Female | 123 (52.1%) | $22,404 |
| Total | 236 (100.0%) | $25,729 |
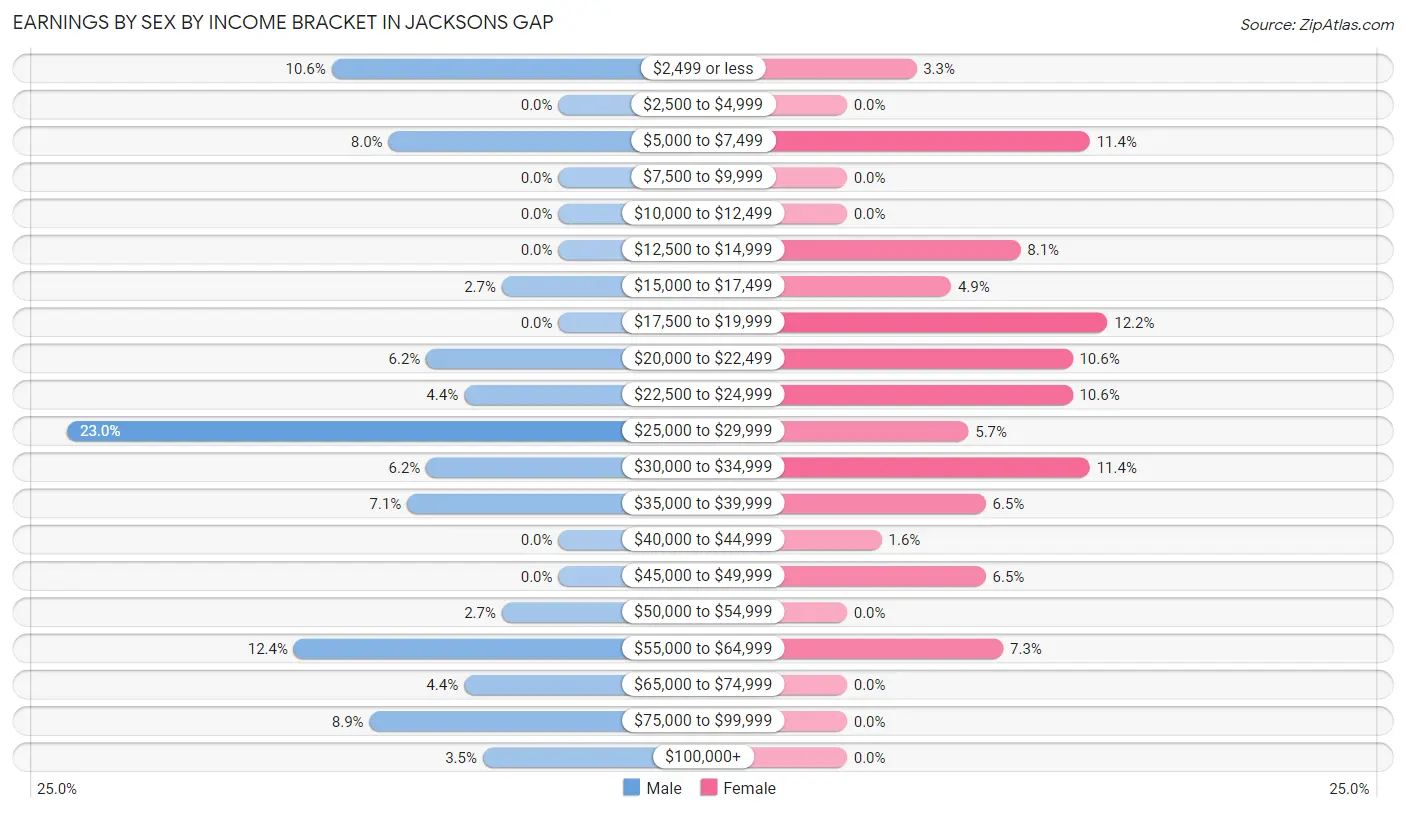
Earnings by Sex by Income Bracket in Jacksons Gap
The most common earnings brackets in Jacksons Gap are $25,000 to $29,999 for men (26 | 23.0%) and $17,500 to $19,999 for women (15 | 12.2%).
| Income | Male | Female |
| $2,499 or less | 12 (10.6%) | 4 (3.3%) |
| $2,500 to $4,999 | 0 (0.0%) | 0 (0.0%) |
| $5,000 to $7,499 | 9 (8.0%) | 14 (11.4%) |
| $7,500 to $9,999 | 0 (0.0%) | 0 (0.0%) |
| $10,000 to $12,499 | 0 (0.0%) | 0 (0.0%) |
| $12,500 to $14,999 | 0 (0.0%) | 10 (8.1%) |
| $15,000 to $17,499 | 3 (2.6%) | 6 (4.9%) |
| $17,500 to $19,999 | 0 (0.0%) | 15 (12.2%) |
| $20,000 to $22,499 | 7 (6.2%) | 13 (10.6%) |
| $22,500 to $24,999 | 5 (4.4%) | 13 (10.6%) |
| $25,000 to $29,999 | 26 (23.0%) | 7 (5.7%) |
| $30,000 to $34,999 | 7 (6.2%) | 14 (11.4%) |
| $35,000 to $39,999 | 8 (7.1%) | 8 (6.5%) |
| $40,000 to $44,999 | 0 (0.0%) | 2 (1.6%) |
| $45,000 to $49,999 | 0 (0.0%) | 8 (6.5%) |
| $50,000 to $54,999 | 3 (2.6%) | 0 (0.0%) |
| $55,000 to $64,999 | 14 (12.4%) | 9 (7.3%) |
| $65,000 to $74,999 | 5 (4.4%) | 0 (0.0%) |
| $75,000 to $99,999 | 10 (8.8%) | 0 (0.0%) |
| $100,000+ | 4 (3.5%) | 0 (0.0%) |
| Total | 113 (100.0%) | 123 (100.0%) |
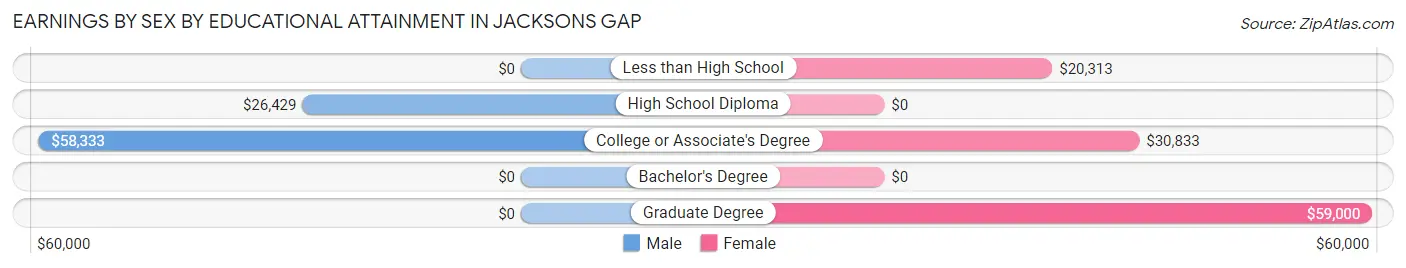
Earnings by Sex by Educational Attainment in Jacksons Gap
Average earnings in Jacksons Gap are $35,000 for men and $24,615 for women, a difference of 29.7%. Men with an educational attainment of college or associate's degree enjoy the highest average annual earnings of $58,333, while those with high school diploma education earn the least with $26,429. Women with an educational attainment of graduate degree earn the most with the average annual earnings of $59,000, while those with less than high school education have the smallest earnings of $20,313.
| Educational Attainment | Male Income | Female Income |
| Less than High School | - | - |
| High School Diploma | $26,429 | $0 |
| College or Associate's Degree | $58,333 | $30,833 |
| Bachelor's Degree | - | - |
| Graduate Degree | - | - |
| Total | $35,000 | $24,615 |
Family Income in Jacksons Gap
Family Income Brackets in Jacksons Gap
According to the Jacksons Gap family income data, there are 26 families falling into the $75,000 to $99,999 income range, which is the most common income bracket and makes up 24.3% of all families.
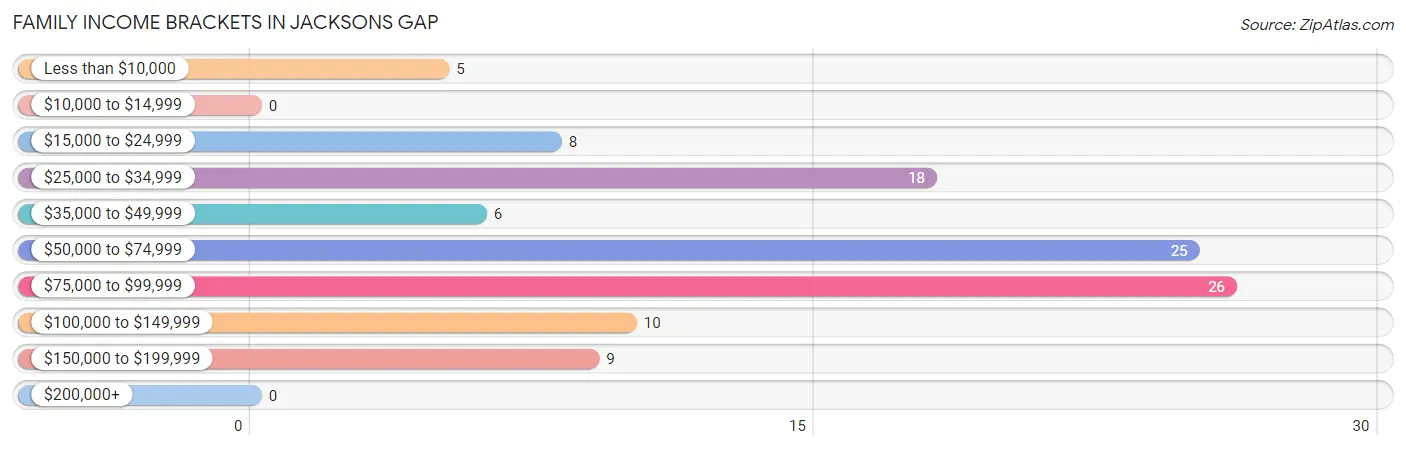
| Income Bracket | # Families | % Families |
| Less than $10,000 | 5 | 4.7% |
| $10,000 to $14,999 | 0 | 0.0% |
| $15,000 to $24,999 | 8 | 7.5% |
| $25,000 to $34,999 | 18 | 16.8% |
| $35,000 to $49,999 | 6 | 5.6% |
| $50,000 to $74,999 | 25 | 23.4% |
| $75,000 to $99,999 | 26 | 24.3% |
| $100,000 to $149,999 | 10 | 9.3% |
| $150,000 to $199,999 | 9 | 8.4% |
| $200,000+ | 0 | 0.0% |
Family Income by Famaliy Size in Jacksons Gap
4-person families (26 | 24.3%) account for the highest median family income in Jacksons Gap with $83,750 per family, while 2-person families (59 | 55.1%) have the highest median income of $21,875 per family member.
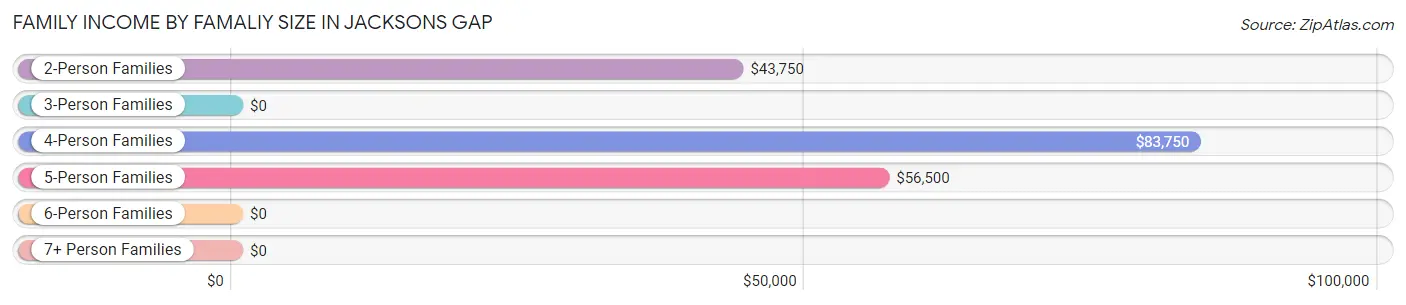
| Income Bracket | # Families | Median Income |
| 2-Person Families | 59 (55.1%) | $43,750 |
| 3-Person Families | 4 (3.7%) | $0 |
| 4-Person Families | 26 (24.3%) | $83,750 |
| 5-Person Families | 10 (9.3%) | $56,500 |
| 6-Person Families | 8 (7.5%) | $0 |
| 7+ Person Families | 0 (0.0%) | $0 |
| Total | 107 (100.0%) | $66,875 |
Family Income by Number of Earners in Jacksons Gap
The median family income in Jacksons Gap is $66,875, with families comprising 3+ earners (26) having the highest median family income of $89,063, while families with no earners (27) have the lowest median family income of $31,250, accounting for 24.3% and 25.2% of families, respectively.
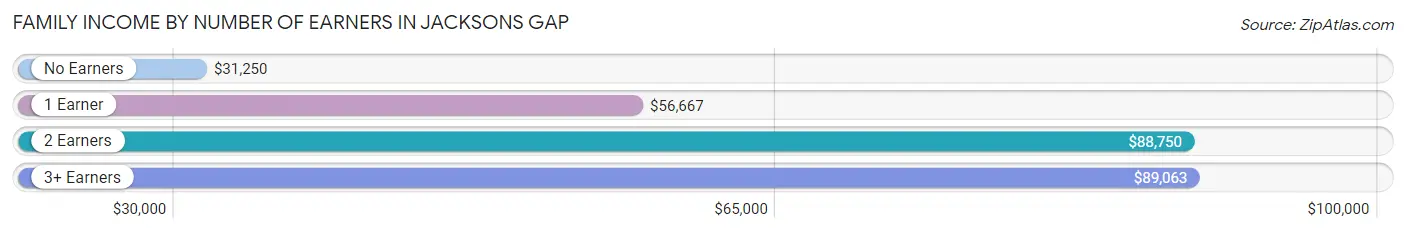
| Number of Earners | # Families | Median Income |
| No Earners | 27 (25.2%) | $31,250 |
| 1 Earner | 32 (29.9%) | $56,667 |
| 2 Earners | 22 (20.6%) | $88,750 |
| 3+ Earners | 26 (24.3%) | $89,063 |
| Total | 107 (100.0%) | $66,875 |
Household Income in Jacksons Gap
Household Income Brackets in Jacksons Gap
With 47 households falling in the category, the $15,000 to $24,999 income range is the most frequent in Jacksons Gap, accounting for 22.1% of all households.
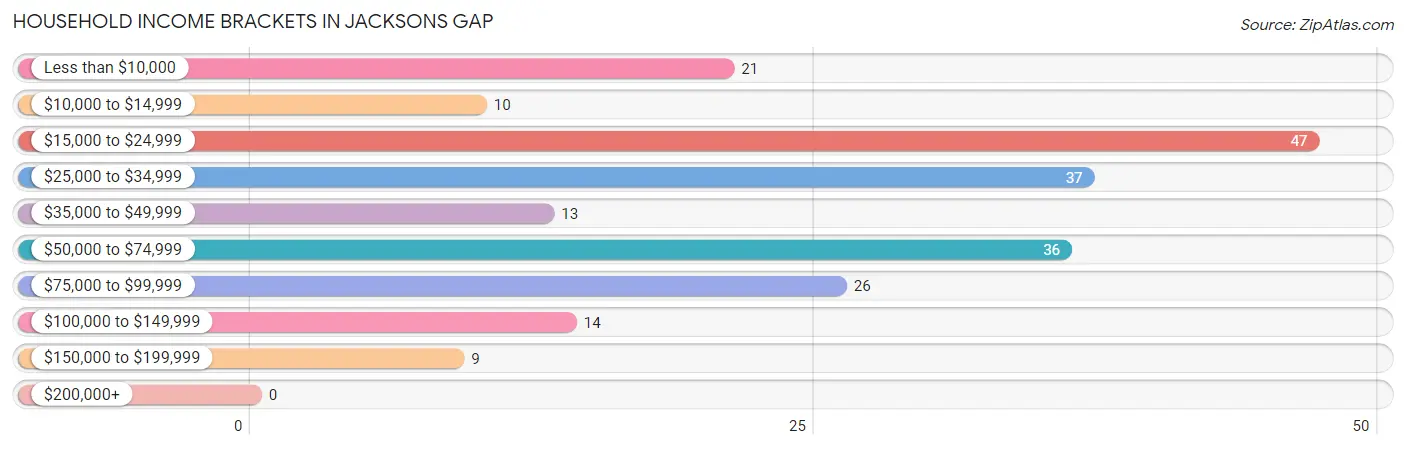
| Income Bracket | # Households | % Households |
| Less than $10,000 | 21 | 9.9% |
| $10,000 to $14,999 | 10 | 4.7% |
| $15,000 to $24,999 | 47 | 22.1% |
| $25,000 to $34,999 | 37 | 17.4% |
| $35,000 to $49,999 | 13 | 6.1% |
| $50,000 to $74,999 | 36 | 16.9% |
| $75,000 to $99,999 | 26 | 12.2% |
| $100,000 to $149,999 | 14 | 6.6% |
| $150,000 to $199,999 | 9 | 4.2% |
| $200,000+ | 0 | 0.0% |
Household Income by Householder Age in Jacksons Gap
The median household income in Jacksons Gap is $30,417, with the highest median household income of $59,250 found in the 25 to 44 years age bracket for the primary householder. A total of 31 households (14.5%) fall into this category. Meanwhile, the 15 to 24 years age bracket for the primary householder has the lowest median household income of $0, with 2 households (0.9%) in this group.
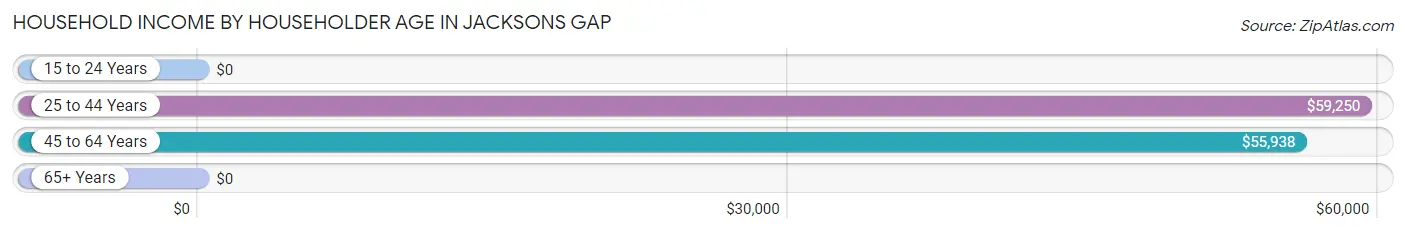
| Income Bracket | # Households | Median Income |
| 15 to 24 Years | 2 (0.9%) | $0 |
| 25 to 44 Years | 31 (14.5%) | $59,250 |
| 45 to 64 Years | 96 (45.1%) | $55,938 |
| 65+ Years | 84 (39.4%) | $0 |
| Total | 213 (100.0%) | $30,417 |
Poverty in Jacksons Gap
Income Below Poverty by Sex and Age in Jacksons Gap
With 7.4% poverty level for males and 21.3% for females among the residents of Jacksons Gap, 12 to 14 year old males and under 5 year old females are the most vulnerable to poverty, with 4 males (66.7%) and 13 females (54.2%) in their respective age groups living below the poverty level.
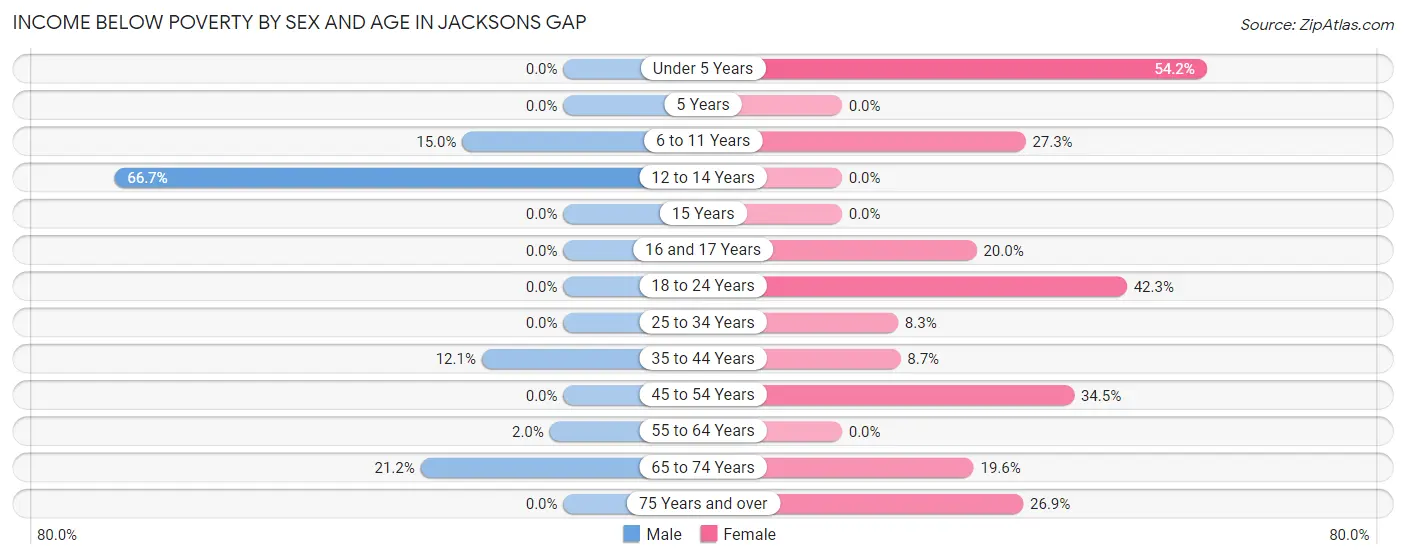
| Age Bracket | Male | Female |
| Under 5 Years | 0 (0.0%) | 13 (54.2%) |
| 5 Years | 0 (0.0%) | 0 (0.0%) |
| 6 to 11 Years | 3 (15.0%) | 3 (27.3%) |
| 12 to 14 Years | 4 (66.7%) | 0 (0.0%) |
| 15 Years | 0 (0.0%) | 0 (0.0%) |
| 16 and 17 Years | 0 (0.0%) | 1 (20.0%) |
| 18 to 24 Years | 0 (0.0%) | 11 (42.3%) |
| 25 to 34 Years | 0 (0.0%) | 2 (8.3%) |
| 35 to 44 Years | 4 (12.1%) | 4 (8.7%) |
| 45 to 54 Years | 0 (0.0%) | 10 (34.5%) |
| 55 to 64 Years | 1 (2.0%) | 0 (0.0%) |
| 65 to 74 Years | 7 (21.2%) | 9 (19.6%) |
| 75 Years and over | 0 (0.0%) | 7 (26.9%) |
| Total | 19 (7.4%) | 60 (21.3%) |
Income Above Poverty by Sex and Age in Jacksons Gap
According to the poverty statistics in Jacksons Gap, males aged 16 and 17 years and females aged 12 to 14 years are the age groups that are most secure financially, with 100.0% of males and 100.0% of females in these age groups living above the poverty line.
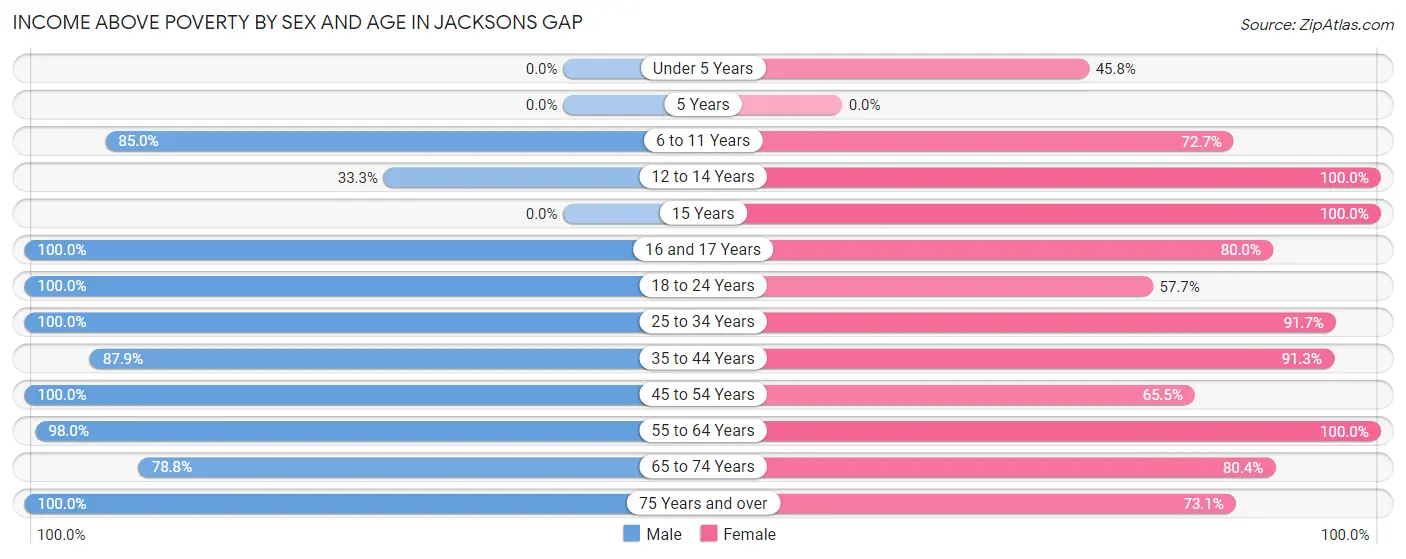
| Age Bracket | Male | Female |
| Under 5 Years | 0 (0.0%) | 11 (45.8%) |
| 5 Years | 0 (0.0%) | 0 (0.0%) |
| 6 to 11 Years | 17 (85.0%) | 8 (72.7%) |
| 12 to 14 Years | 2 (33.3%) | 2 (100.0%) |
| 15 Years | 0 (0.0%) | 4 (100.0%) |
| 16 and 17 Years | 8 (100.0%) | 4 (80.0%) |
| 18 to 24 Years | 21 (100.0%) | 15 (57.7%) |
| 25 to 34 Years | 50 (100.0%) | 22 (91.7%) |
| 35 to 44 Years | 29 (87.9%) | 42 (91.3%) |
| 45 to 54 Years | 25 (100.0%) | 19 (65.5%) |
| 55 to 64 Years | 48 (98.0%) | 38 (100.0%) |
| 65 to 74 Years | 26 (78.8%) | 37 (80.4%) |
| 75 Years and over | 11 (100.0%) | 19 (73.1%) |
| Total | 237 (92.6%) | 221 (78.6%) |
Income Below Poverty Among Married-Couple Families in Jacksons Gap
The poverty statistics for married-couple families in Jacksons Gap show that 4.4% or 3 of the total 68 families live below the poverty line. Families with 1 or 2 children have the highest poverty rate of 9.1%, comprising of 2 families. On the other hand, families with 3 or 4 children have the lowest poverty rate of 0.0%, which includes 0 families.
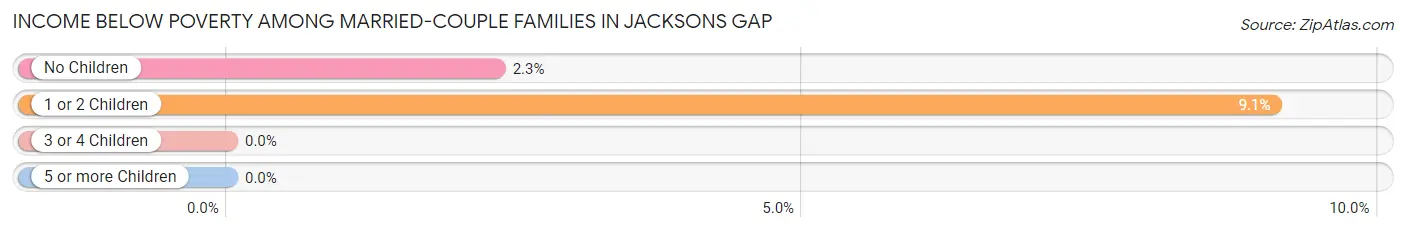
| Children | Above Poverty | Below Poverty |
| No Children | 42 (97.7%) | 1 (2.3%) |
| 1 or 2 Children | 20 (90.9%) | 2 (9.1%) |
| 3 or 4 Children | 3 (100.0%) | 0 (0.0%) |
| 5 or more Children | 0 (0.0%) | 0 (0.0%) |
| Total | 65 (95.6%) | 3 (4.4%) |
Income Below Poverty Among Single-Parent Households in Jacksons Gap
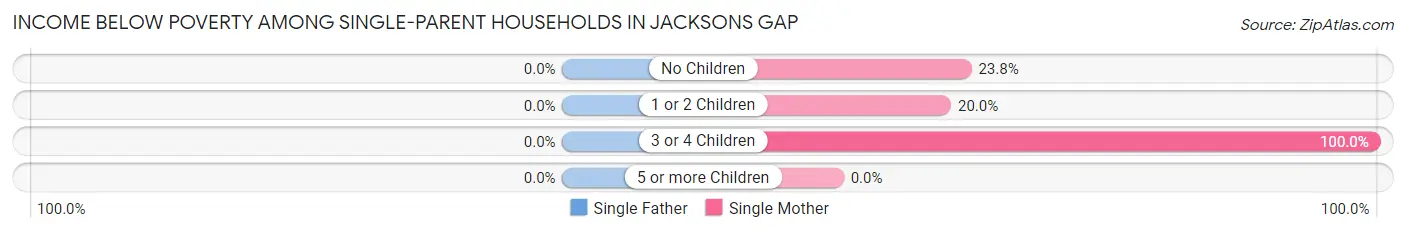
| Children | Single Father | Single Mother |
| No Children | 0 (0.0%) | 5 (23.8%) |
| 1 or 2 Children | 0 (0.0%) | 2 (20.0%) |
| 3 or 4 Children | 0 (0.0%) | 2 (100.0%) |
| 5 or more Children | 0 (0.0%) | 0 (0.0%) |
| Total | 0 (0.0%) | 9 (27.3%) |
Income Below Poverty Among Married-Couple vs Single-Parent Households in Jacksons Gap
The poverty data for Jacksons Gap shows that 3 of the married-couple family households (4.4%) and 9 of the single-parent households (23.1%) are living below the poverty level. Within the married-couple family households, those with 1 or 2 children have the highest poverty rate, with 2 households (9.1%) falling below the poverty line. Among the single-parent households, those with 3 or 4 children have the highest poverty rate, with 2 household (100.0%) living below poverty.
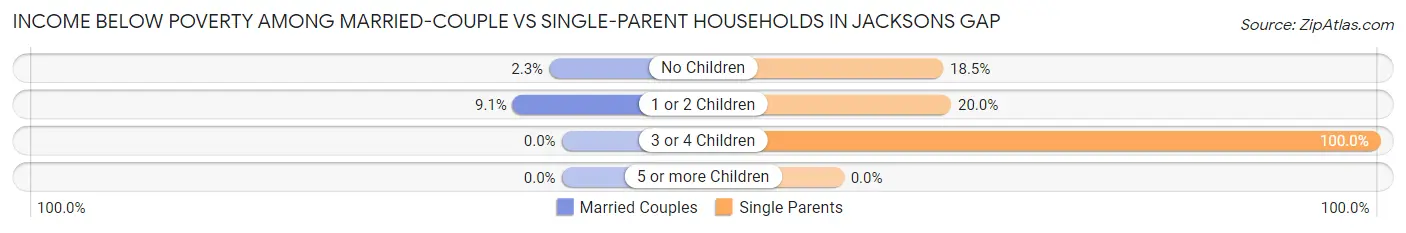
| Children | Married-Couple Families | Single-Parent Households |
| No Children | 1 (2.3%) | 5 (18.5%) |
| 1 or 2 Children | 2 (9.1%) | 2 (20.0%) |
| 3 or 4 Children | 0 (0.0%) | 2 (100.0%) |
| 5 or more Children | 0 (0.0%) | 0 (0.0%) |
| Total | 3 (4.4%) | 9 (23.1%) |
Race in Jacksons Gap
The most populous races in Jacksons Gap are White / Caucasian (431 | 80.3%), Black / African American (100 | 18.6%), and Asian (4 | 0.7%).
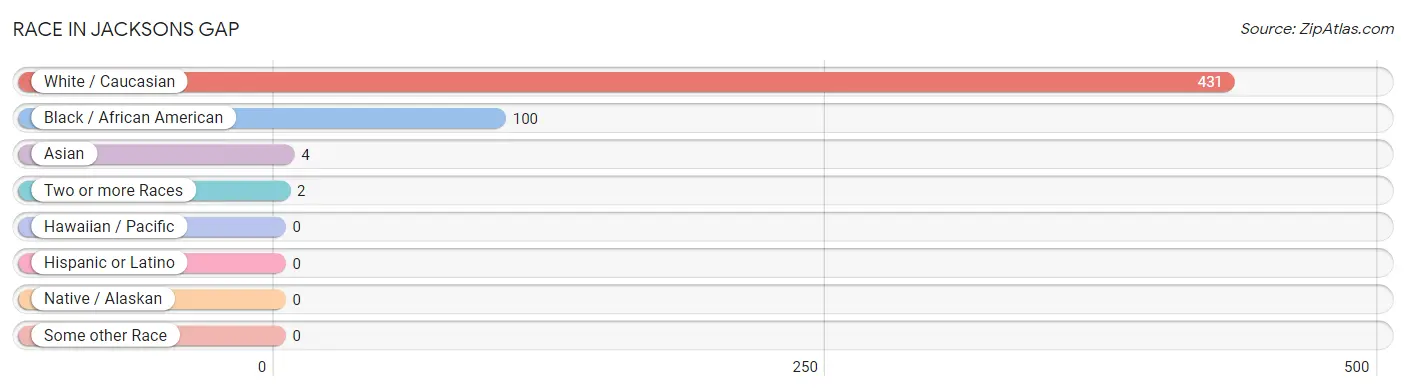
| Race | # Population | % Population |
| Asian | 4 | 0.7% |
| Black / African American | 100 | 18.6% |
| Hawaiian / Pacific | 0 | 0.0% |
| Hispanic or Latino | 0 | 0.0% |
| Native / Alaskan | 0 | 0.0% |
| White / Caucasian | 431 | 80.3% |
| Two or more Races | 2 | 0.4% |
| Some other Race | 0 | 0.0% |
| Total | 537 | 100.0% |
Ancestry in Jacksons Gap
The most populous ancestries reported in Jacksons Gap are English (72 | 13.4%), American (62 | 11.6%), Irish (38 | 7.1%), German (20 | 3.7%), and Welsh (17 | 3.2%), together accounting for 38.9% of all Jacksons Gap residents.
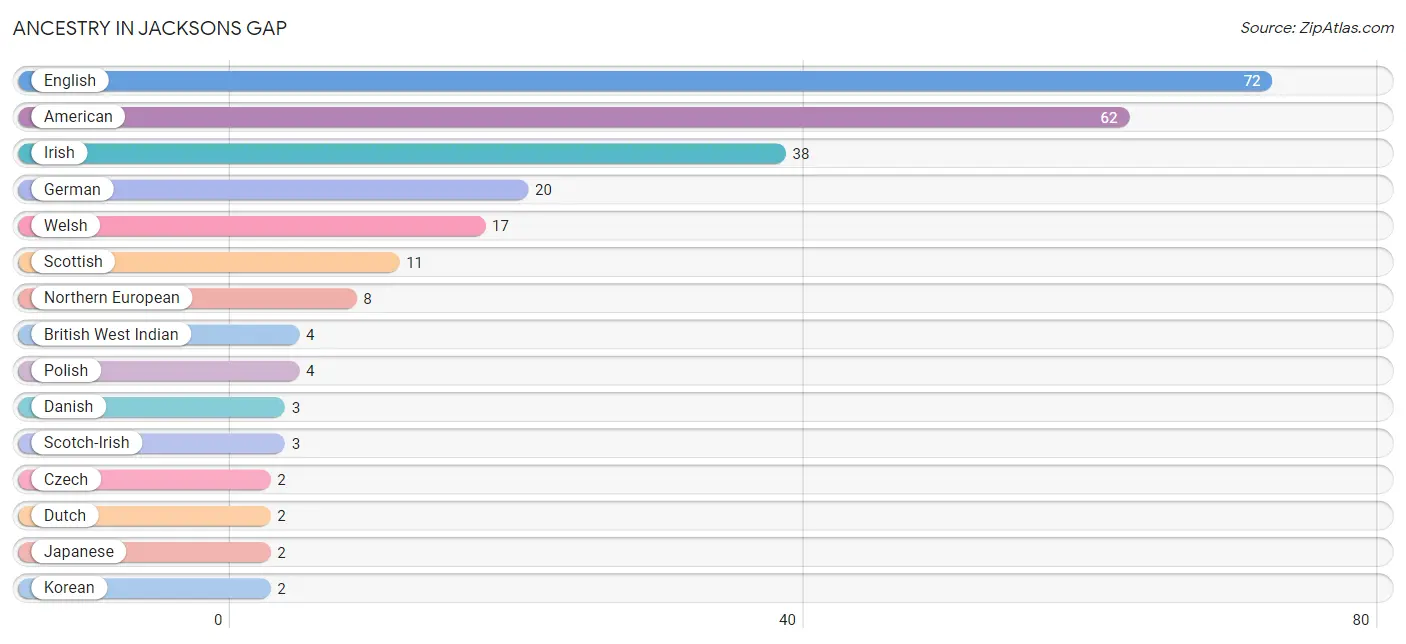
| Ancestry | # Population | % Population |
| American | 62 | 11.6% |
| British West Indian | 4 | 0.7% |
| Czech | 2 | 0.4% |
| Danish | 3 | 0.6% |
| Dutch | 2 | 0.4% |
| Dutch West Indian | 1 | 0.2% |
| English | 72 | 13.4% |
| German | 20 | 3.7% |
| Irish | 38 | 7.1% |
| Japanese | 2 | 0.4% |
| Korean | 2 | 0.4% |
| Northern European | 8 | 1.5% |
| Polish | 4 | 0.7% |
| Scotch-Irish | 3 | 0.6% |
| Scottish | 11 | 2.1% |
| Thai | 2 | 0.4% |
| Welsh | 17 | 3.2% | View All 17 Rows |
Immigrants in Jacksons Gap
The most numerous immigrant groups reported in Jacksons Gap came from Asia (4 | 0.7%), England (4 | 0.7%), Europe (4 | 0.7%), Northern Europe (4 | 0.7%), and South Eastern Asia (4 | 0.7%), together accounting for 3.7% of all Jacksons Gap residents.
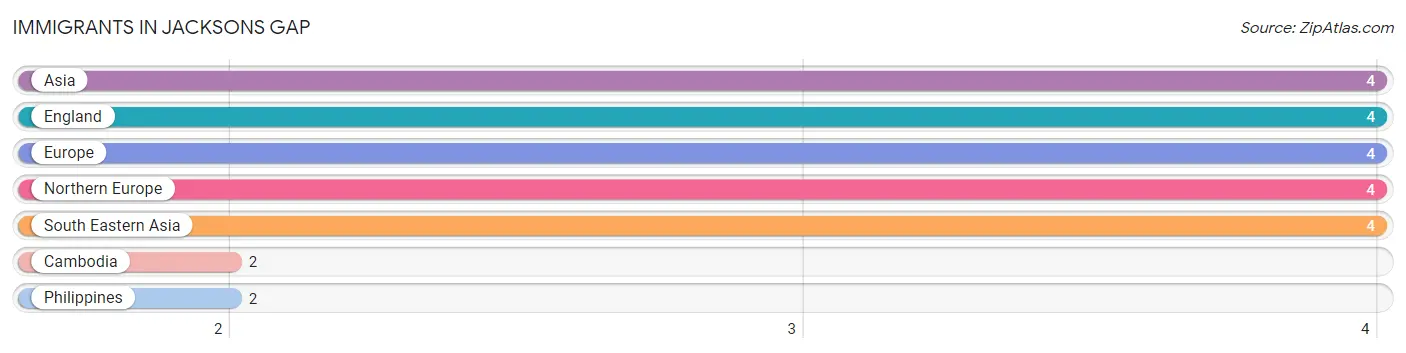
| Immigration Origin | # Population | % Population |
| Asia | 4 | 0.7% |
| Cambodia | 2 | 0.4% |
| England | 4 | 0.7% |
| Europe | 4 | 0.7% |
| Northern Europe | 4 | 0.7% |
| Philippines | 2 | 0.4% |
| South Eastern Asia | 4 | 0.7% | View All 7 Rows |
Sex and Age in Jacksons Gap
Sex and Age in Jacksons Gap
The most populous age groups in Jacksons Gap are 30 to 34 Years (39 | 15.2%) for men and 20 to 24 Years (26 | 9.2%) for women.
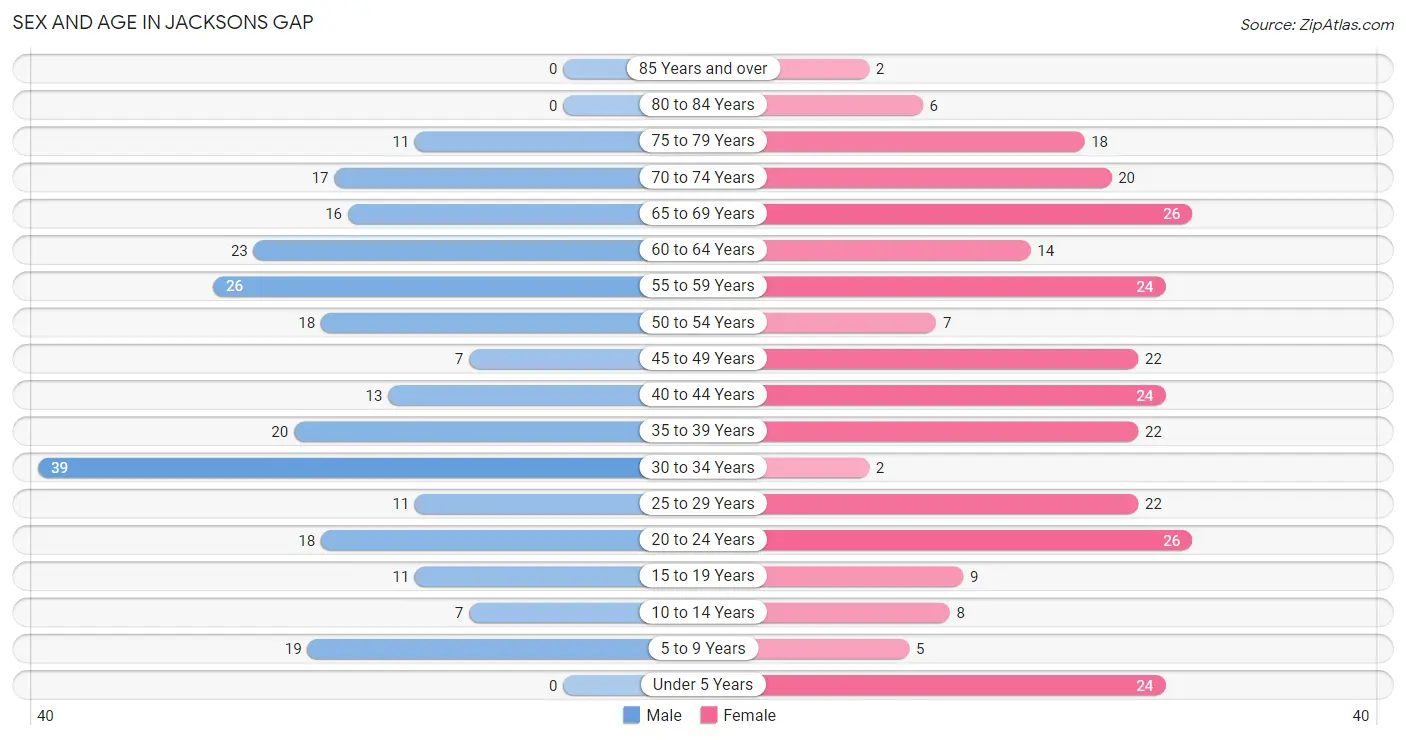
| Age Bracket | Male | Female |
| Under 5 Years | 0 (0.0%) | 24 (8.5%) |
| 5 to 9 Years | 19 (7.4%) | 5 (1.8%) |
| 10 to 14 Years | 7 (2.7%) | 8 (2.9%) |
| 15 to 19 Years | 11 (4.3%) | 9 (3.2%) |
| 20 to 24 Years | 18 (7.0%) | 26 (9.2%) |
| 25 to 29 Years | 11 (4.3%) | 22 (7.8%) |
| 30 to 34 Years | 39 (15.2%) | 2 (0.7%) |
| 35 to 39 Years | 20 (7.8%) | 22 (7.8%) |
| 40 to 44 Years | 13 (5.1%) | 24 (8.5%) |
| 45 to 49 Years | 7 (2.7%) | 22 (7.8%) |
| 50 to 54 Years | 18 (7.0%) | 7 (2.5%) |
| 55 to 59 Years | 26 (10.2%) | 24 (8.5%) |
| 60 to 64 Years | 23 (9.0%) | 14 (5.0%) |
| 65 to 69 Years | 16 (6.2%) | 26 (9.2%) |
| 70 to 74 Years | 17 (6.6%) | 20 (7.1%) |
| 75 to 79 Years | 11 (4.3%) | 18 (6.4%) |
| 80 to 84 Years | 0 (0.0%) | 6 (2.1%) |
| 85 Years and over | 0 (0.0%) | 2 (0.7%) |
| Total | 256 (100.0%) | 281 (100.0%) |
Families and Households in Jacksons Gap
Median Family Size in Jacksons Gap
The median family size in Jacksons Gap is 3.97 persons per family, with single female/mother families (33 | 30.8%) accounting for the largest median family size of 5 persons per family. On the other hand, single male/father families (6 | 5.6%) represent the smallest median family size with 2.83 persons per family.
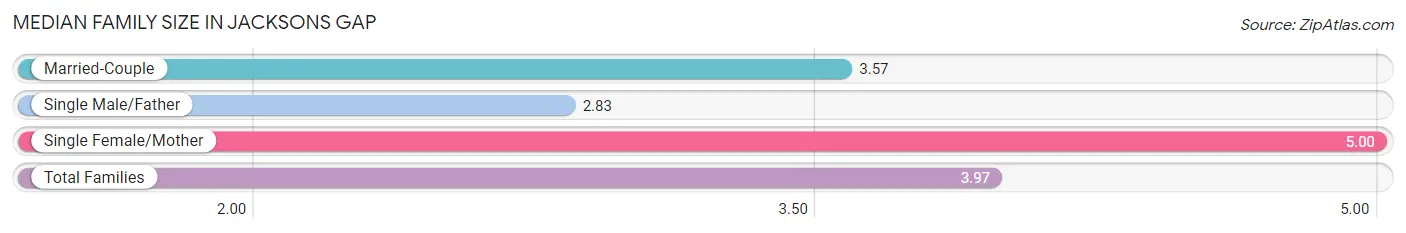
| Family Type | # Families | Family Size |
| Married-Couple | 68 (63.5%) | 3.57 |
| Single Male/Father | 6 (5.6%) | 2.83 |
| Single Female/Mother | 33 (30.8%) | 5.00 |
| Total Families | 107 (100.0%) | 3.97 |
Median Household Size in Jacksons Gap
The median household size in Jacksons Gap is 2.52 persons per household, with single female/mother households (33 | 15.5%) accounting for the largest median household size of 5 persons per household. non-family households (106 | 49.8%) represent the smallest median household size with 1.02 persons per household.
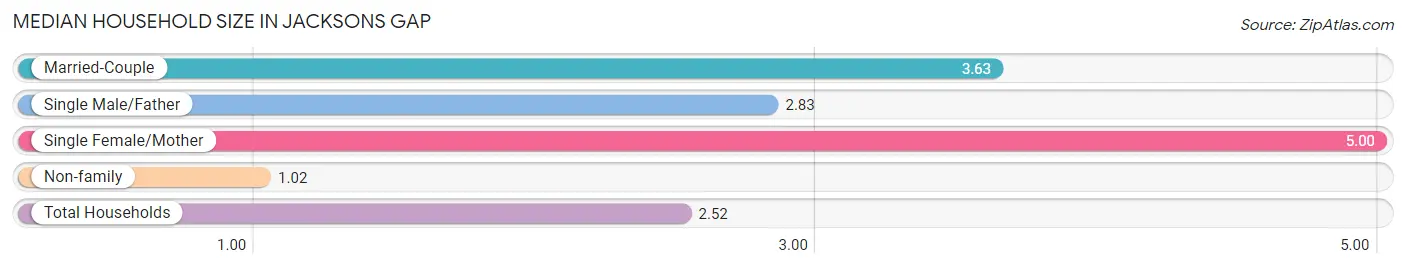
| Household Type | # Households | Household Size |
| Married-Couple | 68 (31.9%) | 3.63 |
| Single Male/Father | 6 (2.8%) | 2.83 |
| Single Female/Mother | 33 (15.5%) | 5.00 |
| Non-family | 106 (49.8%) | 1.02 |
| Total Households | 213 (100.0%) | 2.52 |
Household Size by Marriage Status in Jacksons Gap
Out of a total of 213 households in Jacksons Gap, 107 (50.2%) are family households, while 106 (49.8%) are nonfamily households. The most numerous type of family households are 2-person households, comprising 55, and the most common type of nonfamily households are 1-person households, comprising 104.
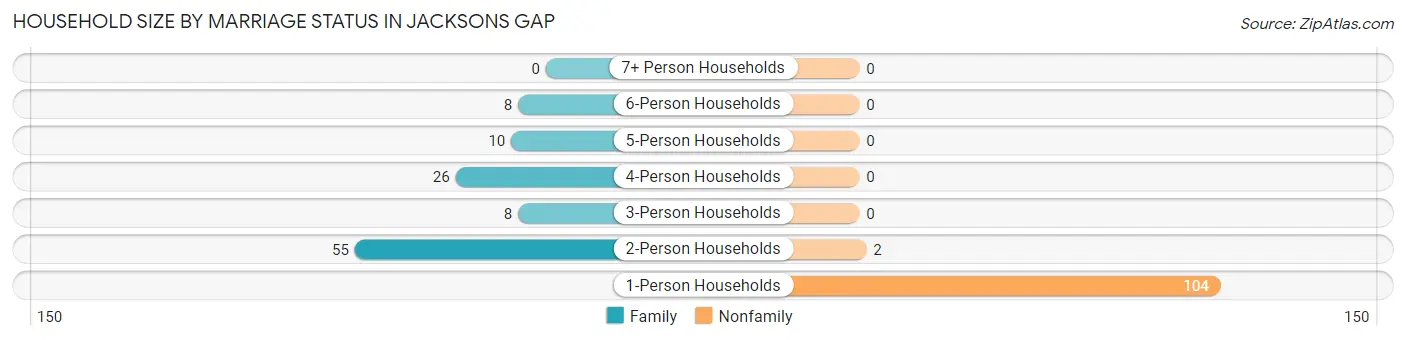
| Household Size | Family Households | Nonfamily Households |
| 1-Person Households | - | 104 (48.8%) |
| 2-Person Households | 55 (25.8%) | 2 (0.9%) |
| 3-Person Households | 8 (3.8%) | 0 (0.0%) |
| 4-Person Households | 26 (12.2%) | 0 (0.0%) |
| 5-Person Households | 10 (4.7%) | 0 (0.0%) |
| 6-Person Households | 8 (3.8%) | 0 (0.0%) |
| 7+ Person Households | 0 (0.0%) | 0 (0.0%) |
| Total | 107 (50.2%) | 106 (49.8%) |
Female Fertility in Jacksons Gap
Fertility by Age in Jacksons Gap
Average fertility rate in Jacksons Gap is 55.0 births per 1,000 women. Women in the age bracket of 20 to 34 years have the highest fertility rate with 140.0 births per 1,000 women. Women in the age bracket of 20 to 34 years acount for 100.0% of all women with births.
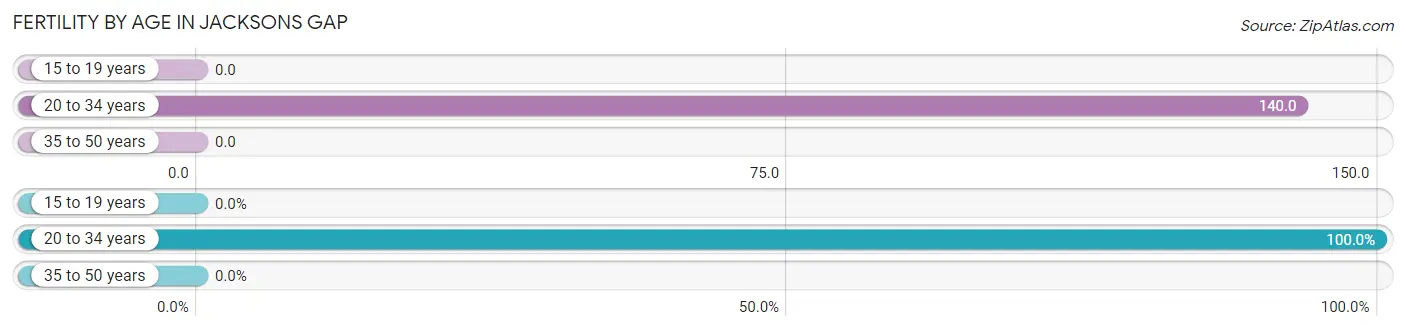
| Age Bracket | Women with Births | Births / 1,000 Women |
| 15 to 19 years | 0 (0.0%) | 0.0 |
| 20 to 34 years | 7 (100.0%) | 140.0 |
| 35 to 50 years | 0 (0.0%) | 0.0 |
| Total | 7 (100.0%) | 55.0 |
Fertility by Age by Marriage Status in Jacksons Gap
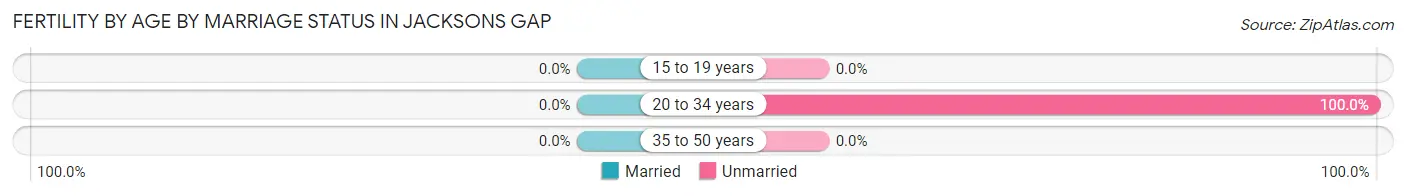
| Age Bracket | Married | Unmarried |
| 15 to 19 years | 0 (0.0%) | 0 (0.0%) |
| 20 to 34 years | 0 (0.0%) | 7 (100.0%) |
| 35 to 50 years | 0 (0.0%) | 0 (0.0%) |
| Total | 0 (0.0%) | 7 (100.0%) |
Fertility by Education in Jacksons Gap
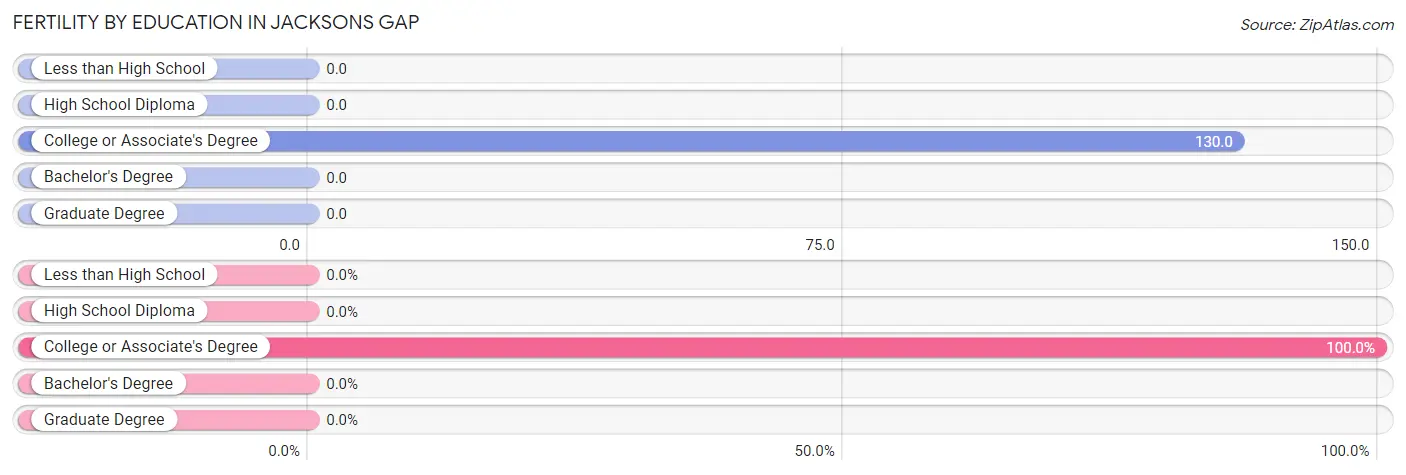
| Educational Attainment | Women with Births | Births / 1,000 Women |
| Less than High School | 0 (0.0%) | 0.0 |
| High School Diploma | 0 (0.0%) | 0.0 |
| College or Associate's Degree | 7 (100.0%) | 130.0 |
| Bachelor's Degree | 0 (0.0%) | 0.0 |
| Graduate Degree | 0 (0.0%) | 0.0 |
| Total | 7 (100.0%) | 55.0 |
Fertility by Education by Marriage Status in Jacksons Gap
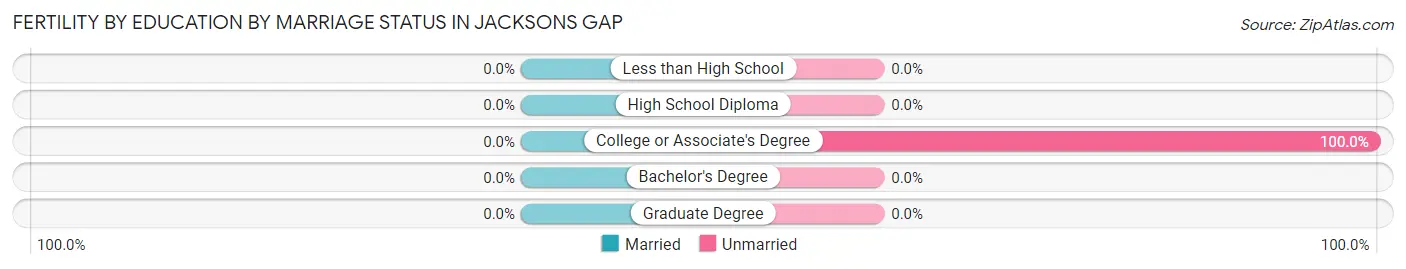
| Educational Attainment | Married | Unmarried |
| Less than High School | 0 (0.0%) | 0 (0.0%) |
| High School Diploma | 0 (0.0%) | 0 (0.0%) |
| College or Associate's Degree | 0 (0.0%) | 7 (100.0%) |
| Bachelor's Degree | 0 (0.0%) | 0 (0.0%) |
| Graduate Degree | 0 (0.0%) | 0 (0.0%) |
| Total | 0 (0.0%) | 7 (100.0%) |
Employment Characteristics in Jacksons Gap
Employment by Class of Employer in Jacksons Gap
Among the 184 employed individuals in Jacksons Gap, private company employees (139 | 75.5%), local government employees (14 | 7.6%), and self-employed (not incorporated) (11 | 6.0%) make up the most common classes of employment.
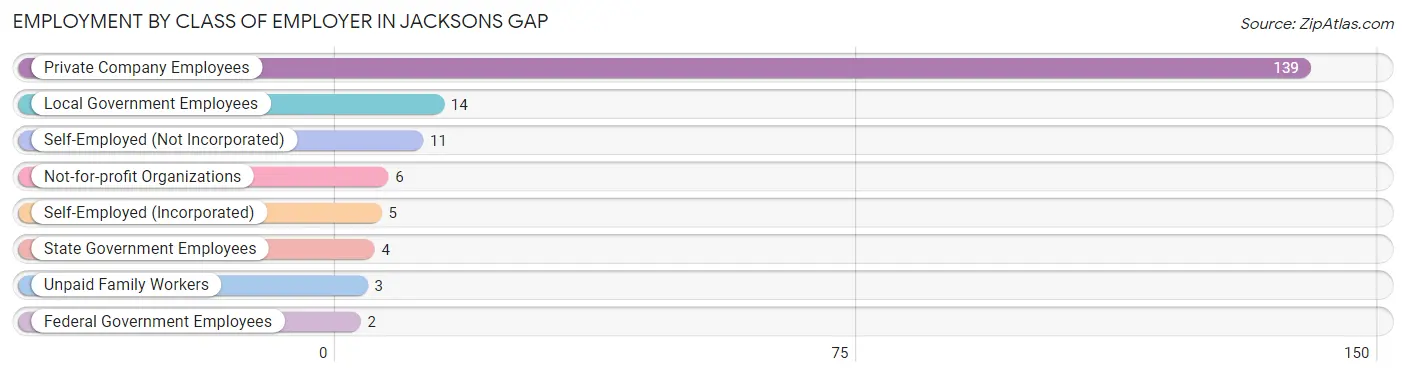
| Employer Class | # Employees | % Employees |
| Private Company Employees | 139 | 75.5% |
| Self-Employed (Incorporated) | 5 | 2.7% |
| Self-Employed (Not Incorporated) | 11 | 6.0% |
| Not-for-profit Organizations | 6 | 3.3% |
| Local Government Employees | 14 | 7.6% |
| State Government Employees | 4 | 2.2% |
| Federal Government Employees | 2 | 1.1% |
| Unpaid Family Workers | 3 | 1.6% |
| Total | 184 | 100.0% |
Employment Status by Age in Jacksons Gap
According to the labor force statistics for Jacksons Gap, out of the total population over 16 years of age (470), 48.7% or 229 individuals are in the labor force, with 17.9% or 41 of them unemployed. The age group with the highest labor force participation rate is 20 to 24 years, with 90.9% or 40 individuals in the labor force. Within the labor force, the 25 to 29 years age range has the highest percentage of unemployed individuals, with 75.9% or 22 of them being unemployed.
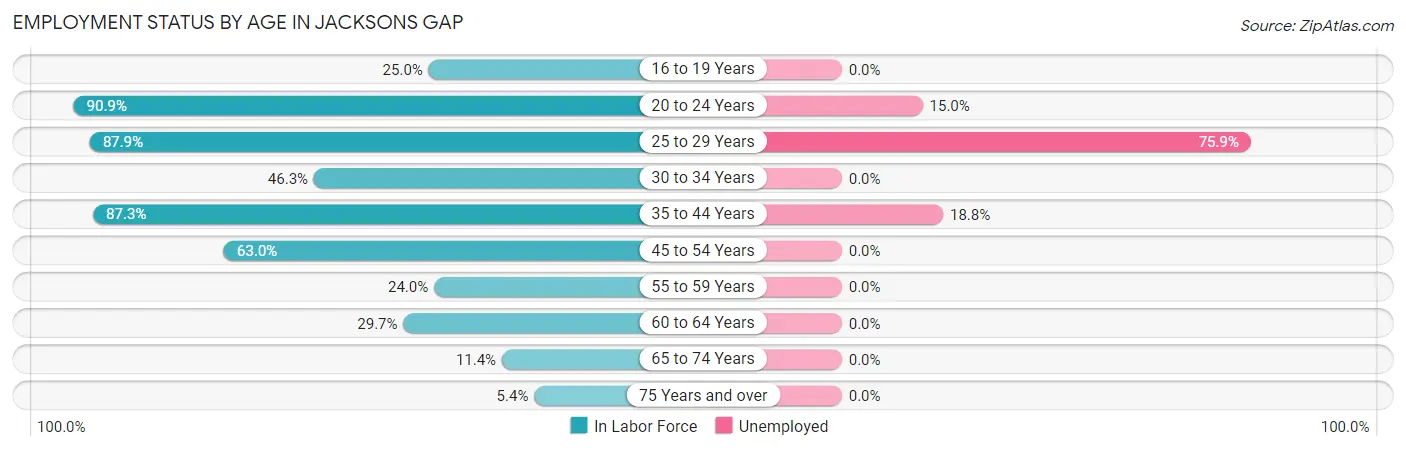
| Age Bracket | In Labor Force | Unemployed |
| 16 to 19 Years | 4 (25.0%) | 0 (0.0%) |
| 20 to 24 Years | 40 (90.9%) | 6 (15.0%) |
| 25 to 29 Years | 29 (87.9%) | 22 (75.9%) |
| 30 to 34 Years | 19 (46.3%) | 0 (0.0%) |
| 35 to 44 Years | 69 (87.3%) | 13 (18.8%) |
| 45 to 54 Years | 34 (63.0%) | 0 (0.0%) |
| 55 to 59 Years | 12 (24.0%) | 0 (0.0%) |
| 60 to 64 Years | 11 (29.7%) | 0 (0.0%) |
| 65 to 74 Years | 9 (11.4%) | 0 (0.0%) |
| 75 Years and over | 2 (5.4%) | 0 (0.0%) |
| Total | 229 (48.7%) | 41 (17.9%) |
Employment Status by Educational Attainment in Jacksons Gap
According to labor force statistics for Jacksons Gap, 59.2% of individuals (174) out of the total population between 25 and 64 years of age (294) are in the labor force, with 20.1% or 35 of them being unemployed. The group with the highest labor force participation rate are those with the educational attainment of bachelor's degree or higher, with 100.0% or 25 individuals in the labor force. Within the labor force, individuals with less than high school education have the highest percentage of unemployment, with 62.9% or 22 of them being unemployed.
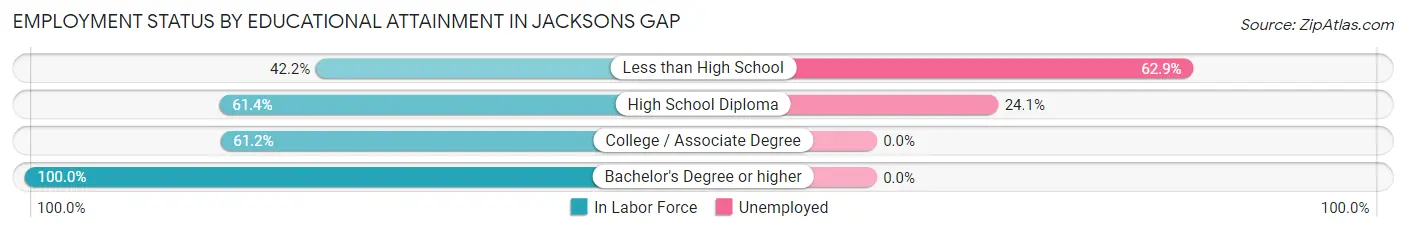
| Educational Attainment | In Labor Force | Unemployed |
| Less than High School | 35 (42.2%) | 52 (62.9%) |
| High School Diploma | 54 (61.4%) | 21 (24.1%) |
| College / Associate Degree | 60 (61.2%) | 0 (0.0%) |
| Bachelor's Degree or higher | 25 (100.0%) | 0 (0.0%) |
| Total | 174 (59.2%) | 59 (20.1%) |
Employment Occupations by Sex in Jacksons Gap
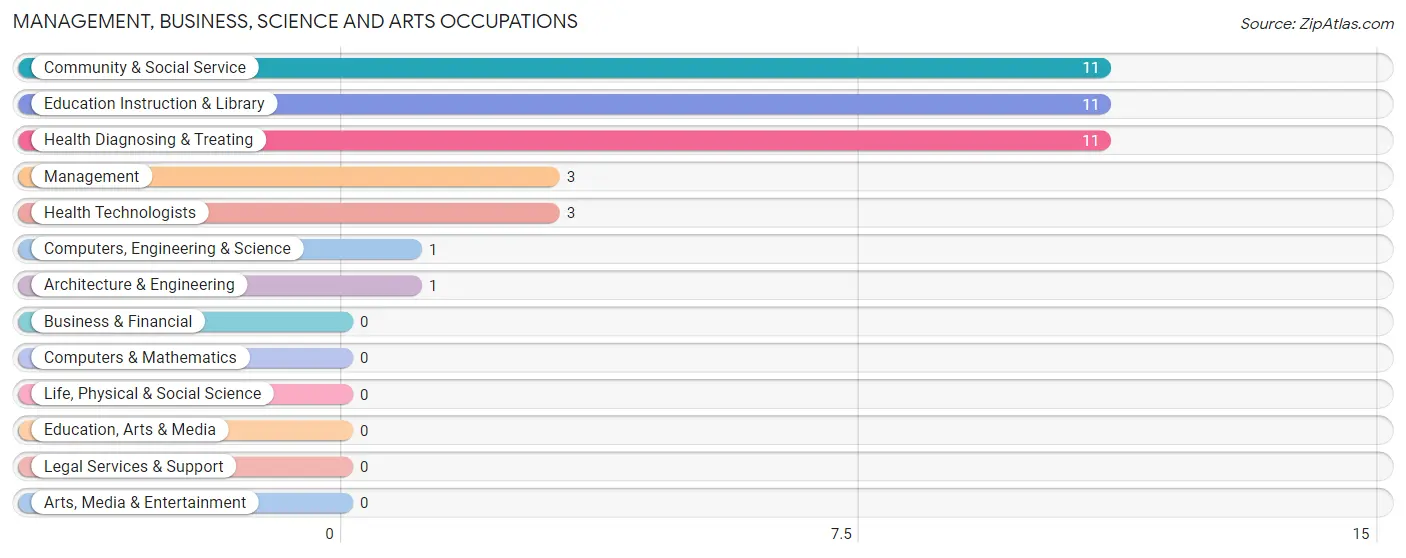
Management, Business, Science and Arts Occupations
The most common Management, Business, Science and Arts occupations in Jacksons Gap are Community & Social Service (11 | 5.9%), Education Instruction & Library (11 | 5.9%), Health Diagnosing & Treating (11 | 5.9%), Management (3 | 1.6%), and Health Technologists (3 | 1.6%).
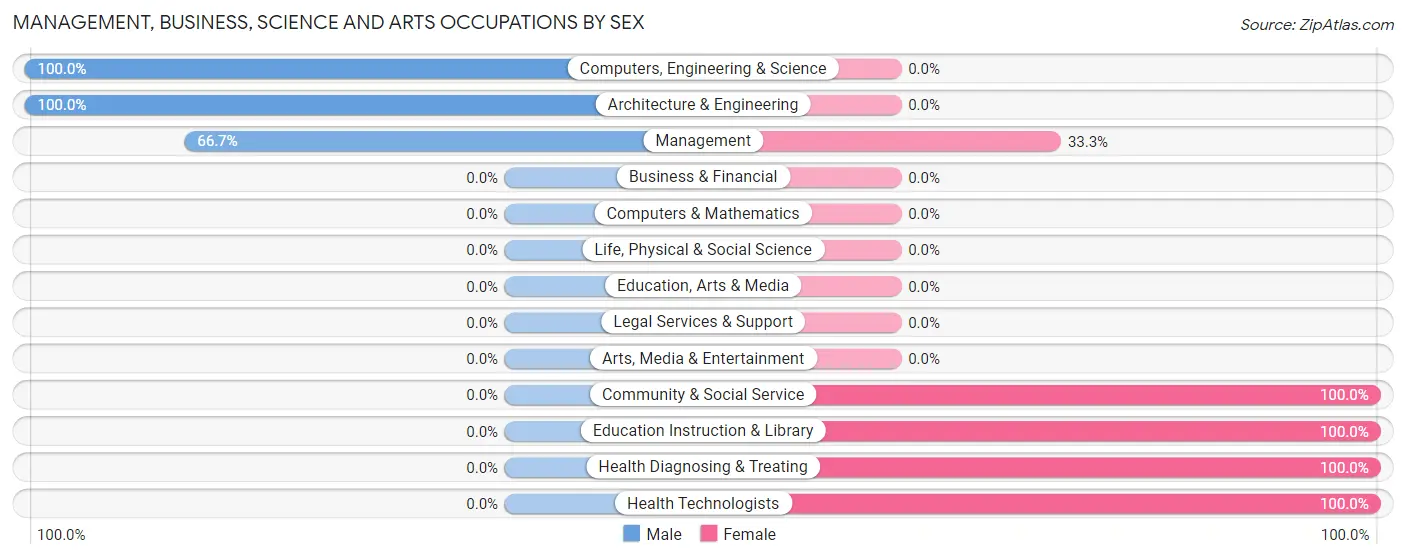
Management, Business, Science and Arts Occupations by Sex
Within the Management, Business, Science and Arts occupations in Jacksons Gap, the most male-oriented occupations are Computers, Engineering & Science (100.0%), Architecture & Engineering (100.0%), and Management (66.7%), while the most female-oriented occupations are Community & Social Service (100.0%), Education Instruction & Library (100.0%), and Health Diagnosing & Treating (100.0%).
| Occupation | Male | Female |
| Management | 2 (66.7%) | 1 (33.3%) |
| Business & Financial | 0 (0.0%) | 0 (0.0%) |
| Computers, Engineering & Science | 1 (100.0%) | 0 (0.0%) |
| Computers & Mathematics | 0 (0.0%) | 0 (0.0%) |
| Architecture & Engineering | 1 (100.0%) | 0 (0.0%) |
| Life, Physical & Social Science | 0 (0.0%) | 0 (0.0%) |
| Community & Social Service | 0 (0.0%) | 11 (100.0%) |
| Education, Arts & Media | 0 (0.0%) | 0 (0.0%) |
| Legal Services & Support | 0 (0.0%) | 0 (0.0%) |
| Education Instruction & Library | 0 (0.0%) | 11 (100.0%) |
| Arts, Media & Entertainment | 0 (0.0%) | 0 (0.0%) |
| Health Diagnosing & Treating | 0 (0.0%) | 11 (100.0%) |
| Health Technologists | 0 (0.0%) | 3 (100.0%) |
| Total (Category) | 3 (11.5%) | 23 (88.5%) |
| Total (Overall) | 90 (47.9%) | 98 (52.1%) |
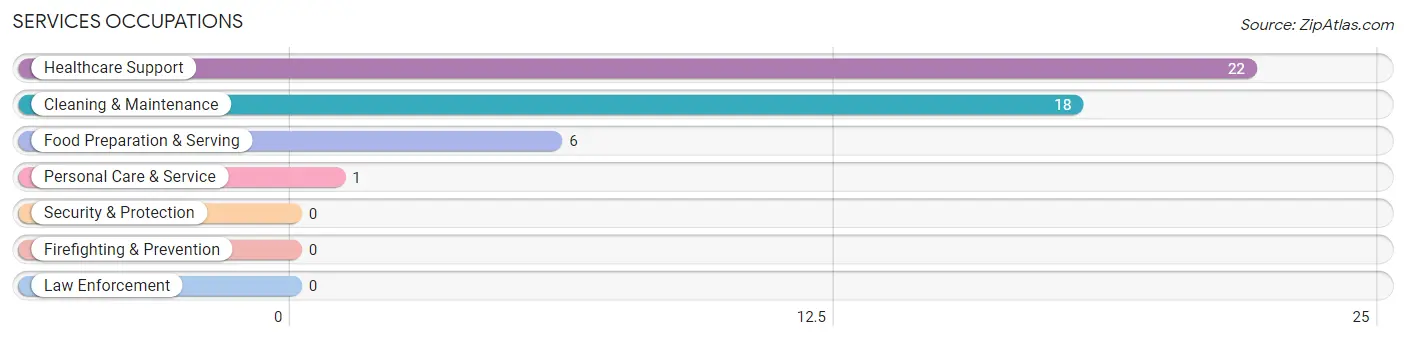
Services Occupations
The most common Services occupations in Jacksons Gap are Healthcare Support (22 | 11.7%), Cleaning & Maintenance (18 | 9.6%), Food Preparation & Serving (6 | 3.2%), and Personal Care & Service (1 | 0.5%).
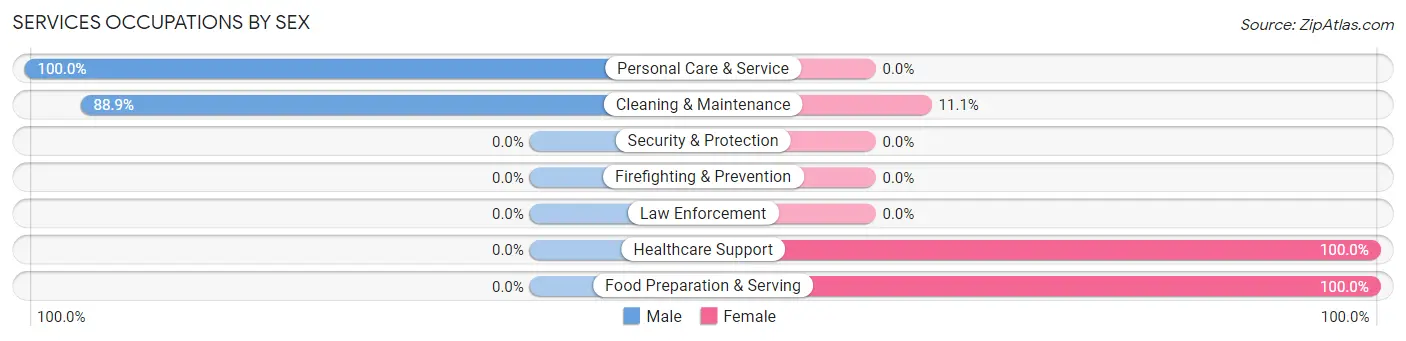
Services Occupations by Sex
Within the Services occupations in Jacksons Gap, the most male-oriented occupations are Personal Care & Service (100.0%), and Cleaning & Maintenance (88.9%), while the most female-oriented occupations are Healthcare Support (100.0%), Food Preparation & Serving (100.0%), and Cleaning & Maintenance (11.1%).
| Occupation | Male | Female |
| Healthcare Support | 0 (0.0%) | 22 (100.0%) |
| Security & Protection | 0 (0.0%) | 0 (0.0%) |
| Firefighting & Prevention | 0 (0.0%) | 0 (0.0%) |
| Law Enforcement | 0 (0.0%) | 0 (0.0%) |
| Food Preparation & Serving | 0 (0.0%) | 6 (100.0%) |
| Cleaning & Maintenance | 16 (88.9%) | 2 (11.1%) |
| Personal Care & Service | 1 (100.0%) | 0 (0.0%) |
| Total (Category) | 17 (36.2%) | 30 (63.8%) |
| Total (Overall) | 90 (47.9%) | 98 (52.1%) |
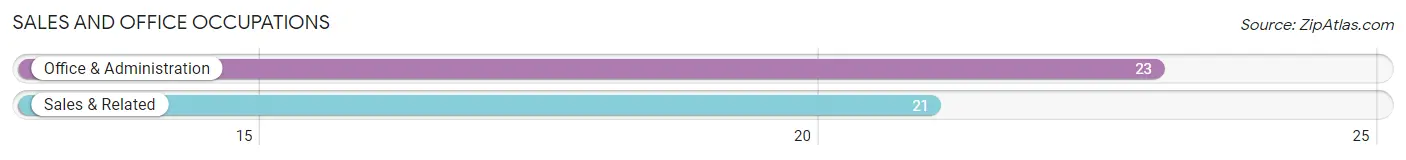
Sales and Office Occupations
The most common Sales and Office occupations in Jacksons Gap are Office & Administration (23 | 12.2%), and Sales & Related (21 | 11.2%).
Sales and Office Occupations by Sex
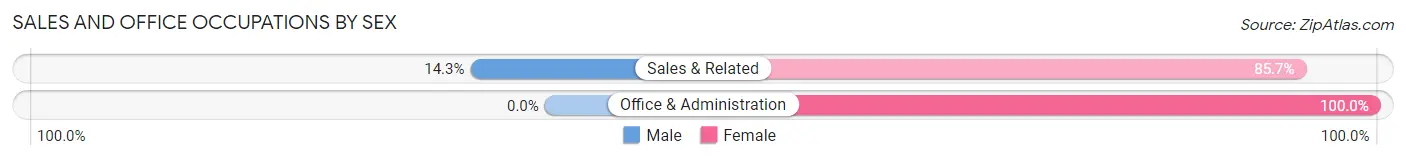
| Occupation | Male | Female |
| Sales & Related | 3 (14.3%) | 18 (85.7%) |
| Office & Administration | 0 (0.0%) | 23 (100.0%) |
| Total (Category) | 3 (6.8%) | 41 (93.2%) |
| Total (Overall) | 90 (47.9%) | 98 (52.1%) |
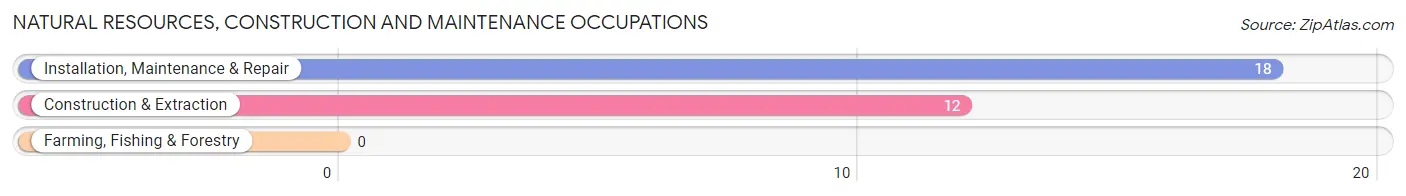
Natural Resources, Construction and Maintenance Occupations
The most common Natural Resources, Construction and Maintenance occupations in Jacksons Gap are Installation, Maintenance & Repair (18 | 9.6%), and Construction & Extraction (12 | 6.4%).
Natural Resources, Construction and Maintenance Occupations by Sex
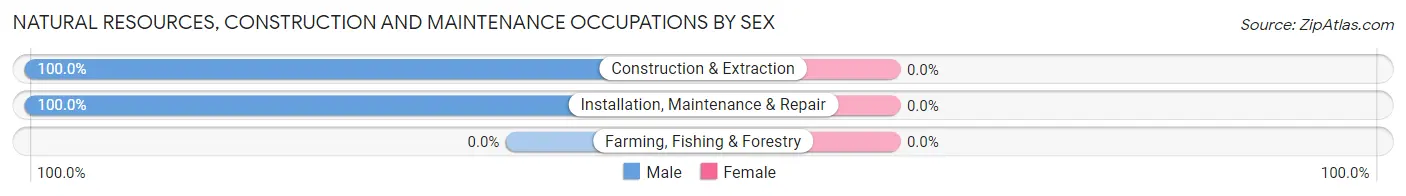
| Occupation | Male | Female |
| Farming, Fishing & Forestry | 0 (0.0%) | 0 (0.0%) |
| Construction & Extraction | 12 (100.0%) | 0 (0.0%) |
| Installation, Maintenance & Repair | 18 (100.0%) | 0 (0.0%) |
| Total (Category) | 30 (100.0%) | 0 (0.0%) |
| Total (Overall) | 90 (47.9%) | 98 (52.1%) |
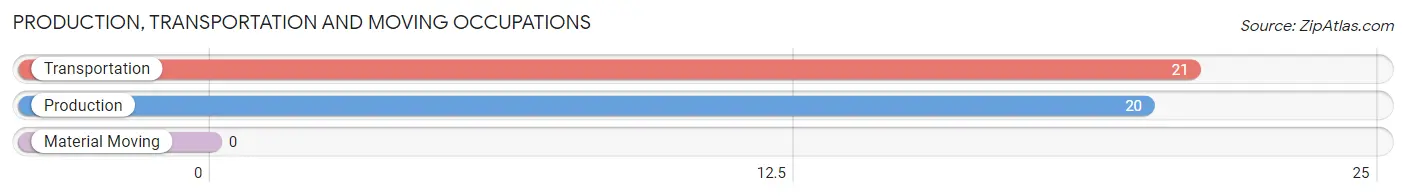
Production, Transportation and Moving Occupations
The most common Production, Transportation and Moving occupations in Jacksons Gap are Transportation (21 | 11.2%), and Production (20 | 10.6%).
Production, Transportation and Moving Occupations by Sex
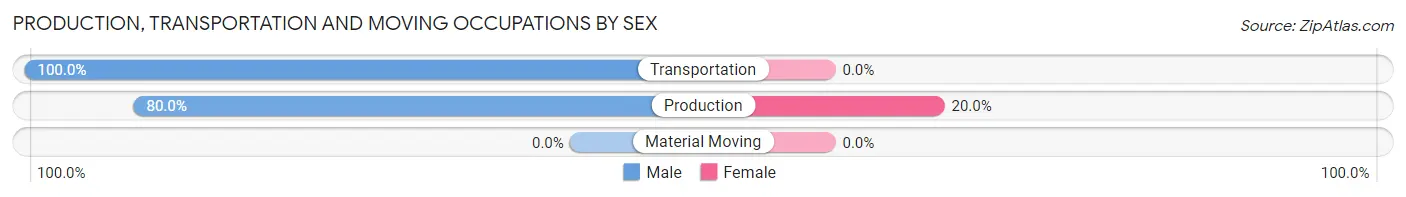
| Occupation | Male | Female |
| Production | 16 (80.0%) | 4 (20.0%) |
| Transportation | 21 (100.0%) | 0 (0.0%) |
| Material Moving | 0 (0.0%) | 0 (0.0%) |
| Total (Category) | 37 (90.2%) | 4 (9.8%) |
| Total (Overall) | 90 (47.9%) | 98 (52.1%) |
Employment Industries by Sex in Jacksons Gap
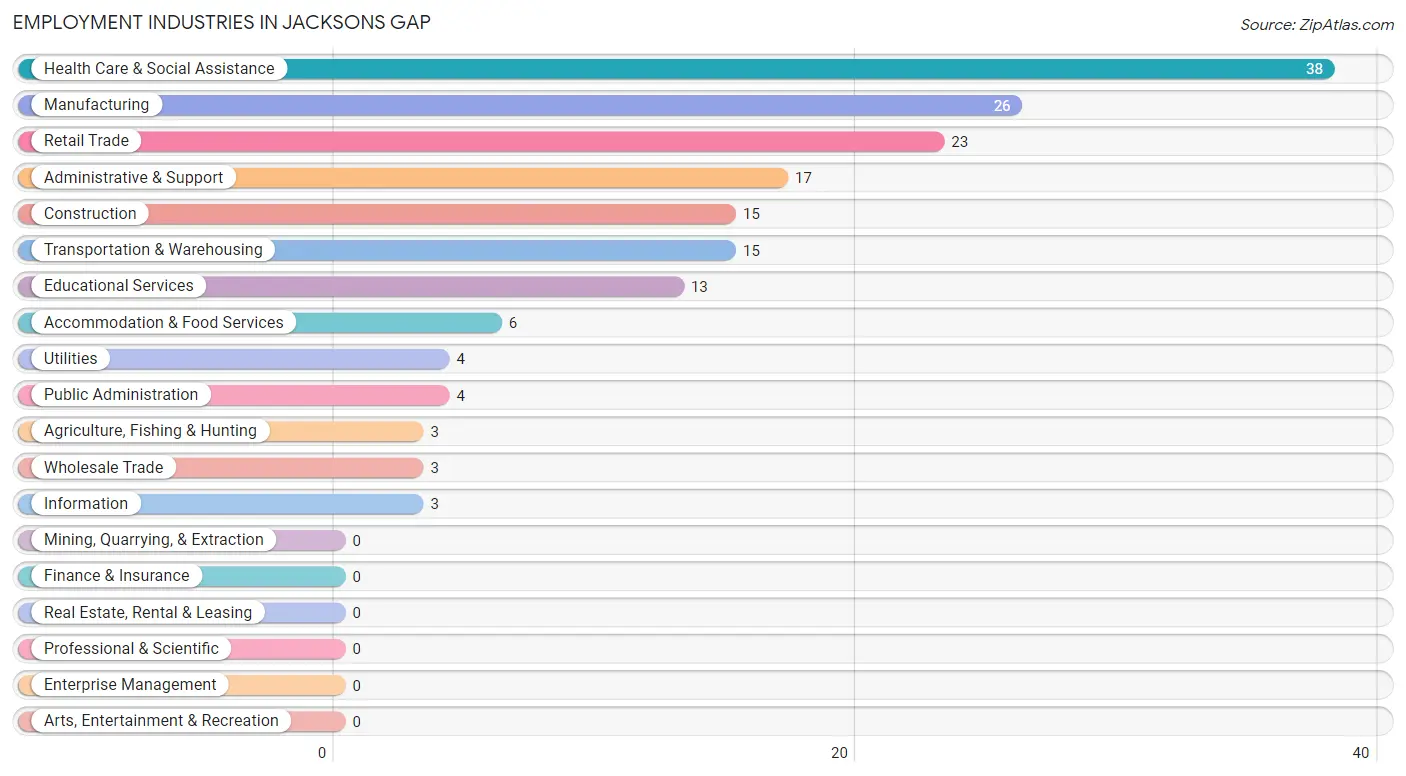
Employment Industries in Jacksons Gap
The major employment industries in Jacksons Gap include Health Care & Social Assistance (38 | 20.2%), Manufacturing (26 | 13.8%), Retail Trade (23 | 12.2%), Administrative & Support (17 | 9.0%), and Construction (15 | 8.0%).
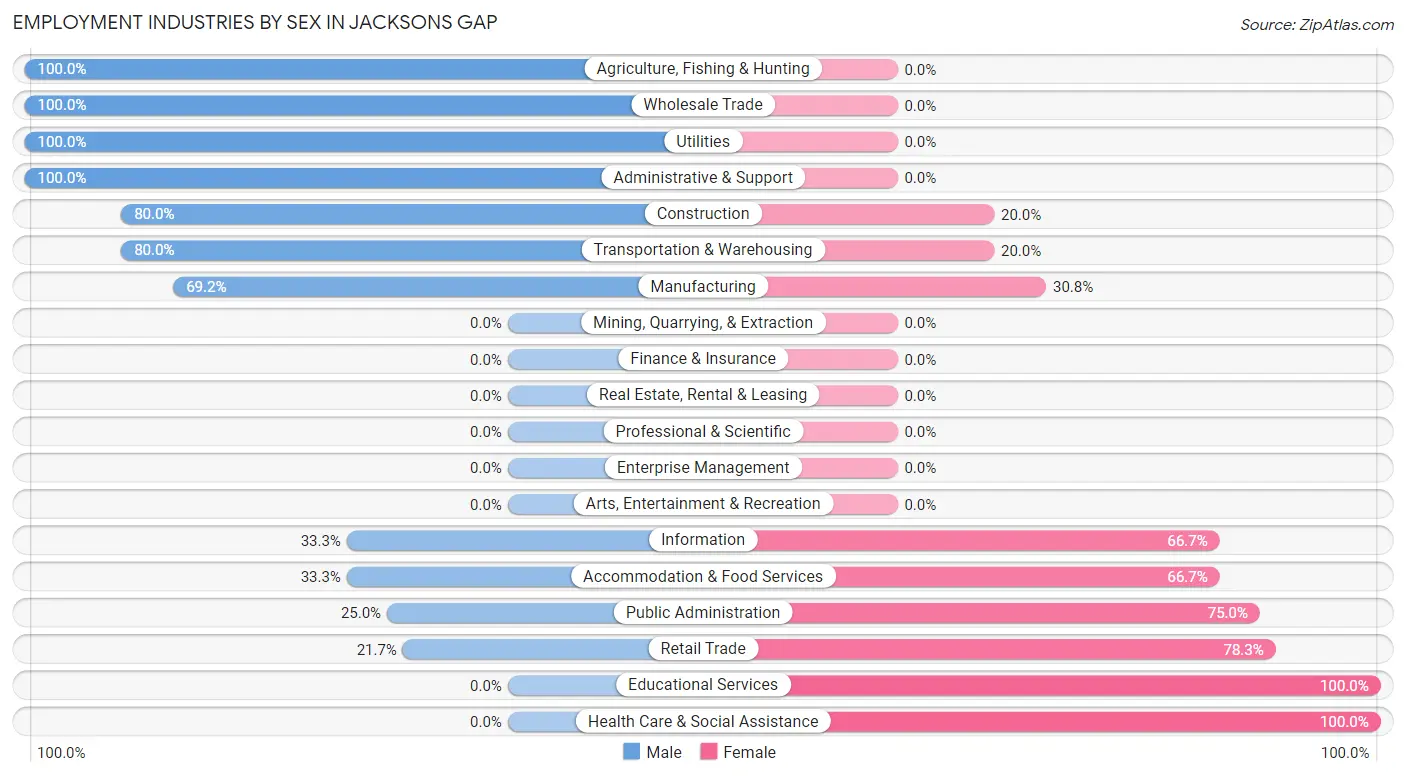
Employment Industries by Sex in Jacksons Gap
The Jacksons Gap industries that see more men than women are Agriculture, Fishing & Hunting (100.0%), Wholesale Trade (100.0%), and Utilities (100.0%), whereas the industries that tend to have a higher number of women are Educational Services (100.0%), Health Care & Social Assistance (100.0%), and Retail Trade (78.3%).
| Industry | Male | Female |
| Agriculture, Fishing & Hunting | 3 (100.0%) | 0 (0.0%) |
| Mining, Quarrying, & Extraction | 0 (0.0%) | 0 (0.0%) |
| Construction | 12 (80.0%) | 3 (20.0%) |
| Manufacturing | 18 (69.2%) | 8 (30.8%) |
| Wholesale Trade | 3 (100.0%) | 0 (0.0%) |
| Retail Trade | 5 (21.7%) | 18 (78.3%) |
| Transportation & Warehousing | 12 (80.0%) | 3 (20.0%) |
| Utilities | 4 (100.0%) | 0 (0.0%) |
| Information | 1 (33.3%) | 2 (66.7%) |
| Finance & Insurance | 0 (0.0%) | 0 (0.0%) |
| Real Estate, Rental & Leasing | 0 (0.0%) | 0 (0.0%) |
| Professional & Scientific | 0 (0.0%) | 0 (0.0%) |
| Enterprise Management | 0 (0.0%) | 0 (0.0%) |
| Administrative & Support | 17 (100.0%) | 0 (0.0%) |
| Educational Services | 0 (0.0%) | 13 (100.0%) |
| Health Care & Social Assistance | 0 (0.0%) | 38 (100.0%) |
| Arts, Entertainment & Recreation | 0 (0.0%) | 0 (0.0%) |
| Accommodation & Food Services | 2 (33.3%) | 4 (66.7%) |
| Public Administration | 1 (25.0%) | 3 (75.0%) |
| Total | 90 (47.9%) | 98 (52.1%) |
Education in Jacksons Gap
School Enrollment in Jacksons Gap
The most common levels of schooling among the 68 students in Jacksons Gap are college / undergraduate (19 | 27.9%), high school (17 | 25.0%), and kindergarten (16 | 23.5%).
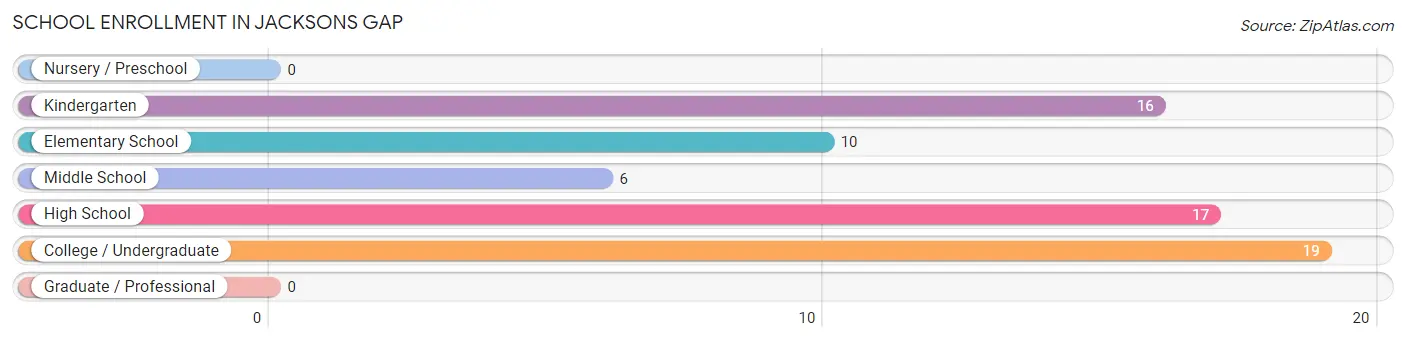
| School Level | # Students | % Students |
| Nursery / Preschool | 0 | 0.0% |
| Kindergarten | 16 | 23.5% |
| Elementary School | 10 | 14.7% |
| Middle School | 6 | 8.8% |
| High School | 17 | 25.0% |
| College / Undergraduate | 19 | 27.9% |
| Graduate / Professional | 0 | 0.0% |
| Total | 68 | 100.0% |
School Enrollment by Age by Funding Source in Jacksons Gap
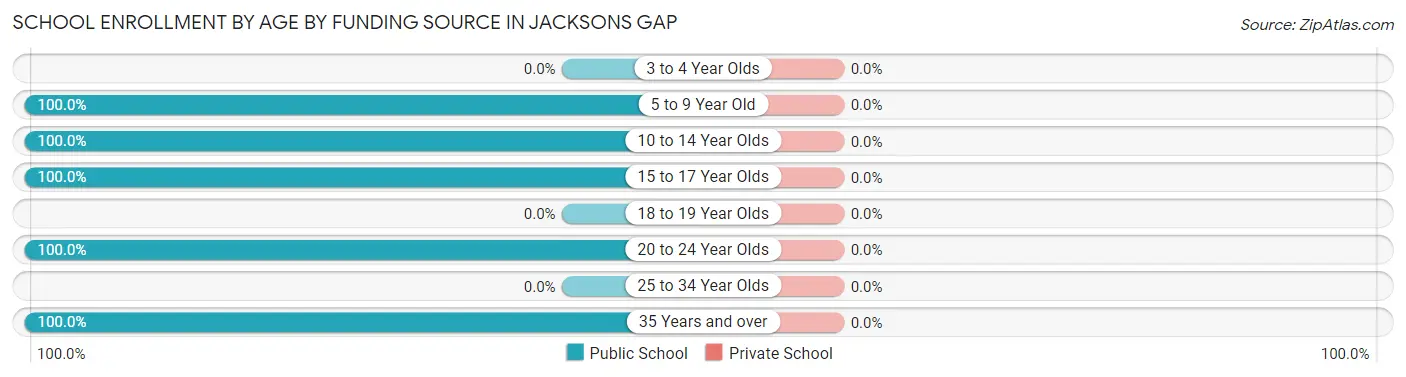
| Age Bracket | Public School | Private School |
| 3 to 4 Year Olds | 0 (0.0%) | 0 (0.0%) |
| 5 to 9 Year Old | 24 (100.0%) | 0 (0.0%) |
| 10 to 14 Year Olds | 8 (100.0%) | 0 (0.0%) |
| 15 to 17 Year Olds | 17 (100.0%) | 0 (0.0%) |
| 18 to 19 Year Olds | 0 (0.0%) | 0 (0.0%) |
| 20 to 24 Year Olds | 14 (100.0%) | 0 (0.0%) |
| 25 to 34 Year Olds | 0 (0.0%) | 0 (0.0%) |
| 35 Years and over | 5 (100.0%) | 0 (0.0%) |
| Total | 68 (100.0%) | 0 (0.0%) |
Educational Attainment by Field of Study in Jacksons Gap
Business (7 | 21.2%), education (7 | 21.2%), arts & humanities (7 | 21.2%), computers & mathematics (5 | 15.1%), and science & technology (5 | 15.1%) are the most common fields of study among 33 individuals in Jacksons Gap who have obtained a bachelor's degree or higher.
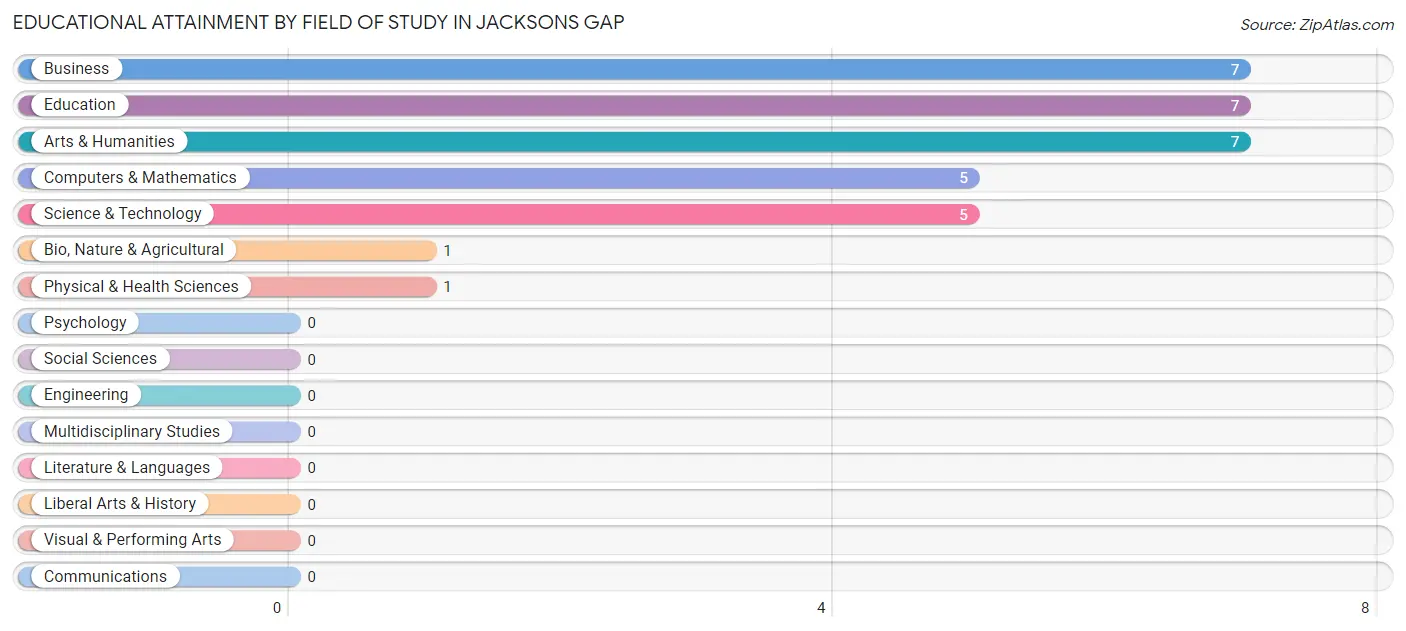
| Field of Study | # Graduates | % Graduates |
| Computers & Mathematics | 5 | 15.1% |
| Bio, Nature & Agricultural | 1 | 3.0% |
| Physical & Health Sciences | 1 | 3.0% |
| Psychology | 0 | 0.0% |
| Social Sciences | 0 | 0.0% |
| Engineering | 0 | 0.0% |
| Multidisciplinary Studies | 0 | 0.0% |
| Science & Technology | 5 | 15.1% |
| Business | 7 | 21.2% |
| Education | 7 | 21.2% |
| Literature & Languages | 0 | 0.0% |
| Liberal Arts & History | 0 | 0.0% |
| Visual & Performing Arts | 0 | 0.0% |
| Communications | 0 | 0.0% |
| Arts & Humanities | 7 | 21.2% |
| Total | 33 | 100.0% |
Transportation & Commute in Jacksons Gap
Vehicle Availability by Sex in Jacksons Gap
The most prevalent vehicle ownership categories in Jacksons Gap are males with 5 or more vehicles (30, accounting for 33.3%) and females with 5 or more vehicles (12, making up 31.9%).
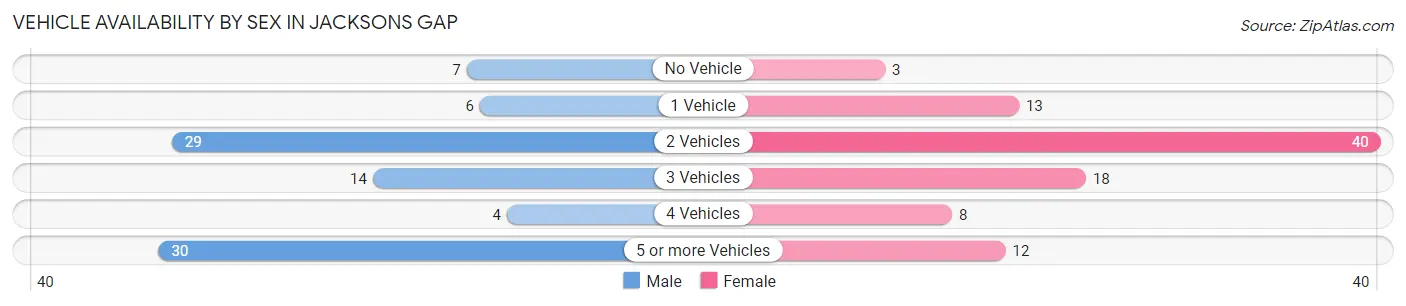
| Vehicles Available | Male | Female |
| No Vehicle | 7 (7.8%) | 3 (3.2%) |
| 1 Vehicle | 6 (6.7%) | 13 (13.8%) |
| 2 Vehicles | 29 (32.2%) | 40 (42.5%) |
| 3 Vehicles | 14 (15.6%) | 18 (19.2%) |
| 4 Vehicles | 4 (4.4%) | 8 (8.5%) |
| 5 or more Vehicles | 30 (33.3%) | 12 (12.8%) |
| Total | 90 (100.0%) | 94 (100.0%) |
Commute Time in Jacksons Gap
The most frequently occuring commute durations in Jacksons Gap are 15 to 19 minutes (57 commuters, 31.5%), 10 to 14 minutes (43 commuters, 23.8%), and 45 to 59 minutes (17 commuters, 9.4%).
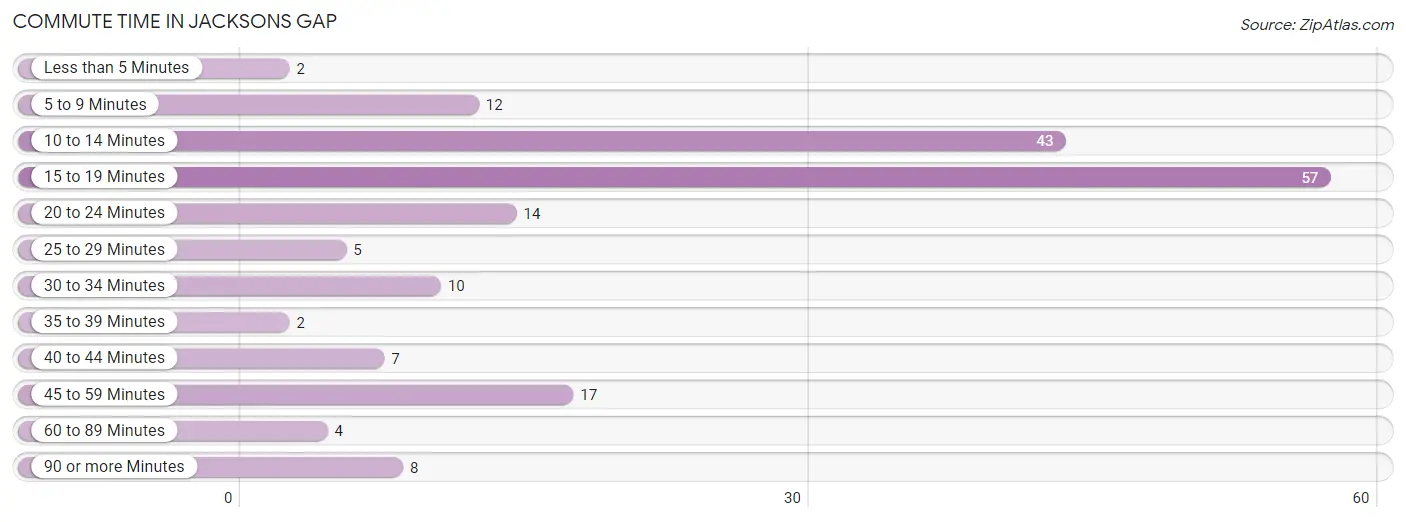
| Commute Time | # Commuters | % Commuters |
| Less than 5 Minutes | 2 | 1.1% |
| 5 to 9 Minutes | 12 | 6.6% |
| 10 to 14 Minutes | 43 | 23.8% |
| 15 to 19 Minutes | 57 | 31.5% |
| 20 to 24 Minutes | 14 | 7.7% |
| 25 to 29 Minutes | 5 | 2.8% |
| 30 to 34 Minutes | 10 | 5.5% |
| 35 to 39 Minutes | 2 | 1.1% |
| 40 to 44 Minutes | 7 | 3.9% |
| 45 to 59 Minutes | 17 | 9.4% |
| 60 to 89 Minutes | 4 | 2.2% |
| 90 or more Minutes | 8 | 4.4% |
Commute Time by Sex in Jacksons Gap
The most common commute times in Jacksons Gap are 15 to 19 minutes (18 commuters, 20.0%) for males and 15 to 19 minutes (39 commuters, 42.9%) for females.
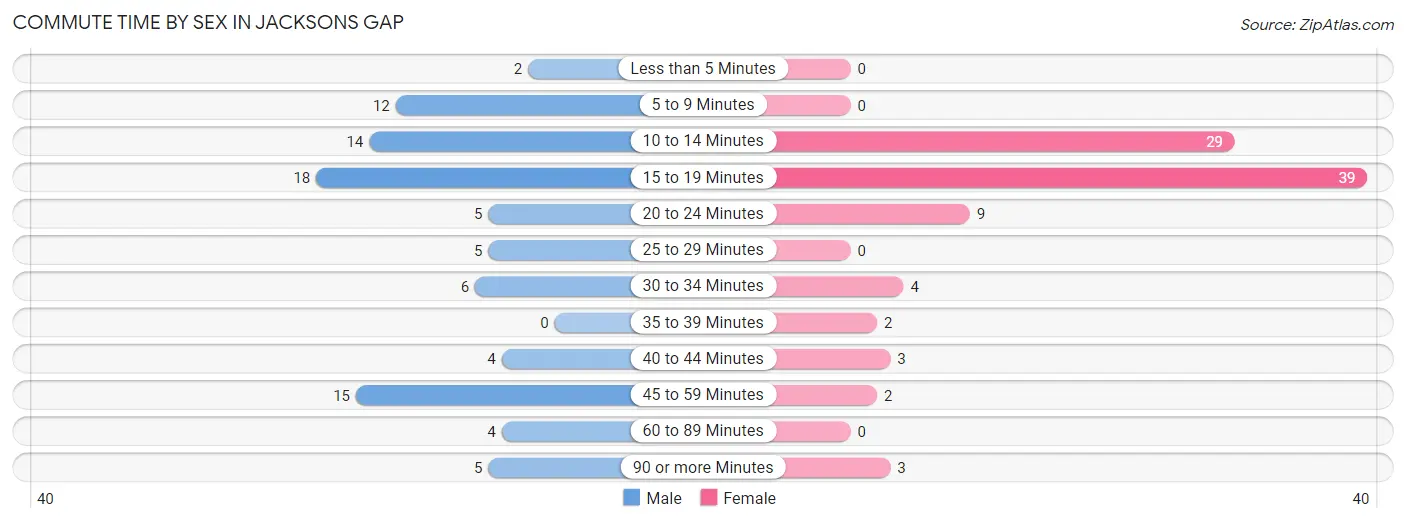
| Commute Time | Male | Female |
| Less than 5 Minutes | 2 (2.2%) | 0 (0.0%) |
| 5 to 9 Minutes | 12 (13.3%) | 0 (0.0%) |
| 10 to 14 Minutes | 14 (15.6%) | 29 (31.9%) |
| 15 to 19 Minutes | 18 (20.0%) | 39 (42.9%) |
| 20 to 24 Minutes | 5 (5.6%) | 9 (9.9%) |
| 25 to 29 Minutes | 5 (5.6%) | 0 (0.0%) |
| 30 to 34 Minutes | 6 (6.7%) | 4 (4.4%) |
| 35 to 39 Minutes | 0 (0.0%) | 2 (2.2%) |
| 40 to 44 Minutes | 4 (4.4%) | 3 (3.3%) |
| 45 to 59 Minutes | 15 (16.7%) | 2 (2.2%) |
| 60 to 89 Minutes | 4 (4.4%) | 0 (0.0%) |
| 90 or more Minutes | 5 (5.6%) | 3 (3.3%) |
Time of Departure to Work by Sex in Jacksons Gap
The most frequent times of departure to work in Jacksons Gap are 12:00 AM to 4:59 AM (22, 24.4%) for males and 4:00 PM to 11:59 PM (19, 20.9%) for females.
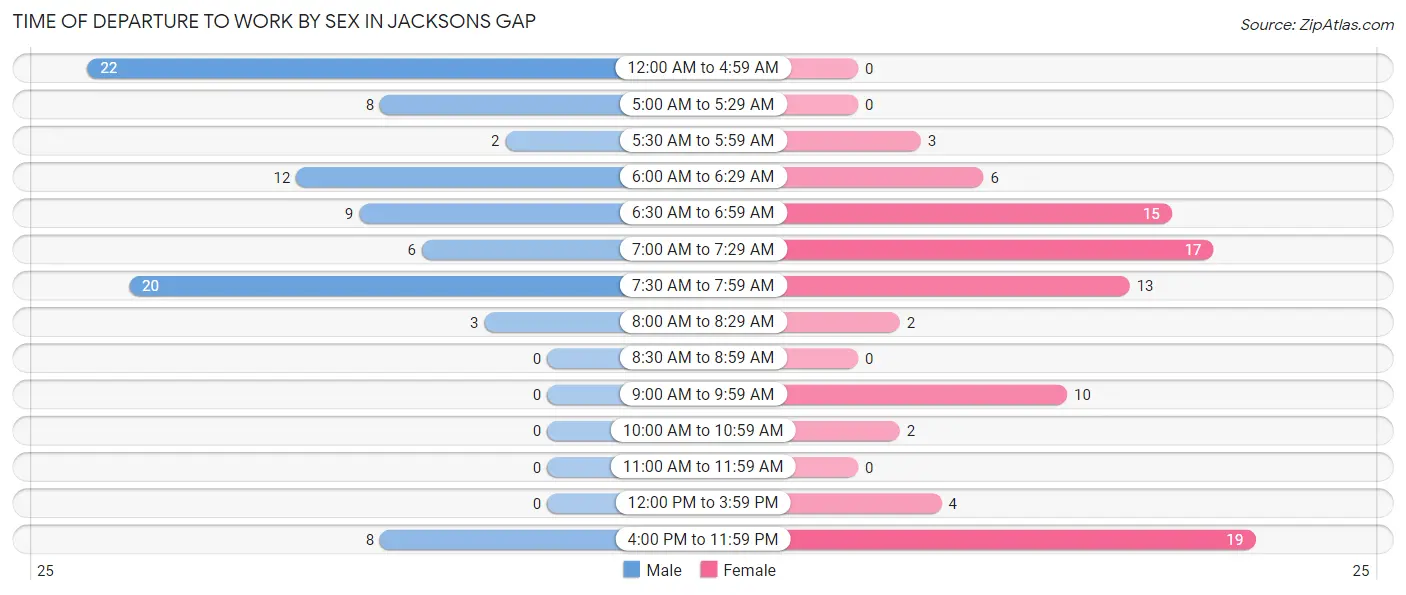
| Time of Departure | Male | Female |
| 12:00 AM to 4:59 AM | 22 (24.4%) | 0 (0.0%) |
| 5:00 AM to 5:29 AM | 8 (8.9%) | 0 (0.0%) |
| 5:30 AM to 5:59 AM | 2 (2.2%) | 3 (3.3%) |
| 6:00 AM to 6:29 AM | 12 (13.3%) | 6 (6.6%) |
| 6:30 AM to 6:59 AM | 9 (10.0%) | 15 (16.5%) |
| 7:00 AM to 7:29 AM | 6 (6.7%) | 17 (18.7%) |
| 7:30 AM to 7:59 AM | 20 (22.2%) | 13 (14.3%) |
| 8:00 AM to 8:29 AM | 3 (3.3%) | 2 (2.2%) |
| 8:30 AM to 8:59 AM | 0 (0.0%) | 0 (0.0%) |
| 9:00 AM to 9:59 AM | 0 (0.0%) | 10 (11.0%) |
| 10:00 AM to 10:59 AM | 0 (0.0%) | 2 (2.2%) |
| 11:00 AM to 11:59 AM | 0 (0.0%) | 0 (0.0%) |
| 12:00 PM to 3:59 PM | 0 (0.0%) | 4 (4.4%) |
| 4:00 PM to 11:59 PM | 8 (8.9%) | 19 (20.9%) |
| Total | 90 (100.0%) | 91 (100.0%) |
Housing Occupancy in Jacksons Gap
Occupancy by Ownership in Jacksons Gap
Of the total 213 dwellings in Jacksons Gap, owner-occupied units account for 173 (81.2%), while renter-occupied units make up 40 (18.8%).
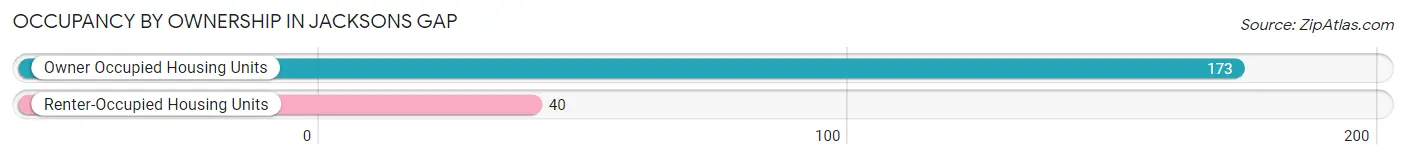
| Occupancy | # Housing Units | % Housing Units |
| Owner Occupied Housing Units | 173 | 81.2% |
| Renter-Occupied Housing Units | 40 | 18.8% |
| Total Occupied Housing Units | 213 | 100.0% |
Occupancy by Household Size in Jacksons Gap
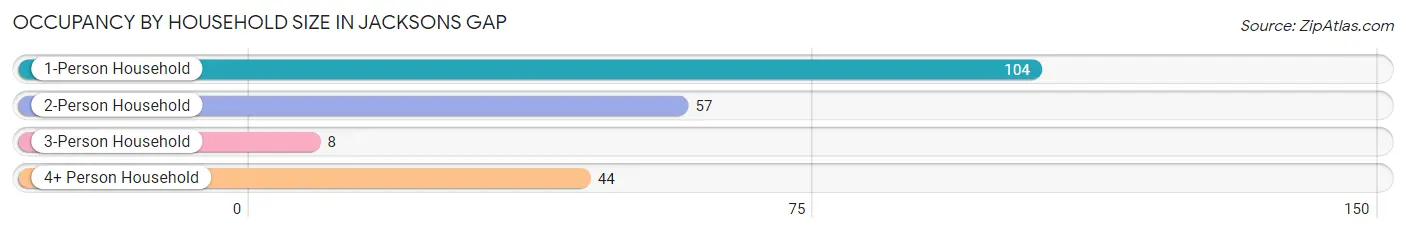
| Household Size | # Housing Units | % Housing Units |
| 1-Person Household | 104 | 48.8% |
| 2-Person Household | 57 | 26.8% |
| 3-Person Household | 8 | 3.8% |
| 4+ Person Household | 44 | 20.7% |
| Total Housing Units | 213 | 100.0% |
Occupancy by Ownership by Household Size in Jacksons Gap
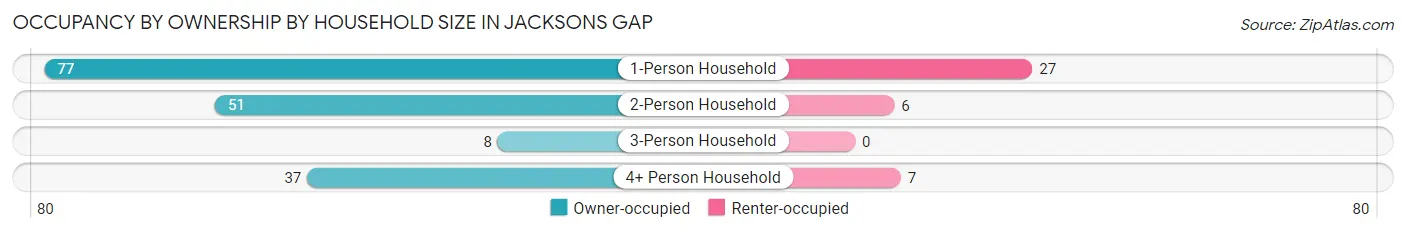
| Household Size | Owner-occupied | Renter-occupied |
| 1-Person Household | 77 (74.0%) | 27 (26.0%) |
| 2-Person Household | 51 (89.5%) | 6 (10.5%) |
| 3-Person Household | 8 (100.0%) | 0 (0.0%) |
| 4+ Person Household | 37 (84.1%) | 7 (15.9%) |
| Total Housing Units | 173 (81.2%) | 40 (18.8%) |
Occupancy by Educational Attainment in Jacksons Gap
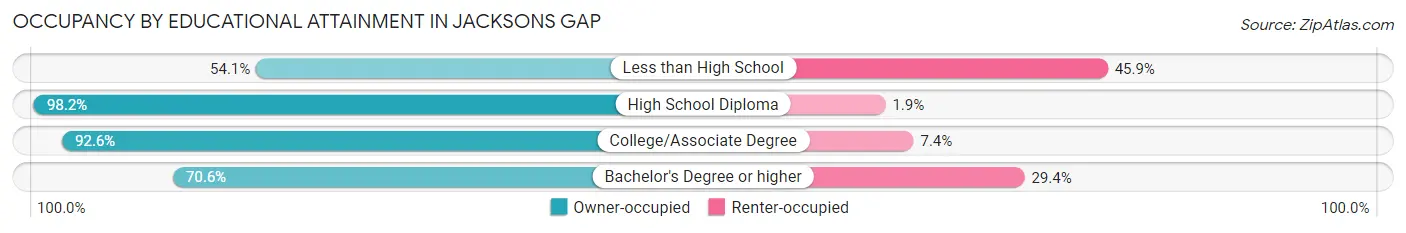
| Household Size | Owner-occupied | Renter-occupied |
| Less than High School | 33 (54.1%) | 28 (45.9%) |
| High School Diploma | 53 (98.2%) | 1 (1.8%) |
| College/Associate Degree | 75 (92.6%) | 6 (7.4%) |
| Bachelor's Degree or higher | 12 (70.6%) | 5 (29.4%) |
Occupancy by Age of Householder in Jacksons Gap
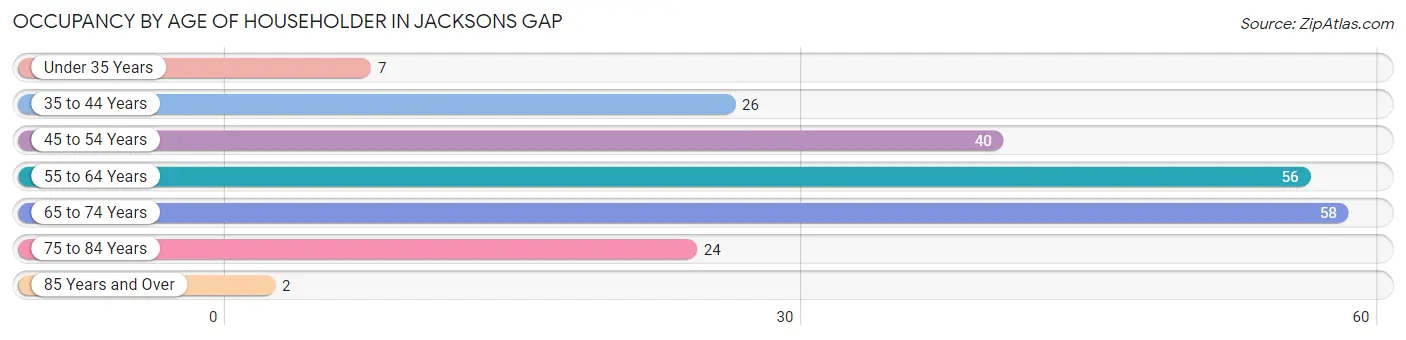
| Age Bracket | # Households | % Households |
| Under 35 Years | 7 | 3.3% |
| 35 to 44 Years | 26 | 12.2% |
| 45 to 54 Years | 40 | 18.8% |
| 55 to 64 Years | 56 | 26.3% |
| 65 to 74 Years | 58 | 27.2% |
| 75 to 84 Years | 24 | 11.3% |
| 85 Years and Over | 2 | 0.9% |
| Total | 213 | 100.0% |
Housing Finances in Jacksons Gap
Median Income by Occupancy in Jacksons Gap
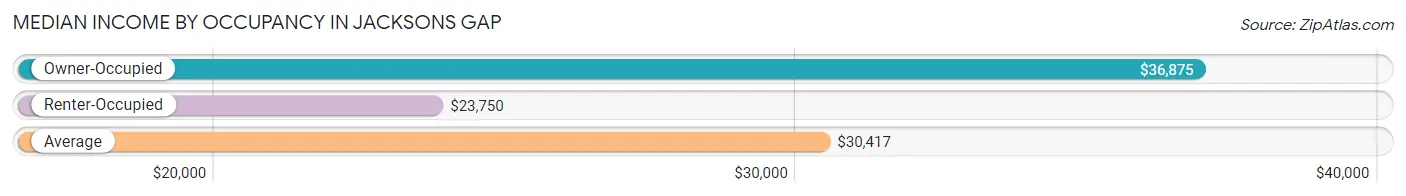
| Occupancy Type | # Households | Median Income |
| Owner-Occupied | 173 (81.2%) | $36,875 |
| Renter-Occupied | 40 (18.8%) | $23,750 |
| Average | 213 (100.0%) | $30,417 |
Occupancy by Householder Income Bracket in Jacksons Gap
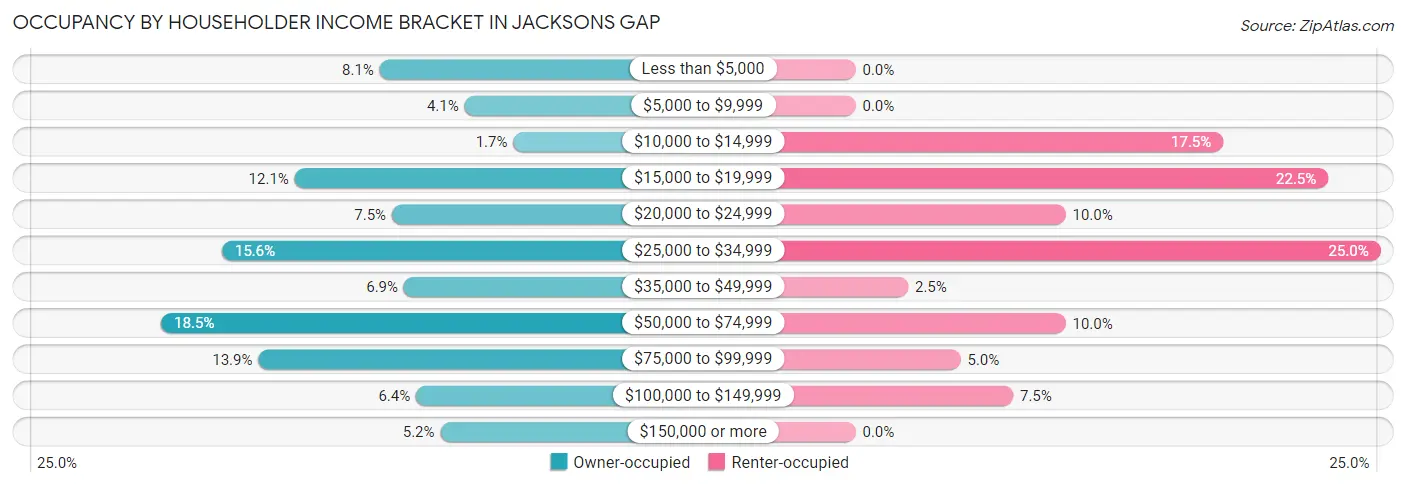
| Income Bracket | Owner-occupied | Renter-occupied |
| Less than $5,000 | 14 (8.1%) | 0 (0.0%) |
| $5,000 to $9,999 | 7 (4.1%) | 0 (0.0%) |
| $10,000 to $14,999 | 3 (1.7%) | 7 (17.5%) |
| $15,000 to $19,999 | 21 (12.1%) | 9 (22.5%) |
| $20,000 to $24,999 | 13 (7.5%) | 4 (10.0%) |
| $25,000 to $34,999 | 27 (15.6%) | 10 (25.0%) |
| $35,000 to $49,999 | 12 (6.9%) | 1 (2.5%) |
| $50,000 to $74,999 | 32 (18.5%) | 4 (10.0%) |
| $75,000 to $99,999 | 24 (13.9%) | 2 (5.0%) |
| $100,000 to $149,999 | 11 (6.4%) | 3 (7.5%) |
| $150,000 or more | 9 (5.2%) | 0 (0.0%) |
| Total | 173 (100.0%) | 40 (100.0%) |
Monthly Housing Cost Tiers in Jacksons Gap
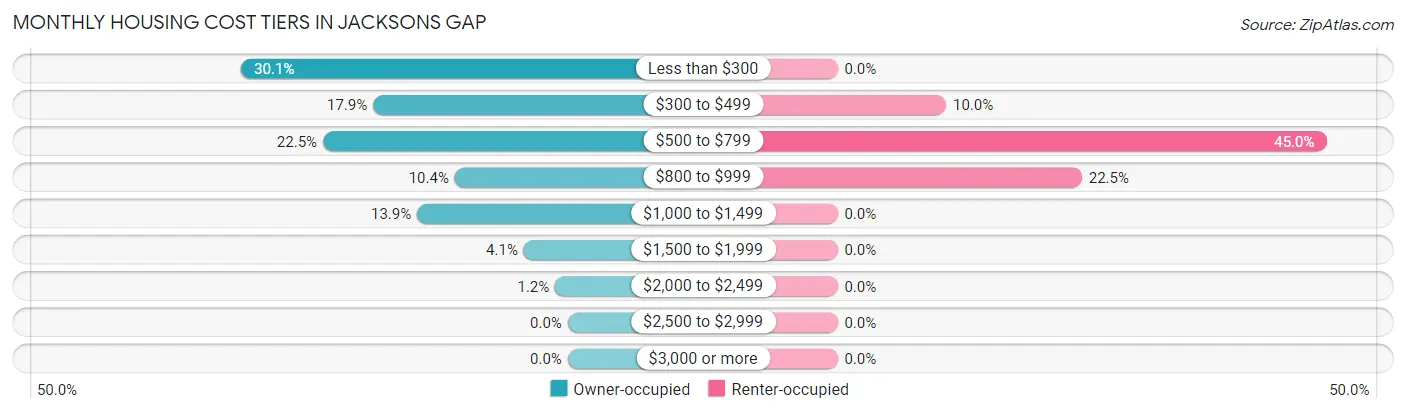
| Monthly Cost | Owner-occupied | Renter-occupied |
| Less than $300 | 52 (30.1%) | 0 (0.0%) |
| $300 to $499 | 31 (17.9%) | 4 (10.0%) |
| $500 to $799 | 39 (22.5%) | 18 (45.0%) |
| $800 to $999 | 18 (10.4%) | 9 (22.5%) |
| $1,000 to $1,499 | 24 (13.9%) | 0 (0.0%) |
| $1,500 to $1,999 | 7 (4.1%) | 0 (0.0%) |
| $2,000 to $2,499 | 2 (1.2%) | 0 (0.0%) |
| $2,500 to $2,999 | 0 (0.0%) | 0 (0.0%) |
| $3,000 or more | 0 (0.0%) | 0 (0.0%) |
| Total | 173 (100.0%) | 40 (100.0%) |
Physical Housing Characteristics in Jacksons Gap
Housing Structures in Jacksons Gap
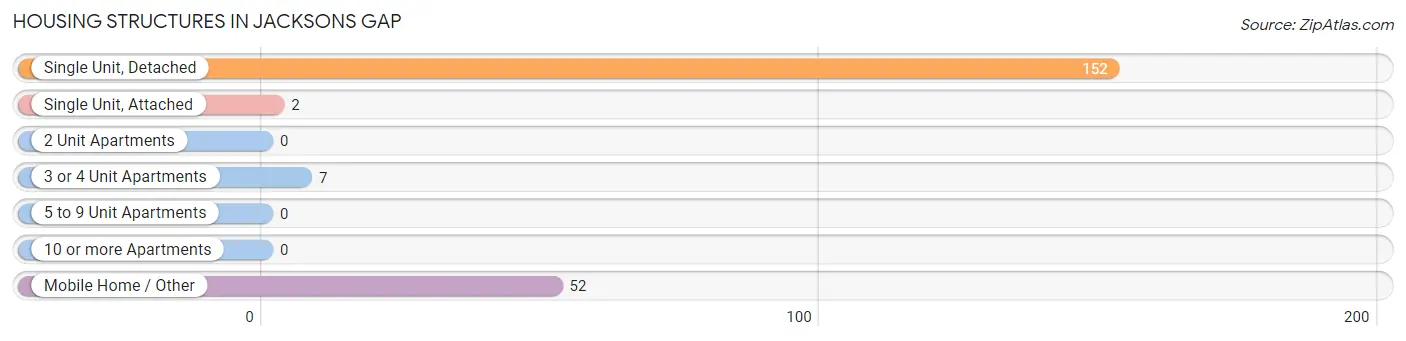
| Structure Type | # Housing Units | % Housing Units |
| Single Unit, Detached | 152 | 71.4% |
| Single Unit, Attached | 2 | 0.9% |
| 2 Unit Apartments | 0 | 0.0% |
| 3 or 4 Unit Apartments | 7 | 3.3% |
| 5 to 9 Unit Apartments | 0 | 0.0% |
| 10 or more Apartments | 0 | 0.0% |
| Mobile Home / Other | 52 | 24.4% |
| Total | 213 | 100.0% |
Housing Structures by Occupancy in Jacksons Gap
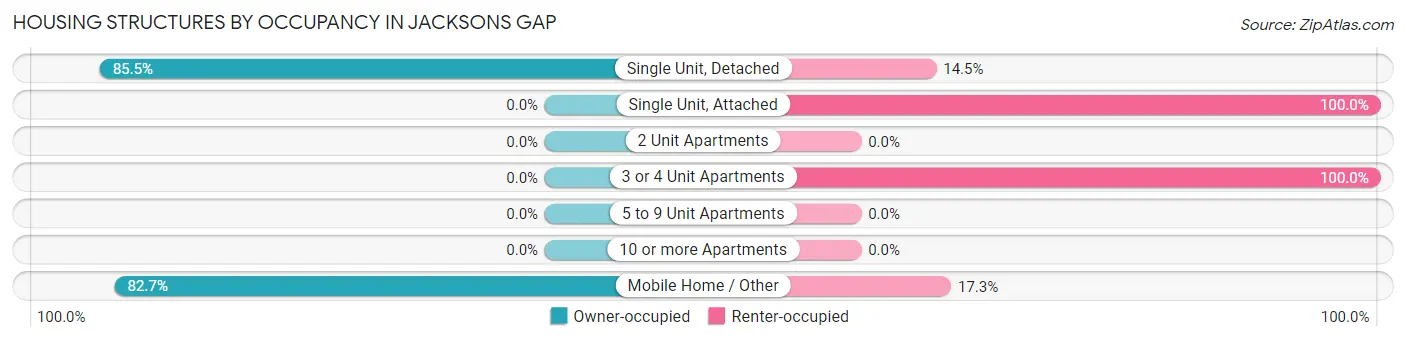
| Structure Type | Owner-occupied | Renter-occupied |
| Single Unit, Detached | 130 (85.5%) | 22 (14.5%) |
| Single Unit, Attached | 0 (0.0%) | 2 (100.0%) |
| 2 Unit Apartments | 0 (0.0%) | 0 (0.0%) |
| 3 or 4 Unit Apartments | 0 (0.0%) | 7 (100.0%) |
| 5 to 9 Unit Apartments | 0 (0.0%) | 0 (0.0%) |
| 10 or more Apartments | 0 (0.0%) | 0 (0.0%) |
| Mobile Home / Other | 43 (82.7%) | 9 (17.3%) |
| Total | 173 (81.2%) | 40 (18.8%) |
Housing Structures by Number of Rooms in Jacksons Gap
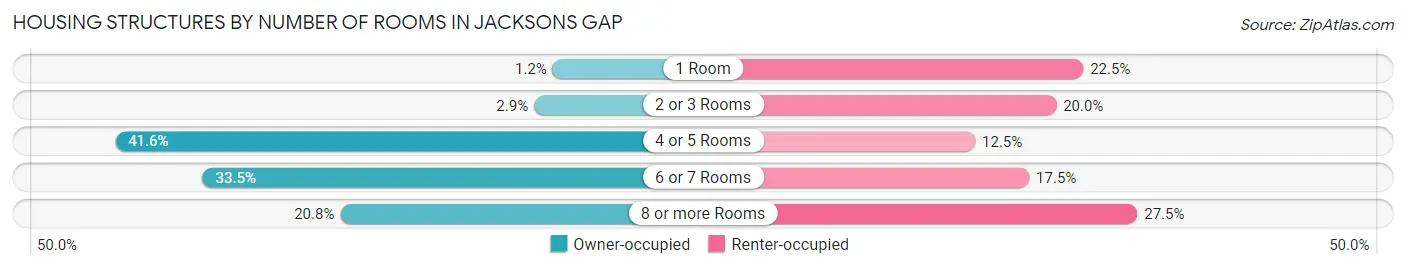
| Number of Rooms | Owner-occupied | Renter-occupied |
| 1 Room | 2 (1.2%) | 9 (22.5%) |
| 2 or 3 Rooms | 5 (2.9%) | 8 (20.0%) |
| 4 or 5 Rooms | 72 (41.6%) | 5 (12.5%) |
| 6 or 7 Rooms | 58 (33.5%) | 7 (17.5%) |
| 8 or more Rooms | 36 (20.8%) | 11 (27.5%) |
| Total | 173 (100.0%) | 40 (100.0%) |
Housing Structure by Heating Type in Jacksons Gap
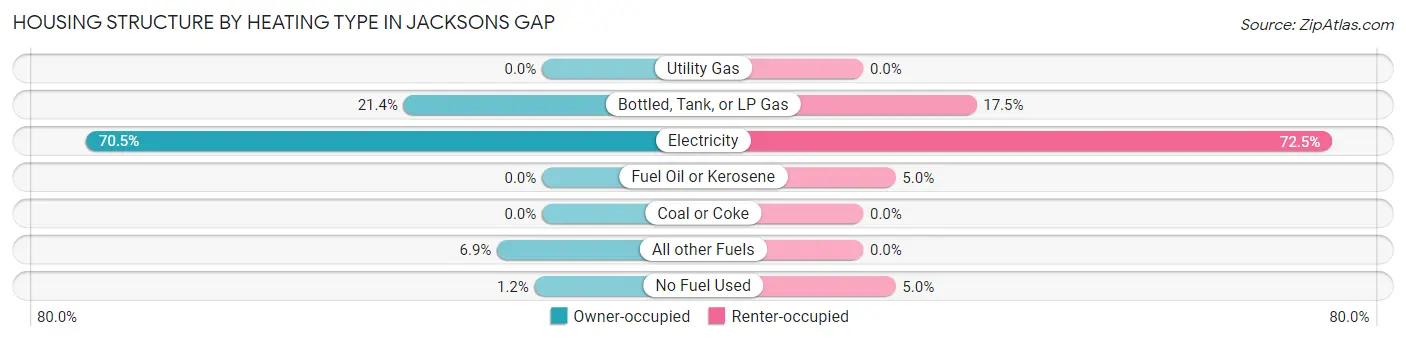
| Heating Type | Owner-occupied | Renter-occupied |
| Utility Gas | 0 (0.0%) | 0 (0.0%) |
| Bottled, Tank, or LP Gas | 37 (21.4%) | 7 (17.5%) |
| Electricity | 122 (70.5%) | 29 (72.5%) |
| Fuel Oil or Kerosene | 0 (0.0%) | 2 (5.0%) |
| Coal or Coke | 0 (0.0%) | 0 (0.0%) |
| All other Fuels | 12 (6.9%) | 0 (0.0%) |
| No Fuel Used | 2 (1.2%) | 2 (5.0%) |
| Total | 173 (100.0%) | 40 (100.0%) |
Household Vehicle Usage in Jacksons Gap
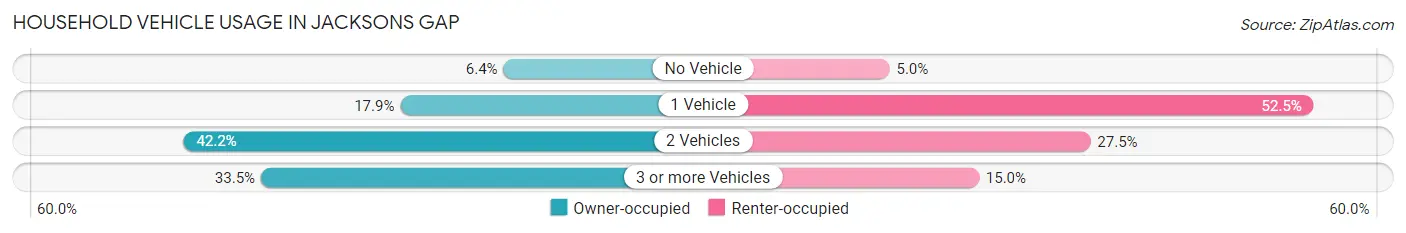
| Vehicles per Household | Owner-occupied | Renter-occupied |
| No Vehicle | 11 (6.4%) | 2 (5.0%) |
| 1 Vehicle | 31 (17.9%) | 21 (52.5%) |
| 2 Vehicles | 73 (42.2%) | 11 (27.5%) |
| 3 or more Vehicles | 58 (33.5%) | 6 (15.0%) |
| Total | 173 (100.0%) | 40 (100.0%) |
Real Estate & Mortgages in Jacksons Gap
Real Estate and Mortgage Overview in Jacksons Gap
| Characteristic | Without Mortgage | With Mortgage |
| Housing Units | 103 | 70 |
| Median Property Value | $59,300 | $96,400 |
| Median Household Income | $28,482 | $6 |
| Monthly Housing Costs | $298 | $0 |
| Real Estate Taxes | $275 | $24 |
Property Value by Mortgage Status in Jacksons Gap
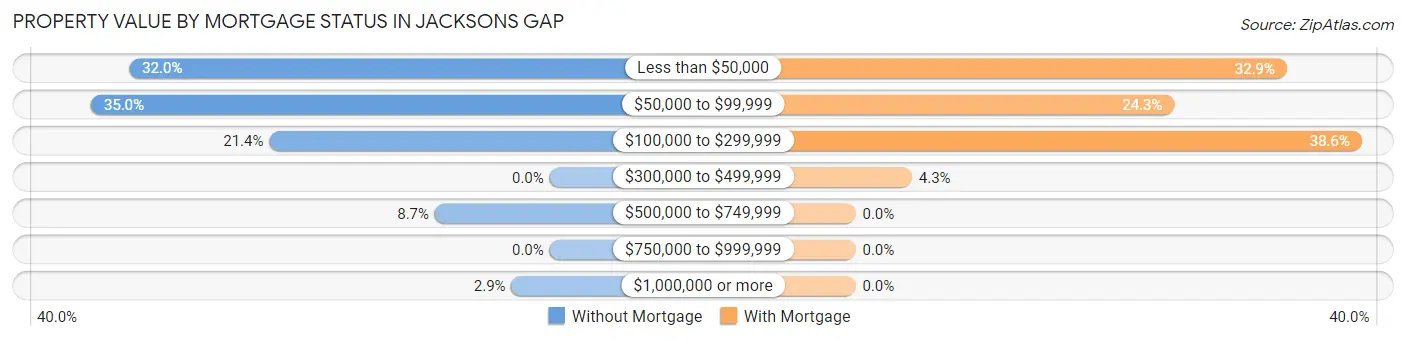
| Property Value | Without Mortgage | With Mortgage |
| Less than $50,000 | 33 (32.0%) | 23 (32.9%) |
| $50,000 to $99,999 | 36 (34.9%) | 17 (24.3%) |
| $100,000 to $299,999 | 22 (21.4%) | 27 (38.6%) |
| $300,000 to $499,999 | 0 (0.0%) | 3 (4.3%) |
| $500,000 to $749,999 | 9 (8.7%) | 0 (0.0%) |
| $750,000 to $999,999 | 0 (0.0%) | 0 (0.0%) |
| $1,000,000 or more | 3 (2.9%) | 0 (0.0%) |
| Total | 103 (100.0%) | 70 (100.0%) |
Household Income by Mortgage Status in Jacksons Gap
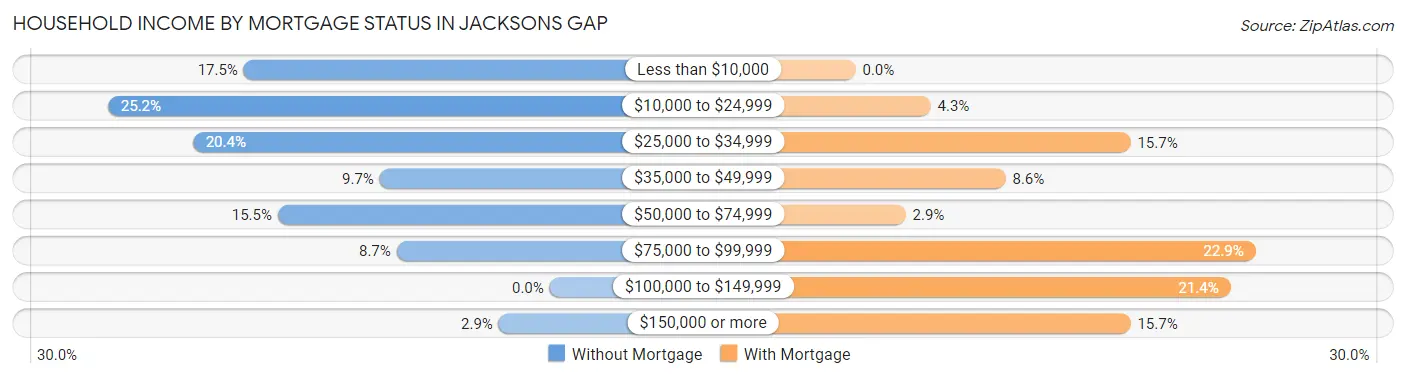
| Household Income | Without Mortgage | With Mortgage |
| Less than $10,000 | 18 (17.5%) | 0 (0.0%) |
| $10,000 to $24,999 | 26 (25.2%) | 3 (4.3%) |
| $25,000 to $34,999 | 21 (20.4%) | 11 (15.7%) |
| $35,000 to $49,999 | 10 (9.7%) | 6 (8.6%) |
| $50,000 to $74,999 | 16 (15.5%) | 2 (2.9%) |
| $75,000 to $99,999 | 9 (8.7%) | 16 (22.9%) |
| $100,000 to $149,999 | 0 (0.0%) | 15 (21.4%) |
| $150,000 or more | 3 (2.9%) | 11 (15.7%) |
| Total | 103 (100.0%) | 70 (100.0%) |
Property Value to Household Income Ratio in Jacksons Gap
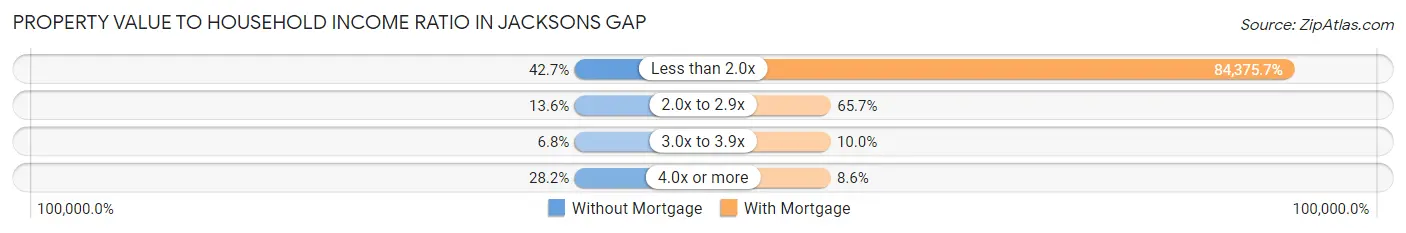
| Value-to-Income Ratio | Without Mortgage | With Mortgage |
| Less than 2.0x | 44 (42.7%) | 59,063 (84,375.7%) |
| 2.0x to 2.9x | 14 (13.6%) | 46 (65.7%) |
| 3.0x to 3.9x | 7 (6.8%) | 7 (10.0%) |
| 4.0x or more | 29 (28.2%) | 6 (8.6%) |
| Total | 103 (100.0%) | 70 (100.0%) |
Real Estate Taxes by Mortgage Status in Jacksons Gap
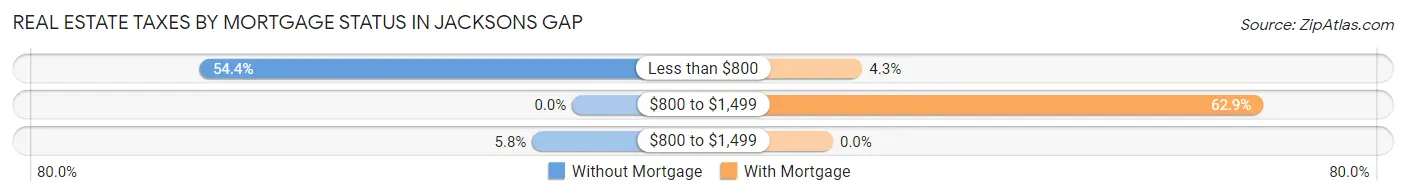
| Property Taxes | Without Mortgage | With Mortgage |
| Less than $800 | 56 (54.4%) | 3 (4.3%) |
| $800 to $1,499 | 0 (0.0%) | 44 (62.9%) |
| $800 to $1,499 | 6 (5.8%) | 0 (0.0%) |
| Total | 103 (100.0%) | 70 (100.0%) |
Health & Disability in Jacksons Gap
Health Insurance Coverage by Age in Jacksons Gap
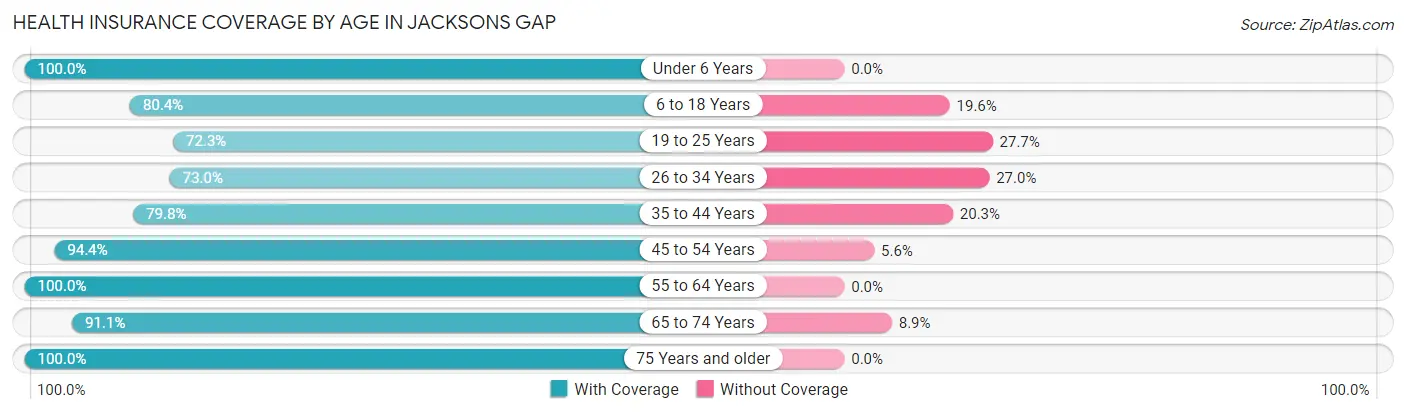
| Age Bracket | With Coverage | Without Coverage |
| Under 6 Years | 24 (100.0%) | 0 (0.0%) |
| 6 to 18 Years | 45 (80.4%) | 11 (19.6%) |
| 19 to 25 Years | 34 (72.3%) | 13 (27.7%) |
| 26 to 34 Years | 54 (73.0%) | 20 (27.0%) |
| 35 to 44 Years | 63 (79.7%) | 16 (20.3%) |
| 45 to 54 Years | 51 (94.4%) | 3 (5.6%) |
| 55 to 64 Years | 87 (100.0%) | 0 (0.0%) |
| 65 to 74 Years | 72 (91.1%) | 7 (8.9%) |
| 75 Years and older | 37 (100.0%) | 0 (0.0%) |
| Total | 467 (87.0%) | 70 (13.0%) |
Health Insurance Coverage by Citizenship Status in Jacksons Gap
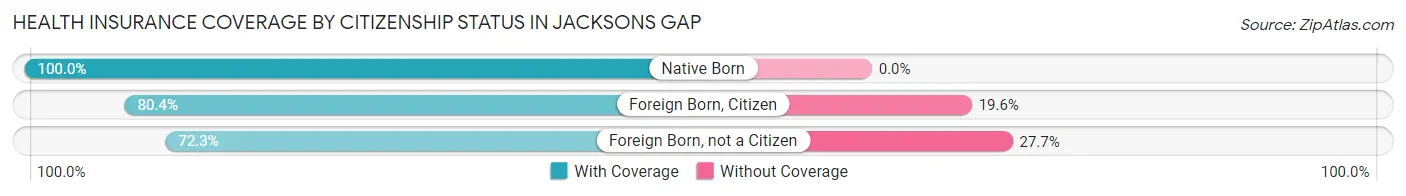
| Citizenship Status | With Coverage | Without Coverage |
| Native Born | 24 (100.0%) | 0 (0.0%) |
| Foreign Born, Citizen | 45 (80.4%) | 11 (19.6%) |
| Foreign Born, not a Citizen | 34 (72.3%) | 13 (27.7%) |
Health Insurance Coverage by Household Income in Jacksons Gap
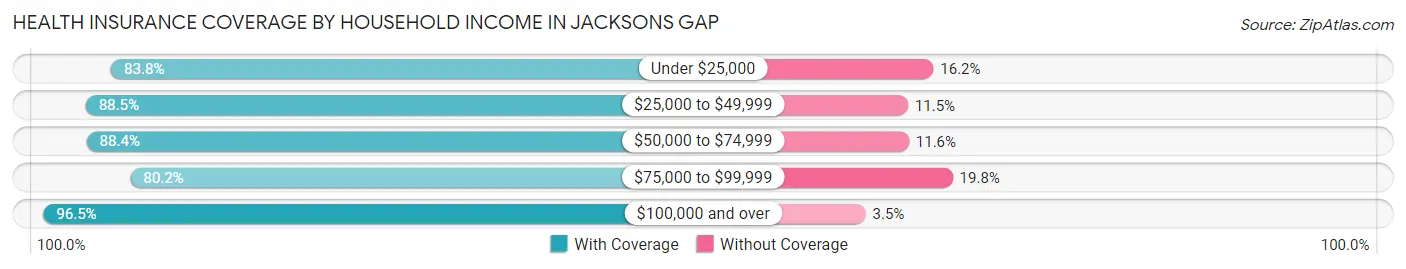
| Household Income | With Coverage | Without Coverage |
| Under $25,000 | 93 (83.8%) | 18 (16.2%) |
| $25,000 to $49,999 | 85 (88.5%) | 11 (11.5%) |
| $50,000 to $74,999 | 114 (88.4%) | 15 (11.6%) |
| $75,000 to $99,999 | 93 (80.2%) | 23 (19.8%) |
| $100,000 and over | 82 (96.5%) | 3 (3.5%) |
Public vs Private Health Insurance Coverage by Age in Jacksons Gap
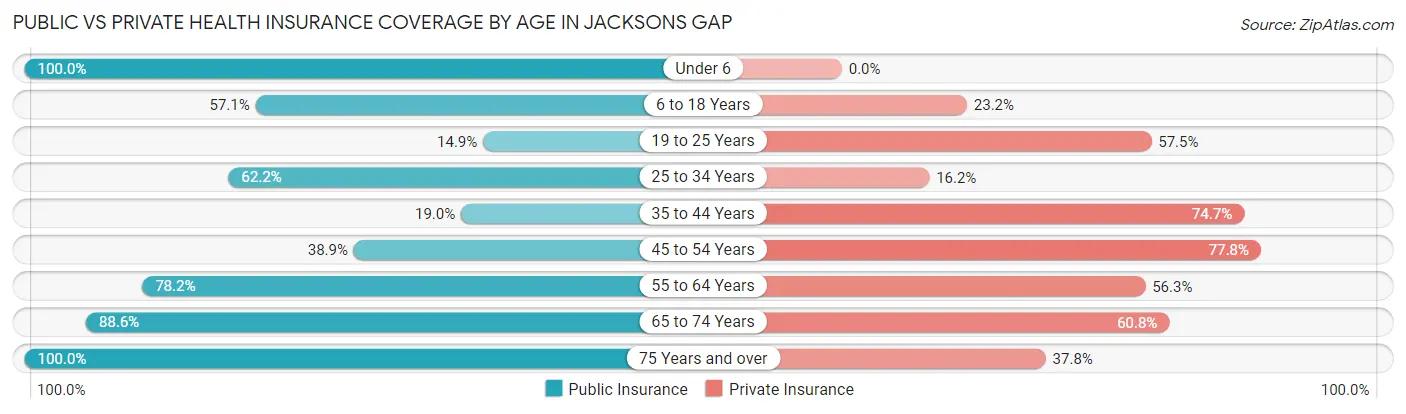
| Age Bracket | Public Insurance | Private Insurance |
| Under 6 | 24 (100.0%) | 0 (0.0%) |
| 6 to 18 Years | 32 (57.1%) | 13 (23.2%) |
| 19 to 25 Years | 7 (14.9%) | 27 (57.5%) |
| 25 to 34 Years | 46 (62.2%) | 12 (16.2%) |
| 35 to 44 Years | 15 (19.0%) | 59 (74.7%) |
| 45 to 54 Years | 21 (38.9%) | 42 (77.8%) |
| 55 to 64 Years | 68 (78.2%) | 49 (56.3%) |
| 65 to 74 Years | 70 (88.6%) | 48 (60.8%) |
| 75 Years and over | 37 (100.0%) | 14 (37.8%) |
| Total | 320 (59.6%) | 264 (49.2%) |
Disability Status by Sex by Age in Jacksons Gap
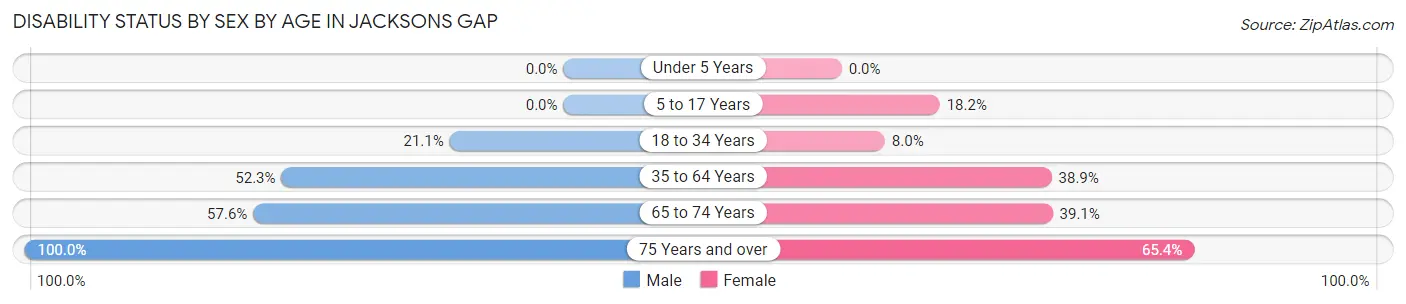
| Age Bracket | Male | Female |
| Under 5 Years | 0 (0.0%) | 0 (0.0%) |
| 5 to 17 Years | 0 (0.0%) | 4 (18.2%) |
| 18 to 34 Years | 15 (21.1%) | 4 (8.0%) |
| 35 to 64 Years | 56 (52.3%) | 44 (38.9%) |
| 65 to 74 Years | 19 (57.6%) | 18 (39.1%) |
| 75 Years and over | 11 (100.0%) | 17 (65.4%) |
Disability Class by Sex by Age in Jacksons Gap
Disability Class: Hearing Difficulty
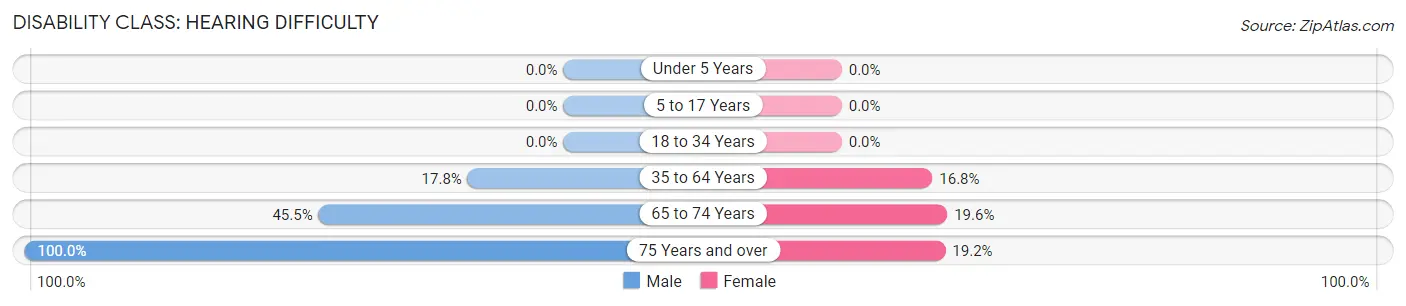
| Age Bracket | Male | Female |
| Under 5 Years | 0 (0.0%) | 0 (0.0%) |
| 5 to 17 Years | 0 (0.0%) | 0 (0.0%) |
| 18 to 34 Years | 0 (0.0%) | 0 (0.0%) |
| 35 to 64 Years | 19 (17.8%) | 19 (16.8%) |
| 65 to 74 Years | 15 (45.5%) | 9 (19.6%) |
| 75 Years and over | 11 (100.0%) | 5 (19.2%) |
Disability Class: Vision Difficulty
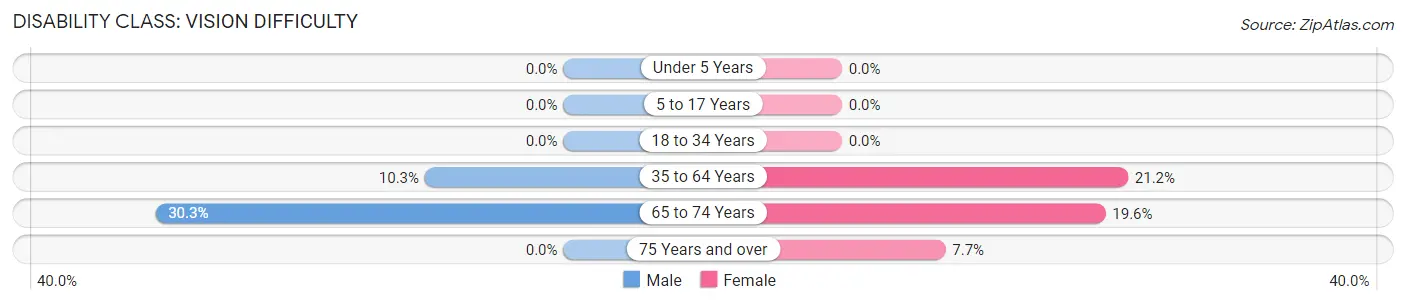
| Age Bracket | Male | Female |
| Under 5 Years | 0 (0.0%) | 0 (0.0%) |
| 5 to 17 Years | 0 (0.0%) | 0 (0.0%) |
| 18 to 34 Years | 0 (0.0%) | 0 (0.0%) |
| 35 to 64 Years | 11 (10.3%) | 24 (21.2%) |
| 65 to 74 Years | 10 (30.3%) | 9 (19.6%) |
| 75 Years and over | 0 (0.0%) | 2 (7.7%) |
Disability Class: Cognitive Difficulty

| Age Bracket | Male | Female |
| 5 to 17 Years | 0 (0.0%) | 4 (18.2%) |
| 18 to 34 Years | 4 (5.6%) | 0 (0.0%) |
| 35 to 64 Years | 30 (28.0%) | 18 (15.9%) |
| 65 to 74 Years | 9 (27.3%) | 3 (6.5%) |
| 75 Years and over | 11 (100.0%) | 2 (7.7%) |
Disability Class: Ambulatory Difficulty
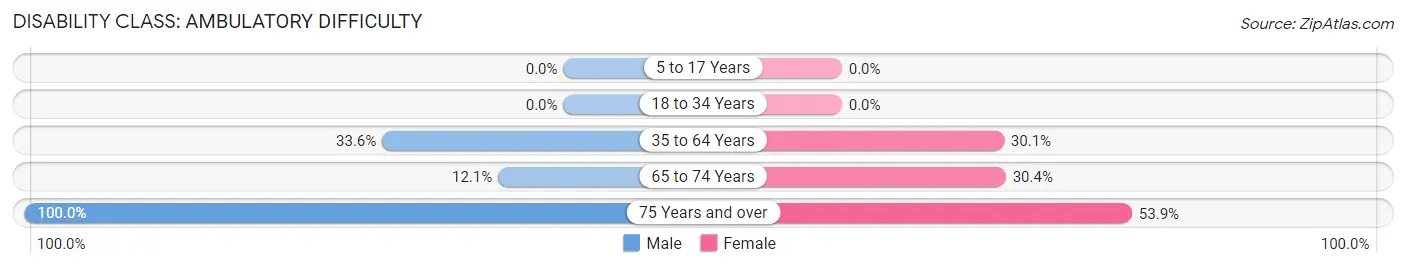
| Age Bracket | Male | Female |
| 5 to 17 Years | 0 (0.0%) | 0 (0.0%) |
| 18 to 34 Years | 0 (0.0%) | 0 (0.0%) |
| 35 to 64 Years | 36 (33.6%) | 34 (30.1%) |
| 65 to 74 Years | 4 (12.1%) | 14 (30.4%) |
| 75 Years and over | 11 (100.0%) | 14 (53.8%) |
Disability Class: Self-Care Difficulty
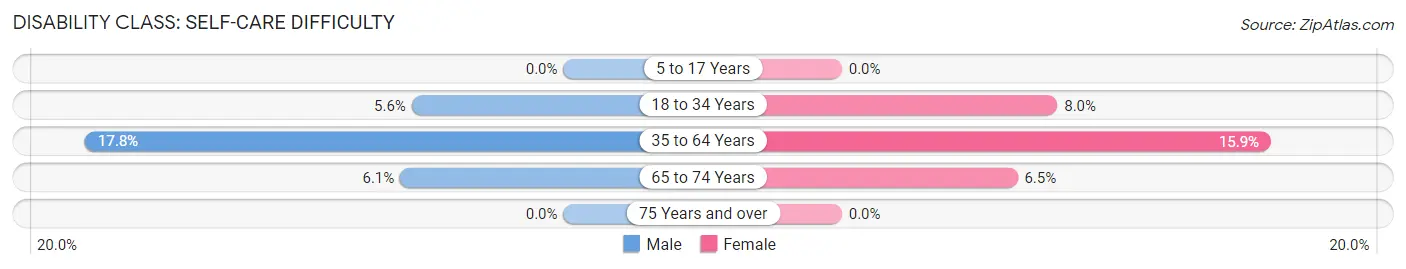
| Age Bracket | Male | Female |
| 5 to 17 Years | 0 (0.0%) | 0 (0.0%) |
| 18 to 34 Years | 4 (5.6%) | 4 (8.0%) |
| 35 to 64 Years | 19 (17.8%) | 18 (15.9%) |
| 65 to 74 Years | 2 (6.1%) | 3 (6.5%) |
| 75 Years and over | 0 (0.0%) | 0 (0.0%) |
Technology Access in Jacksons Gap
Computing Device Access in Jacksons Gap
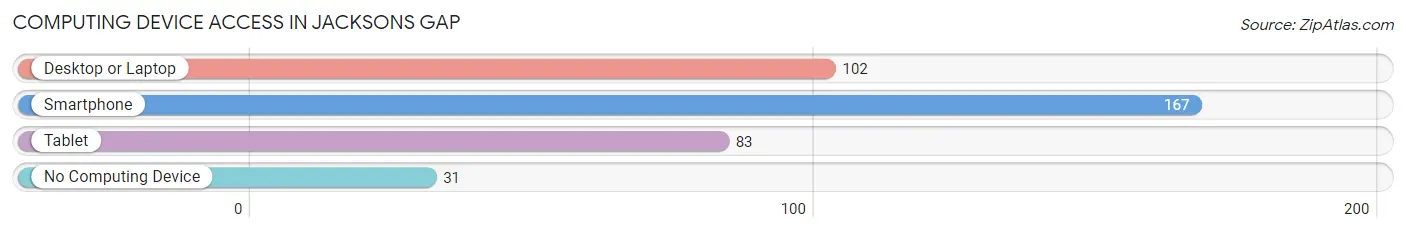
| Device Type | # Households | % Households |
| Desktop or Laptop | 102 | 47.9% |
| Smartphone | 167 | 78.4% |
| Tablet | 83 | 39.0% |
| No Computing Device | 31 | 14.5% |
| Total | 213 | 100.0% |
Internet Access in Jacksons Gap
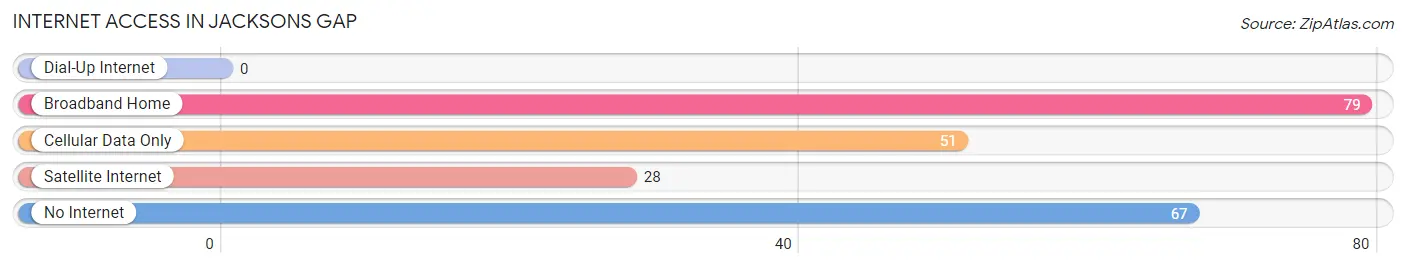
| Internet Type | # Households | % Households |
| Dial-Up Internet | 0 | 0.0% |
| Broadband Home | 79 | 37.1% |
| Cellular Data Only | 51 | 23.9% |
| Satellite Internet | 28 | 13.2% |
| No Internet | 67 | 31.5% |
| Total | 213 | 100.0% |
Jacksons Gap Summary
Jacksons Gap is a small town located in Tallapoosa County, Alabama. It is situated on the banks of Lake Martin, a 44,000-acre reservoir created by the construction of Martin Dam in 1926. The town is home to approximately 1,000 people and is part of the Alexander City Micropolitan Statistical Area.
History
Jacksons Gap was founded in 1837 by William Jackson, a former slave who had purchased his freedom. He purchased the land from the Creek Indians and named the town after himself. The town was originally known as Jackson’s Landing, but the name was changed to Jacksons Gap in 1845.
The town was a thriving community in the late 19th century, with a population of over 500 people. It was home to several businesses, including a general store, a blacksmith shop, a cotton gin, and a sawmill. The town also had a post office, a school, and a church.
In the early 20th century, the town began to decline as the timber industry moved away and the population decreased. The town was nearly abandoned by the 1950s, but it was revitalized in the 1970s when the construction of Martin Dam created Lake Martin. The lake brought new life to the town, and it has since become a popular destination for fishing, boating, and other recreational activities.
Geography
Jacksons Gap is located in the foothills of the Appalachian Mountains in east-central Alabama. The town is situated on the banks of Lake Martin, a 44,000-acre reservoir created by the construction of Martin Dam in 1926. The lake is a popular destination for fishing, boating, and other recreational activities.
The town is located approximately 30 miles east of Montgomery, the state capital, and approximately 50 miles west of Auburn, the home of Auburn University. The nearest major city is Birmingham, which is located approximately 90 miles to the north.
Economy
The economy of Jacksons Gap is largely based on tourism and recreation. The town is a popular destination for fishing, boating, and other recreational activities on Lake Martin. The lake is also home to several marinas, restaurants, and resorts.
In addition to tourism and recreation, the town is also home to several small businesses, including a grocery store, a hardware store, and a gas station. The town also has a post office and a library.
Demographics
As of the 2010 census, the population of Jacksons Gap was 1,039. The racial makeup of the town was 95.3% White, 2.7% African American, 0.3% Native American, 0.2% Asian, and 1.5% from other races. The median household income was $37,500, and the median age was 44.
Conclusion
Jacksons Gap is a small town located in Tallapoosa County, Alabama. It is situated on the banks of Lake Martin, a 44,000-acre reservoir created by the construction of Martin Dam in 1926. The town is home to approximately 1,000 people and is part of the Alexander City Micropolitan Statistical Area. The economy of Jacksons Gap is largely based on tourism and recreation, and the town is a popular destination for fishing, boating, and other recreational activities on Lake Martin. The town has a diverse population, with a median household income of $37,500 and a median age of 44.
Common Questions
What is Per Capita Income in Jacksons Gap?
Per Capita income in Jacksons Gap is $21,671.
What is the Median Family Income in Jacksons Gap?
Median Family Income in Jacksons Gap is $66,875.
What is the Median Household income in Jacksons Gap?
Median Household Income in Jacksons Gap is $30,417.
What is Income or Wage Gap in Jacksons Gap?
Income or Wage Gap in Jacksons Gap is 18.4%.
Women in Jacksons Gap earn 81.6 cents for every dollar earned by a man.
What is Inequality or Gini Index in Jacksons Gap?
Inequality or Gini Index in Jacksons Gap is 0.45.
What is the Total Population of Jacksons Gap?
Total Population of Jacksons Gap is 537.
What is the Total Male Population of Jacksons Gap?
Total Male Population of Jacksons Gap is 256.
What is the Total Female Population of Jacksons Gap?
Total Female Population of Jacksons Gap is 281.
What is the Ratio of Males per 100 Females in Jacksons Gap?
There are 91.10 Males per 100 Females in Jacksons Gap.
What is the Ratio of Females per 100 Males in Jacksons Gap?
There are 109.77 Females per 100 Males in Jacksons Gap.
What is the Median Population Age in Jacksons Gap?
Median Population Age in Jacksons Gap is 43.3 Years.
What is the Average Family Size in Jacksons Gap
Average Family Size in Jacksons Gap is 4.0 People.
What is the Average Household Size in Jacksons Gap
Average Household Size in Jacksons Gap is 2.5 People.
How Large is the Labor Force in Jacksons Gap?
There are 229 People in the Labor Forcein in Jacksons Gap.
What is the Percentage of People in the Labor Force in Jacksons Gap?
48.7% of People are in the Labor Force in Jacksons Gap.
What is the Unemployment Rate in Jacksons Gap?
Unemployment Rate in Jacksons Gap is 17.9%.