Henagar, AL Map & Demographics
Henagar Map
Henagar Overview
$22,754
PER CAPITA INCOME
$56,000
AVG FAMILY INCOME
$44,338
AVG HOUSEHOLD INCOME
27.2%
WAGE / INCOME GAP [ % ]
72.8¢/ $1
WAGE / INCOME GAP [ $ ]
$6,639
FAMILY INCOME DEFICIT
0.43
INEQUALITY / GINI INDEX
2,559
TOTAL POPULATION
1,294
MALE POPULATION
1,265
FEMALE POPULATION
102.29
MALES / 100 FEMALES
97.76
FEMALES / 100 MALES
39.4
MEDIAN AGE
3.6
AVG FAMILY SIZE
3.0
AVG HOUSEHOLD SIZE
1,096
LABOR FORCE [ PEOPLE ]
57.6%
PERCENT IN LABOR FORCE
9.0%
UNEMPLOYMENT RATE
Henagar Zip Codes
Henagar Area Codes
Income in Henagar
Income Overview in Henagar
Per Capita Income in Henagar is $22,754, while median incomes of families and households are $56,000 and $44,338 respectively.
| Characteristic | Number | Measure |
| Per Capita Income | 2,559 | $22,754 |
| Median Family Income | 636 | $56,000 |
| Mean Family Income | 636 | $64,973 |
| Median Household Income | 855 | $44,338 |
| Mean Household Income | 855 | $59,025 |
| Income Deficit | 636 | $6,639 |
| Wage / Income Gap (%) | 2,559 | 27.17% |
| Wage / Income Gap ($) | 2,559 | 72.83¢ per $1 |
| Gini / Inequality Index | 2,559 | 0.43 |
Earnings by Sex in Henagar
Average Earnings in Henagar are $33,681, $40,172 for men and $29,259 for women, a difference of 27.2%.
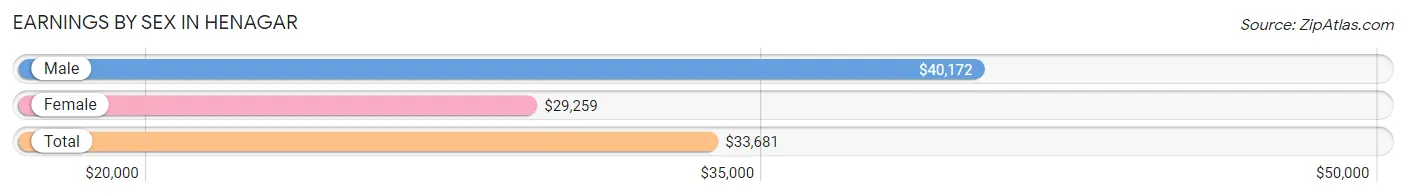
| Sex | Number | Average Earnings |
| Male | 632 (57.7%) | $40,172 |
| Female | 464 (42.3%) | $29,259 |
| Total | 1,096 (100.0%) | $33,681 |
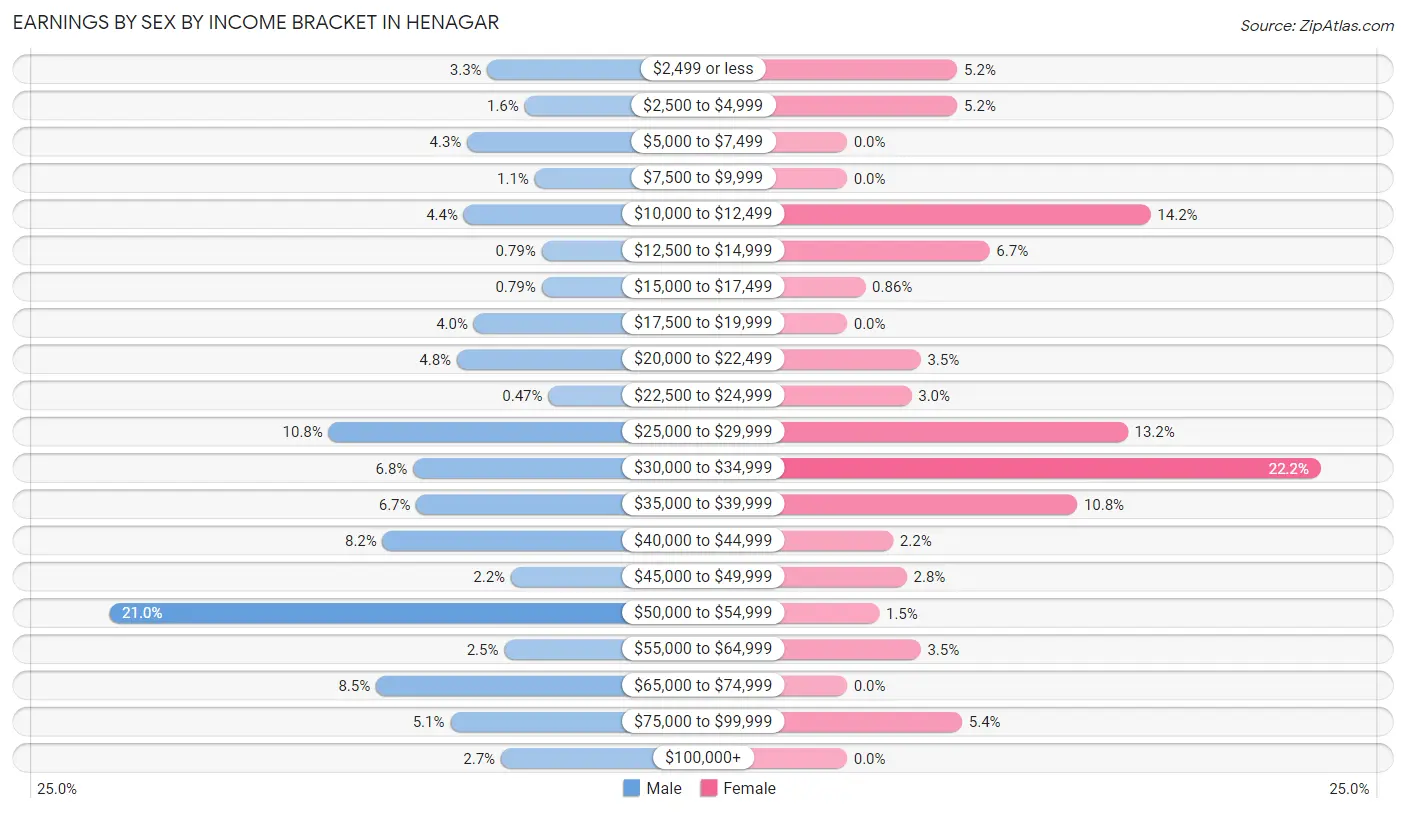
Earnings by Sex by Income Bracket in Henagar
The most common earnings brackets in Henagar are $50,000 to $54,999 for men (133 | 21.0%) and $30,000 to $34,999 for women (103 | 22.2%).
| Income | Male | Female |
| $2,499 or less | 21 (3.3%) | 24 (5.2%) |
| $2,500 to $4,999 | 10 (1.6%) | 24 (5.2%) |
| $5,000 to $7,499 | 27 (4.3%) | 0 (0.0%) |
| $7,500 to $9,999 | 7 (1.1%) | 0 (0.0%) |
| $10,000 to $12,499 | 28 (4.4%) | 66 (14.2%) |
| $12,500 to $14,999 | 5 (0.8%) | 31 (6.7%) |
| $15,000 to $17,499 | 5 (0.8%) | 4 (0.9%) |
| $17,500 to $19,999 | 25 (4.0%) | 0 (0.0%) |
| $20,000 to $22,499 | 30 (4.8%) | 16 (3.5%) |
| $22,500 to $24,999 | 3 (0.5%) | 14 (3.0%) |
| $25,000 to $29,999 | 68 (10.8%) | 61 (13.2%) |
| $30,000 to $34,999 | 43 (6.8%) | 103 (22.2%) |
| $35,000 to $39,999 | 42 (6.7%) | 50 (10.8%) |
| $40,000 to $44,999 | 52 (8.2%) | 10 (2.2%) |
| $45,000 to $49,999 | 14 (2.2%) | 13 (2.8%) |
| $50,000 to $54,999 | 133 (21.0%) | 7 (1.5%) |
| $55,000 to $64,999 | 16 (2.5%) | 16 (3.5%) |
| $65,000 to $74,999 | 54 (8.5%) | 0 (0.0%) |
| $75,000 to $99,999 | 32 (5.1%) | 25 (5.4%) |
| $100,000+ | 17 (2.7%) | 0 (0.0%) |
| Total | 632 (100.0%) | 464 (100.0%) |
Earnings by Sex by Educational Attainment in Henagar
Average earnings in Henagar are $43,424 for men and $32,584 for women, a difference of 25.0%. Men with an educational attainment of college or associate's degree enjoy the highest average annual earnings of $54,432, while those with high school diploma education earn the least with $40,057. Women with an educational attainment of less than high school earn the most with the average annual earnings of $40,893, while those with high school diploma education have the smallest earnings of $21,250.
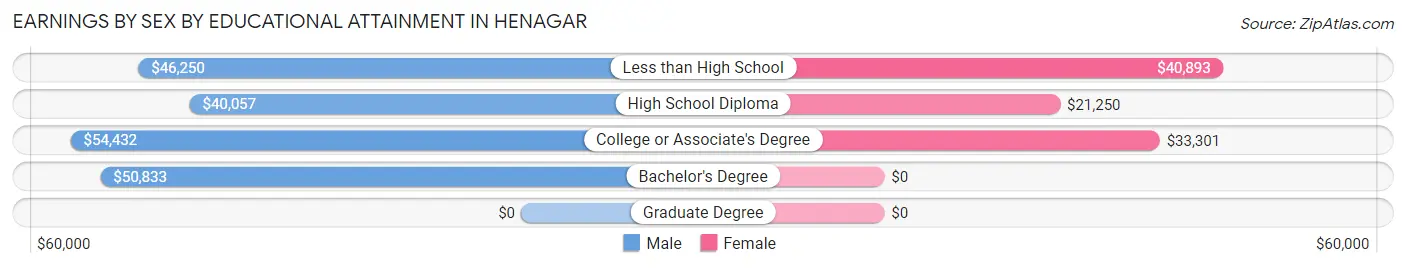
| Educational Attainment | Male Income | Female Income |
| Less than High School | $46,250 | $40,893 |
| High School Diploma | $40,057 | $21,250 |
| College or Associate's Degree | $54,432 | $33,301 |
| Bachelor's Degree | $50,833 | $0 |
| Graduate Degree | - | - |
| Total | $43,424 | $32,584 |
Family Income in Henagar
Family Income Brackets in Henagar
According to the Henagar family income data, there are 119 families falling into the $75,000 to $99,999 income range, which is the most common income bracket and makes up 18.7% of all families. Conversely, the $200,000+ income bracket is the least frequent group with only 5 families (0.8%) belonging to this category.
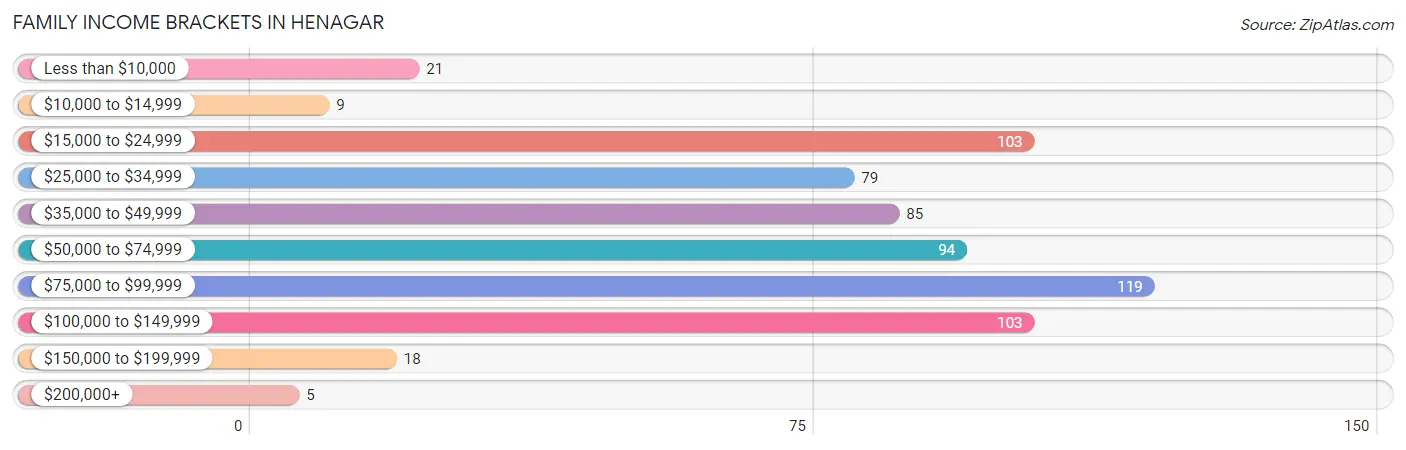
| Income Bracket | # Families | % Families |
| Less than $10,000 | 21 | 3.3% |
| $10,000 to $14,999 | 9 | 1.4% |
| $15,000 to $24,999 | 103 | 16.2% |
| $25,000 to $34,999 | 79 | 12.4% |
| $35,000 to $49,999 | 85 | 13.4% |
| $50,000 to $74,999 | 94 | 14.8% |
| $75,000 to $99,999 | 119 | 18.7% |
| $100,000 to $149,999 | 103 | 16.2% |
| $150,000 to $199,999 | 18 | 2.8% |
| $200,000+ | 5 | 0.8% |
Family Income by Famaliy Size in Henagar
4-person families (79 | 12.4%) account for the highest median family income in Henagar with $103,750 per family, while 4-person families (79 | 12.4%) have the highest median income of $25,938 per family member.
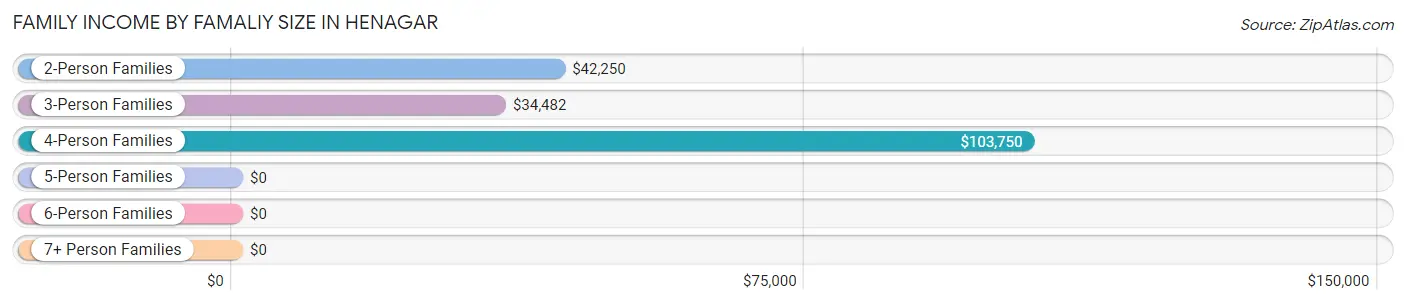
| Income Bracket | # Families | Median Income |
| 2-Person Families | 289 (45.4%) | $42,250 |
| 3-Person Families | 157 (24.7%) | $34,482 |
| 4-Person Families | 79 (12.4%) | $103,750 |
| 5-Person Families | 36 (5.7%) | $0 |
| 6-Person Families | 42 (6.6%) | $0 |
| 7+ Person Families | 33 (5.2%) | $0 |
| Total | 636 (100.0%) | $56,000 |
Family Income by Number of Earners in Henagar
The median family income in Henagar is $56,000, with families comprising 3+ earners (58) having the highest median family income of $118,611, while families with no earners (161) have the lowest median family income of $21,518, accounting for 9.1% and 25.3% of families, respectively.
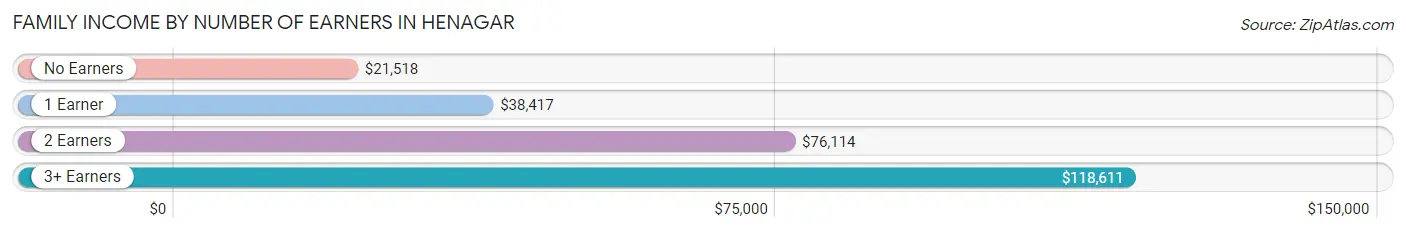
| Number of Earners | # Families | Median Income |
| No Earners | 161 (25.3%) | $21,518 |
| 1 Earner | 186 (29.2%) | $38,417 |
| 2 Earners | 231 (36.3%) | $76,114 |
| 3+ Earners | 58 (9.1%) | $118,611 |
| Total | 636 (100.0%) | $56,000 |
Household Income in Henagar
Household Income Brackets in Henagar
With 141 households falling in the category, the $15,000 to $24,999 income range is the most frequent in Henagar, accounting for 16.5% of all households. In contrast, only 11 households (1.3%) fall into the $200,000+ income bracket, making it the least populous group.
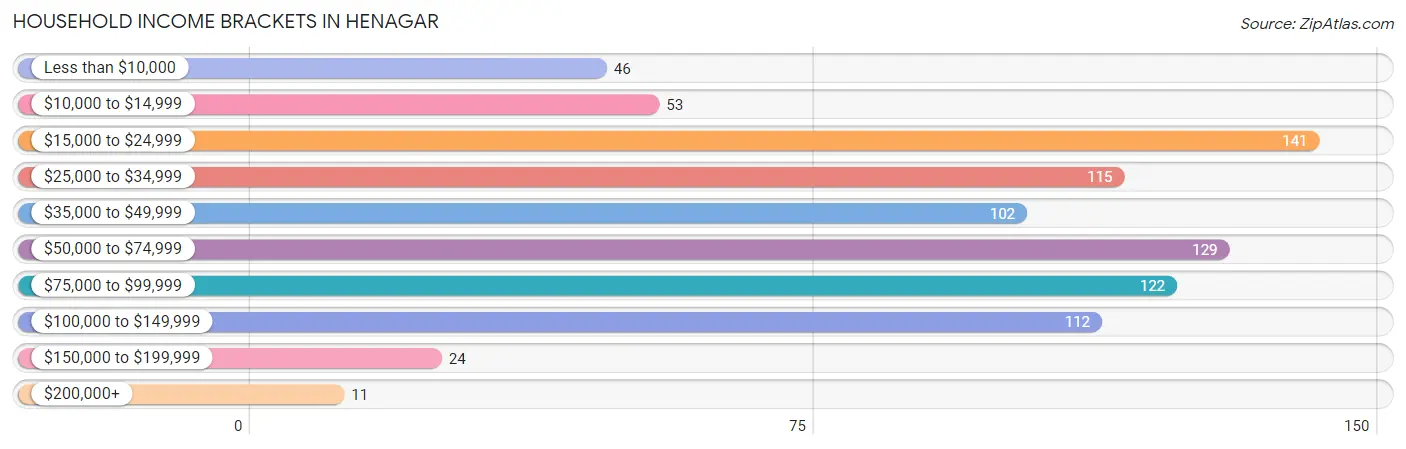
| Income Bracket | # Households | % Households |
| Less than $10,000 | 46 | 5.4% |
| $10,000 to $14,999 | 53 | 6.2% |
| $15,000 to $24,999 | 141 | 16.5% |
| $25,000 to $34,999 | 115 | 13.5% |
| $35,000 to $49,999 | 102 | 11.9% |
| $50,000 to $74,999 | 129 | 15.1% |
| $75,000 to $99,999 | 122 | 14.3% |
| $100,000 to $149,999 | 112 | 13.1% |
| $150,000 to $199,999 | 24 | 2.8% |
| $200,000+ | 11 | 1.3% |
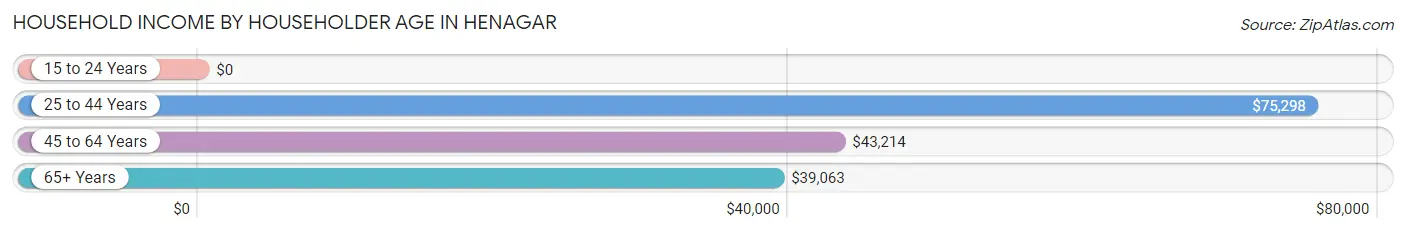
Household Income by Householder Age in Henagar
The median household income in Henagar is $44,338, with the highest median household income of $75,298 found in the 25 to 44 years age bracket for the primary householder. A total of 248 households (29.0%) fall into this category. Meanwhile, the 15 to 24 years age bracket for the primary householder has the lowest median household income of $0, with 6 households (0.7%) in this group.
| Income Bracket | # Households | Median Income |
| 15 to 24 Years | 6 (0.7%) | $0 |
| 25 to 44 Years | 248 (29.0%) | $75,298 |
| 45 to 64 Years | 354 (41.4%) | $43,214 |
| 65+ Years | 247 (28.9%) | $39,063 |
| Total | 855 (100.0%) | $44,338 |
Poverty in Henagar
Income Below Poverty by Sex and Age in Henagar
With 20.4% poverty level for males and 21.6% for females among the residents of Henagar, 6 to 11 year old males and 15 year old females are the most vulnerable to poverty, with 90 males (57.0%) and 18 females (52.9%) in their respective age groups living below the poverty level.
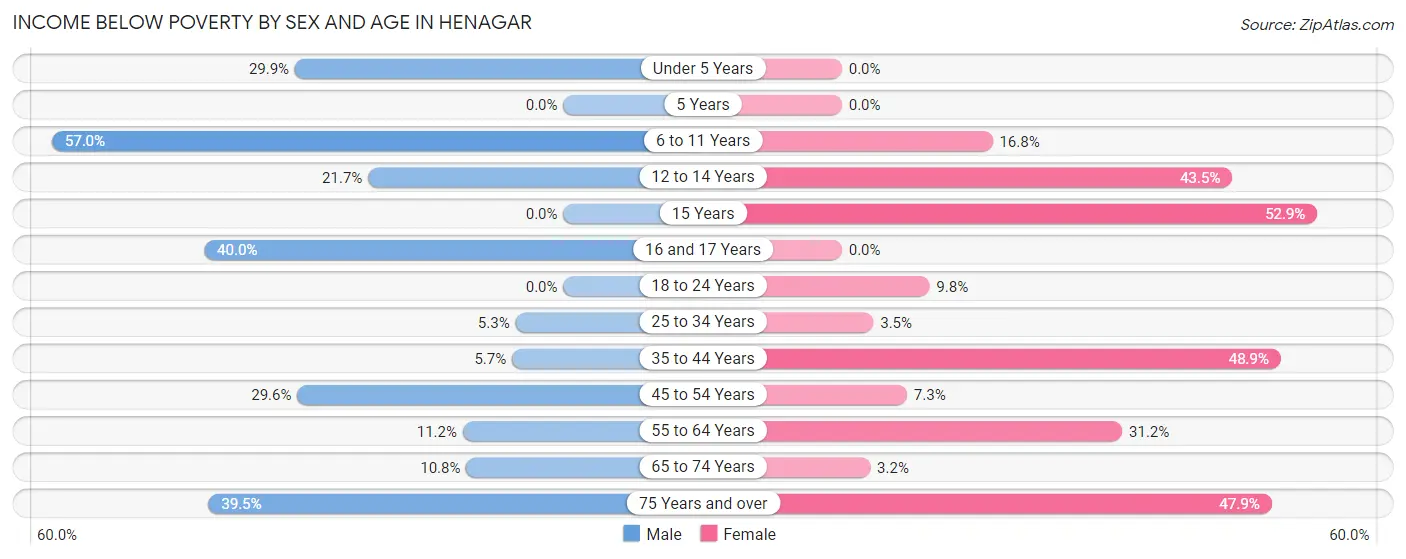
| Age Bracket | Male | Female |
| Under 5 Years | 26 (29.9%) | 0 (0.0%) |
| 5 Years | 0 (0.0%) | 0 (0.0%) |
| 6 to 11 Years | 90 (57.0%) | 25 (16.8%) |
| 12 to 14 Years | 10 (21.7%) | 30 (43.5%) |
| 15 Years | 0 (0.0%) | 18 (52.9%) |
| 16 and 17 Years | 10 (40.0%) | 0 (0.0%) |
| 18 to 24 Years | 0 (0.0%) | 4 (9.8%) |
| 25 to 34 Years | 8 (5.3%) | 8 (3.5%) |
| 35 to 44 Years | 6 (5.7%) | 66 (48.9%) |
| 45 to 54 Years | 48 (29.6%) | 10 (7.2%) |
| 55 to 64 Years | 28 (11.2%) | 64 (31.2%) |
| 65 to 74 Years | 16 (10.8%) | 3 (3.2%) |
| 75 Years and over | 17 (39.5%) | 45 (47.9%) |
| Total | 259 (20.4%) | 273 (21.6%) |
Income Above Poverty by Sex and Age in Henagar
According to the poverty statistics in Henagar, males aged 15 years and females aged under 5 years are the age groups that are most secure financially, with 100.0% of males and 100.0% of females in these age groups living above the poverty line.
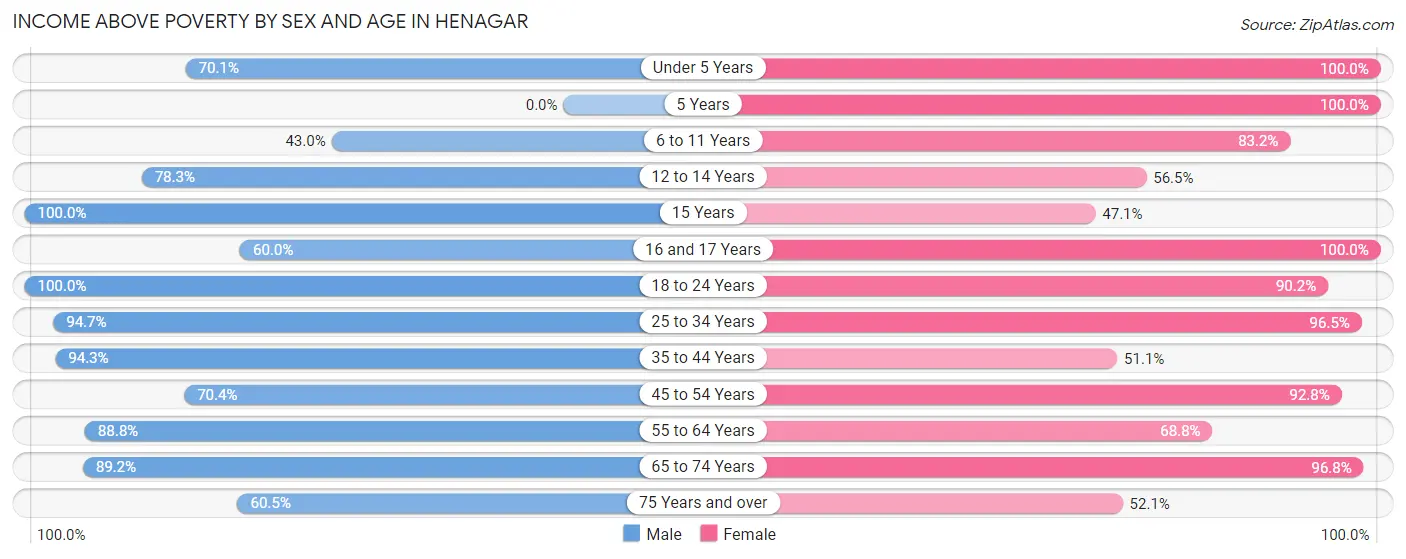
| Age Bracket | Male | Female |
| Under 5 Years | 61 (70.1%) | 64 (100.0%) |
| 5 Years | 0 (0.0%) | 4 (100.0%) |
| 6 to 11 Years | 68 (43.0%) | 124 (83.2%) |
| 12 to 14 Years | 36 (78.3%) | 39 (56.5%) |
| 15 Years | 20 (100.0%) | 16 (47.1%) |
| 16 and 17 Years | 15 (60.0%) | 9 (100.0%) |
| 18 to 24 Years | 75 (100.0%) | 37 (90.2%) |
| 25 to 34 Years | 142 (94.7%) | 220 (96.5%) |
| 35 to 44 Years | 99 (94.3%) | 69 (51.1%) |
| 45 to 54 Years | 114 (70.4%) | 128 (92.7%) |
| 55 to 64 Years | 222 (88.8%) | 141 (68.8%) |
| 65 to 74 Years | 132 (89.2%) | 92 (96.8%) |
| 75 Years and over | 26 (60.5%) | 49 (52.1%) |
| Total | 1,010 (79.6%) | 992 (78.4%) |
Income Below Poverty Among Married-Couple Families in Henagar
The poverty statistics for married-couple families in Henagar show that 12.1% or 60 of the total 497 families live below the poverty line. Families with 5 or more children have the highest poverty rate of 40.0%, comprising of 10 families. On the other hand, families with no children have the lowest poverty rate of 8.1%, which includes 21 families.
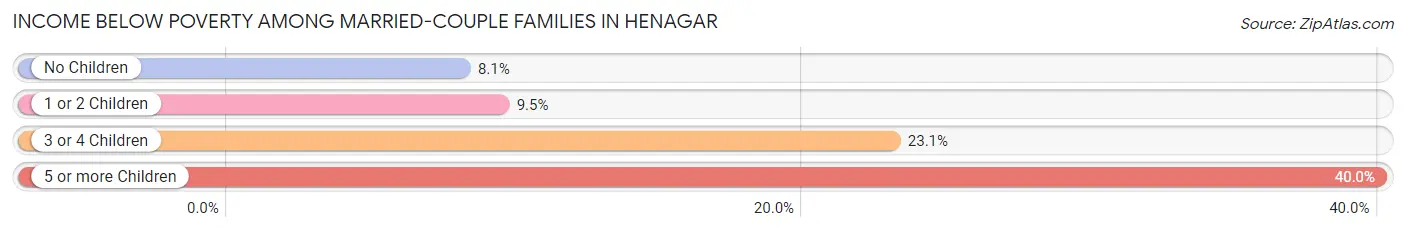
| Children | Above Poverty | Below Poverty |
| No Children | 238 (91.9%) | 21 (8.1%) |
| 1 or 2 Children | 134 (90.5%) | 14 (9.5%) |
| 3 or 4 Children | 50 (76.9%) | 15 (23.1%) |
| 5 or more Children | 15 (60.0%) | 10 (40.0%) |
| Total | 437 (87.9%) | 60 (12.1%) |
Income Below Poverty Among Single-Parent Households in Henagar
According to the poverty data in Henagar, 45.2% or 19 single-father households and 52.6% or 51 single-mother households are living below the poverty line. Among single-father households, those with 1 or 2 children have the highest poverty rate, with 19 households (100.0%) experiencing poverty. Likewise, among single-mother households, those with no children have the highest poverty rate, with 14 households (100.0%) falling below the poverty line.
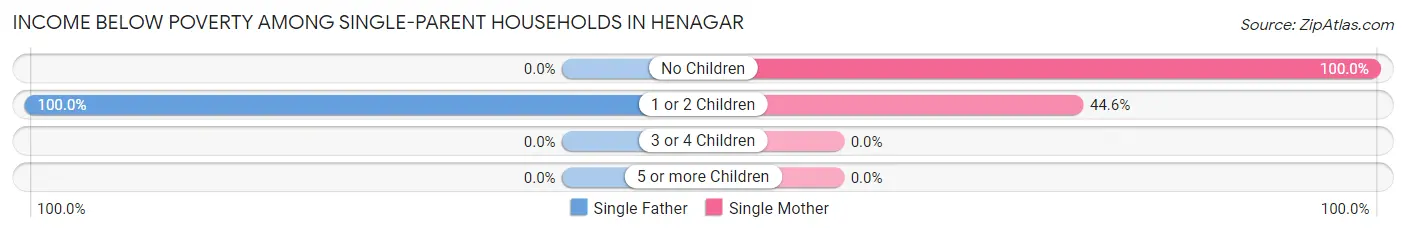
| Children | Single Father | Single Mother |
| No Children | 0 (0.0%) | 14 (100.0%) |
| 1 or 2 Children | 19 (100.0%) | 37 (44.6%) |
| 3 or 4 Children | 0 (0.0%) | 0 (0.0%) |
| 5 or more Children | 0 (0.0%) | 0 (0.0%) |
| Total | 19 (45.2%) | 51 (52.6%) |
Income Below Poverty Among Married-Couple vs Single-Parent Households in Henagar
The poverty data for Henagar shows that 60 of the married-couple family households (12.1%) and 70 of the single-parent households (50.4%) are living below the poverty level. Within the married-couple family households, those with 5 or more children have the highest poverty rate, with 10 households (40.0%) falling below the poverty line. Among the single-parent households, those with 1 or 2 children have the highest poverty rate, with 56 household (54.9%) living below poverty.
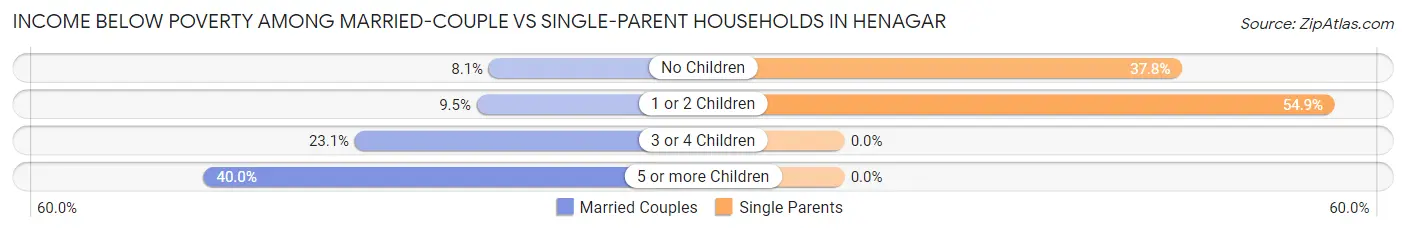
| Children | Married-Couple Families | Single-Parent Households |
| No Children | 21 (8.1%) | 14 (37.8%) |
| 1 or 2 Children | 14 (9.5%) | 56 (54.9%) |
| 3 or 4 Children | 15 (23.1%) | 0 (0.0%) |
| 5 or more Children | 10 (40.0%) | 0 (0.0%) |
| Total | 60 (12.1%) | 70 (50.4%) |
Race in Henagar
The most populous races in Henagar are White / Caucasian (2,353 | 91.9%), Hispanic or Latino (149 | 5.8%), and Two or more Races (128 | 5.0%).
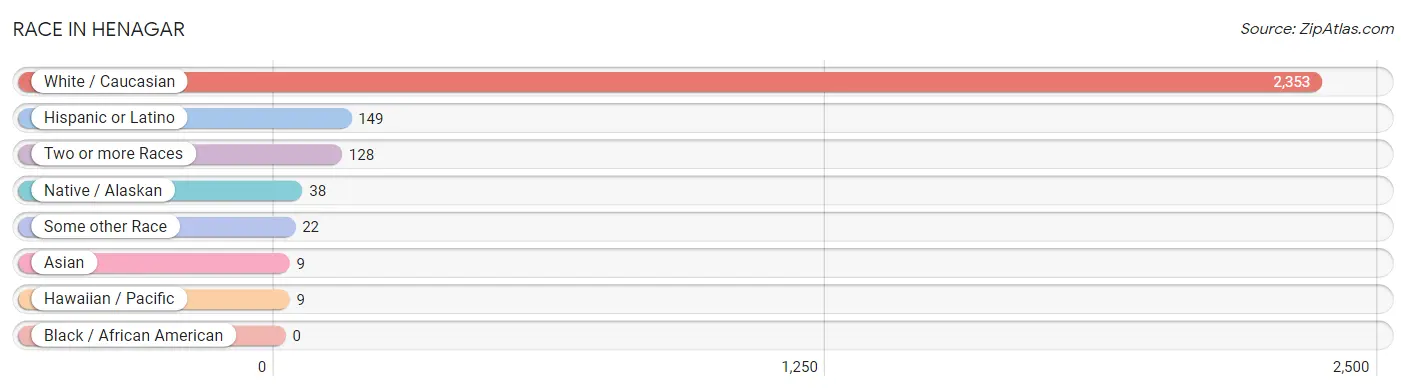
| Race | # Population | % Population |
| Asian | 9 | 0.4% |
| Black / African American | 0 | 0.0% |
| Hawaiian / Pacific | 9 | 0.4% |
| Hispanic or Latino | 149 | 5.8% |
| Native / Alaskan | 38 | 1.5% |
| White / Caucasian | 2,353 | 91.9% |
| Two or more Races | 128 | 5.0% |
| Some other Race | 22 | 0.9% |
| Total | 2,559 | 100.0% |
Ancestry in Henagar
The most populous ancestries reported in Henagar are Irish (415 | 16.2%), American (404 | 15.8%), English (396 | 15.5%), Scottish (148 | 5.8%), and German (140 | 5.5%), together accounting for 58.7% of all Henagar residents.
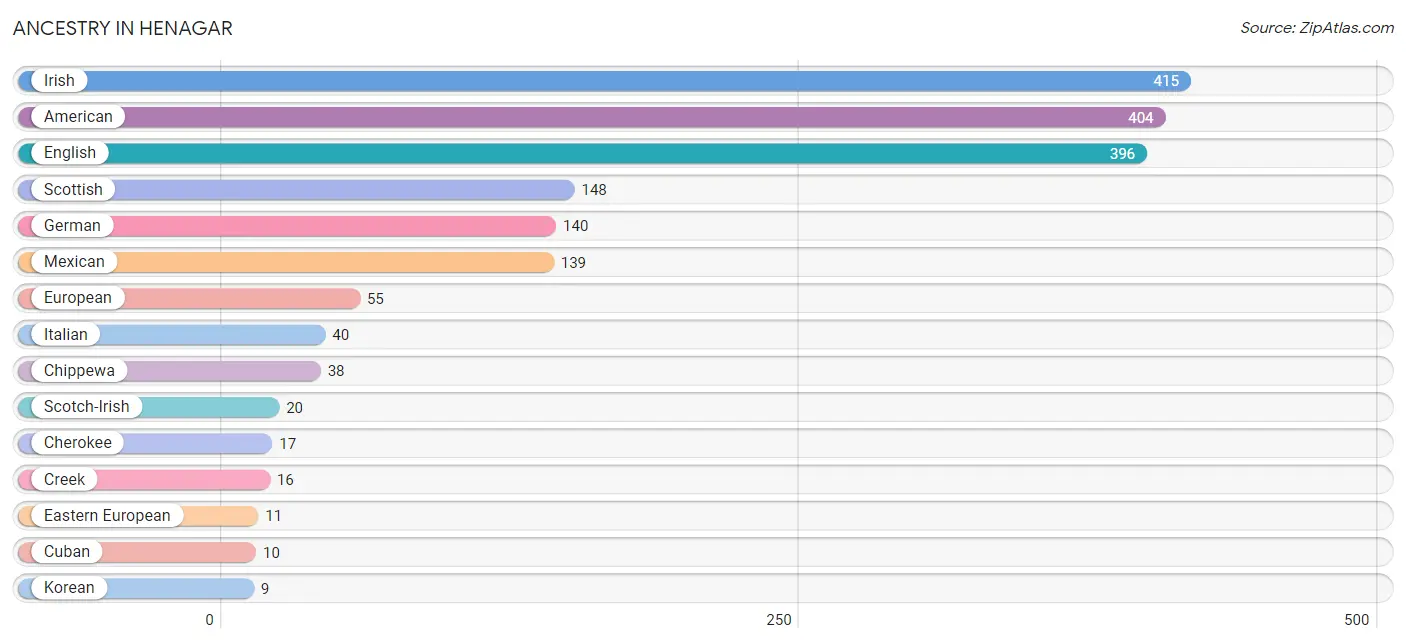
| Ancestry | # Population | % Population |
| American | 404 | 15.8% |
| Cherokee | 17 | 0.7% |
| Chippewa | 38 | 1.5% |
| Creek | 16 | 0.6% |
| Cuban | 10 | 0.4% |
| Eastern European | 11 | 0.4% |
| English | 396 | 15.5% |
| European | 55 | 2.1% |
| German | 140 | 5.5% |
| Irish | 415 | 16.2% |
| Italian | 40 | 1.6% |
| Korean | 9 | 0.4% |
| Mexican | 139 | 5.4% |
| Native Hawaiian | 9 | 0.4% |
| Norwegian | 6 | 0.2% |
| Scotch-Irish | 20 | 0.8% |
| Scottish | 148 | 5.8% |
| Swedish | 3 | 0.1% | View All 18 Rows |
Immigrants in Henagar
The most numerous immigrant groups reported in Henagar came from Europe (13 | 0.5%), Germany (13 | 0.5%), Western Europe (13 | 0.5%), Asia (9 | 0.4%), and Philippines (9 | 0.4%), together accounting for 2.2% of all Henagar residents.
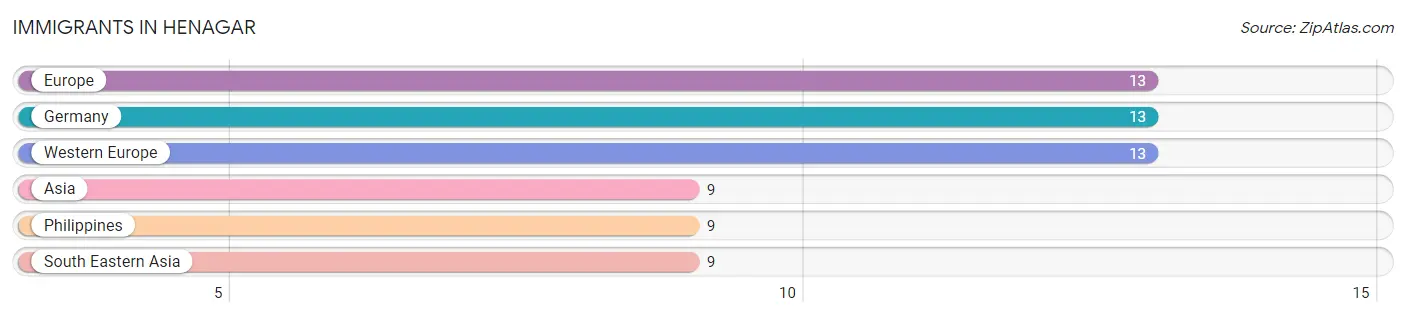
| Immigration Origin | # Population | % Population |
| Asia | 9 | 0.4% |
| Europe | 13 | 0.5% |
| Germany | 13 | 0.5% |
| Philippines | 9 | 0.4% |
| South Eastern Asia | 9 | 0.4% |
| Western Europe | 13 | 0.5% | View All 6 Rows |
Sex and Age in Henagar
Sex and Age in Henagar
The most populous age groups in Henagar are 60 to 64 Years (139 | 10.7%) for men and 30 to 34 Years (172 | 13.6%) for women.
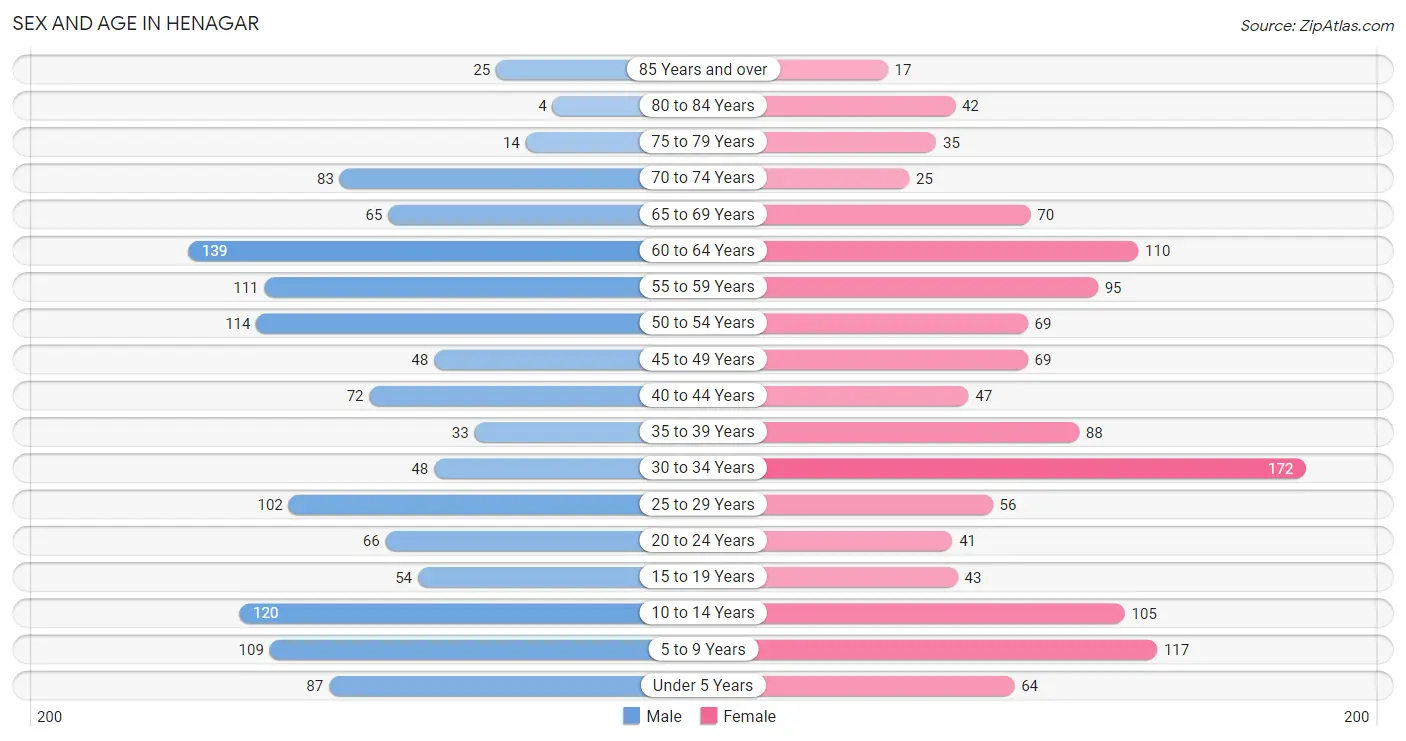
| Age Bracket | Male | Female |
| Under 5 Years | 87 (6.7%) | 64 (5.1%) |
| 5 to 9 Years | 109 (8.4%) | 117 (9.2%) |
| 10 to 14 Years | 120 (9.3%) | 105 (8.3%) |
| 15 to 19 Years | 54 (4.2%) | 43 (3.4%) |
| 20 to 24 Years | 66 (5.1%) | 41 (3.2%) |
| 25 to 29 Years | 102 (7.9%) | 56 (4.4%) |
| 30 to 34 Years | 48 (3.7%) | 172 (13.6%) |
| 35 to 39 Years | 33 (2.5%) | 88 (7.0%) |
| 40 to 44 Years | 72 (5.6%) | 47 (3.7%) |
| 45 to 49 Years | 48 (3.7%) | 69 (5.4%) |
| 50 to 54 Years | 114 (8.8%) | 69 (5.4%) |
| 55 to 59 Years | 111 (8.6%) | 95 (7.5%) |
| 60 to 64 Years | 139 (10.7%) | 110 (8.7%) |
| 65 to 69 Years | 65 (5.0%) | 70 (5.5%) |
| 70 to 74 Years | 83 (6.4%) | 25 (2.0%) |
| 75 to 79 Years | 14 (1.1%) | 35 (2.8%) |
| 80 to 84 Years | 4 (0.3%) | 42 (3.3%) |
| 85 Years and over | 25 (1.9%) | 17 (1.3%) |
| Total | 1,294 (100.0%) | 1,265 (100.0%) |
Families and Households in Henagar
Median Family Size in Henagar
The median family size in Henagar is 3.56 persons per family, with married-couple families (497 | 78.1%) accounting for the largest median family size of 3.75 persons per family. On the other hand, single female/mother families (97 | 15.2%) represent the smallest median family size with 2.82 persons per family.
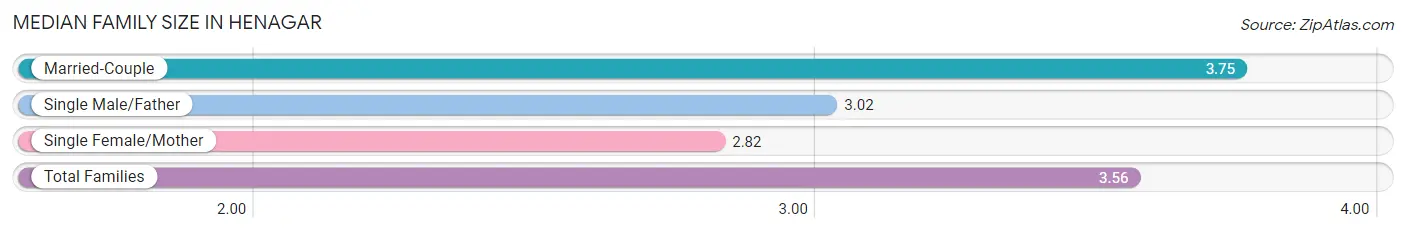
| Family Type | # Families | Family Size |
| Married-Couple | 497 (78.1%) | 3.75 |
| Single Male/Father | 42 (6.6%) | 3.02 |
| Single Female/Mother | 97 (15.2%) | 2.82 |
| Total Families | 636 (100.0%) | 3.56 |
Median Household Size in Henagar
The median household size in Henagar is 2.99 persons per household, with married-couple households (497 | 58.1%) accounting for the largest median household size of 3.82 persons per household. non-family households (219 | 25.6%) represent the smallest median household size with 1.16 persons per household.
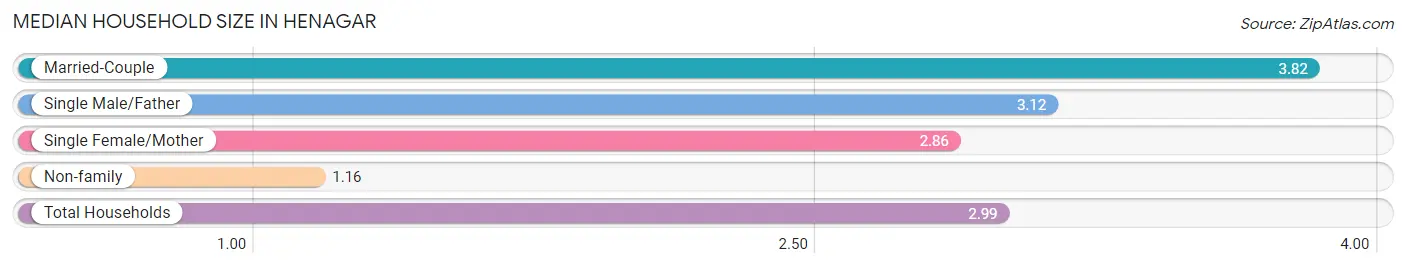
| Household Type | # Households | Household Size |
| Married-Couple | 497 (58.1%) | 3.82 |
| Single Male/Father | 42 (4.9%) | 3.12 |
| Single Female/Mother | 97 (11.4%) | 2.86 |
| Non-family | 219 (25.6%) | 1.16 |
| Total Households | 855 (100.0%) | 2.99 |
Household Size by Marriage Status in Henagar
Out of a total of 855 households in Henagar, 636 (74.4%) are family households, while 219 (25.6%) are nonfamily households. The most numerous type of family households are 2-person households, comprising 277, and the most common type of nonfamily households are 1-person households, comprising 193.
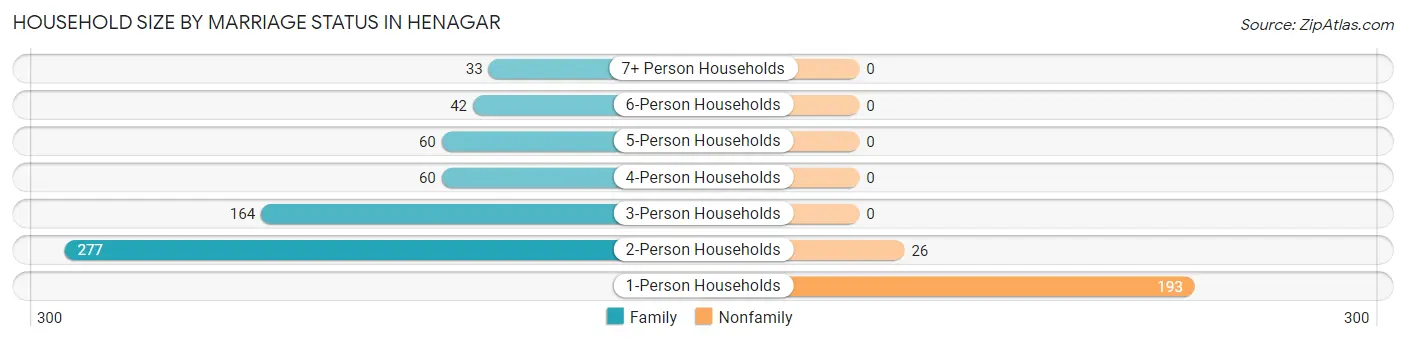
| Household Size | Family Households | Nonfamily Households |
| 1-Person Households | - | 193 (22.6%) |
| 2-Person Households | 277 (32.4%) | 26 (3.0%) |
| 3-Person Households | 164 (19.2%) | 0 (0.0%) |
| 4-Person Households | 60 (7.0%) | 0 (0.0%) |
| 5-Person Households | 60 (7.0%) | 0 (0.0%) |
| 6-Person Households | 42 (4.9%) | 0 (0.0%) |
| 7+ Person Households | 33 (3.9%) | 0 (0.0%) |
| Total | 636 (74.4%) | 219 (25.6%) |
Female Fertility in Henagar
Fertility by Age in Henagar
Average fertility rate in Henagar is 103.0 births per 1,000 women. Women in the age bracket of 20 to 34 years have the highest fertility rate with 208.0 births per 1,000 women. Women in the age bracket of 20 to 34 years acount for 100.0% of all women with births.
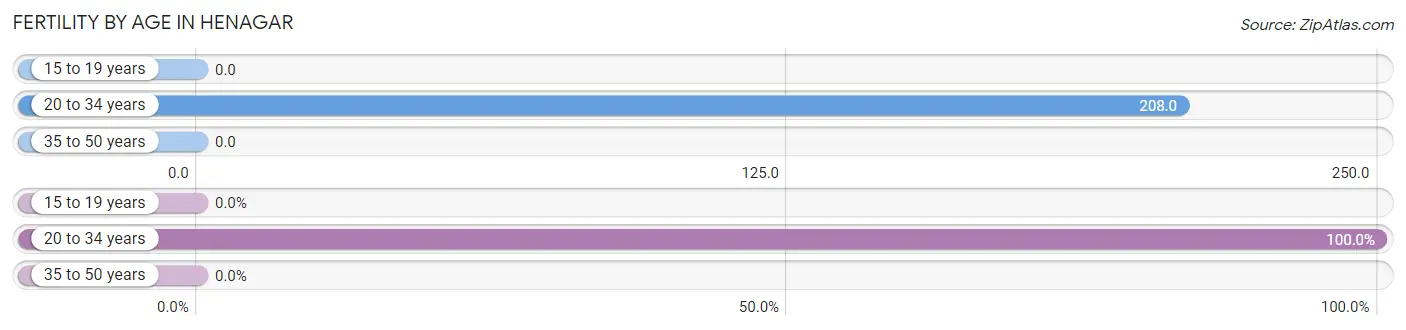
| Age Bracket | Women with Births | Births / 1,000 Women |
| 15 to 19 years | 0 (0.0%) | 0.0 |
| 20 to 34 years | 56 (100.0%) | 208.0 |
| 35 to 50 years | 0 (0.0%) | 0.0 |
| Total | 56 (100.0%) | 103.0 |
Fertility by Age by Marriage Status in Henagar
92.9% of women with births (56) in Henagar are married. The highest percentage of unmarried women with births falls into 20 to 34 years age bracket with 7.1% of them unmarried at the time of birth, while the lowest percentage of unmarried women with births belong to 20 to 34 years age bracket with 7.1% of them unmarried.
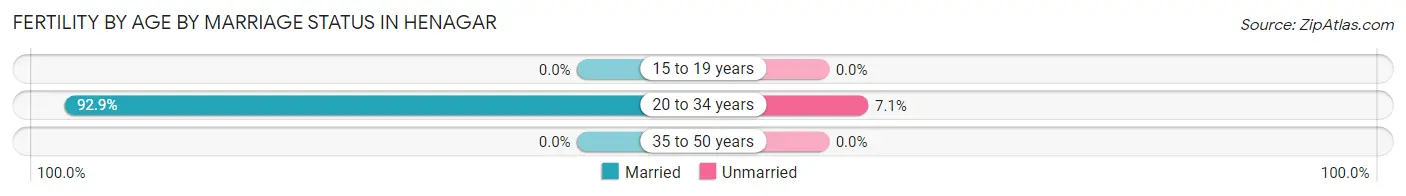
| Age Bracket | Married | Unmarried |
| 15 to 19 years | 0 (0.0%) | 0 (0.0%) |
| 20 to 34 years | 52 (92.9%) | 4 (7.1%) |
| 35 to 50 years | 0 (0.0%) | 0 (0.0%) |
| Total | 52 (92.9%) | 4 (7.1%) |
Fertility by Education in Henagar
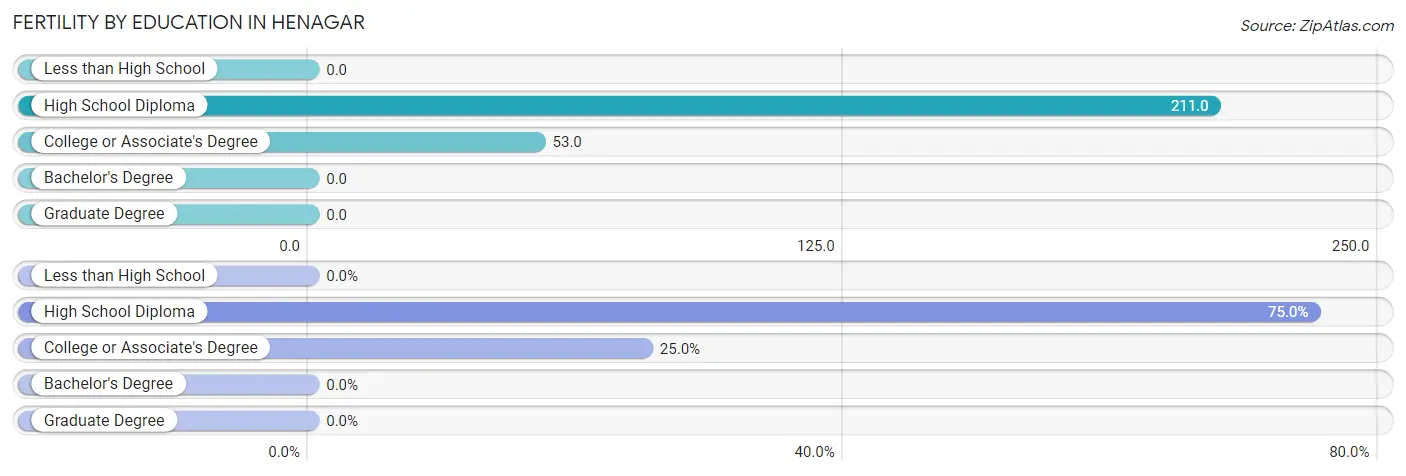
| Educational Attainment | Women with Births | Births / 1,000 Women |
| Less than High School | 0 (0.0%) | 0.0 |
| High School Diploma | 42 (75.0%) | 211.0 |
| College or Associate's Degree | 14 (25.0%) | 53.0 |
| Bachelor's Degree | 0 (0.0%) | 0.0 |
| Graduate Degree | 0 (0.0%) | 0.0 |
| Total | 56 (100.0%) | 103.0 |
Fertility by Education by Marriage Status in Henagar
7.1% of women with births in Henagar are unmarried. Women with the educational attainment of high school diploma are most likely to be married with 100.0% of them married at childbirth, while women with the educational attainment of college or associate's degree are least likely to be married with 28.6% of them unmarried at childbirth.
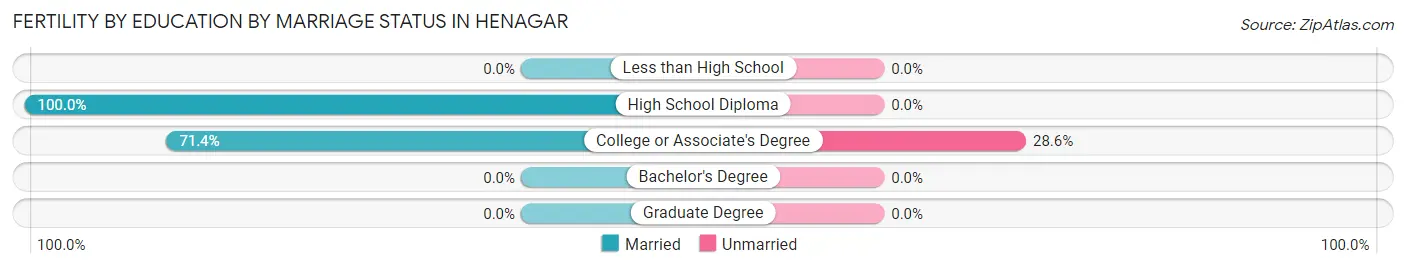
| Educational Attainment | Married | Unmarried |
| Less than High School | 0 (0.0%) | 0 (0.0%) |
| High School Diploma | 42 (100.0%) | 0 (0.0%) |
| College or Associate's Degree | 10 (71.4%) | 4 (28.6%) |
| Bachelor's Degree | 0 (0.0%) | 0 (0.0%) |
| Graduate Degree | 0 (0.0%) | 0 (0.0%) |
| Total | 52 (92.9%) | 4 (7.1%) |
Employment Characteristics in Henagar
Employment by Class of Employer in Henagar
Among the 940 employed individuals in Henagar, private company employees (733 | 78.0%), self-employed (not incorporated) (104 | 11.1%), and not-for-profit organizations (36 | 3.8%) make up the most common classes of employment.
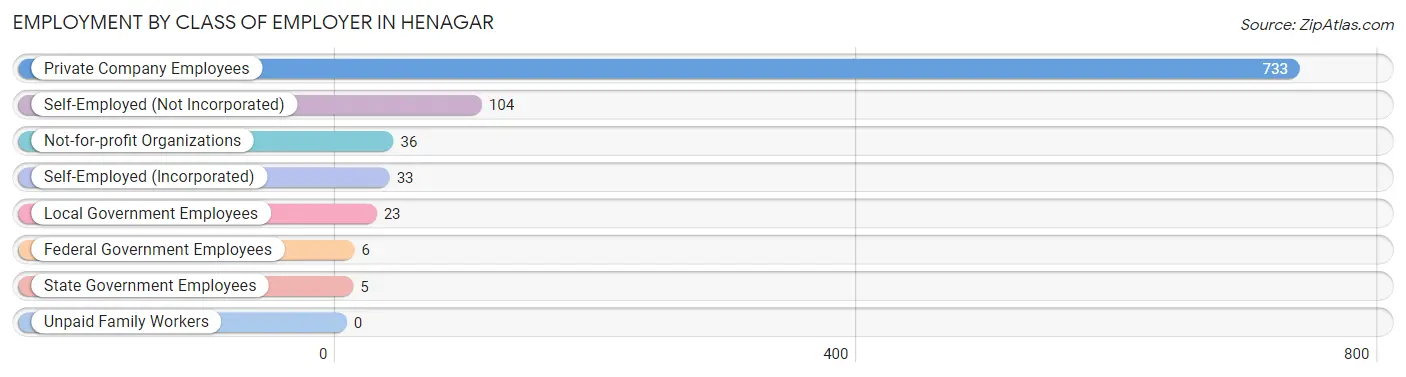
| Employer Class | # Employees | % Employees |
| Private Company Employees | 733 | 78.0% |
| Self-Employed (Incorporated) | 33 | 3.5% |
| Self-Employed (Not Incorporated) | 104 | 11.1% |
| Not-for-profit Organizations | 36 | 3.8% |
| Local Government Employees | 23 | 2.5% |
| State Government Employees | 5 | 0.5% |
| Federal Government Employees | 6 | 0.6% |
| Unpaid Family Workers | 0 | 0.0% |
| Total | 940 | 100.0% |
Employment Status by Age in Henagar
According to the labor force statistics for Henagar, out of the total population over 16 years of age (1,903), 57.6% or 1,096 individuals are in the labor force, with 9.0% or 99 of them unemployed. The age group with the highest labor force participation rate is 30 to 34 years, with 92.3% or 203 individuals in the labor force. Within the labor force, the 30 to 34 years age range has the highest percentage of unemployed individuals, with 31.5% or 64 of them being unemployed.
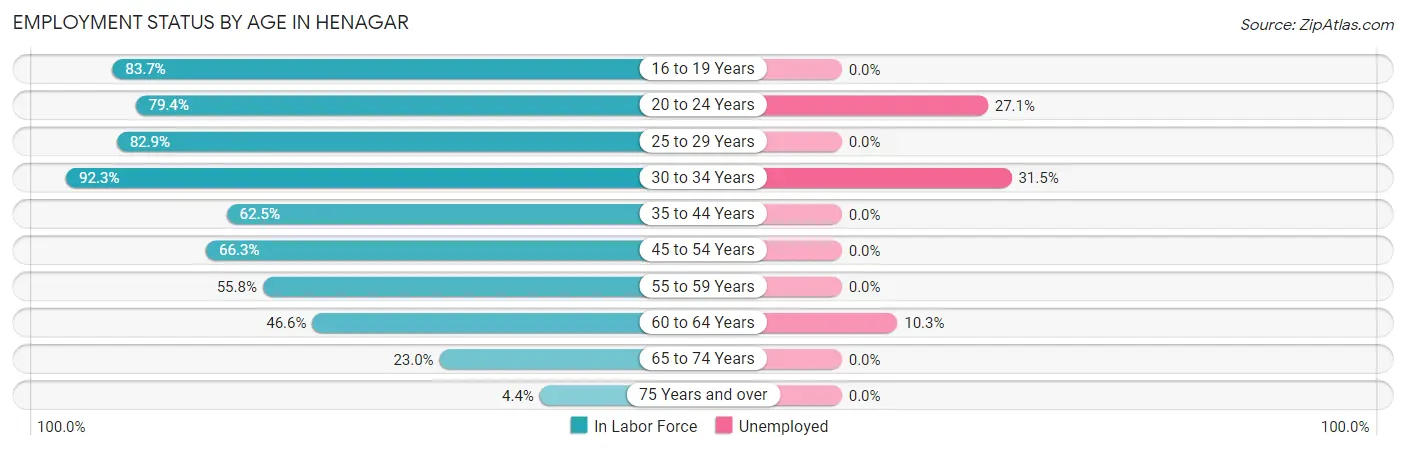
| Age Bracket | In Labor Force | Unemployed |
| 16 to 19 Years | 36 (83.7%) | 0 (0.0%) |
| 20 to 24 Years | 85 (79.4%) | 23 (27.1%) |
| 25 to 29 Years | 131 (82.9%) | 0 (0.0%) |
| 30 to 34 Years | 203 (92.3%) | 64 (31.5%) |
| 35 to 44 Years | 150 (62.5%) | 0 (0.0%) |
| 45 to 54 Years | 199 (66.3%) | 0 (0.0%) |
| 55 to 59 Years | 115 (55.8%) | 0 (0.0%) |
| 60 to 64 Years | 116 (46.6%) | 12 (10.3%) |
| 65 to 74 Years | 56 (23.0%) | 0 (0.0%) |
| 75 Years and over | 6 (4.4%) | 0 (0.0%) |
| Total | 1,096 (57.6%) | 99 (9.0%) |
Employment Status by Educational Attainment in Henagar
According to labor force statistics for Henagar, 66.6% of individuals (914) out of the total population between 25 and 64 years of age (1,373) are in the labor force, with 8.3% or 76 of them being unemployed. The group with the highest labor force participation rate are those with the educational attainment of college / associate degree, with 79.8% or 351 individuals in the labor force. Within the labor force, individuals with high school diploma education have the highest percentage of unemployment, with 14.1% or 54 of them being unemployed.
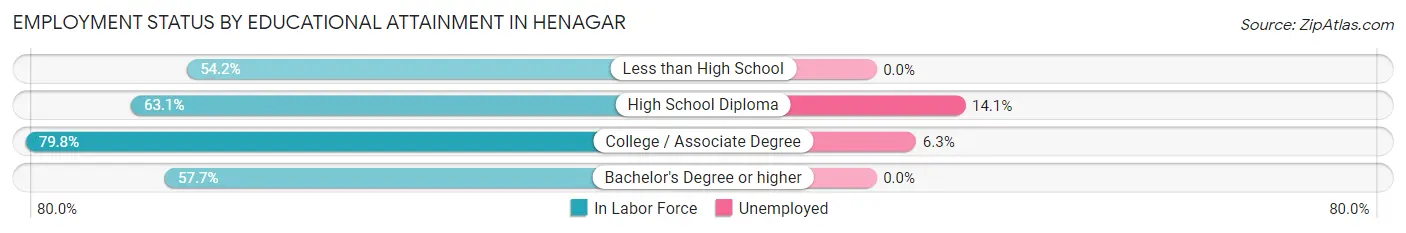
| Educational Attainment | In Labor Force | Unemployed |
| Less than High School | 123 (54.2%) | 0 (0.0%) |
| High School Diploma | 384 (63.1%) | 86 (14.1%) |
| College / Associate Degree | 351 (79.8%) | 28 (6.3%) |
| Bachelor's Degree or higher | 56 (57.7%) | 0 (0.0%) |
| Total | 914 (66.6%) | 114 (8.3%) |
Employment Occupations by Sex in Henagar
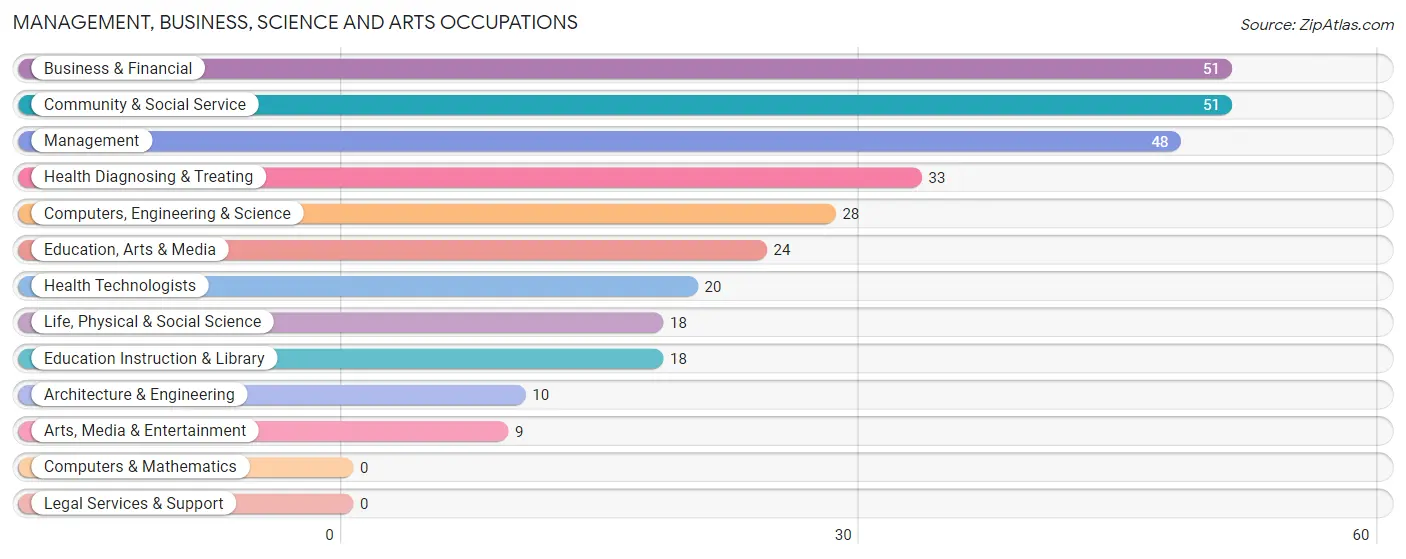
Management, Business, Science and Arts Occupations
The most common Management, Business, Science and Arts occupations in Henagar are Business & Financial (51 | 5.1%), Community & Social Service (51 | 5.1%), Management (48 | 4.8%), Health Diagnosing & Treating (33 | 3.3%), and Computers, Engineering & Science (28 | 2.8%).
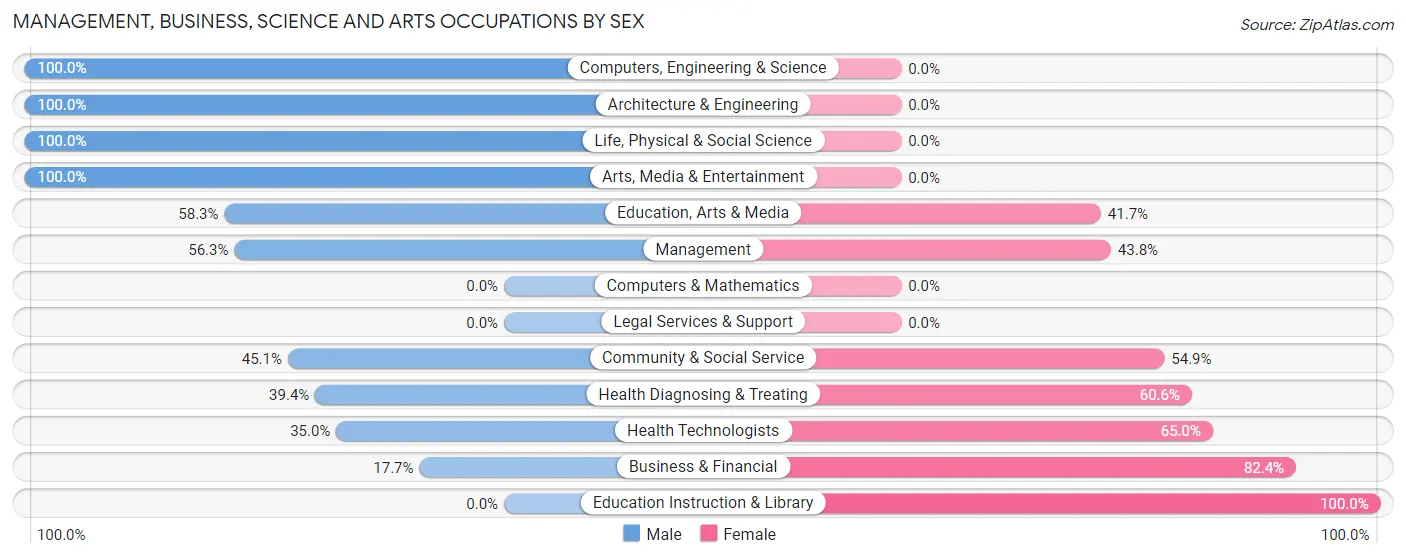
Management, Business, Science and Arts Occupations by Sex
Within the Management, Business, Science and Arts occupations in Henagar, the most male-oriented occupations are Computers, Engineering & Science (100.0%), Architecture & Engineering (100.0%), and Life, Physical & Social Science (100.0%), while the most female-oriented occupations are Education Instruction & Library (100.0%), Business & Financial (82.4%), and Health Technologists (65.0%).
| Occupation | Male | Female |
| Management | 27 (56.2%) | 21 (43.8%) |
| Business & Financial | 9 (17.6%) | 42 (82.4%) |
| Computers, Engineering & Science | 28 (100.0%) | 0 (0.0%) |
| Computers & Mathematics | 0 (0.0%) | 0 (0.0%) |
| Architecture & Engineering | 10 (100.0%) | 0 (0.0%) |
| Life, Physical & Social Science | 18 (100.0%) | 0 (0.0%) |
| Community & Social Service | 23 (45.1%) | 28 (54.9%) |
| Education, Arts & Media | 14 (58.3%) | 10 (41.7%) |
| Legal Services & Support | 0 (0.0%) | 0 (0.0%) |
| Education Instruction & Library | 0 (0.0%) | 18 (100.0%) |
| Arts, Media & Entertainment | 9 (100.0%) | 0 (0.0%) |
| Health Diagnosing & Treating | 13 (39.4%) | 20 (60.6%) |
| Health Technologists | 7 (35.0%) | 13 (65.0%) |
| Total (Category) | 100 (47.4%) | 111 (52.6%) |
| Total (Overall) | 604 (60.5%) | 394 (39.5%) |
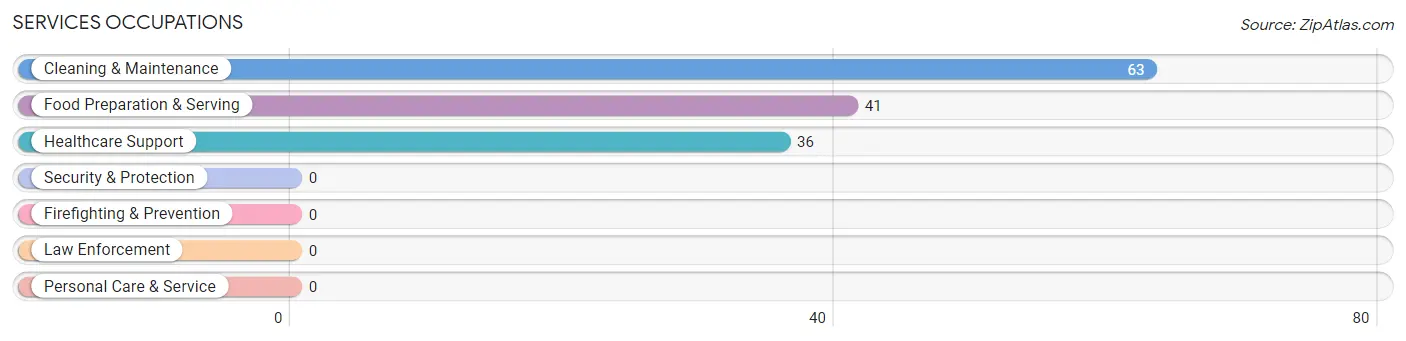
Services Occupations
The most common Services occupations in Henagar are Cleaning & Maintenance (63 | 6.3%), Food Preparation & Serving (41 | 4.1%), and Healthcare Support (36 | 3.6%).
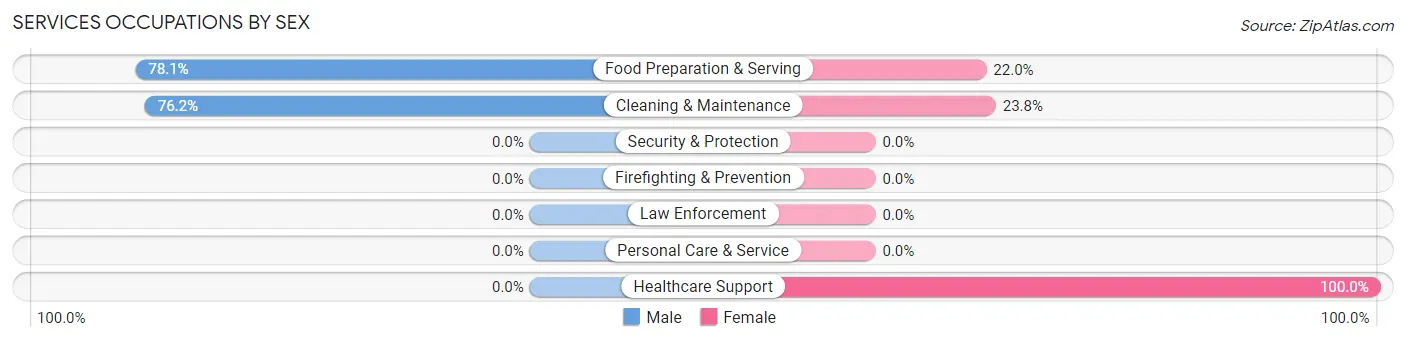
Services Occupations by Sex
Within the Services occupations in Henagar, the most male-oriented occupations are Food Preparation & Serving (78.0%), and Cleaning & Maintenance (76.2%), while the most female-oriented occupations are Healthcare Support (100.0%), Cleaning & Maintenance (23.8%), and Food Preparation & Serving (22.0%).
| Occupation | Male | Female |
| Healthcare Support | 0 (0.0%) | 36 (100.0%) |
| Security & Protection | 0 (0.0%) | 0 (0.0%) |
| Firefighting & Prevention | 0 (0.0%) | 0 (0.0%) |
| Law Enforcement | 0 (0.0%) | 0 (0.0%) |
| Food Preparation & Serving | 32 (78.0%) | 9 (22.0%) |
| Cleaning & Maintenance | 48 (76.2%) | 15 (23.8%) |
| Personal Care & Service | 0 (0.0%) | 0 (0.0%) |
| Total (Category) | 80 (57.1%) | 60 (42.9%) |
| Total (Overall) | 604 (60.5%) | 394 (39.5%) |
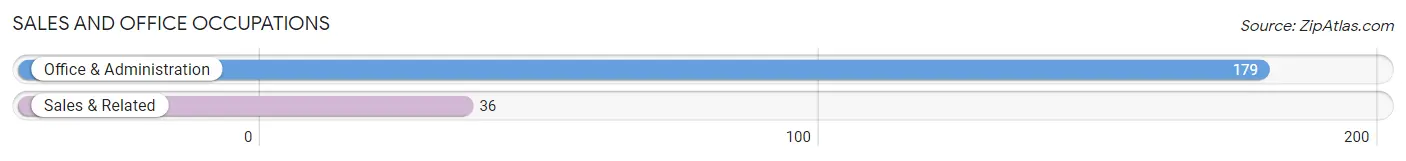
Sales and Office Occupations
The most common Sales and Office occupations in Henagar are Office & Administration (179 | 17.9%), and Sales & Related (36 | 3.6%).
Sales and Office Occupations by Sex
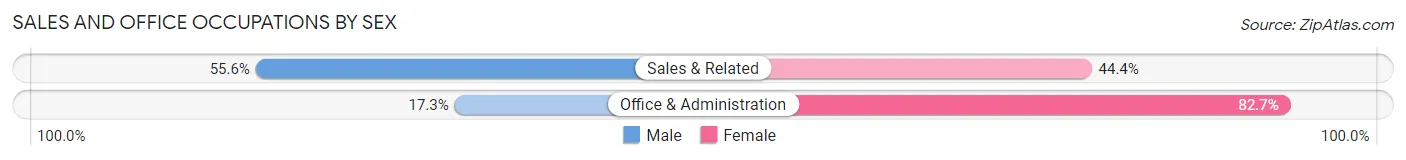
| Occupation | Male | Female |
| Sales & Related | 20 (55.6%) | 16 (44.4%) |
| Office & Administration | 31 (17.3%) | 148 (82.7%) |
| Total (Category) | 51 (23.7%) | 164 (76.3%) |
| Total (Overall) | 604 (60.5%) | 394 (39.5%) |
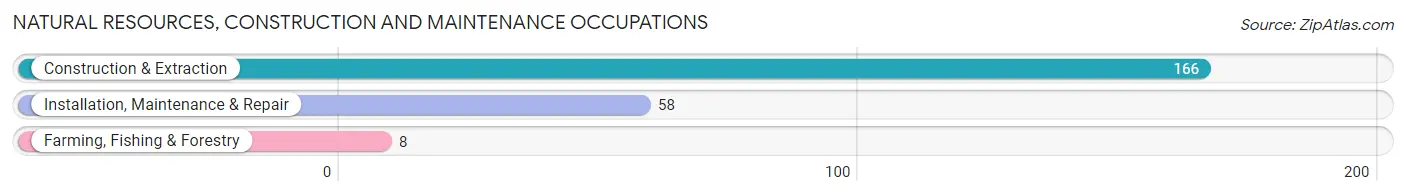
Natural Resources, Construction and Maintenance Occupations
The most common Natural Resources, Construction and Maintenance occupations in Henagar are Construction & Extraction (166 | 16.6%), Installation, Maintenance & Repair (58 | 5.8%), and Farming, Fishing & Forestry (8 | 0.8%).
Natural Resources, Construction and Maintenance Occupations by Sex
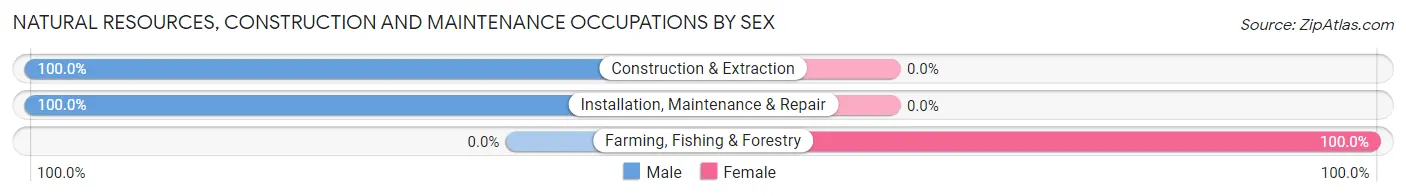
| Occupation | Male | Female |
| Farming, Fishing & Forestry | 0 (0.0%) | 8 (100.0%) |
| Construction & Extraction | 166 (100.0%) | 0 (0.0%) |
| Installation, Maintenance & Repair | 58 (100.0%) | 0 (0.0%) |
| Total (Category) | 224 (96.6%) | 8 (3.5%) |
| Total (Overall) | 604 (60.5%) | 394 (39.5%) |
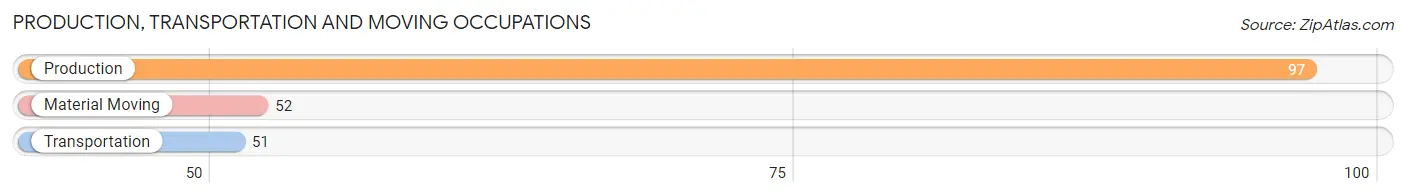
Production, Transportation and Moving Occupations
The most common Production, Transportation and Moving occupations in Henagar are Production (97 | 9.7%), Material Moving (52 | 5.2%), and Transportation (51 | 5.1%).
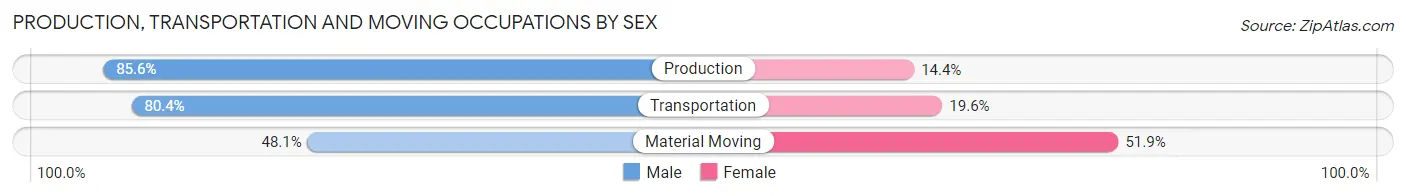
Production, Transportation and Moving Occupations by Sex
| Occupation | Male | Female |
| Production | 83 (85.6%) | 14 (14.4%) |
| Transportation | 41 (80.4%) | 10 (19.6%) |
| Material Moving | 25 (48.1%) | 27 (51.9%) |
| Total (Category) | 149 (74.5%) | 51 (25.5%) |
| Total (Overall) | 604 (60.5%) | 394 (39.5%) |
Employment Industries by Sex in Henagar
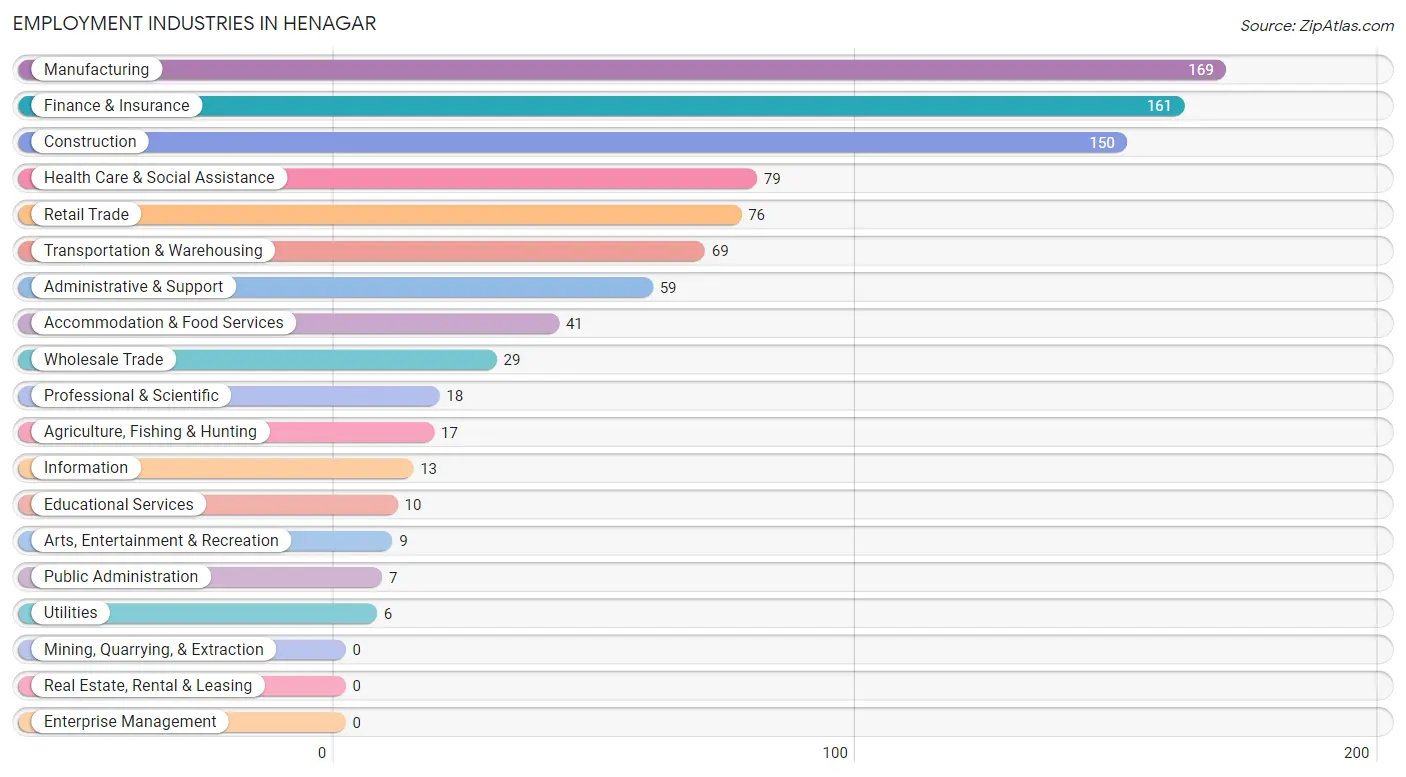
Employment Industries in Henagar
The major employment industries in Henagar include Manufacturing (169 | 16.9%), Finance & Insurance (161 | 16.1%), Construction (150 | 15.0%), Health Care & Social Assistance (79 | 7.9%), and Retail Trade (76 | 7.6%).
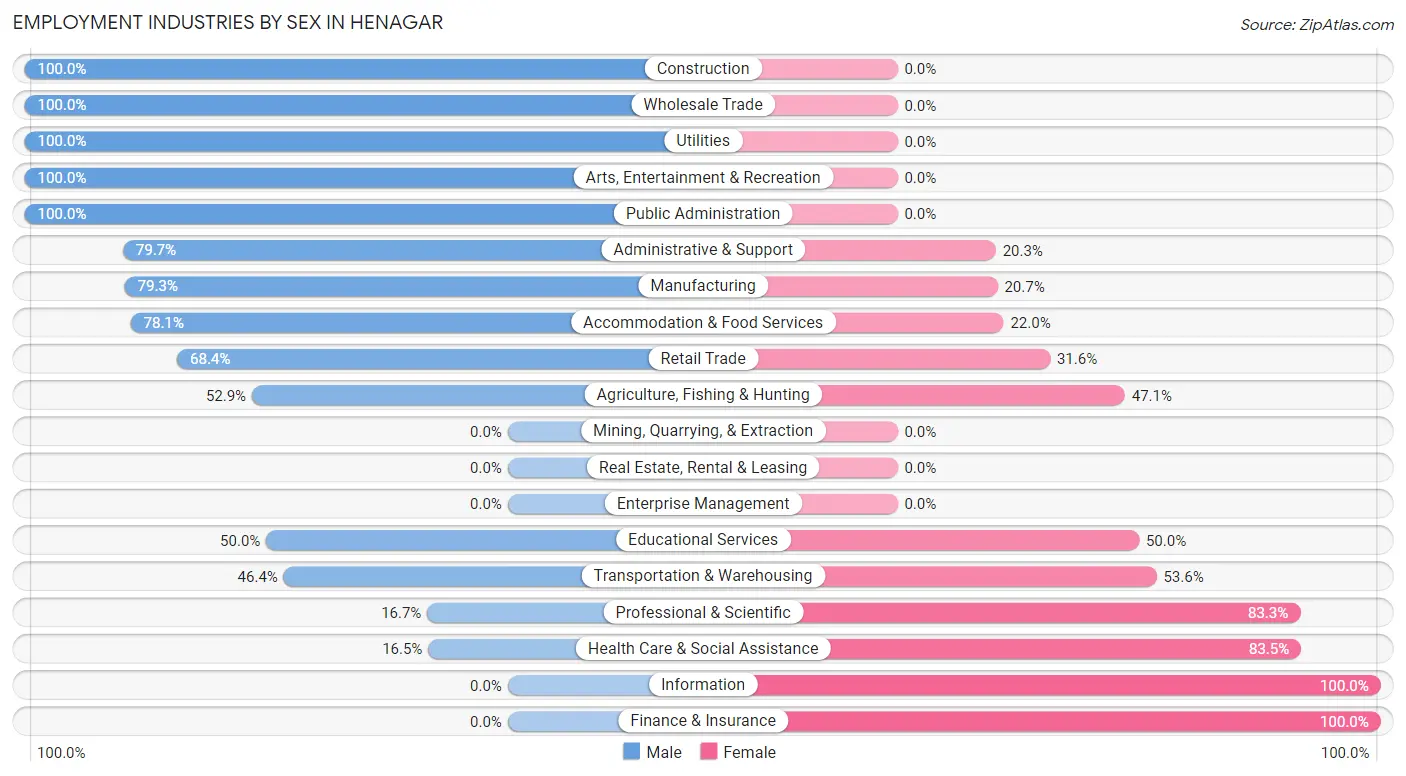
Employment Industries by Sex in Henagar
The Henagar industries that see more men than women are Construction (100.0%), Wholesale Trade (100.0%), and Utilities (100.0%), whereas the industries that tend to have a higher number of women are Information (100.0%), Finance & Insurance (100.0%), and Health Care & Social Assistance (83.5%).
| Industry | Male | Female |
| Agriculture, Fishing & Hunting | 9 (52.9%) | 8 (47.1%) |
| Mining, Quarrying, & Extraction | 0 (0.0%) | 0 (0.0%) |
| Construction | 150 (100.0%) | 0 (0.0%) |
| Manufacturing | 134 (79.3%) | 35 (20.7%) |
| Wholesale Trade | 29 (100.0%) | 0 (0.0%) |
| Retail Trade | 52 (68.4%) | 24 (31.6%) |
| Transportation & Warehousing | 32 (46.4%) | 37 (53.6%) |
| Utilities | 6 (100.0%) | 0 (0.0%) |
| Information | 0 (0.0%) | 13 (100.0%) |
| Finance & Insurance | 0 (0.0%) | 161 (100.0%) |
| Real Estate, Rental & Leasing | 0 (0.0%) | 0 (0.0%) |
| Professional & Scientific | 3 (16.7%) | 15 (83.3%) |
| Enterprise Management | 0 (0.0%) | 0 (0.0%) |
| Administrative & Support | 47 (79.7%) | 12 (20.3%) |
| Educational Services | 5 (50.0%) | 5 (50.0%) |
| Health Care & Social Assistance | 13 (16.5%) | 66 (83.5%) |
| Arts, Entertainment & Recreation | 9 (100.0%) | 0 (0.0%) |
| Accommodation & Food Services | 32 (78.0%) | 9 (22.0%) |
| Public Administration | 7 (100.0%) | 0 (0.0%) |
| Total | 604 (60.5%) | 394 (39.5%) |
Education in Henagar
School Enrollment in Henagar
The most common levels of schooling among the 596 students in Henagar are elementary school (246 | 41.3%), middle school (160 | 26.9%), and college / undergraduate (81 | 13.6%).
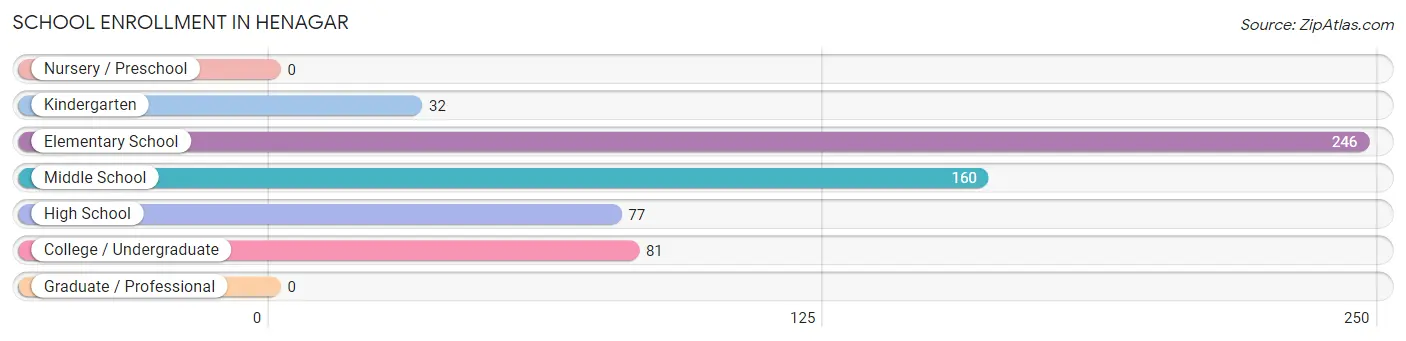
| School Level | # Students | % Students |
| Nursery / Preschool | 0 | 0.0% |
| Kindergarten | 32 | 5.4% |
| Elementary School | 246 | 41.3% |
| Middle School | 160 | 26.9% |
| High School | 77 | 12.9% |
| College / Undergraduate | 81 | 13.6% |
| Graduate / Professional | 0 | 0.0% |
| Total | 596 | 100.0% |
School Enrollment by Age by Funding Source in Henagar
Out of a total of 596 students who are enrolled in schools in Henagar, 141 (23.7%) attend a private institution, while the remaining 455 (76.3%) are enrolled in public schools. The age group of 10 to 14 year olds has the highest likelihood of being enrolled in private schools, with 90 (41.7% in the age bracket) enrolled. Conversely, the age group of 18 to 19 year olds has the lowest likelihood of being enrolled in a private school, with 9 (100.0% in the age bracket) attending a public institution.
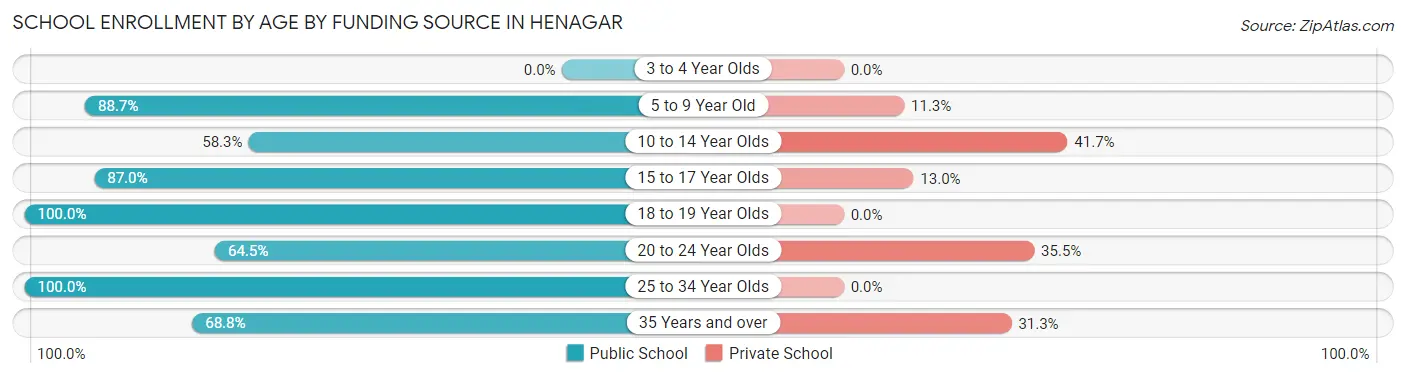
| Age Bracket | Public School | Private School |
| 3 to 4 Year Olds | 0 (0.0%) | 0 (0.0%) |
| 5 to 9 Year Old | 197 (88.7%) | 25 (11.3%) |
| 10 to 14 Year Olds | 126 (58.3%) | 90 (41.7%) |
| 15 to 17 Year Olds | 67 (87.0%) | 10 (13.0%) |
| 18 to 19 Year Olds | 9 (100.0%) | 0 (0.0%) |
| 20 to 24 Year Olds | 20 (64.5%) | 11 (35.5%) |
| 25 to 34 Year Olds | 25 (100.0%) | 0 (0.0%) |
| 35 Years and over | 11 (68.8%) | 5 (31.2%) |
| Total | 455 (76.3%) | 141 (23.7%) |
Educational Attainment by Field of Study in Henagar
Education (43 | 33.1%), liberal arts & history (28 | 21.5%), science & technology (21 | 16.2%), arts & humanities (18 | 13.9%), and psychology (15 | 11.5%) are the most common fields of study among 130 individuals in Henagar who have obtained a bachelor's degree or higher.
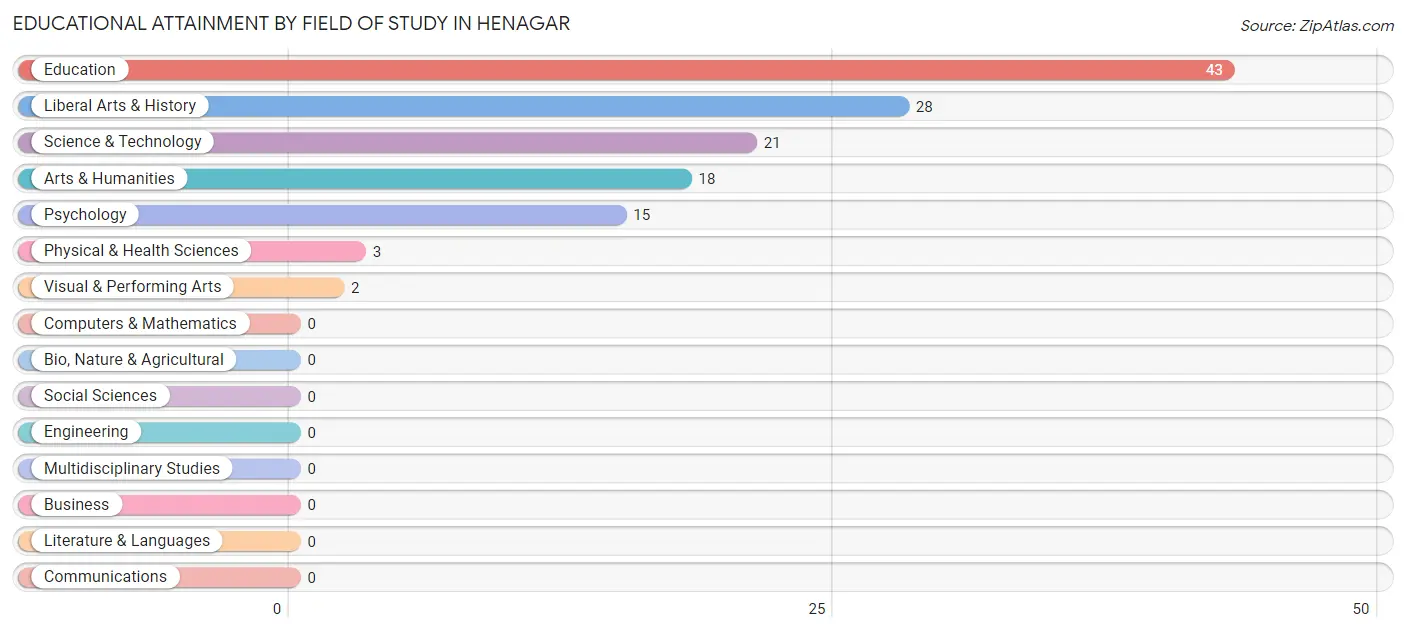
| Field of Study | # Graduates | % Graduates |
| Computers & Mathematics | 0 | 0.0% |
| Bio, Nature & Agricultural | 0 | 0.0% |
| Physical & Health Sciences | 3 | 2.3% |
| Psychology | 15 | 11.5% |
| Social Sciences | 0 | 0.0% |
| Engineering | 0 | 0.0% |
| Multidisciplinary Studies | 0 | 0.0% |
| Science & Technology | 21 | 16.2% |
| Business | 0 | 0.0% |
| Education | 43 | 33.1% |
| Literature & Languages | 0 | 0.0% |
| Liberal Arts & History | 28 | 21.5% |
| Visual & Performing Arts | 2 | 1.5% |
| Communications | 0 | 0.0% |
| Arts & Humanities | 18 | 13.9% |
| Total | 130 | 100.0% |
Transportation & Commute in Henagar
Vehicle Availability by Sex in Henagar
The most prevalent vehicle ownership categories in Henagar are males with 3 vehicles (245, accounting for 42.9%) and females with 3 vehicles (143, making up 66.4%).
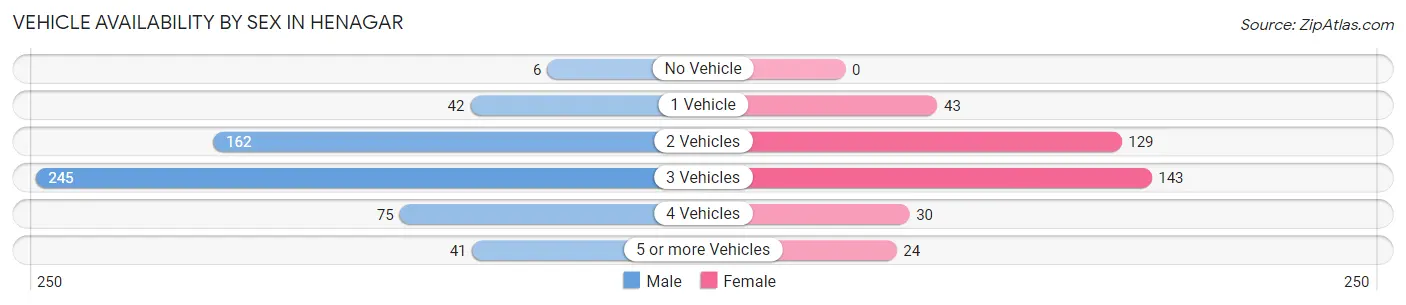
| Vehicles Available | Male | Female |
| No Vehicle | 6 (1.1%) | 0 (0.0%) |
| 1 Vehicle | 42 (7.4%) | 43 (11.7%) |
| 2 Vehicles | 162 (28.4%) | 129 (35.0%) |
| 3 Vehicles | 245 (42.9%) | 143 (38.8%) |
| 4 Vehicles | 75 (13.1%) | 30 (8.1%) |
| 5 or more Vehicles | 41 (7.2%) | 24 (6.5%) |
| Total | 571 (100.0%) | 369 (100.0%) |
Commute Time in Henagar
The most frequently occuring commute durations in Henagar are 15 to 19 minutes (139 commuters, 16.1%), 30 to 34 minutes (118 commuters, 13.6%), and 25 to 29 minutes (105 commuters, 12.1%).
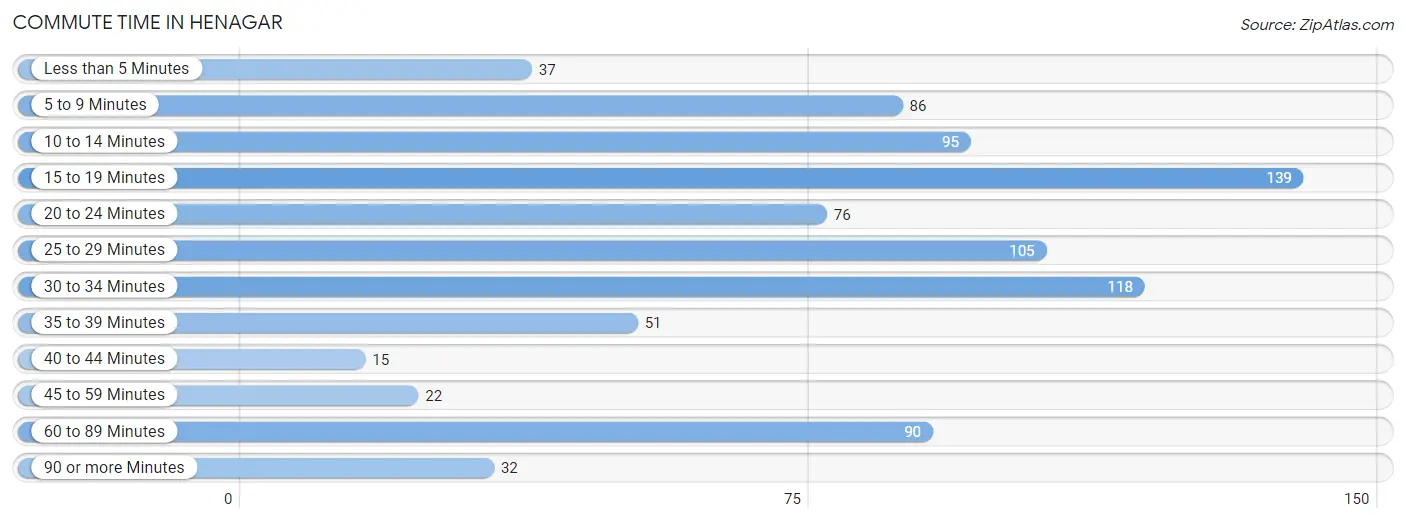
| Commute Time | # Commuters | % Commuters |
| Less than 5 Minutes | 37 | 4.3% |
| 5 to 9 Minutes | 86 | 9.9% |
| 10 to 14 Minutes | 95 | 11.0% |
| 15 to 19 Minutes | 139 | 16.1% |
| 20 to 24 Minutes | 76 | 8.8% |
| 25 to 29 Minutes | 105 | 12.1% |
| 30 to 34 Minutes | 118 | 13.6% |
| 35 to 39 Minutes | 51 | 5.9% |
| 40 to 44 Minutes | 15 | 1.7% |
| 45 to 59 Minutes | 22 | 2.5% |
| 60 to 89 Minutes | 90 | 10.4% |
| 90 or more Minutes | 32 | 3.7% |
Commute Time by Sex in Henagar
The most common commute times in Henagar are 60 to 89 minutes (90 commuters, 17.3%) for males and 15 to 19 minutes (100 commuters, 28.8%) for females.
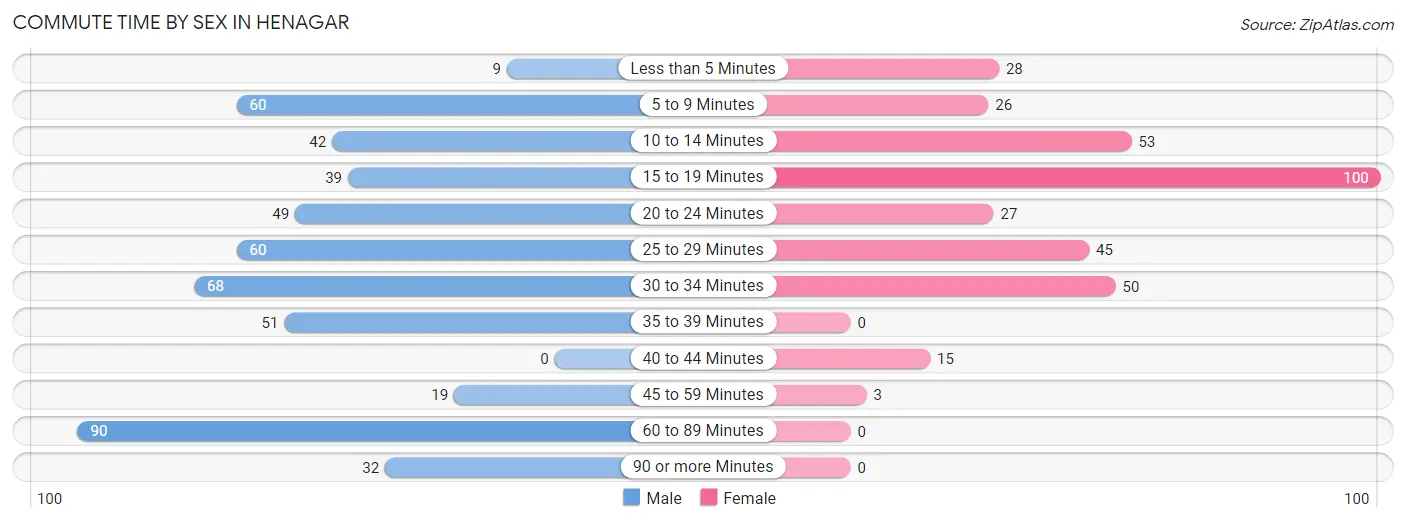
| Commute Time | Male | Female |
| Less than 5 Minutes | 9 (1.7%) | 28 (8.1%) |
| 5 to 9 Minutes | 60 (11.6%) | 26 (7.5%) |
| 10 to 14 Minutes | 42 (8.1%) | 53 (15.3%) |
| 15 to 19 Minutes | 39 (7.5%) | 100 (28.8%) |
| 20 to 24 Minutes | 49 (9.4%) | 27 (7.8%) |
| 25 to 29 Minutes | 60 (11.6%) | 45 (13.0%) |
| 30 to 34 Minutes | 68 (13.1%) | 50 (14.4%) |
| 35 to 39 Minutes | 51 (9.8%) | 0 (0.0%) |
| 40 to 44 Minutes | 0 (0.0%) | 15 (4.3%) |
| 45 to 59 Minutes | 19 (3.7%) | 3 (0.9%) |
| 60 to 89 Minutes | 90 (17.3%) | 0 (0.0%) |
| 90 or more Minutes | 32 (6.2%) | 0 (0.0%) |
Time of Departure to Work by Sex in Henagar
The most frequent times of departure to work in Henagar are 6:00 AM to 6:29 AM (114, 22.0%) for males and 6:30 AM to 6:59 AM (93, 26.8%) for females.
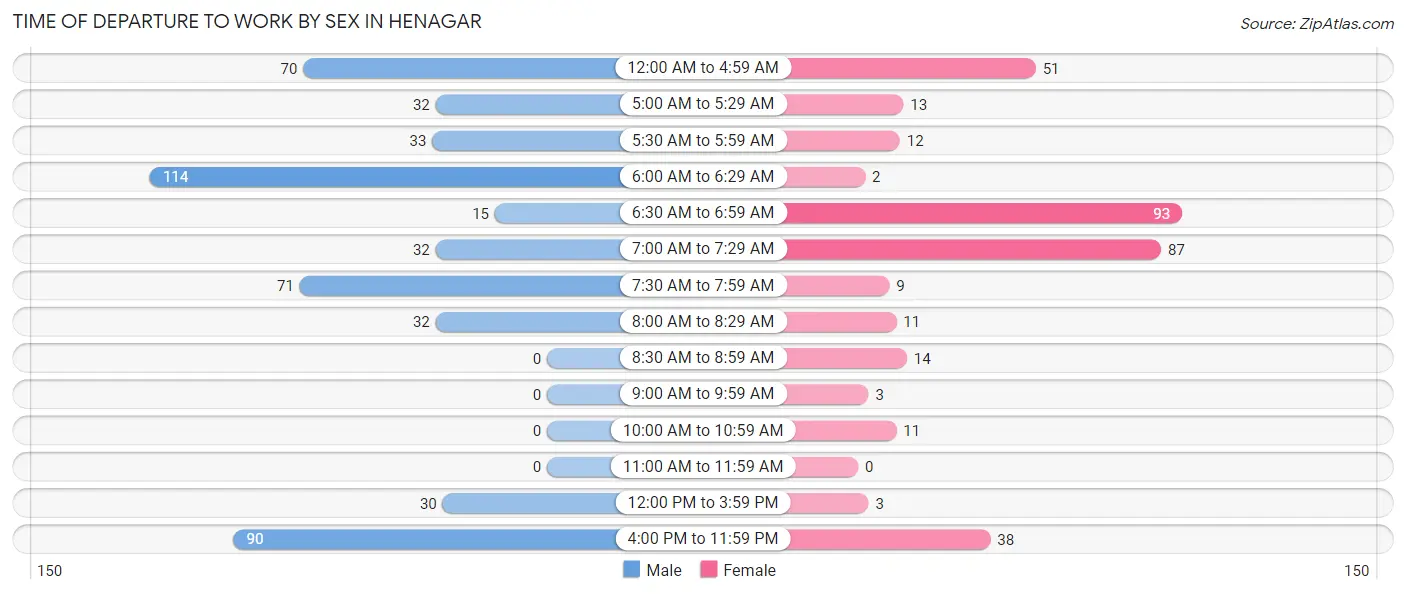
| Time of Departure | Male | Female |
| 12:00 AM to 4:59 AM | 70 (13.5%) | 51 (14.7%) |
| 5:00 AM to 5:29 AM | 32 (6.2%) | 13 (3.7%) |
| 5:30 AM to 5:59 AM | 33 (6.4%) | 12 (3.5%) |
| 6:00 AM to 6:29 AM | 114 (22.0%) | 2 (0.6%) |
| 6:30 AM to 6:59 AM | 15 (2.9%) | 93 (26.8%) |
| 7:00 AM to 7:29 AM | 32 (6.2%) | 87 (25.1%) |
| 7:30 AM to 7:59 AM | 71 (13.7%) | 9 (2.6%) |
| 8:00 AM to 8:29 AM | 32 (6.2%) | 11 (3.2%) |
| 8:30 AM to 8:59 AM | 0 (0.0%) | 14 (4.0%) |
| 9:00 AM to 9:59 AM | 0 (0.0%) | 3 (0.9%) |
| 10:00 AM to 10:59 AM | 0 (0.0%) | 11 (3.2%) |
| 11:00 AM to 11:59 AM | 0 (0.0%) | 0 (0.0%) |
| 12:00 PM to 3:59 PM | 30 (5.8%) | 3 (0.9%) |
| 4:00 PM to 11:59 PM | 90 (17.3%) | 38 (11.0%) |
| Total | 519 (100.0%) | 347 (100.0%) |
Housing Occupancy in Henagar
Occupancy by Ownership in Henagar
Of the total 855 dwellings in Henagar, owner-occupied units account for 629 (73.6%), while renter-occupied units make up 226 (26.4%).
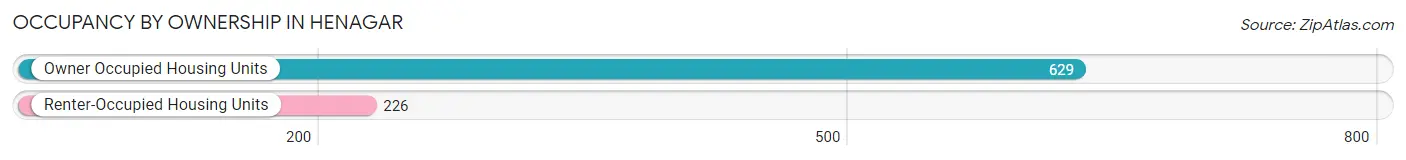
| Occupancy | # Housing Units | % Housing Units |
| Owner Occupied Housing Units | 629 | 73.6% |
| Renter-Occupied Housing Units | 226 | 26.4% |
| Total Occupied Housing Units | 855 | 100.0% |
Occupancy by Household Size in Henagar
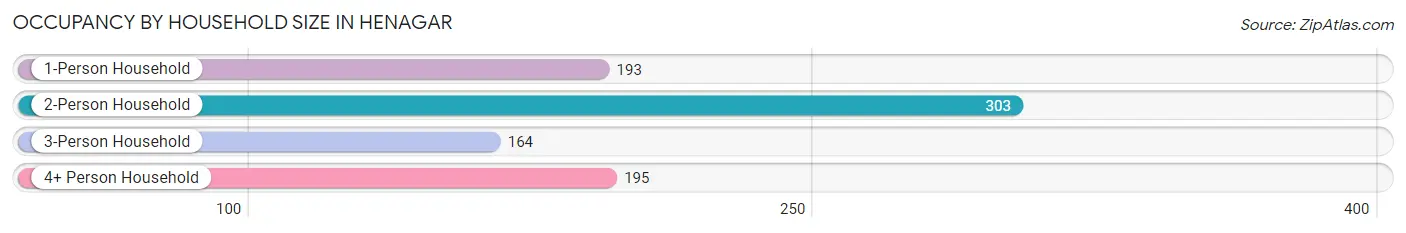
| Household Size | # Housing Units | % Housing Units |
| 1-Person Household | 193 | 22.6% |
| 2-Person Household | 303 | 35.4% |
| 3-Person Household | 164 | 19.2% |
| 4+ Person Household | 195 | 22.8% |
| Total Housing Units | 855 | 100.0% |
Occupancy by Ownership by Household Size in Henagar
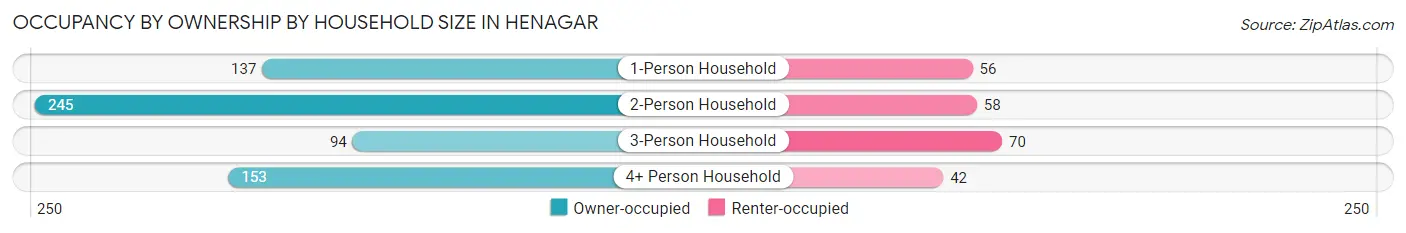
| Household Size | Owner-occupied | Renter-occupied |
| 1-Person Household | 137 (71.0%) | 56 (29.0%) |
| 2-Person Household | 245 (80.9%) | 58 (19.1%) |
| 3-Person Household | 94 (57.3%) | 70 (42.7%) |
| 4+ Person Household | 153 (78.5%) | 42 (21.5%) |
| Total Housing Units | 629 (73.6%) | 226 (26.4%) |
Occupancy by Educational Attainment in Henagar
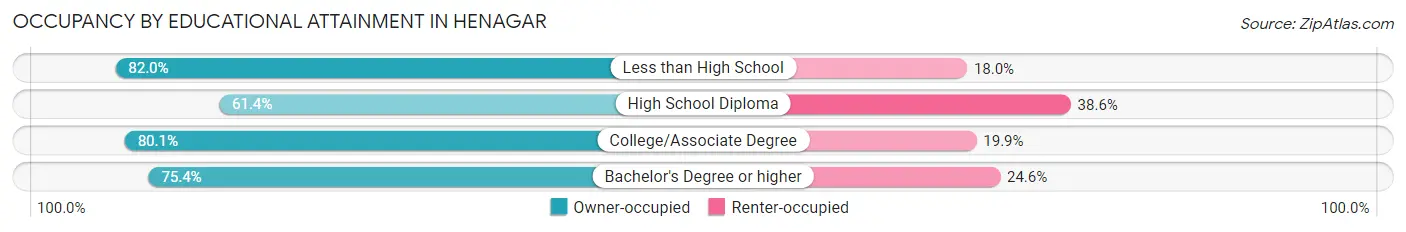
| Household Size | Owner-occupied | Renter-occupied |
| Less than High School | 164 (82.0%) | 36 (18.0%) |
| High School Diploma | 188 (61.4%) | 118 (38.6%) |
| College/Associate Degree | 234 (80.1%) | 58 (19.9%) |
| Bachelor's Degree or higher | 43 (75.4%) | 14 (24.6%) |
Occupancy by Age of Householder in Henagar
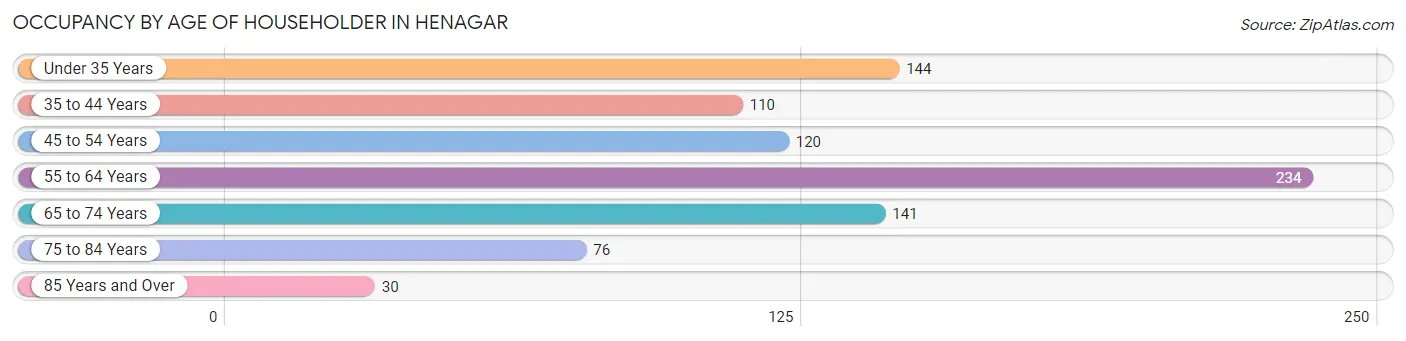
| Age Bracket | # Households | % Households |
| Under 35 Years | 144 | 16.8% |
| 35 to 44 Years | 110 | 12.9% |
| 45 to 54 Years | 120 | 14.0% |
| 55 to 64 Years | 234 | 27.4% |
| 65 to 74 Years | 141 | 16.5% |
| 75 to 84 Years | 76 | 8.9% |
| 85 Years and Over | 30 | 3.5% |
| Total | 855 | 100.0% |
Housing Finances in Henagar
Median Income by Occupancy in Henagar
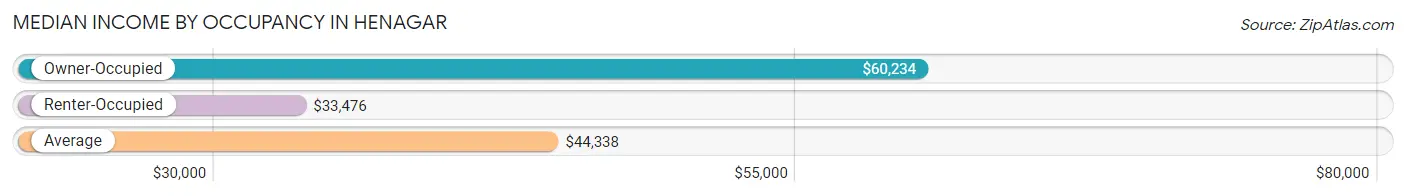
| Occupancy Type | # Households | Median Income |
| Owner-Occupied | 629 (73.6%) | $60,234 |
| Renter-Occupied | 226 (26.4%) | $33,476 |
| Average | 855 (100.0%) | $44,338 |
Occupancy by Householder Income Bracket in Henagar
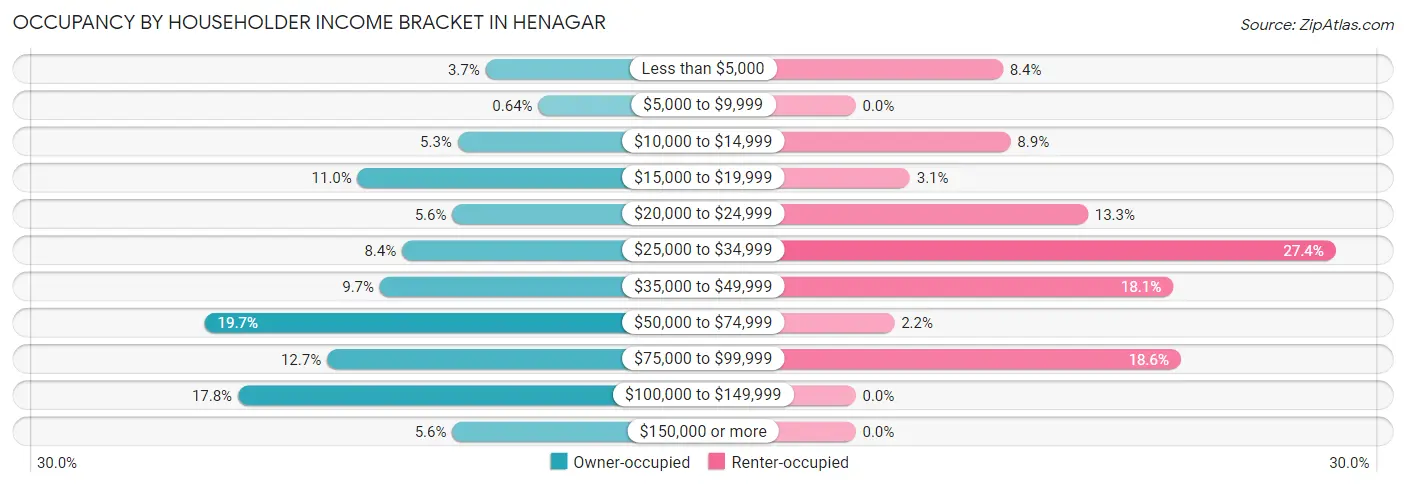
| Income Bracket | Owner-occupied | Renter-occupied |
| Less than $5,000 | 23 (3.7%) | 19 (8.4%) |
| $5,000 to $9,999 | 4 (0.6%) | 0 (0.0%) |
| $10,000 to $14,999 | 33 (5.2%) | 20 (8.8%) |
| $15,000 to $19,999 | 69 (11.0%) | 7 (3.1%) |
| $20,000 to $24,999 | 35 (5.6%) | 30 (13.3%) |
| $25,000 to $34,999 | 53 (8.4%) | 62 (27.4%) |
| $35,000 to $49,999 | 61 (9.7%) | 41 (18.1%) |
| $50,000 to $74,999 | 124 (19.7%) | 5 (2.2%) |
| $75,000 to $99,999 | 80 (12.7%) | 42 (18.6%) |
| $100,000 to $149,999 | 112 (17.8%) | 0 (0.0%) |
| $150,000 or more | 35 (5.6%) | 0 (0.0%) |
| Total | 629 (100.0%) | 226 (100.0%) |
Monthly Housing Cost Tiers in Henagar
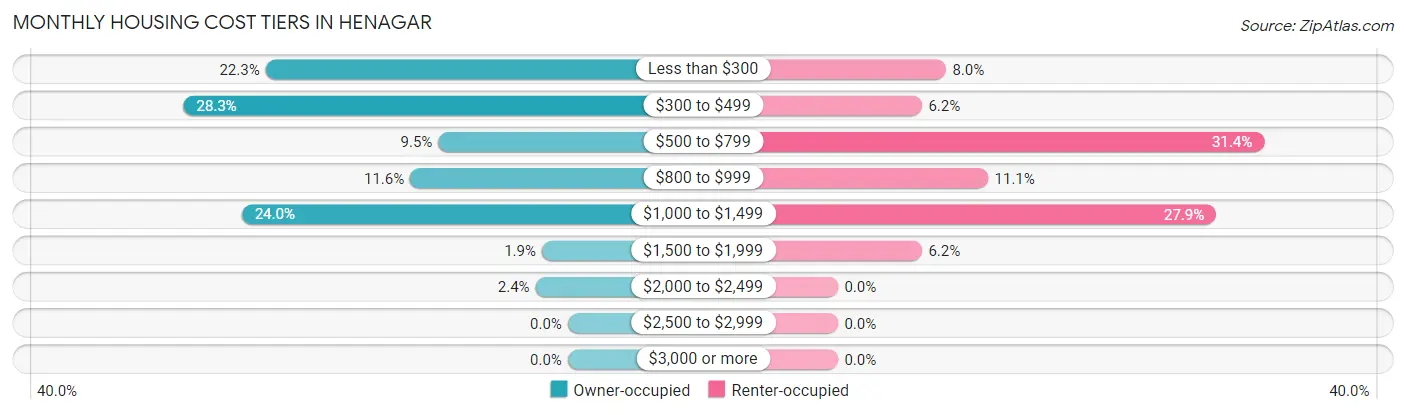
| Monthly Cost | Owner-occupied | Renter-occupied |
| Less than $300 | 140 (22.3%) | 18 (8.0%) |
| $300 to $499 | 178 (28.3%) | 14 (6.2%) |
| $500 to $799 | 60 (9.5%) | 71 (31.4%) |
| $800 to $999 | 73 (11.6%) | 25 (11.1%) |
| $1,000 to $1,499 | 151 (24.0%) | 63 (27.9%) |
| $1,500 to $1,999 | 12 (1.9%) | 14 (6.2%) |
| $2,000 to $2,499 | 15 (2.4%) | 0 (0.0%) |
| $2,500 to $2,999 | 0 (0.0%) | 0 (0.0%) |
| $3,000 or more | 0 (0.0%) | 0 (0.0%) |
| Total | 629 (100.0%) | 226 (100.0%) |
Physical Housing Characteristics in Henagar
Housing Structures in Henagar
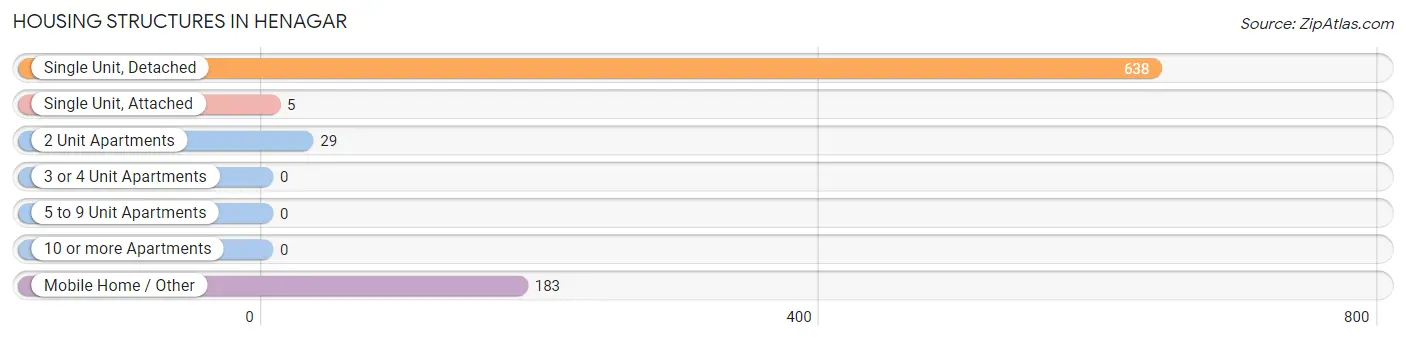
| Structure Type | # Housing Units | % Housing Units |
| Single Unit, Detached | 638 | 74.6% |
| Single Unit, Attached | 5 | 0.6% |
| 2 Unit Apartments | 29 | 3.4% |
| 3 or 4 Unit Apartments | 0 | 0.0% |
| 5 to 9 Unit Apartments | 0 | 0.0% |
| 10 or more Apartments | 0 | 0.0% |
| Mobile Home / Other | 183 | 21.4% |
| Total | 855 | 100.0% |
Housing Structures by Occupancy in Henagar
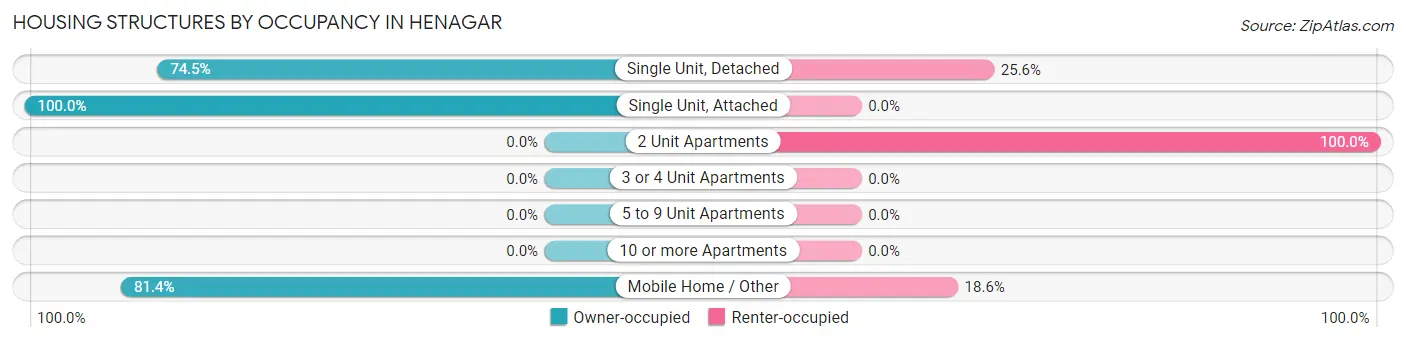
| Structure Type | Owner-occupied | Renter-occupied |
| Single Unit, Detached | 475 (74.5%) | 163 (25.6%) |
| Single Unit, Attached | 5 (100.0%) | 0 (0.0%) |
| 2 Unit Apartments | 0 (0.0%) | 29 (100.0%) |
| 3 or 4 Unit Apartments | 0 (0.0%) | 0 (0.0%) |
| 5 to 9 Unit Apartments | 0 (0.0%) | 0 (0.0%) |
| 10 or more Apartments | 0 (0.0%) | 0 (0.0%) |
| Mobile Home / Other | 149 (81.4%) | 34 (18.6%) |
| Total | 629 (73.6%) | 226 (26.4%) |
Housing Structures by Number of Rooms in Henagar
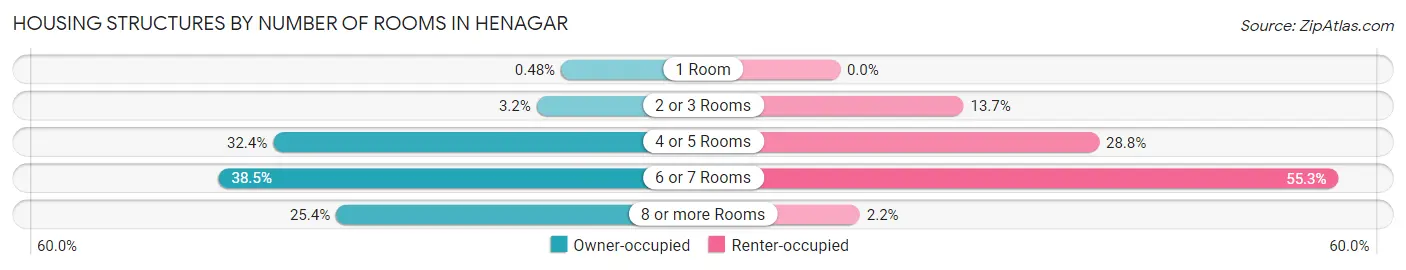
| Number of Rooms | Owner-occupied | Renter-occupied |
| 1 Room | 3 (0.5%) | 0 (0.0%) |
| 2 or 3 Rooms | 20 (3.2%) | 31 (13.7%) |
| 4 or 5 Rooms | 204 (32.4%) | 65 (28.8%) |
| 6 or 7 Rooms | 242 (38.5%) | 125 (55.3%) |
| 8 or more Rooms | 160 (25.4%) | 5 (2.2%) |
| Total | 629 (100.0%) | 226 (100.0%) |
Housing Structure by Heating Type in Henagar
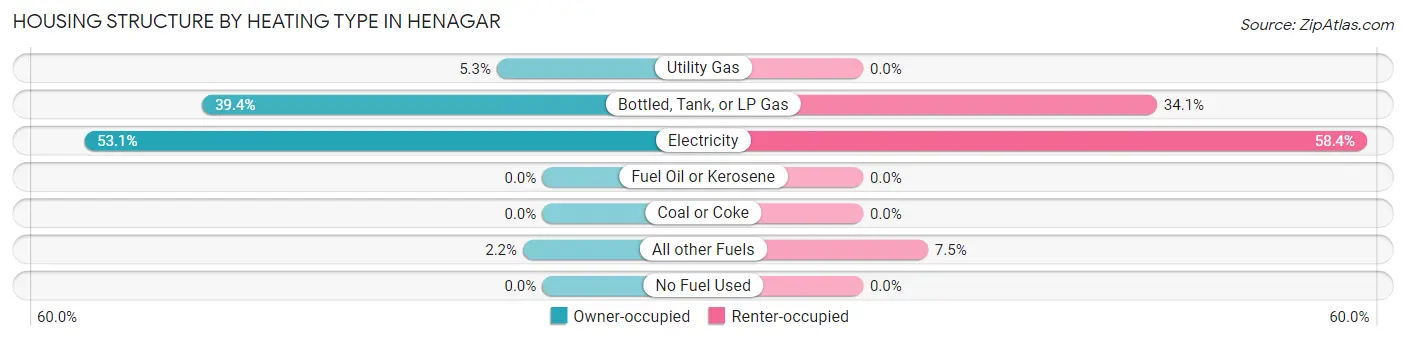
| Heating Type | Owner-occupied | Renter-occupied |
| Utility Gas | 33 (5.2%) | 0 (0.0%) |
| Bottled, Tank, or LP Gas | 248 (39.4%) | 77 (34.1%) |
| Electricity | 334 (53.1%) | 132 (58.4%) |
| Fuel Oil or Kerosene | 0 (0.0%) | 0 (0.0%) |
| Coal or Coke | 0 (0.0%) | 0 (0.0%) |
| All other Fuels | 14 (2.2%) | 17 (7.5%) |
| No Fuel Used | 0 (0.0%) | 0 (0.0%) |
| Total | 629 (100.0%) | 226 (100.0%) |
Household Vehicle Usage in Henagar
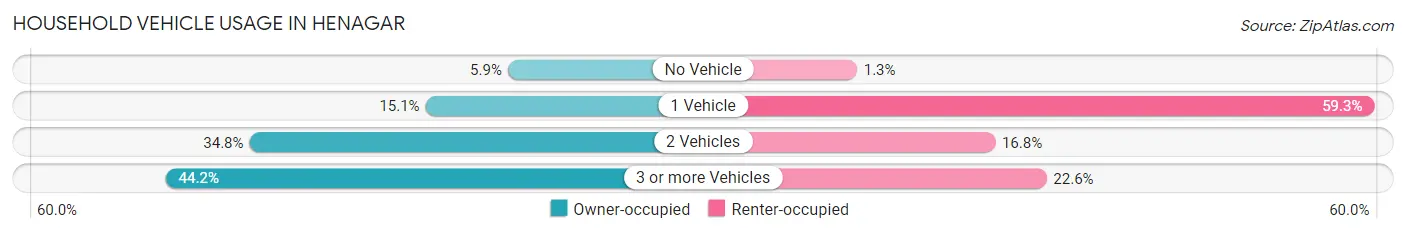
| Vehicles per Household | Owner-occupied | Renter-occupied |
| No Vehicle | 37 (5.9%) | 3 (1.3%) |
| 1 Vehicle | 95 (15.1%) | 134 (59.3%) |
| 2 Vehicles | 219 (34.8%) | 38 (16.8%) |
| 3 or more Vehicles | 278 (44.2%) | 51 (22.6%) |
| Total | 629 (100.0%) | 226 (100.0%) |
Real Estate & Mortgages in Henagar
Real Estate and Mortgage Overview in Henagar
| Characteristic | Without Mortgage | With Mortgage |
| Housing Units | 361 | 268 |
| Median Property Value | $81,400 | $156,000 |
| Median Household Income | $32,083 | $6 |
| Monthly Housing Costs | $337 | $0 |
| Real Estate Taxes | $311 | $28 |
Property Value by Mortgage Status in Henagar
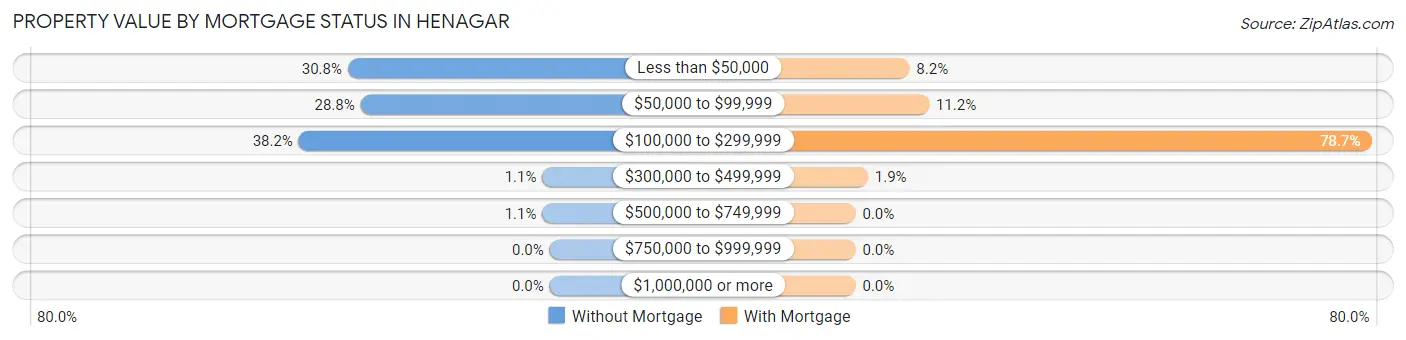
| Property Value | Without Mortgage | With Mortgage |
| Less than $50,000 | 111 (30.7%) | 22 (8.2%) |
| $50,000 to $99,999 | 104 (28.8%) | 30 (11.2%) |
| $100,000 to $299,999 | 138 (38.2%) | 211 (78.7%) |
| $300,000 to $499,999 | 4 (1.1%) | 5 (1.9%) |
| $500,000 to $749,999 | 4 (1.1%) | 0 (0.0%) |
| $750,000 to $999,999 | 0 (0.0%) | 0 (0.0%) |
| $1,000,000 or more | 0 (0.0%) | 0 (0.0%) |
| Total | 361 (100.0%) | 268 (100.0%) |
Household Income by Mortgage Status in Henagar
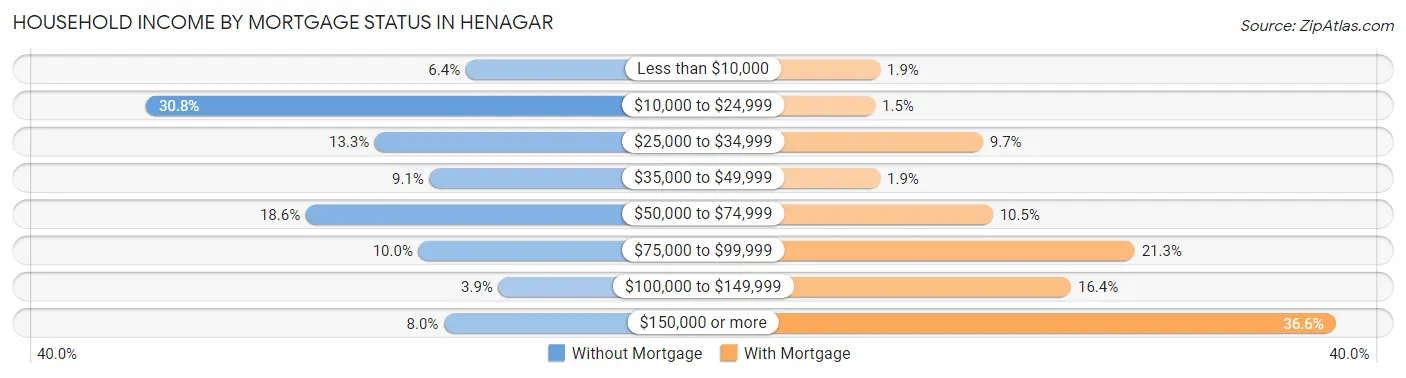
| Household Income | Without Mortgage | With Mortgage |
| Less than $10,000 | 23 (6.4%) | 5 (1.9%) |
| $10,000 to $24,999 | 111 (30.7%) | 4 (1.5%) |
| $25,000 to $34,999 | 48 (13.3%) | 26 (9.7%) |
| $35,000 to $49,999 | 33 (9.1%) | 5 (1.9%) |
| $50,000 to $74,999 | 67 (18.6%) | 28 (10.4%) |
| $75,000 to $99,999 | 36 (10.0%) | 57 (21.3%) |
| $100,000 to $149,999 | 14 (3.9%) | 44 (16.4%) |
| $150,000 or more | 29 (8.0%) | 98 (36.6%) |
| Total | 361 (100.0%) | 268 (100.0%) |
Property Value to Household Income Ratio in Henagar
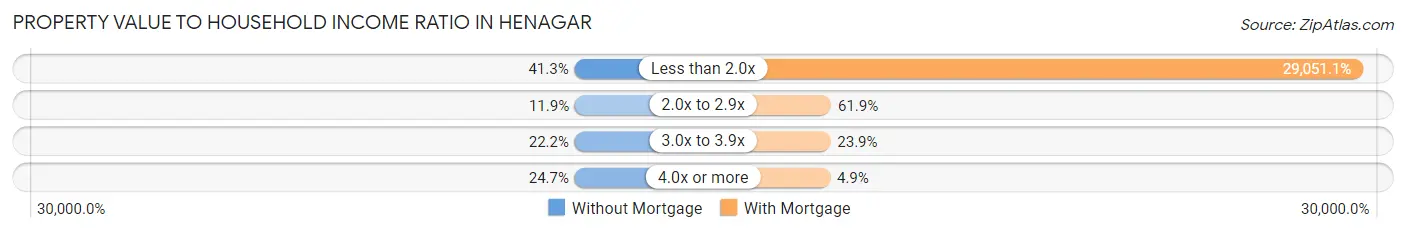
| Value-to-Income Ratio | Without Mortgage | With Mortgage |
| Less than 2.0x | 149 (41.3%) | 77,857 (29,051.1%) |
| 2.0x to 2.9x | 43 (11.9%) | 166 (61.9%) |
| 3.0x to 3.9x | 80 (22.2%) | 64 (23.9%) |
| 4.0x or more | 89 (24.6%) | 13 (4.9%) |
| Total | 361 (100.0%) | 268 (100.0%) |
Real Estate Taxes by Mortgage Status in Henagar
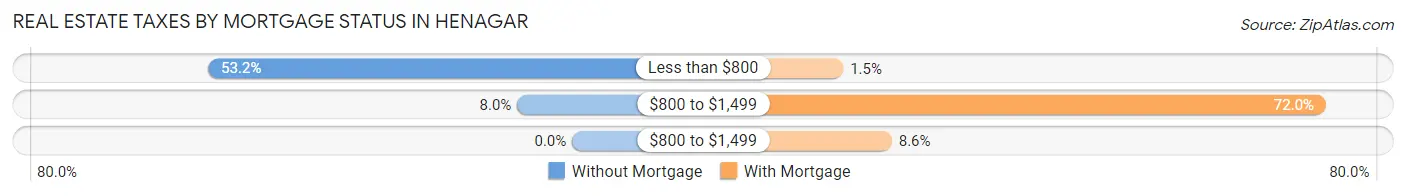
| Property Taxes | Without Mortgage | With Mortgage |
| Less than $800 | 192 (53.2%) | 4 (1.5%) |
| $800 to $1,499 | 29 (8.0%) | 193 (72.0%) |
| $800 to $1,499 | 0 (0.0%) | 23 (8.6%) |
| Total | 361 (100.0%) | 268 (100.0%) |
Health & Disability in Henagar
Health Insurance Coverage by Age in Henagar
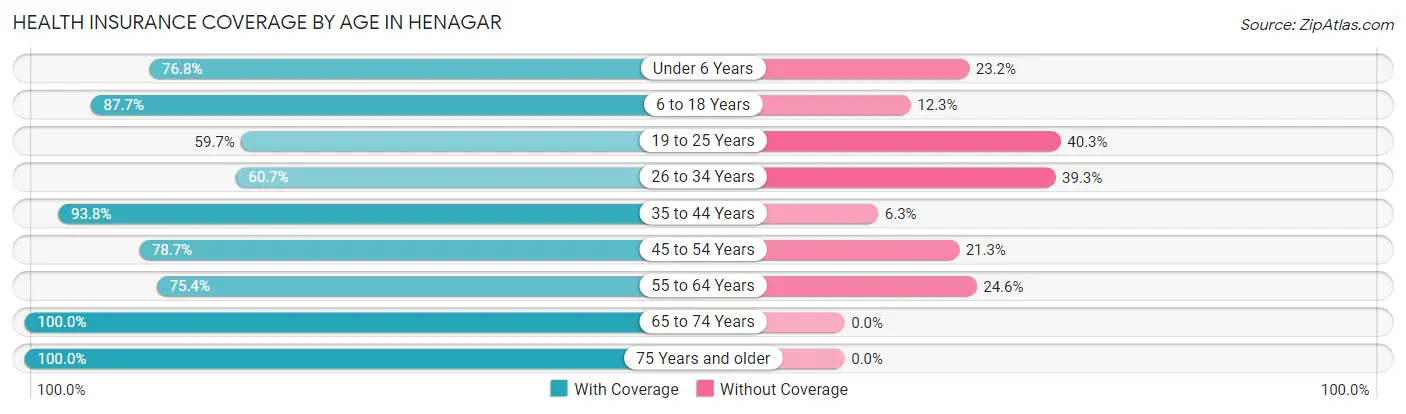
| Age Bracket | With Coverage | Without Coverage |
| Under 6 Years | 119 (76.8%) | 36 (23.2%) |
| 6 to 18 Years | 477 (87.7%) | 67 (12.3%) |
| 19 to 25 Years | 83 (59.7%) | 56 (40.3%) |
| 26 to 34 Years | 210 (60.7%) | 136 (39.3%) |
| 35 to 44 Years | 225 (93.8%) | 15 (6.2%) |
| 45 to 54 Years | 236 (78.7%) | 64 (21.3%) |
| 55 to 64 Years | 343 (75.4%) | 112 (24.6%) |
| 65 to 74 Years | 243 (100.0%) | 0 (0.0%) |
| 75 Years and older | 137 (100.0%) | 0 (0.0%) |
| Total | 2,073 (81.0%) | 486 (19.0%) |
Health Insurance Coverage by Citizenship Status in Henagar
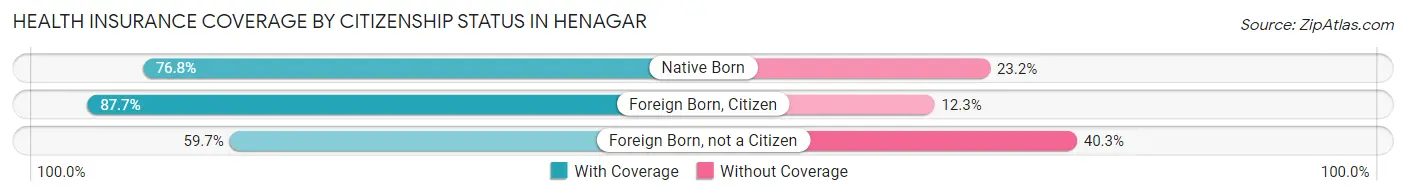
| Citizenship Status | With Coverage | Without Coverage |
| Native Born | 119 (76.8%) | 36 (23.2%) |
| Foreign Born, Citizen | 477 (87.7%) | 67 (12.3%) |
| Foreign Born, not a Citizen | 83 (59.7%) | 56 (40.3%) |
Health Insurance Coverage by Household Income in Henagar
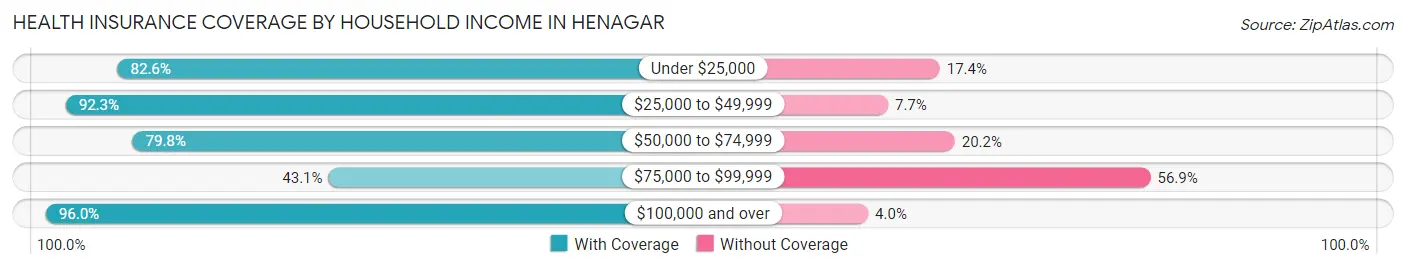
| Household Income | With Coverage | Without Coverage |
| Under $25,000 | 398 (82.6%) | 84 (17.4%) |
| $25,000 to $49,999 | 501 (92.3%) | 42 (7.7%) |
| $50,000 to $74,999 | 339 (79.8%) | 86 (20.2%) |
| $75,000 to $99,999 | 187 (43.1%) | 247 (56.9%) |
| $100,000 and over | 648 (96.0%) | 27 (4.0%) |
Public vs Private Health Insurance Coverage by Age in Henagar
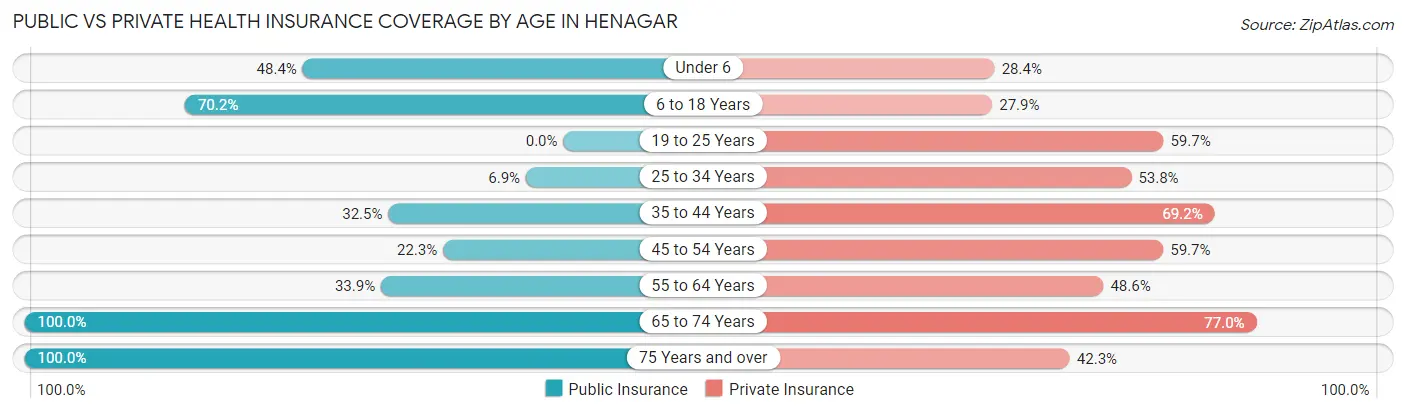
| Age Bracket | Public Insurance | Private Insurance |
| Under 6 | 75 (48.4%) | 44 (28.4%) |
| 6 to 18 Years | 382 (70.2%) | 152 (27.9%) |
| 19 to 25 Years | 0 (0.0%) | 83 (59.7%) |
| 25 to 34 Years | 24 (6.9%) | 186 (53.8%) |
| 35 to 44 Years | 78 (32.5%) | 166 (69.2%) |
| 45 to 54 Years | 67 (22.3%) | 179 (59.7%) |
| 55 to 64 Years | 154 (33.9%) | 221 (48.6%) |
| 65 to 74 Years | 243 (100.0%) | 187 (76.9%) |
| 75 Years and over | 137 (100.0%) | 58 (42.3%) |
| Total | 1,160 (45.3%) | 1,276 (49.9%) |
Disability Status by Sex by Age in Henagar
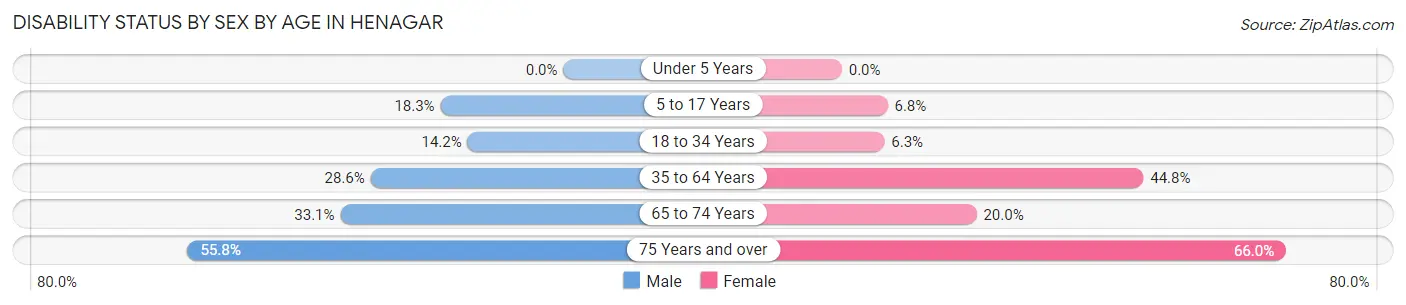
| Age Bracket | Male | Female |
| Under 5 Years | 0 (0.0%) | 0 (0.0%) |
| 5 to 17 Years | 50 (18.2%) | 18 (6.8%) |
| 18 to 34 Years | 32 (14.2%) | 17 (6.3%) |
| 35 to 64 Years | 148 (28.6%) | 214 (44.8%) |
| 65 to 74 Years | 49 (33.1%) | 19 (20.0%) |
| 75 Years and over | 24 (55.8%) | 62 (66.0%) |
Disability Class by Sex by Age in Henagar
Disability Class: Hearing Difficulty
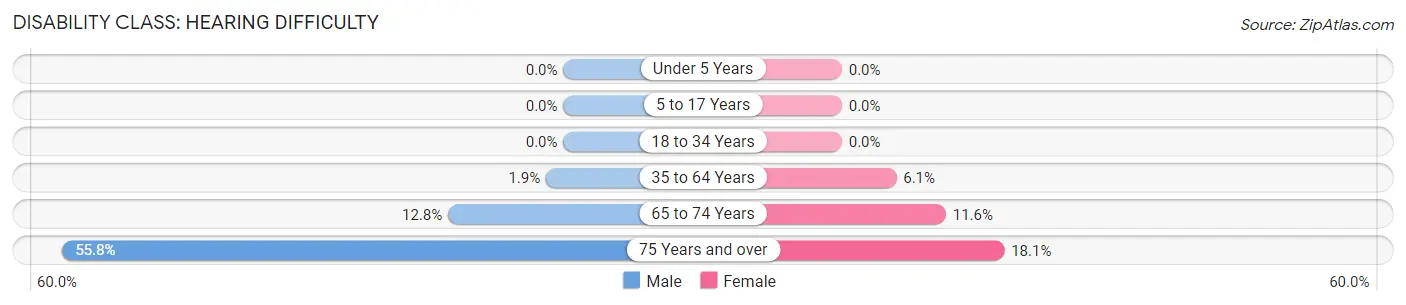
| Age Bracket | Male | Female |
| Under 5 Years | 0 (0.0%) | 0 (0.0%) |
| 5 to 17 Years | 0 (0.0%) | 0 (0.0%) |
| 18 to 34 Years | 0 (0.0%) | 0 (0.0%) |
| 35 to 64 Years | 10 (1.9%) | 29 (6.1%) |
| 65 to 74 Years | 19 (12.8%) | 11 (11.6%) |
| 75 Years and over | 24 (55.8%) | 17 (18.1%) |
Disability Class: Vision Difficulty
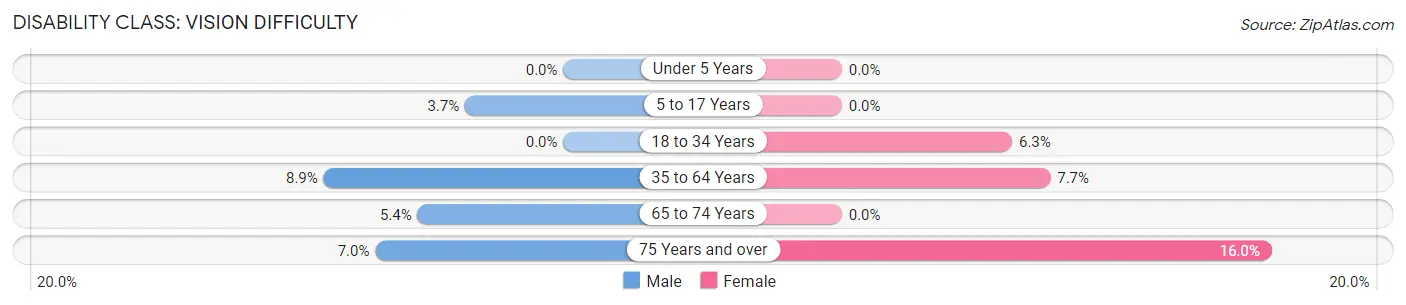
| Age Bracket | Male | Female |
| Under 5 Years | 0 (0.0%) | 0 (0.0%) |
| 5 to 17 Years | 10 (3.6%) | 0 (0.0%) |
| 18 to 34 Years | 0 (0.0%) | 17 (6.3%) |
| 35 to 64 Years | 46 (8.9%) | 37 (7.7%) |
| 65 to 74 Years | 8 (5.4%) | 0 (0.0%) |
| 75 Years and over | 3 (7.0%) | 15 (16.0%) |
Disability Class: Cognitive Difficulty
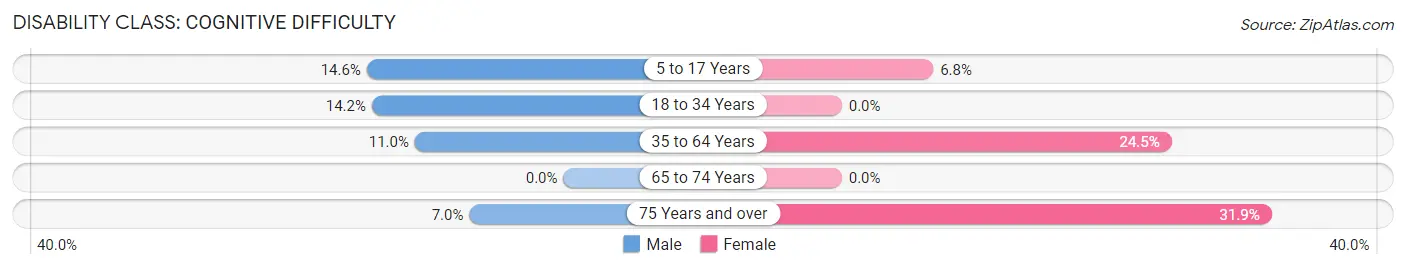
| Age Bracket | Male | Female |
| 5 to 17 Years | 40 (14.6%) | 18 (6.8%) |
| 18 to 34 Years | 32 (14.2%) | 0 (0.0%) |
| 35 to 64 Years | 57 (11.0%) | 117 (24.5%) |
| 65 to 74 Years | 0 (0.0%) | 0 (0.0%) |
| 75 Years and over | 3 (7.0%) | 30 (31.9%) |
Disability Class: Ambulatory Difficulty
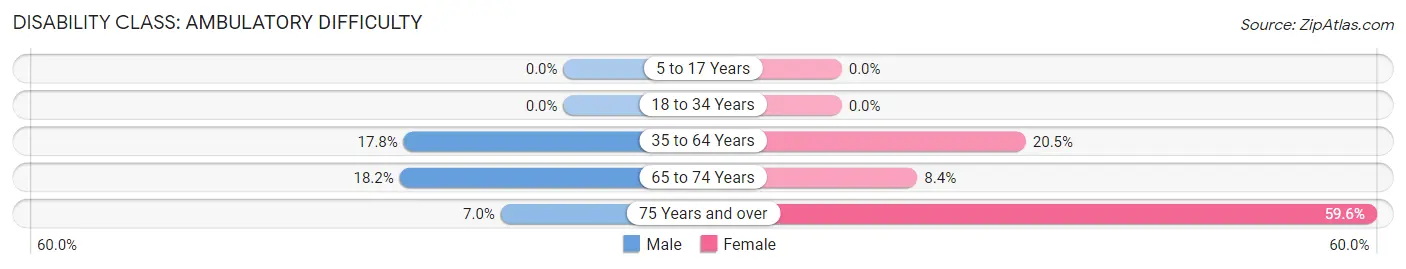
| Age Bracket | Male | Female |
| 5 to 17 Years | 0 (0.0%) | 0 (0.0%) |
| 18 to 34 Years | 0 (0.0%) | 0 (0.0%) |
| 35 to 64 Years | 92 (17.8%) | 98 (20.5%) |
| 65 to 74 Years | 27 (18.2%) | 8 (8.4%) |
| 75 Years and over | 3 (7.0%) | 56 (59.6%) |
Disability Class: Self-Care Difficulty
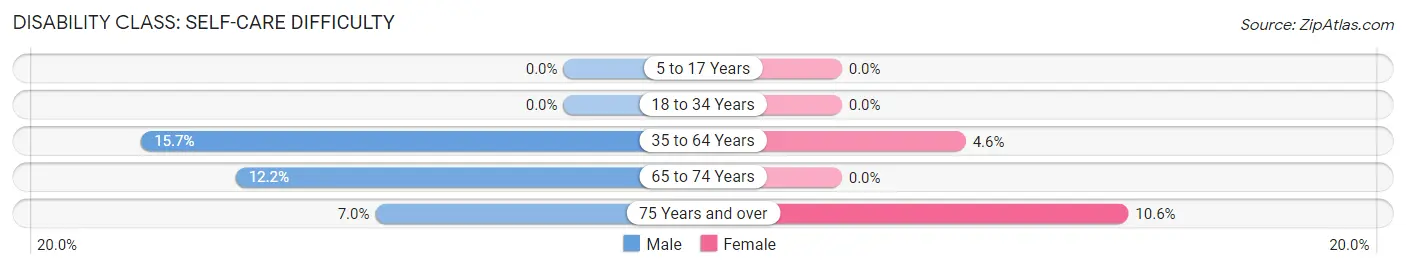
| Age Bracket | Male | Female |
| 5 to 17 Years | 0 (0.0%) | 0 (0.0%) |
| 18 to 34 Years | 0 (0.0%) | 0 (0.0%) |
| 35 to 64 Years | 81 (15.7%) | 22 (4.6%) |
| 65 to 74 Years | 18 (12.2%) | 0 (0.0%) |
| 75 Years and over | 3 (7.0%) | 10 (10.6%) |
Technology Access in Henagar
Computing Device Access in Henagar
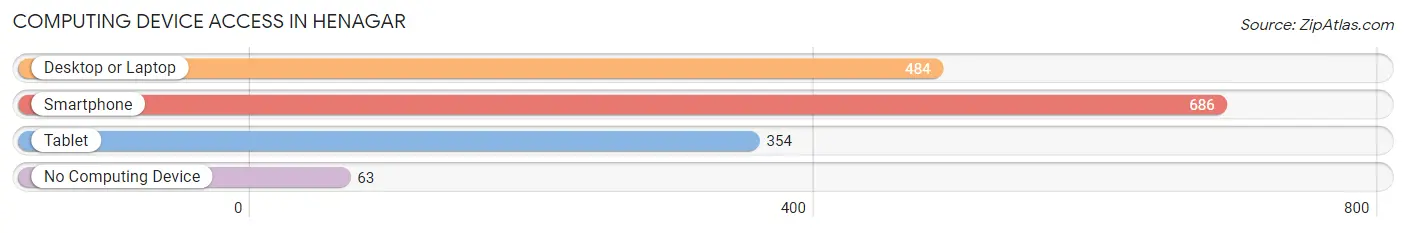
| Device Type | # Households | % Households |
| Desktop or Laptop | 484 | 56.6% |
| Smartphone | 686 | 80.2% |
| Tablet | 354 | 41.4% |
| No Computing Device | 63 | 7.4% |
| Total | 855 | 100.0% |
Internet Access in Henagar
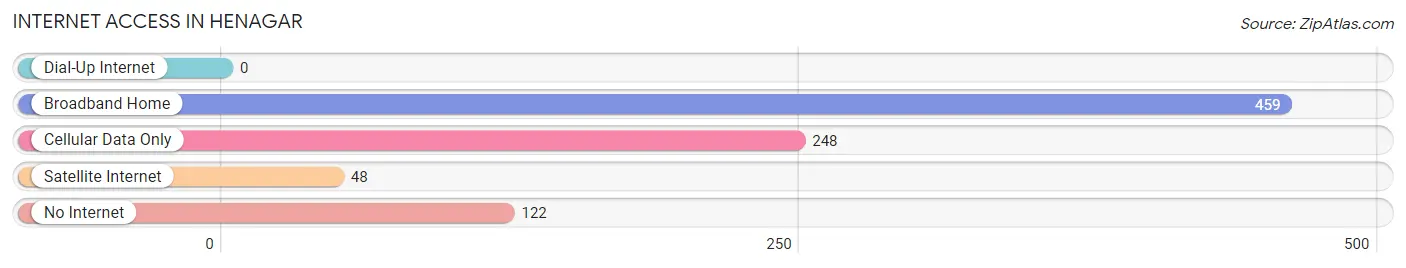
| Internet Type | # Households | % Households |
| Dial-Up Internet | 0 | 0.0% |
| Broadband Home | 459 | 53.7% |
| Cellular Data Only | 248 | 29.0% |
| Satellite Internet | 48 | 5.6% |
| No Internet | 122 | 14.3% |
| Total | 855 | 100.0% |
Henagar Summary
Introduction
Henagar is a small town located in DeKalb County, Alabama. It is situated in the foothills of the Appalachian Mountains and is home to a population of approximately 1,500 people. The town is known for its rural charm and its close proximity to the nearby cities of Fort Payne and Scottsboro. Henagar is a great place to live, work, and play, and its residents enjoy a variety of activities and attractions.
Geography
Henagar is located in the foothills of the Appalachian Mountains in DeKalb County, Alabama. The town is situated at the intersection of US Highway 11 and Alabama Highway 75. The town is surrounded by the towns of Fort Payne, Scottsboro, and Rainsville. The town is located in a valley, and the surrounding area is mostly rural. The town is located at an elevation of 890 feet above sea level.
The climate in Henagar is mild and humid. The average temperature in the summer is around 80 degrees Fahrenheit, and the average temperature in the winter is around 50 degrees Fahrenheit. The town receives an average of 48 inches of rain per year.
Economy
Henagar’s economy is largely based on agriculture and manufacturing. The town is home to several small businesses, including a grocery store, a hardware store, and a few restaurants. The town is also home to a number of small manufacturing companies, including a furniture factory and a textile mill.
The town is also home to a number of tourist attractions, including the Henagar Drive-In Theater, the Henagar Museum, and the Henagar Railroad Museum. The town is also home to a number of outdoor recreation areas, including the Henagar Nature Trail and the Henagar Wildlife Management Area.
Demographics
As of the 2010 census, the population of Henagar was 1,500. The racial makeup of the town was 97.3% White, 0.7% African American, 0.3% Native American, 0.3% Asian, and 1.3% from other races. The median household income in Henagar was $30,000, and the median family income was $35,000.
Conclusion
Henagar is a small town located in DeKalb County, Alabama. The town is situated in the foothills of the Appalachian Mountains and is home to a population of approximately 1,500 people. The town is known for its rural charm and its close proximity to the nearby cities of Fort Payne and Scottsboro. Henagar’s economy is largely based on agriculture and manufacturing, and the town is home to a number of tourist attractions and outdoor recreation areas. The town has a diverse population, with a median household income of $30,000 and a median family income of $35,000. Henagar is a great place to live, work, and play, and its residents enjoy a variety of activities and attractions.
Common Questions
What is Per Capita Income in Henagar?
Per Capita income in Henagar is $22,754.
What is the Median Family Income in Henagar?
Median Family Income in Henagar is $56,000.
What is the Median Household income in Henagar?
Median Household Income in Henagar is $44,338.
What is Income or Wage Gap in Henagar?
Income or Wage Gap in Henagar is 27.2%.
Women in Henagar earn 72.8 cents for every dollar earned by a man.
What is Family Income Deficit in Henagar?
Family Income Deficit in Henagar is $6,639.
Families that are below poverty line in Henagar earn $6,639 less on average than the poverty threshold level.
What is Inequality or Gini Index in Henagar?
Inequality or Gini Index in Henagar is 0.43.
What is the Total Population of Henagar?
Total Population of Henagar is 2,559.
What is the Total Male Population of Henagar?
Total Male Population of Henagar is 1,294.
What is the Total Female Population of Henagar?
Total Female Population of Henagar is 1,265.
What is the Ratio of Males per 100 Females in Henagar?
There are 102.29 Males per 100 Females in Henagar.
What is the Ratio of Females per 100 Males in Henagar?
There are 97.76 Females per 100 Males in Henagar.
What is the Median Population Age in Henagar?
Median Population Age in Henagar is 39.4 Years.
What is the Average Family Size in Henagar
Average Family Size in Henagar is 3.6 People.
What is the Average Household Size in Henagar
Average Household Size in Henagar is 3.0 People.
How Large is the Labor Force in Henagar?
There are 1,096 People in the Labor Forcein in Henagar.
What is the Percentage of People in the Labor Force in Henagar?
57.6% of People are in the Labor Force in Henagar.
What is the Unemployment Rate in Henagar?
Unemployment Rate in Henagar is 9.0%.