Hanceville, AL Map & Demographics
Hanceville Map
Hanceville Overview
$21,528
PER CAPITA INCOME
$51,705
AVG FAMILY INCOME
$34,782
AVG HOUSEHOLD INCOME
47.3%
WAGE / INCOME GAP [ % ]
52.7¢/ $1
WAGE / INCOME GAP [ $ ]
0.48
INEQUALITY / GINI INDEX
3,216
TOTAL POPULATION
1,573
MALE POPULATION
1,643
FEMALE POPULATION
95.74
MALES / 100 FEMALES
104.45
FEMALES / 100 MALES
41.4
MEDIAN AGE
3.0
AVG FAMILY SIZE
2.2
AVG HOUSEHOLD SIZE
1,420
LABOR FORCE [ PEOPLE ]
51.6%
PERCENT IN LABOR FORCE
8.2%
UNEMPLOYMENT RATE
Hanceville Zip Codes
Hanceville Area Codes
Income in Hanceville
Income Overview in Hanceville
Per Capita Income in Hanceville is $21,528, while median incomes of families and households are $51,705 and $34,782 respectively.
| Characteristic | Number | Measure |
| Per Capita Income | 3,216 | $21,528 |
| Median Family Income | 693 | $51,705 |
| Mean Family Income | 693 | $67,410 |
| Median Household Income | 1,265 | $34,782 |
| Mean Household Income | 1,265 | $52,608 |
| Income Deficit | 693 | $0 |
| Wage / Income Gap (%) | 3,216 | 47.32% |
| Wage / Income Gap ($) | 3,216 | 52.68¢ per $1 |
| Gini / Inequality Index | 3,216 | 0.48 |
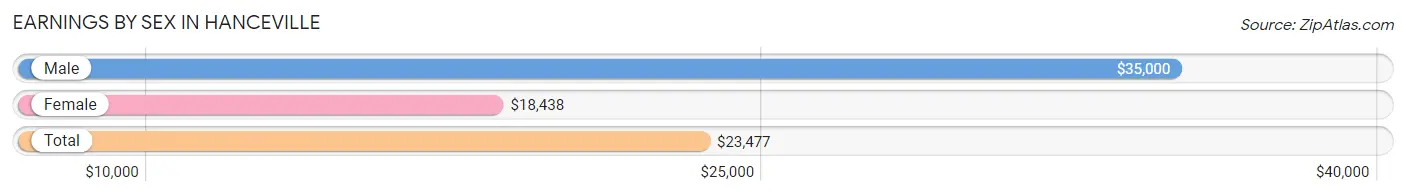
Earnings by Sex in Hanceville
Average Earnings in Hanceville are $23,477, $35,000 for men and $18,438 for women, a difference of 47.3%.
| Sex | Number | Average Earnings |
| Male | 776 (51.7%) | $35,000 |
| Female | 725 (48.3%) | $18,438 |
| Total | 1,501 (100.0%) | $23,477 |
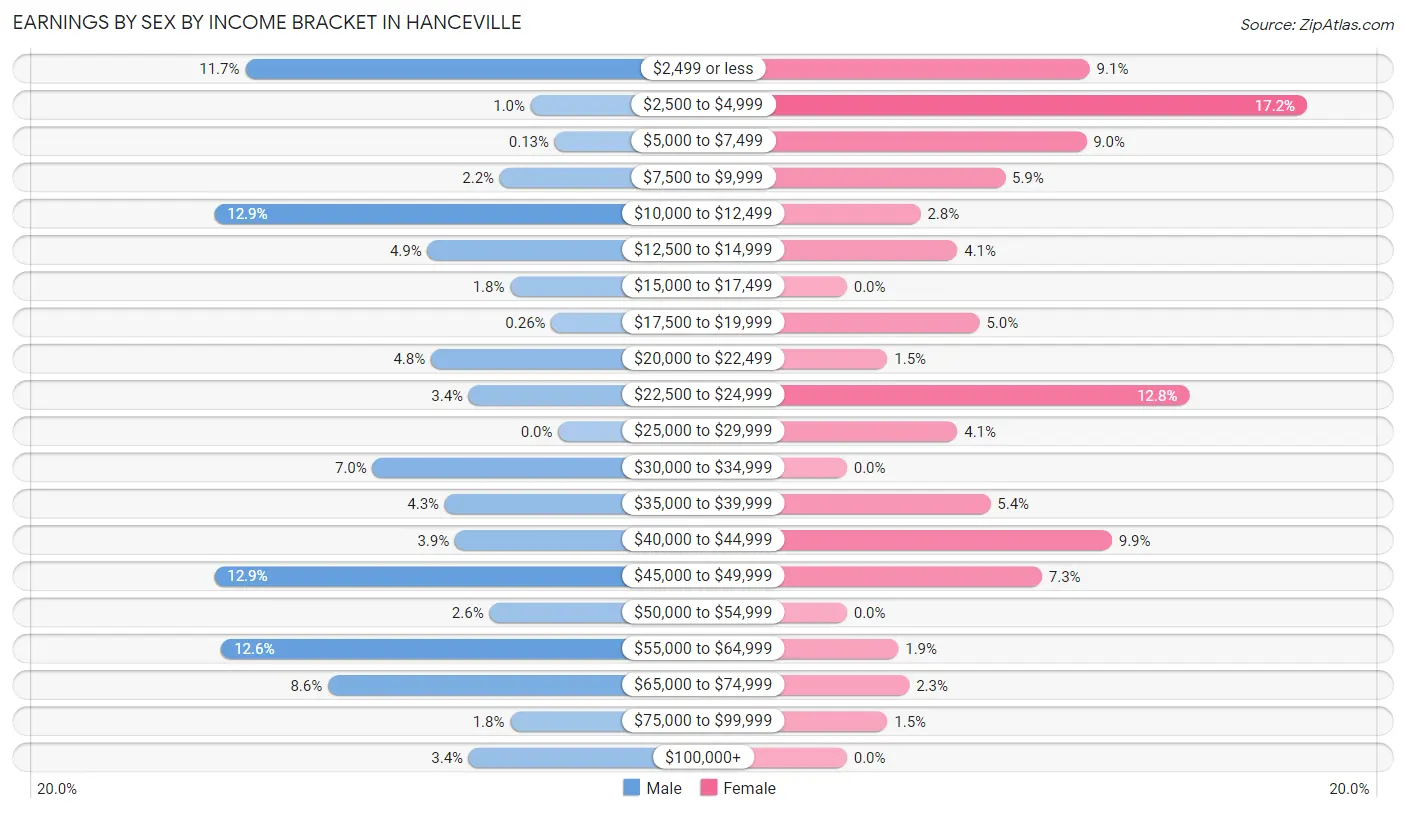
Earnings by Sex by Income Bracket in Hanceville
The most common earnings brackets in Hanceville are $10,000 to $12,499 for men (100 | 12.9%) and $2,500 to $4,999 for women (125 | 17.2%).
| Income | Male | Female |
| $2,499 or less | 91 (11.7%) | 66 (9.1%) |
| $2,500 to $4,999 | 8 (1.0%) | 125 (17.2%) |
| $5,000 to $7,499 | 1 (0.1%) | 65 (9.0%) |
| $7,500 to $9,999 | 17 (2.2%) | 43 (5.9%) |
| $10,000 to $12,499 | 100 (12.9%) | 20 (2.8%) |
| $12,500 to $14,999 | 38 (4.9%) | 30 (4.1%) |
| $15,000 to $17,499 | 14 (1.8%) | 0 (0.0%) |
| $17,500 to $19,999 | 2 (0.3%) | 36 (5.0%) |
| $20,000 to $22,499 | 37 (4.8%) | 11 (1.5%) |
| $22,500 to $24,999 | 26 (3.4%) | 93 (12.8%) |
| $25,000 to $29,999 | 0 (0.0%) | 30 (4.1%) |
| $30,000 to $34,999 | 54 (7.0%) | 0 (0.0%) |
| $35,000 to $39,999 | 33 (4.3%) | 39 (5.4%) |
| $40,000 to $44,999 | 30 (3.9%) | 72 (9.9%) |
| $45,000 to $49,999 | 100 (12.9%) | 53 (7.3%) |
| $50,000 to $54,999 | 20 (2.6%) | 0 (0.0%) |
| $55,000 to $64,999 | 98 (12.6%) | 14 (1.9%) |
| $65,000 to $74,999 | 67 (8.6%) | 17 (2.3%) |
| $75,000 to $99,999 | 14 (1.8%) | 11 (1.5%) |
| $100,000+ | 26 (3.4%) | 0 (0.0%) |
| Total | 776 (100.0%) | 725 (100.0%) |
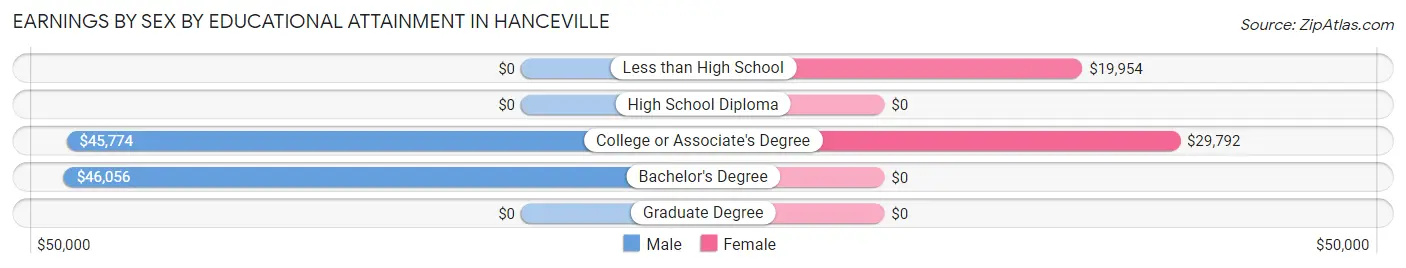
Earnings by Sex by Educational Attainment in Hanceville
Average earnings in Hanceville are $40,208 for men and $24,003 for women, a difference of 40.3%. Men with an educational attainment of bachelor's degree enjoy the highest average annual earnings of $46,056, while those with college or associate's degree education earn the least with $45,774. Women with an educational attainment of college or associate's degree earn the most with the average annual earnings of $29,792, while those with less than high school education have the smallest earnings of $19,954.
| Educational Attainment | Male Income | Female Income |
| Less than High School | - | - |
| High School Diploma | - | - |
| College or Associate's Degree | $45,774 | $29,792 |
| Bachelor's Degree | $46,056 | $0 |
| Graduate Degree | - | - |
| Total | $40,208 | $24,003 |
Family Income in Hanceville
Family Income Brackets in Hanceville
According to the Hanceville family income data, there are 173 families falling into the $100,000 to $149,999 income range, which is the most common income bracket and makes up 25.0% of all families.
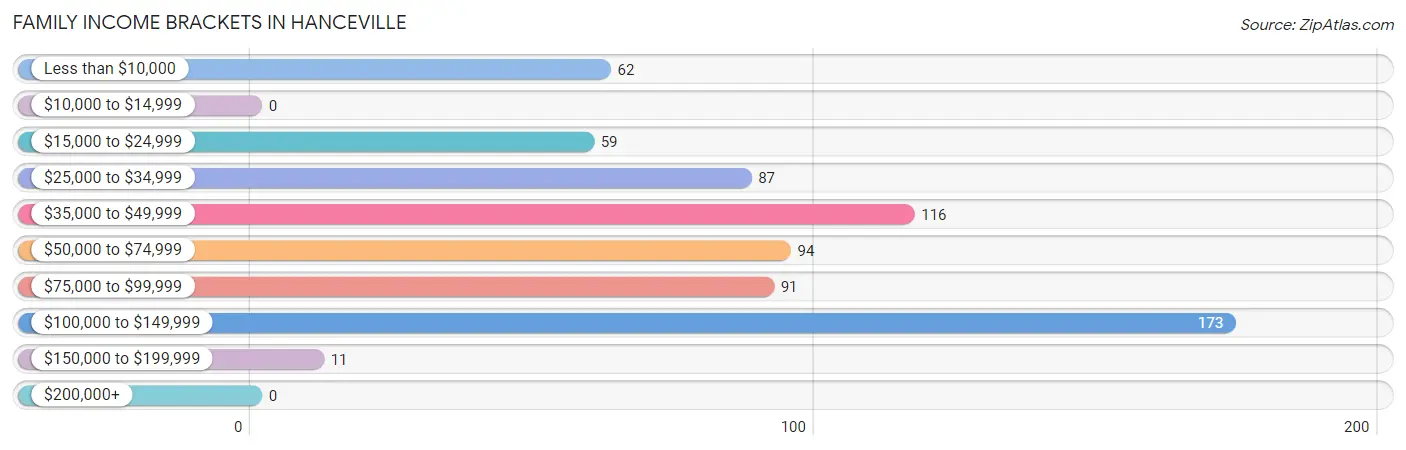
| Income Bracket | # Families | % Families |
| Less than $10,000 | 62 | 8.9% |
| $10,000 to $14,999 | 0 | 0.0% |
| $15,000 to $24,999 | 59 | 8.5% |
| $25,000 to $34,999 | 87 | 12.6% |
| $35,000 to $49,999 | 116 | 16.7% |
| $50,000 to $74,999 | 94 | 13.6% |
| $75,000 to $99,999 | 91 | 13.1% |
| $100,000 to $149,999 | 173 | 25.0% |
| $150,000 to $199,999 | 11 | 1.6% |
| $200,000+ | 0 | 0.0% |
Family Income by Famaliy Size in Hanceville
5-person families (48 | 6.9%) account for the highest median family income in Hanceville with $115,179 per family, while 4-person families (95 | 13.7%) have the highest median income of $26,562 per family member.
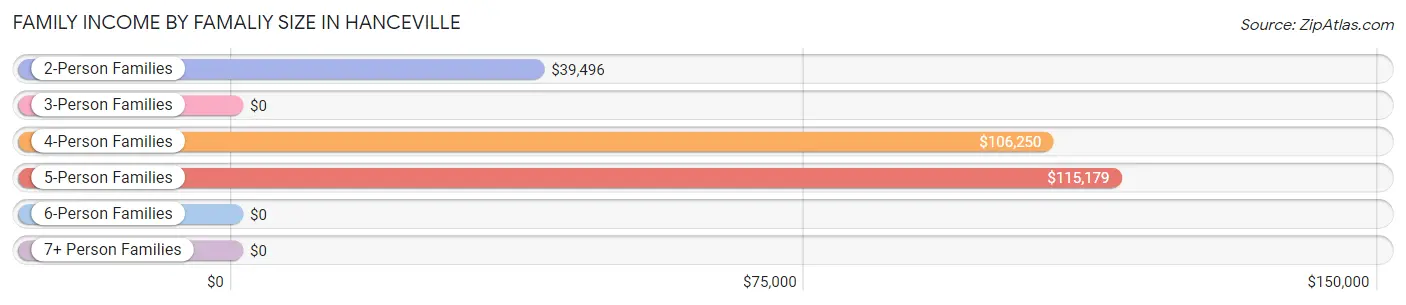
| Income Bracket | # Families | Median Income |
| 2-Person Families | 365 (52.7%) | $39,496 |
| 3-Person Families | 125 (18.0%) | $0 |
| 4-Person Families | 95 (13.7%) | $106,250 |
| 5-Person Families | 48 (6.9%) | $115,179 |
| 6-Person Families | 33 (4.8%) | $0 |
| 7+ Person Families | 27 (3.9%) | $0 |
| Total | 693 (100.0%) | $51,705 |
Family Income by Number of Earners in Hanceville
The median family income in Hanceville is $51,705, with families comprising 3+ earners (166) having the highest median family income of $95,417, while families with no earners (199) have the lowest median family income of $34,315, accounting for 23.9% and 28.7% of families, respectively.
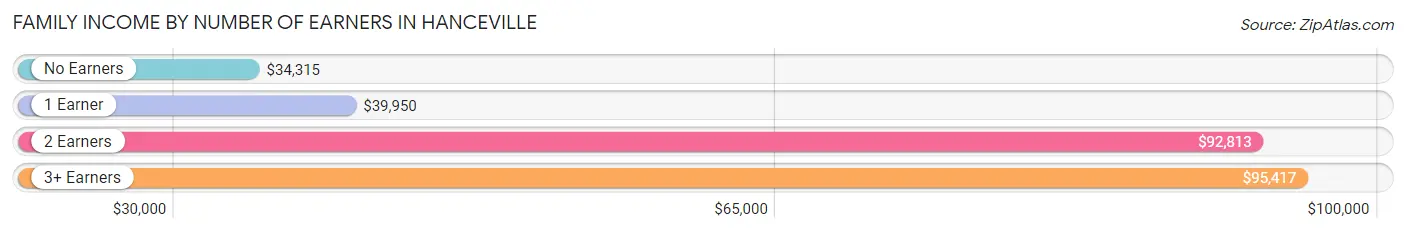
| Number of Earners | # Families | Median Income |
| No Earners | 199 (28.7%) | $34,315 |
| 1 Earner | 137 (19.8%) | $39,950 |
| 2 Earners | 191 (27.6%) | $92,813 |
| 3+ Earners | 166 (23.9%) | $95,417 |
| Total | 693 (100.0%) | $51,705 |
Household Income in Hanceville
Household Income Brackets in Hanceville
With 231 households falling in the category, the $15,000 to $24,999 income range is the most frequent in Hanceville, accounting for 18.3% of all households. In contrast, only 11 households (0.9%) fall into the $150,000 to $199,999 income bracket, making it the least populous group.
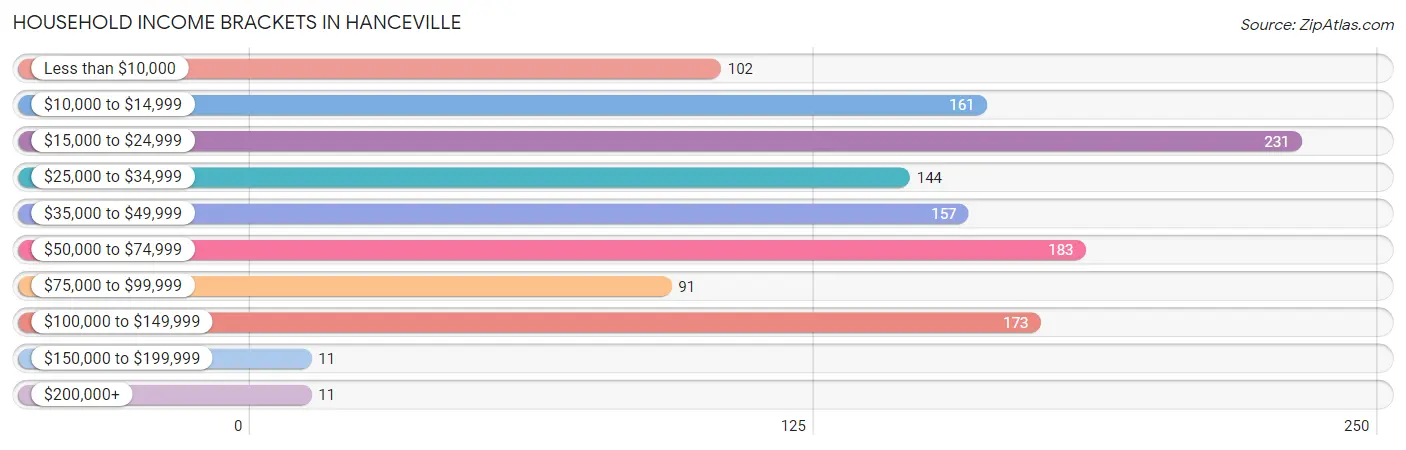
| Income Bracket | # Households | % Households |
| Less than $10,000 | 102 | 8.1% |
| $10,000 to $14,999 | 161 | 12.7% |
| $15,000 to $24,999 | 231 | 18.3% |
| $25,000 to $34,999 | 144 | 11.4% |
| $35,000 to $49,999 | 157 | 12.4% |
| $50,000 to $74,999 | 183 | 14.5% |
| $75,000 to $99,999 | 91 | 7.2% |
| $100,000 to $149,999 | 173 | 13.7% |
| $150,000 to $199,999 | 11 | 0.9% |
| $200,000+ | 11 | 0.9% |
Household Income by Householder Age in Hanceville
The median household income in Hanceville is $34,782, with the highest median household income of $60,733 found in the 25 to 44 years age bracket for the primary householder. A total of 319 households (25.2%) fall into this category. Meanwhile, the 65+ years age bracket for the primary householder has the lowest median household income of $25,857, with 356 households (28.1%) in this group.
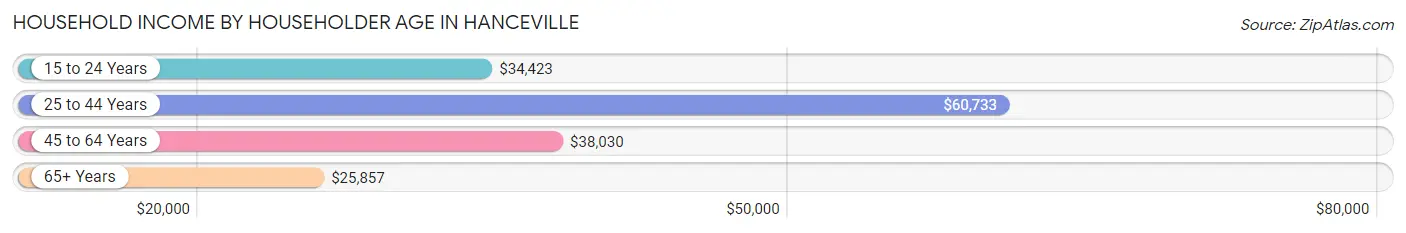
| Income Bracket | # Households | Median Income |
| 15 to 24 Years | 66 (5.2%) | $34,423 |
| 25 to 44 Years | 319 (25.2%) | $60,733 |
| 45 to 64 Years | 524 (41.4%) | $38,030 |
| 65+ Years | 356 (28.1%) | $25,857 |
| Total | 1,265 (100.0%) | $34,782 |
Poverty in Hanceville
Income Below Poverty by Sex and Age in Hanceville
With 17.5% poverty level for males and 30.9% for females among the residents of Hanceville, under 5 year old males and under 5 year old females are the most vulnerable to poverty, with 11 males (100.0%) and 60 females (63.8%) in their respective age groups living below the poverty level.
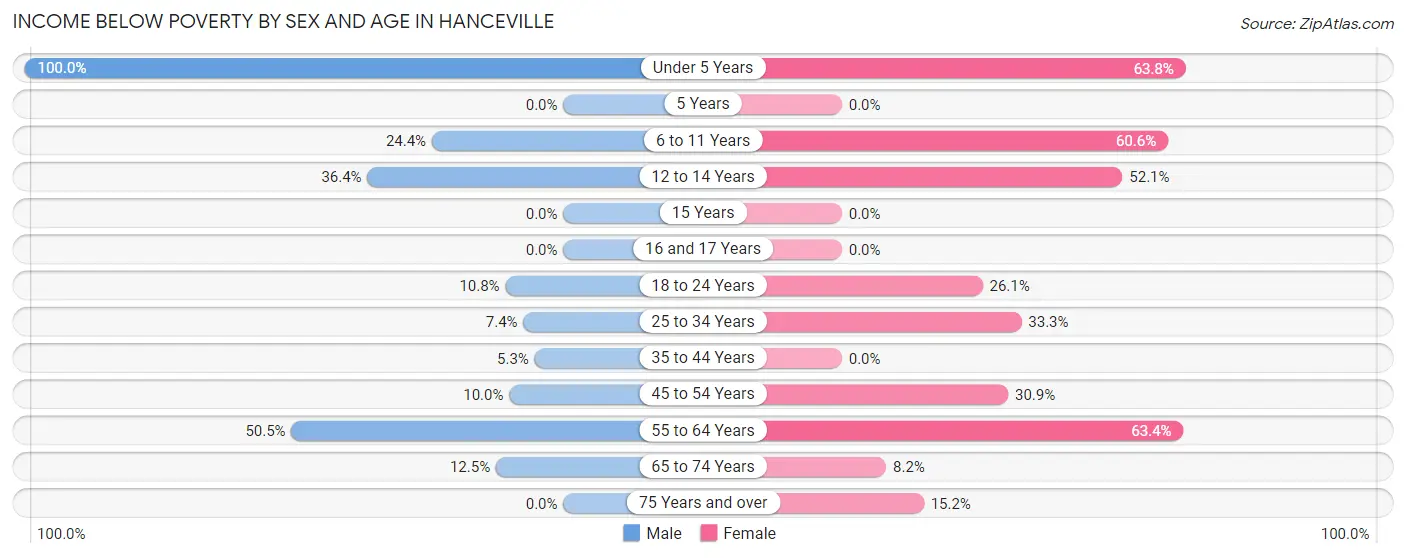
| Age Bracket | Male | Female |
| Under 5 Years | 11 (100.0%) | 60 (63.8%) |
| 5 Years | 0 (0.0%) | 0 (0.0%) |
| 6 to 11 Years | 30 (24.4%) | 66 (60.6%) |
| 12 to 14 Years | 24 (36.4%) | 25 (52.1%) |
| 15 Years | 0 (0.0%) | 0 (0.0%) |
| 16 and 17 Years | 0 (0.0%) | 0 (0.0%) |
| 18 to 24 Years | 10 (10.7%) | 29 (26.1%) |
| 25 to 34 Years | 18 (7.4%) | 82 (33.3%) |
| 35 to 44 Years | 5 (5.3%) | 0 (0.0%) |
| 45 to 54 Years | 24 (10.0%) | 54 (30.9%) |
| 55 to 64 Years | 108 (50.5%) | 78 (63.4%) |
| 65 to 74 Years | 15 (12.5%) | 12 (8.2%) |
| 75 Years and over | 0 (0.0%) | 26 (15.2%) |
| Total | 245 (17.5%) | 432 (30.9%) |
Income Above Poverty by Sex and Age in Hanceville
According to the poverty statistics in Hanceville, males aged 15 years and females aged 16 and 17 years are the age groups that are most secure financially, with 100.0% of males and 100.0% of females in these age groups living above the poverty line.
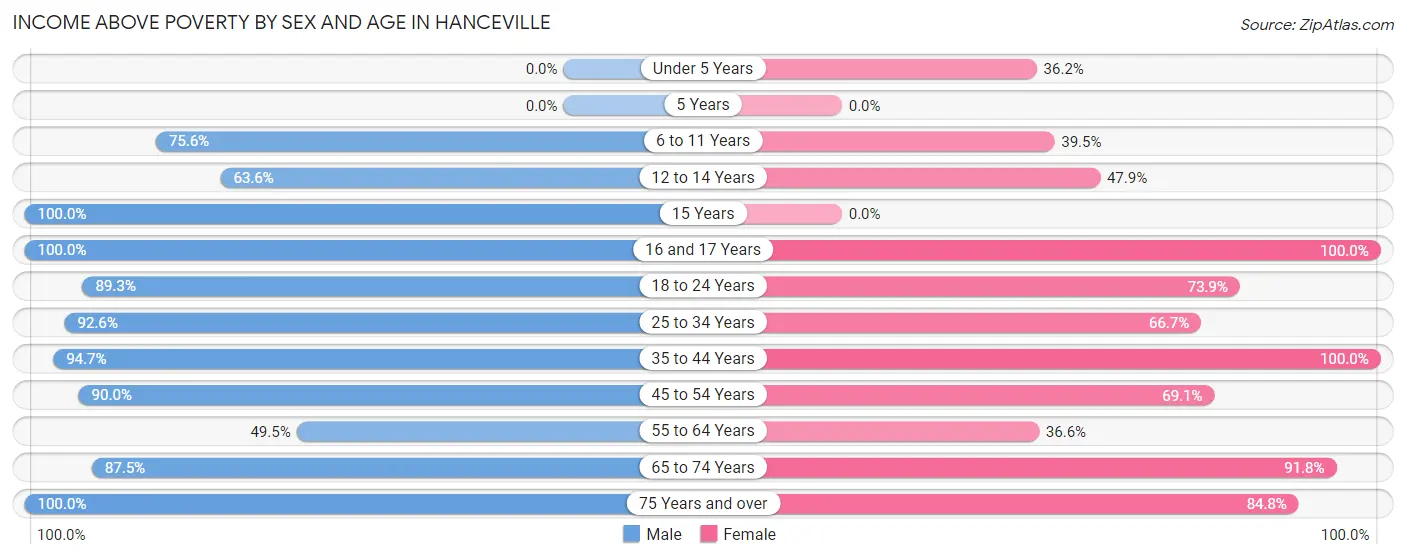
| Age Bracket | Male | Female |
| Under 5 Years | 0 (0.0%) | 34 (36.2%) |
| 5 Years | 0 (0.0%) | 0 (0.0%) |
| 6 to 11 Years | 93 (75.6%) | 43 (39.5%) |
| 12 to 14 Years | 42 (63.6%) | 23 (47.9%) |
| 15 Years | 14 (100.0%) | 0 (0.0%) |
| 16 and 17 Years | 56 (100.0%) | 54 (100.0%) |
| 18 to 24 Years | 83 (89.2%) | 82 (73.9%) |
| 25 to 34 Years | 225 (92.6%) | 164 (66.7%) |
| 35 to 44 Years | 89 (94.7%) | 123 (100.0%) |
| 45 to 54 Years | 215 (90.0%) | 121 (69.1%) |
| 55 to 64 Years | 106 (49.5%) | 45 (36.6%) |
| 65 to 74 Years | 105 (87.5%) | 134 (91.8%) |
| 75 Years and over | 125 (100.0%) | 145 (84.8%) |
| Total | 1,153 (82.5%) | 968 (69.1%) |
Income Below Poverty Among Married-Couple Families in Hanceville
The poverty statistics for married-couple families in Hanceville show that 5.3% or 28 of the total 531 families live below the poverty line. Families with no children have the highest poverty rate of 8.0%, comprising of 28 families. On the other hand, families with 1 or 2 children have the lowest poverty rate of 0.0%, which includes 0 families.
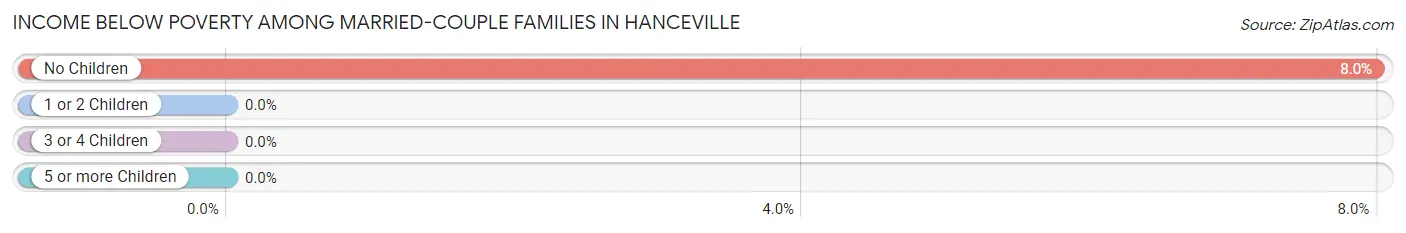
| Children | Above Poverty | Below Poverty |
| No Children | 323 (92.0%) | 28 (8.0%) |
| 1 or 2 Children | 116 (100.0%) | 0 (0.0%) |
| 3 or 4 Children | 64 (100.0%) | 0 (0.0%) |
| 5 or more Children | 0 (0.0%) | 0 (0.0%) |
| Total | 503 (94.7%) | 28 (5.3%) |
Income Below Poverty Among Single-Parent Households in Hanceville
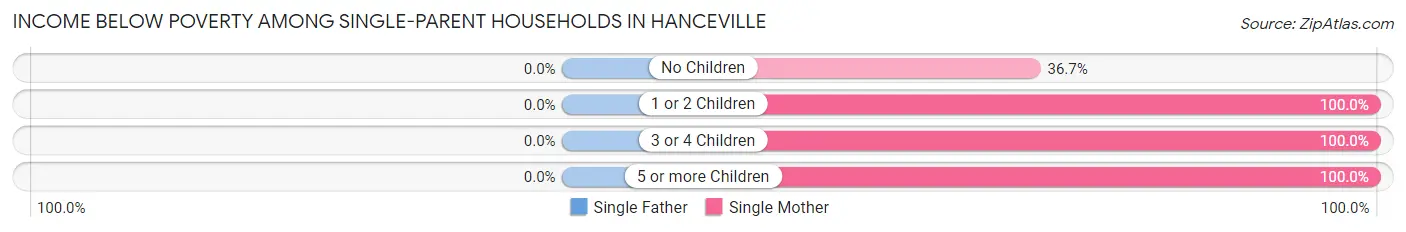
| Children | Single Father | Single Mother |
| No Children | 0 (0.0%) | 22 (36.7%) |
| 1 or 2 Children | 0 (0.0%) | 11 (100.0%) |
| 3 or 4 Children | 0 (0.0%) | 23 (100.0%) |
| 5 or more Children | 0 (0.0%) | 27 (100.0%) |
| Total | 0 (0.0%) | 83 (68.6%) |
Income Below Poverty Among Married-Couple vs Single-Parent Households in Hanceville
The poverty data for Hanceville shows that 28 of the married-couple family households (5.3%) and 83 of the single-parent households (51.2%) are living below the poverty level. Within the married-couple family households, those with no children have the highest poverty rate, with 28 households (8.0%) falling below the poverty line. Among the single-parent households, those with 3 or 4 children have the highest poverty rate, with 23 household (100.0%) living below poverty.
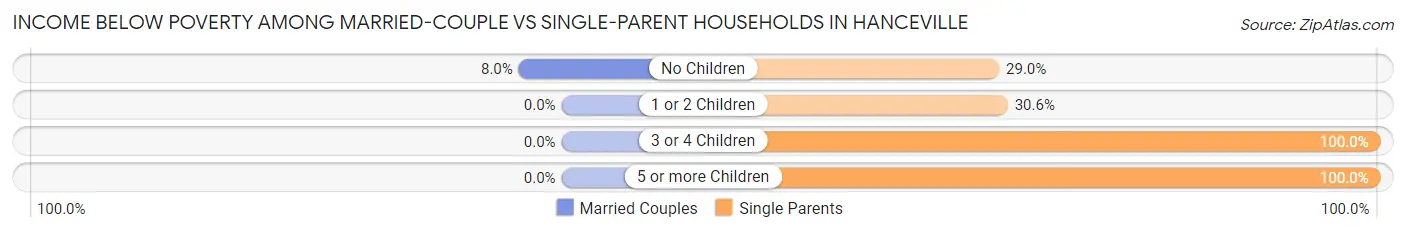
| Children | Married-Couple Families | Single-Parent Households |
| No Children | 28 (8.0%) | 22 (28.9%) |
| 1 or 2 Children | 0 (0.0%) | 11 (30.6%) |
| 3 or 4 Children | 0 (0.0%) | 23 (100.0%) |
| 5 or more Children | 0 (0.0%) | 27 (100.0%) |
| Total | 28 (5.3%) | 83 (51.2%) |
Race in Hanceville
The most populous races in Hanceville are White / Caucasian (2,880 | 89.5%), Black / African American (195 | 6.1%), and Two or more Races (140 | 4.3%).
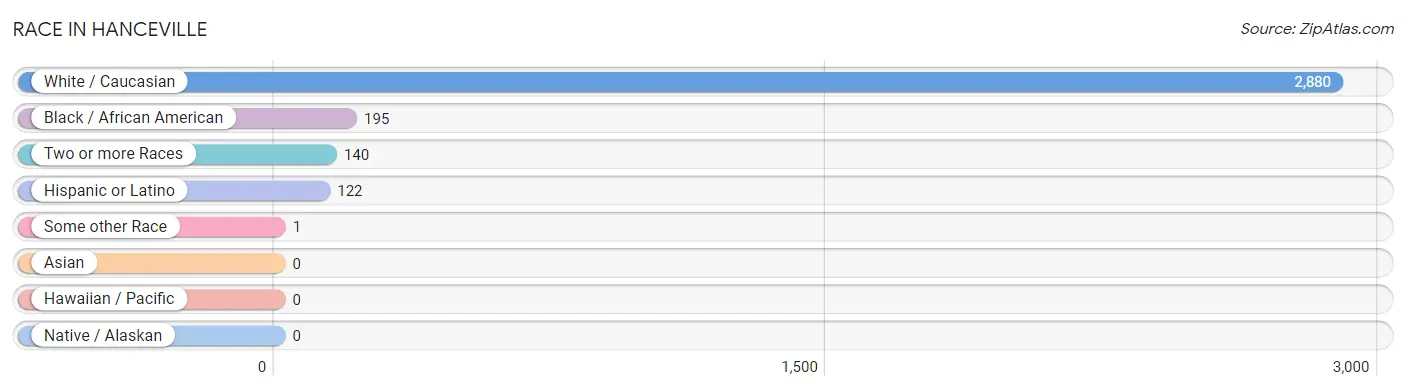
| Race | # Population | % Population |
| Asian | 0 | 0.0% |
| Black / African American | 195 | 6.1% |
| Hawaiian / Pacific | 0 | 0.0% |
| Hispanic or Latino | 122 | 3.8% |
| Native / Alaskan | 0 | 0.0% |
| White / Caucasian | 2,880 | 89.5% |
| Two or more Races | 140 | 4.3% |
| Some other Race | 1 | 0.0% |
| Total | 3,216 | 100.0% |
Ancestry in Hanceville
The most populous ancestries reported in Hanceville are American (1,211 | 37.7%), Irish (350 | 10.9%), German (345 | 10.7%), English (197 | 6.1%), and Mexican (109 | 3.4%), together accounting for 68.8% of all Hanceville residents.
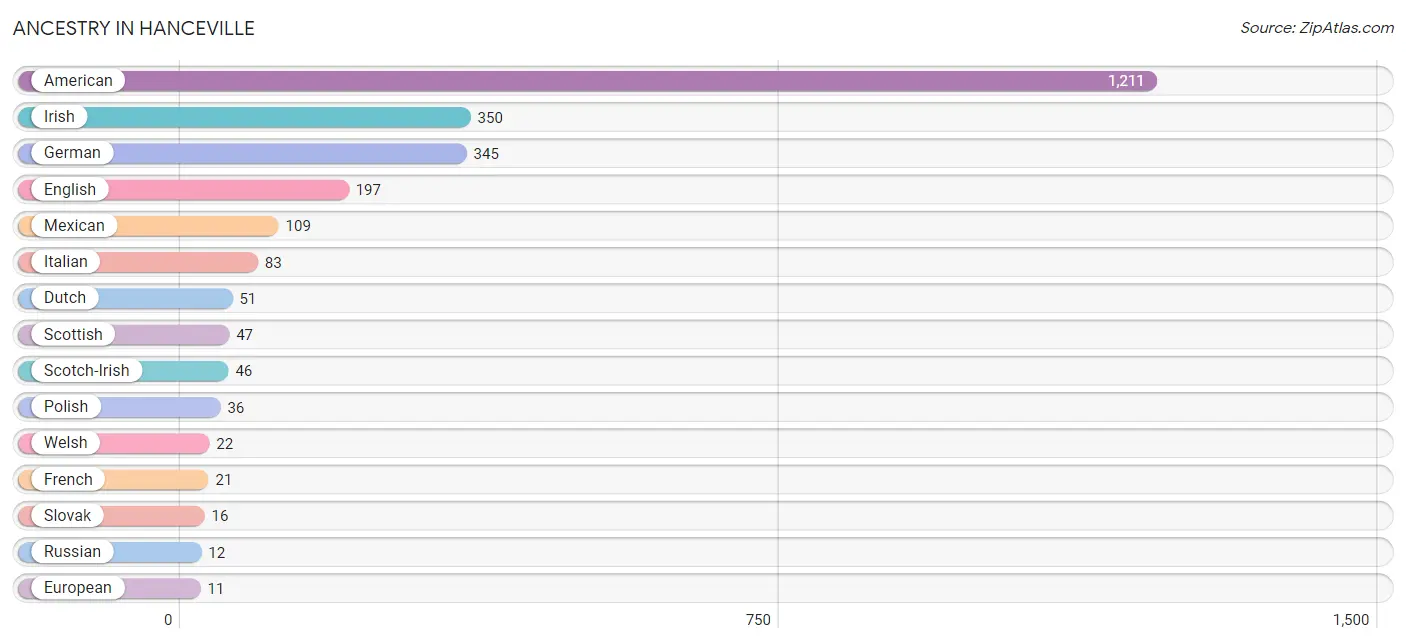
| Ancestry | # Population | % Population |
| African | 3 | 0.1% |
| American | 1,211 | 37.7% |
| Cherokee | 9 | 0.3% |
| Dutch | 51 | 1.6% |
| English | 197 | 6.1% |
| European | 11 | 0.3% |
| French | 21 | 0.6% |
| French Canadian | 10 | 0.3% |
| German | 345 | 10.7% |
| Irish | 350 | 10.9% |
| Italian | 83 | 2.6% |
| Mexican | 109 | 3.4% |
| Polish | 36 | 1.1% |
| Puerto Rican | 2 | 0.1% |
| Russian | 12 | 0.4% |
| Scotch-Irish | 46 | 1.4% |
| Scottish | 47 | 1.5% |
| Slovak | 16 | 0.5% |
| South American | 2 | 0.1% |
| Spaniard | 9 | 0.3% |
| Subsaharan African | 3 | 0.1% |
| Venezuelan | 2 | 0.1% |
| Welsh | 22 | 0.7% | View All 23 Rows |
Immigrants in Hanceville
The most numerous immigrant groups reported in Hanceville came from Latin America (85 | 2.6%), Central America (83 | 2.6%), Mexico (83 | 2.6%), Europe (10 | 0.3%), and Germany (10 | 0.3%), together accounting for 8.4% of all Hanceville residents.
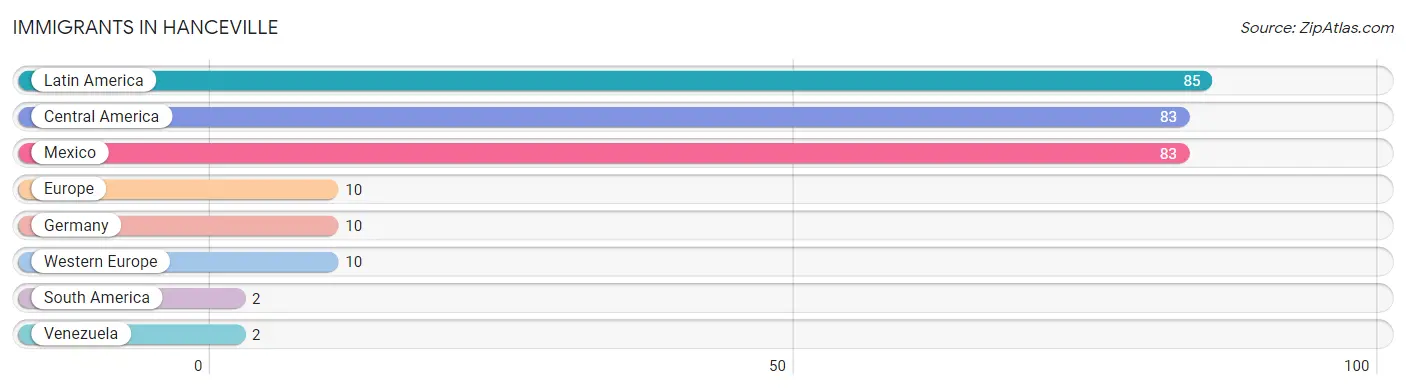
| Immigration Origin | # Population | % Population |
| Central America | 83 | 2.6% |
| Europe | 10 | 0.3% |
| Germany | 10 | 0.3% |
| Latin America | 85 | 2.6% |
| Mexico | 83 | 2.6% |
| South America | 2 | 0.1% |
| Venezuela | 2 | 0.1% |
| Western Europe | 10 | 0.3% | View All 8 Rows |
Sex and Age in Hanceville
Sex and Age in Hanceville
The most populous age groups in Hanceville are 25 to 29 Years (165 | 10.5%) for men and 15 to 19 Years (157 | 9.6%) for women.
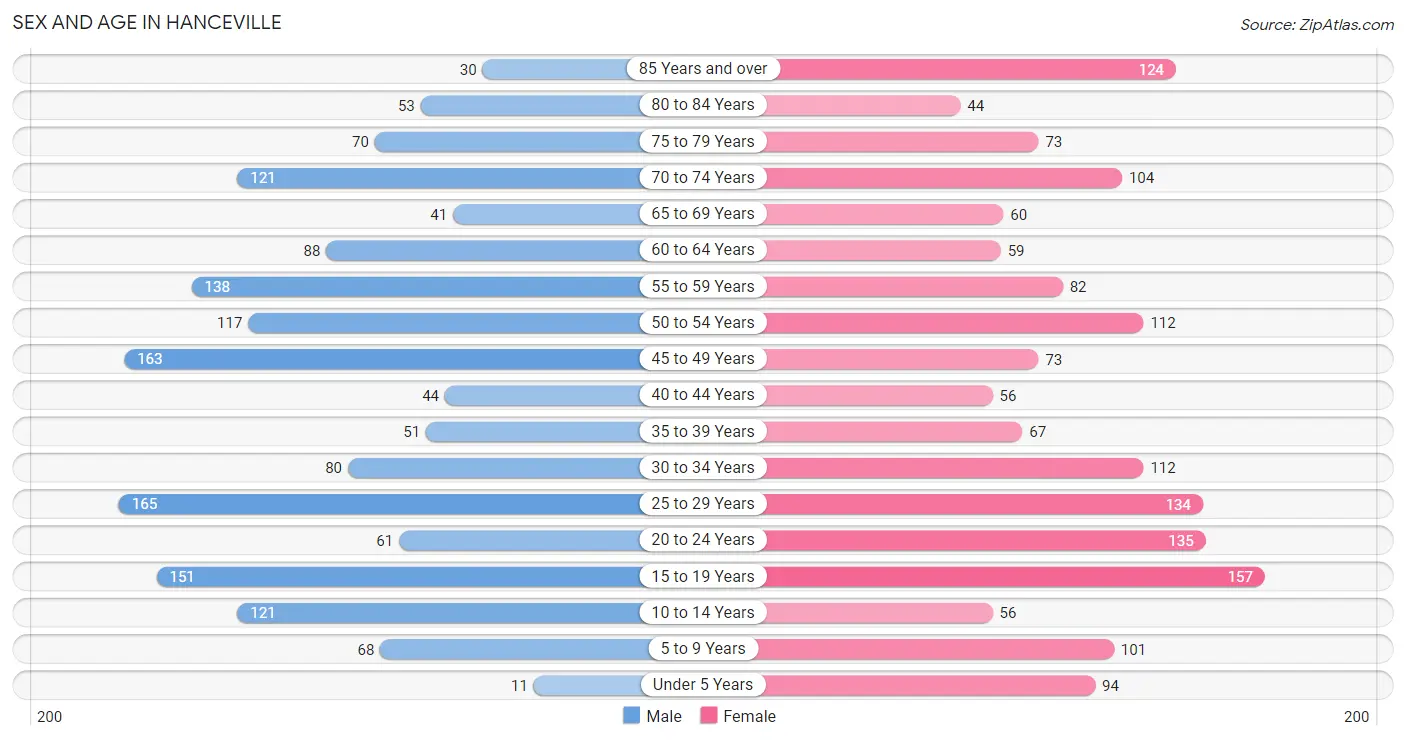
| Age Bracket | Male | Female |
| Under 5 Years | 11 (0.7%) | 94 (5.7%) |
| 5 to 9 Years | 68 (4.3%) | 101 (6.1%) |
| 10 to 14 Years | 121 (7.7%) | 56 (3.4%) |
| 15 to 19 Years | 151 (9.6%) | 157 (9.6%) |
| 20 to 24 Years | 61 (3.9%) | 135 (8.2%) |
| 25 to 29 Years | 165 (10.5%) | 134 (8.2%) |
| 30 to 34 Years | 80 (5.1%) | 112 (6.8%) |
| 35 to 39 Years | 51 (3.2%) | 67 (4.1%) |
| 40 to 44 Years | 44 (2.8%) | 56 (3.4%) |
| 45 to 49 Years | 163 (10.4%) | 73 (4.4%) |
| 50 to 54 Years | 117 (7.4%) | 112 (6.8%) |
| 55 to 59 Years | 138 (8.8%) | 82 (5.0%) |
| 60 to 64 Years | 88 (5.6%) | 59 (3.6%) |
| 65 to 69 Years | 41 (2.6%) | 60 (3.6%) |
| 70 to 74 Years | 121 (7.7%) | 104 (6.3%) |
| 75 to 79 Years | 70 (4.4%) | 73 (4.4%) |
| 80 to 84 Years | 53 (3.4%) | 44 (2.7%) |
| 85 Years and over | 30 (1.9%) | 124 (7.5%) |
| Total | 1,573 (100.0%) | 1,643 (100.0%) |
Families and Households in Hanceville
Median Family Size in Hanceville
The median family size in Hanceville is 3.00 persons per family, with single female/mother families (121 | 17.5%) accounting for the largest median family size of 3.83 persons per family. On the other hand, single male/father families (41 | 5.9%) represent the smallest median family size with 2.17 persons per family.
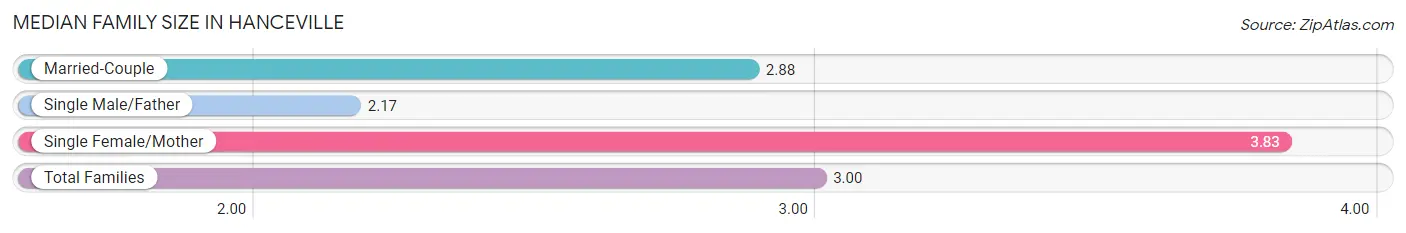
| Family Type | # Families | Family Size |
| Married-Couple | 531 (76.6%) | 2.88 |
| Single Male/Father | 41 (5.9%) | 2.17 |
| Single Female/Mother | 121 (17.5%) | 3.83 |
| Total Families | 693 (100.0%) | 3.00 |
Median Household Size in Hanceville
The median household size in Hanceville is 2.20 persons per household, with single female/mother households (121 | 9.6%) accounting for the largest median household size of 4.07 persons per household. non-family households (572 | 45.2%) represent the smallest median household size with 1.17 persons per household.
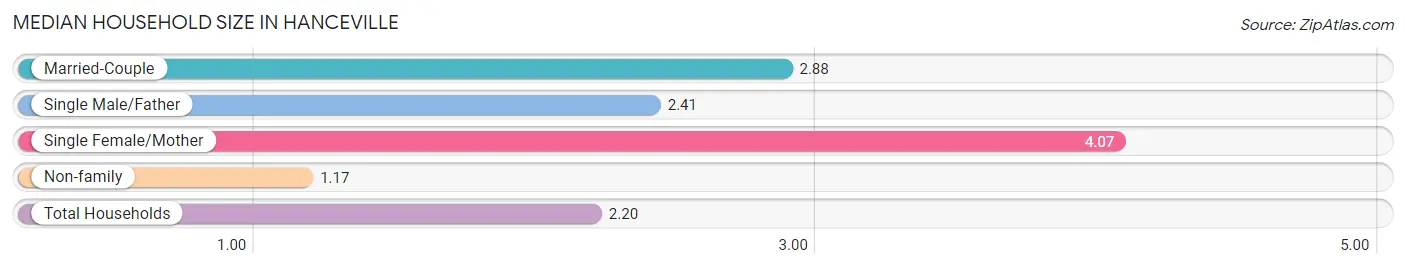
| Household Type | # Households | Household Size |
| Married-Couple | 531 (42.0%) | 2.88 |
| Single Male/Father | 41 (3.2%) | 2.41 |
| Single Female/Mother | 121 (9.6%) | 4.07 |
| Non-family | 572 (45.2%) | 1.17 |
| Total Households | 1,265 (100.0%) | 2.20 |
Household Size by Marriage Status in Hanceville
Out of a total of 1,265 households in Hanceville, 693 (54.8%) are family households, while 572 (45.2%) are nonfamily households. The most numerous type of family households are 2-person households, comprising 359, and the most common type of nonfamily households are 1-person households, comprising 499.

| Household Size | Family Households | Nonfamily Households |
| 1-Person Households | - | 499 (39.5%) |
| 2-Person Households | 359 (28.4%) | 73 (5.8%) |
| 3-Person Households | 102 (8.1%) | 0 (0.0%) |
| 4-Person Households | 124 (9.8%) | 0 (0.0%) |
| 5-Person Households | 48 (3.8%) | 0 (0.0%) |
| 6-Person Households | 33 (2.6%) | 0 (0.0%) |
| 7+ Person Households | 27 (2.1%) | 0 (0.0%) |
| Total | 693 (54.8%) | 572 (45.2%) |
Female Fertility in Hanceville
Fertility by Age in Hanceville
| Age Bracket | Women with Births | Births / 1,000 Women |
| 15 to 19 years | 0 (0.0%) | 0.0 |
| 20 to 34 years | 0 (0.0%) | 0.0 |
| 35 to 50 years | 0 (0.0%) | 0.0 |
| Total | 0 (0.0%) | 0.0 |
Fertility by Age by Marriage Status in Hanceville
| Age Bracket | Married | Unmarried |
| 15 to 19 years | 0 (0.0%) | 0 (0.0%) |
| 20 to 34 years | 0 (0.0%) | 0 (0.0%) |
| 35 to 50 years | 0 (0.0%) | 0 (0.0%) |
| Total | 0 (0.0%) | 0 (0.0%) |
Fertility by Education in Hanceville
| Educational Attainment | Women with Births | Births / 1,000 Women |
| Less than High School | 0 (0.0%) | 0.0 |
| High School Diploma | 0 (0.0%) | 0.0 |
| College or Associate's Degree | 0 (0.0%) | 0.0 |
| Bachelor's Degree | 0 (0.0%) | 0.0 |
| Graduate Degree | 0 (0.0%) | 0.0 |
| Total | 0 (0.0%) | 0.0 |
Fertility by Education by Marriage Status in Hanceville
| Educational Attainment | Married | Unmarried |
| Less than High School | 0 (0.0%) | 0 (0.0%) |
| High School Diploma | 0 (0.0%) | 0 (0.0%) |
| College or Associate's Degree | 0 (0.0%) | 0 (0.0%) |
| Bachelor's Degree | 0 (0.0%) | 0 (0.0%) |
| Graduate Degree | 0 (0.0%) | 0 (0.0%) |
| Total | 0 (0.0%) | 0 (0.0%) |
Employment Characteristics in Hanceville
Employment by Class of Employer in Hanceville
Among the 1,270 employed individuals in Hanceville, private company employees (1,046 | 82.4%), federal government employees (60 | 4.7%), and state government employees (50 | 3.9%) make up the most common classes of employment.
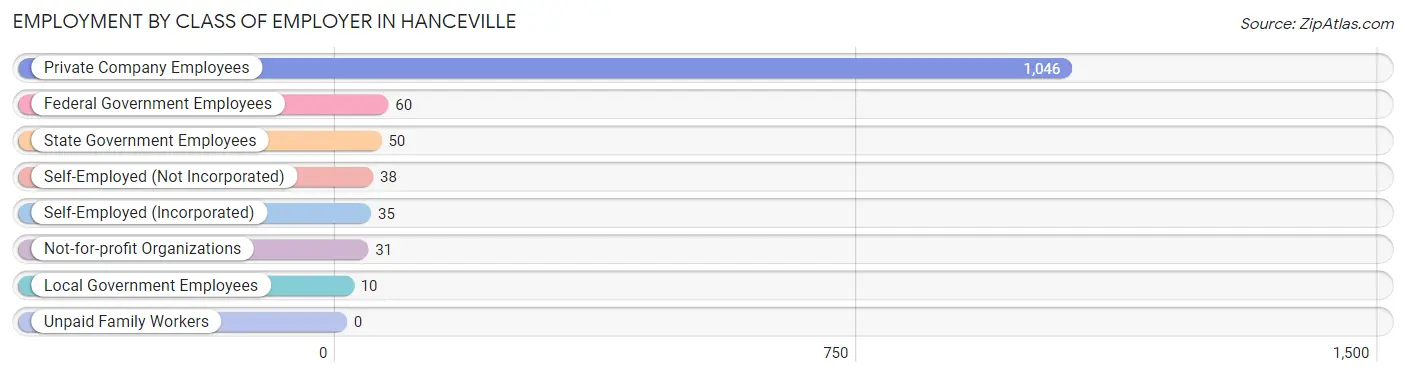
| Employer Class | # Employees | % Employees |
| Private Company Employees | 1,046 | 82.4% |
| Self-Employed (Incorporated) | 35 | 2.8% |
| Self-Employed (Not Incorporated) | 38 | 3.0% |
| Not-for-profit Organizations | 31 | 2.4% |
| Local Government Employees | 10 | 0.8% |
| State Government Employees | 50 | 3.9% |
| Federal Government Employees | 60 | 4.7% |
| Unpaid Family Workers | 0 | 0.0% |
| Total | 1,270 | 100.0% |
Employment Status by Age in Hanceville
According to the labor force statistics for Hanceville, out of the total population over 16 years of age (2,751), 51.6% or 1,420 individuals are in the labor force, with 8.2% or 116 of them unemployed. The age group with the highest labor force participation rate is 25 to 29 years, with 83.6% or 250 individuals in the labor force. Within the labor force, the 16 to 19 years age range has the highest percentage of unemployed individuals, with 45.2% or 70 of them being unemployed.
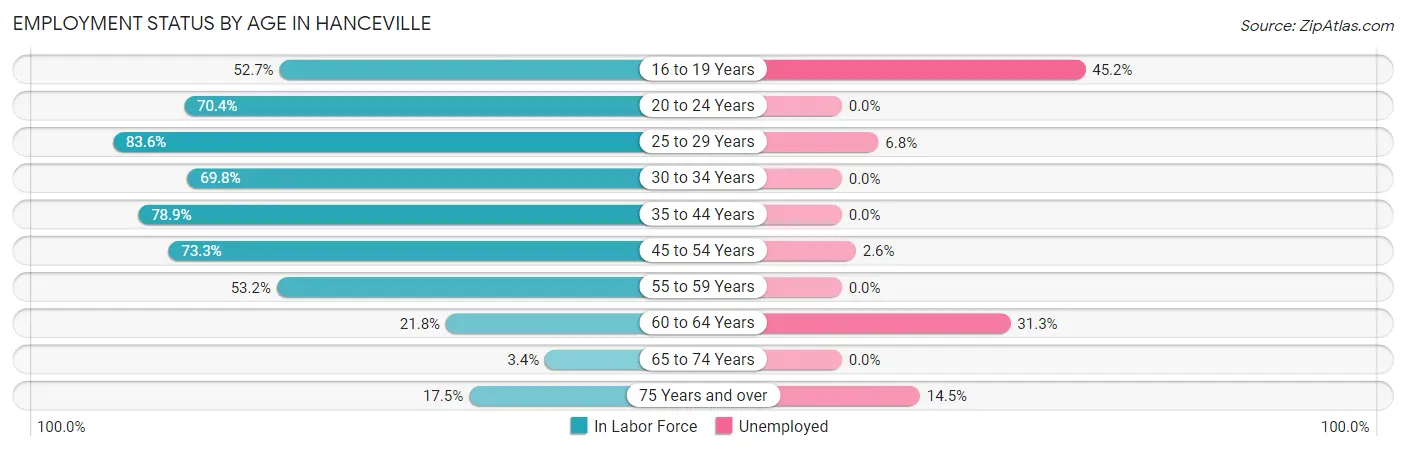
| Age Bracket | In Labor Force | Unemployed |
| 16 to 19 Years | 155 (52.7%) | 70 (45.2%) |
| 20 to 24 Years | 138 (70.4%) | 0 (0.0%) |
| 25 to 29 Years | 250 (83.6%) | 17 (6.8%) |
| 30 to 34 Years | 134 (69.8%) | 0 (0.0%) |
| 35 to 44 Years | 172 (78.9%) | 0 (0.0%) |
| 45 to 54 Years | 341 (73.3%) | 9 (2.6%) |
| 55 to 59 Years | 117 (53.2%) | 0 (0.0%) |
| 60 to 64 Years | 32 (21.8%) | 10 (31.3%) |
| 65 to 74 Years | 11 (3.4%) | 0 (0.0%) |
| 75 Years and over | 69 (17.5%) | 10 (14.5%) |
| Total | 1,420 (51.6%) | 116 (8.2%) |
Employment Status by Educational Attainment in Hanceville
According to labor force statistics for Hanceville, 67.9% of individuals (1,046) out of the total population between 25 and 64 years of age (1,541) are in the labor force, with 3.4% or 36 of them being unemployed. The group with the highest labor force participation rate are those with the educational attainment of bachelor's degree or higher, with 86.2% or 137 individuals in the labor force. Within the labor force, individuals with less than high school education have the highest percentage of unemployment, with 11.8% or 19 of them being unemployed.
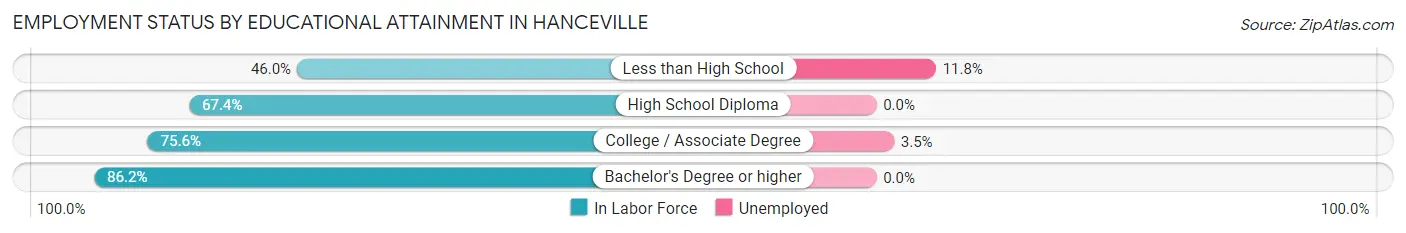
| Educational Attainment | In Labor Force | Unemployed |
| Less than High School | 161 (46.0%) | 41 (11.8%) |
| High School Diploma | 267 (67.4%) | 0 (0.0%) |
| College / Associate Degree | 481 (75.6%) | 22 (3.5%) |
| Bachelor's Degree or higher | 137 (86.2%) | 0 (0.0%) |
| Total | 1,046 (67.9%) | 52 (3.4%) |
Employment Occupations by Sex in Hanceville
Management, Business, Science and Arts Occupations
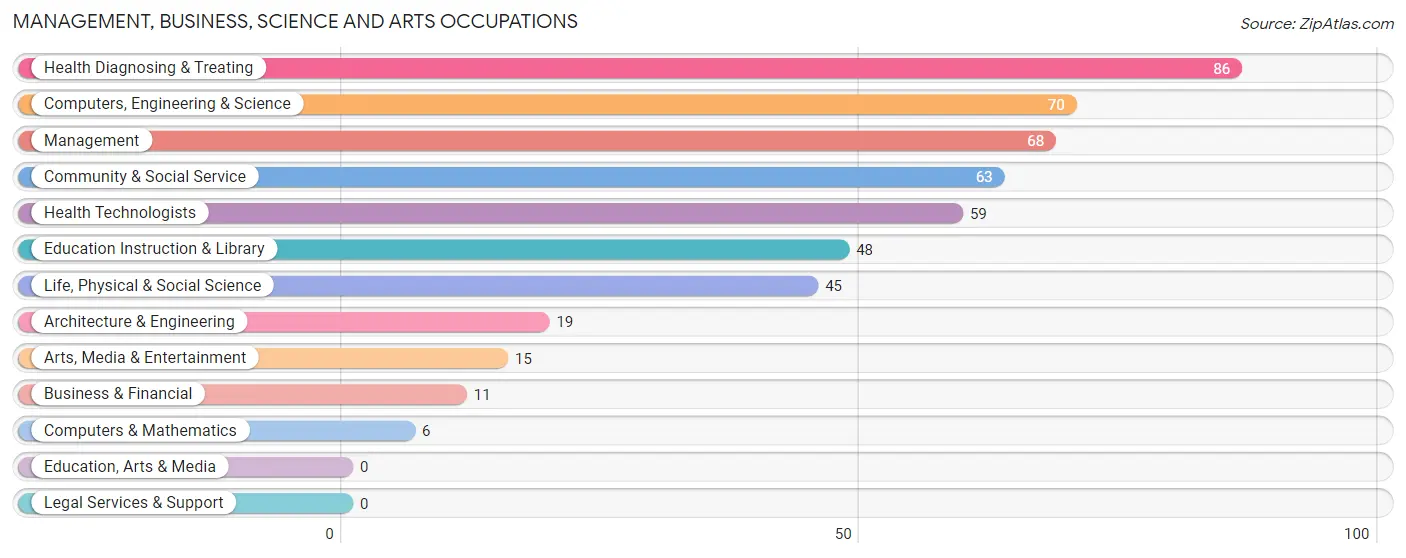
The most common Management, Business, Science and Arts occupations in Hanceville are Health Diagnosing & Treating (86 | 6.6%), Computers, Engineering & Science (70 | 5.4%), Management (68 | 5.2%), Community & Social Service (63 | 4.8%), and Health Technologists (59 | 4.5%).
Management, Business, Science and Arts Occupations by Sex
Within the Management, Business, Science and Arts occupations in Hanceville, the most male-oriented occupations are Business & Financial (100.0%), Computers, Engineering & Science (100.0%), and Computers & Mathematics (100.0%), while the most female-oriented occupations are Health Diagnosing & Treating (100.0%), Health Technologists (100.0%), and Education Instruction & Library (97.9%).
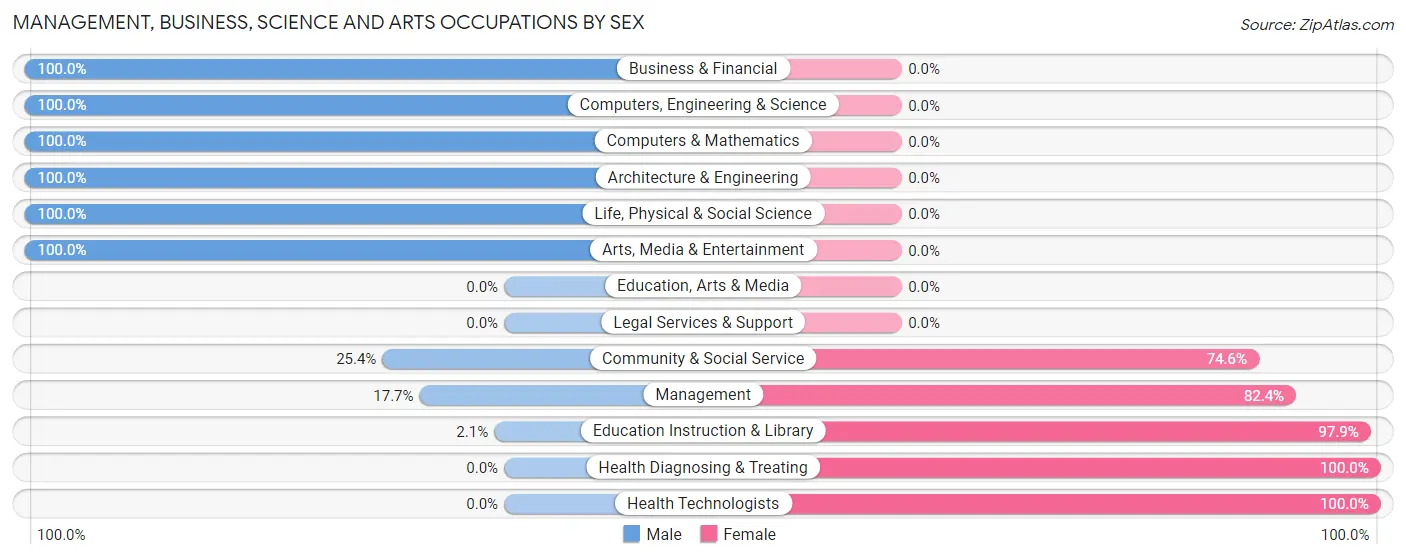
| Occupation | Male | Female |
| Management | 12 (17.6%) | 56 (82.4%) |
| Business & Financial | 11 (100.0%) | 0 (0.0%) |
| Computers, Engineering & Science | 70 (100.0%) | 0 (0.0%) |
| Computers & Mathematics | 6 (100.0%) | 0 (0.0%) |
| Architecture & Engineering | 19 (100.0%) | 0 (0.0%) |
| Life, Physical & Social Science | 45 (100.0%) | 0 (0.0%) |
| Community & Social Service | 16 (25.4%) | 47 (74.6%) |
| Education, Arts & Media | 0 (0.0%) | 0 (0.0%) |
| Legal Services & Support | 0 (0.0%) | 0 (0.0%) |
| Education Instruction & Library | 1 (2.1%) | 47 (97.9%) |
| Arts, Media & Entertainment | 15 (100.0%) | 0 (0.0%) |
| Health Diagnosing & Treating | 0 (0.0%) | 86 (100.0%) |
| Health Technologists | 0 (0.0%) | 59 (100.0%) |
| Total (Category) | 109 (36.6%) | 189 (63.4%) |
| Total (Overall) | 684 (52.5%) | 619 (47.5%) |
Services Occupations
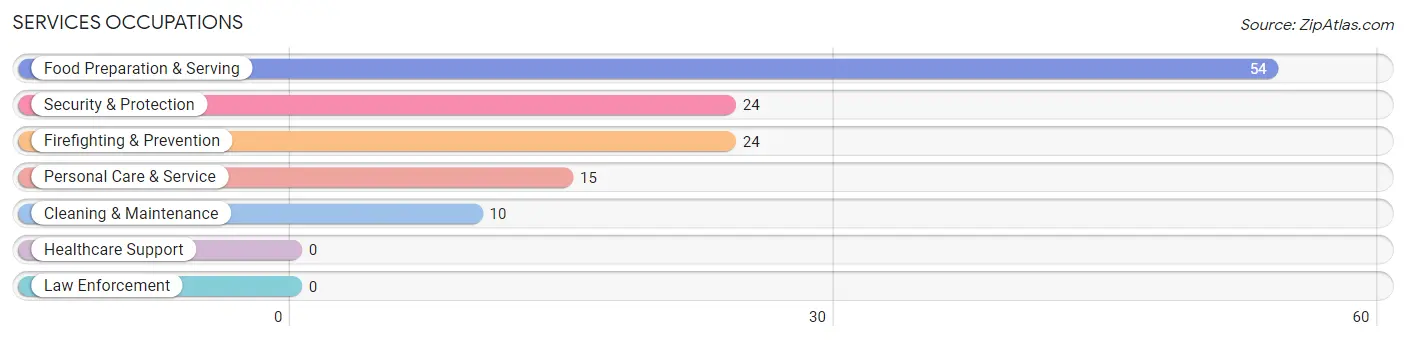
The most common Services occupations in Hanceville are Food Preparation & Serving (54 | 4.1%), Security & Protection (24 | 1.8%), Firefighting & Prevention (24 | 1.8%), Personal Care & Service (15 | 1.1%), and Cleaning & Maintenance (10 | 0.8%).
Services Occupations by Sex
Within the Services occupations in Hanceville, the most male-oriented occupations are Security & Protection (100.0%), Firefighting & Prevention (100.0%), and Food Preparation & Serving (40.7%), while the most female-oriented occupations are Cleaning & Maintenance (100.0%), Personal Care & Service (73.3%), and Food Preparation & Serving (59.3%).
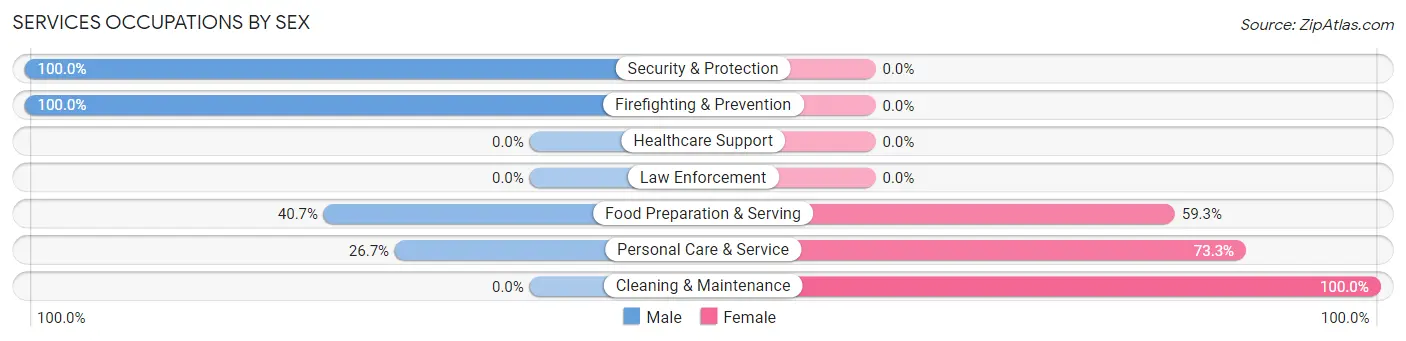
| Occupation | Male | Female |
| Healthcare Support | 0 (0.0%) | 0 (0.0%) |
| Security & Protection | 24 (100.0%) | 0 (0.0%) |
| Firefighting & Prevention | 24 (100.0%) | 0 (0.0%) |
| Law Enforcement | 0 (0.0%) | 0 (0.0%) |
| Food Preparation & Serving | 22 (40.7%) | 32 (59.3%) |
| Cleaning & Maintenance | 0 (0.0%) | 10 (100.0%) |
| Personal Care & Service | 4 (26.7%) | 11 (73.3%) |
| Total (Category) | 50 (48.5%) | 53 (51.5%) |
| Total (Overall) | 684 (52.5%) | 619 (47.5%) |
Sales and Office Occupations
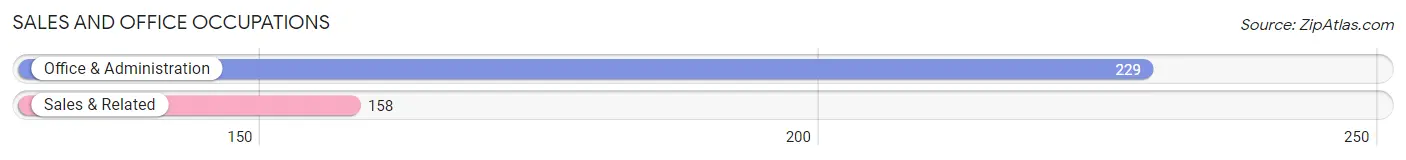
The most common Sales and Office occupations in Hanceville are Office & Administration (229 | 17.6%), and Sales & Related (158 | 12.1%).
Sales and Office Occupations by Sex
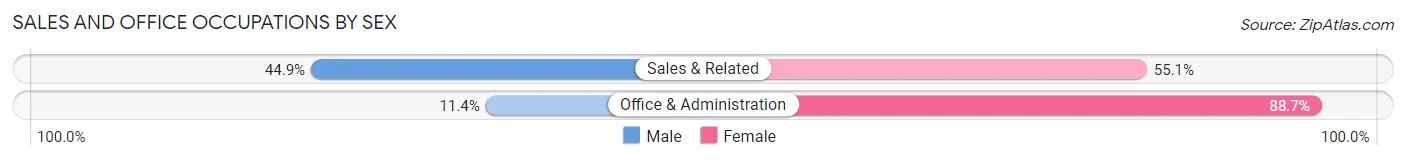
| Occupation | Male | Female |
| Sales & Related | 71 (44.9%) | 87 (55.1%) |
| Office & Administration | 26 (11.4%) | 203 (88.6%) |
| Total (Category) | 97 (25.1%) | 290 (74.9%) |
| Total (Overall) | 684 (52.5%) | 619 (47.5%) |
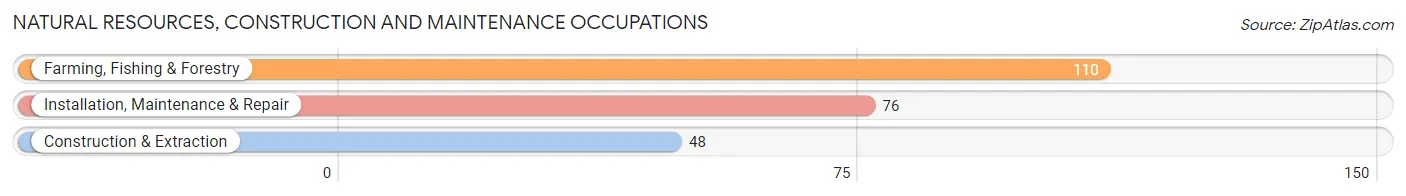
Natural Resources, Construction and Maintenance Occupations
The most common Natural Resources, Construction and Maintenance occupations in Hanceville are Farming, Fishing & Forestry (110 | 8.4%), Installation, Maintenance & Repair (76 | 5.8%), and Construction & Extraction (48 | 3.7%).
Natural Resources, Construction and Maintenance Occupations by Sex
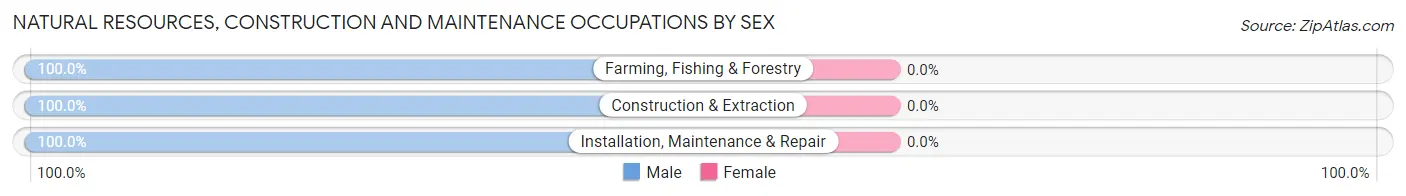
| Occupation | Male | Female |
| Farming, Fishing & Forestry | 110 (100.0%) | 0 (0.0%) |
| Construction & Extraction | 48 (100.0%) | 0 (0.0%) |
| Installation, Maintenance & Repair | 76 (100.0%) | 0 (0.0%) |
| Total (Category) | 234 (100.0%) | 0 (0.0%) |
| Total (Overall) | 684 (52.5%) | 619 (47.5%) |
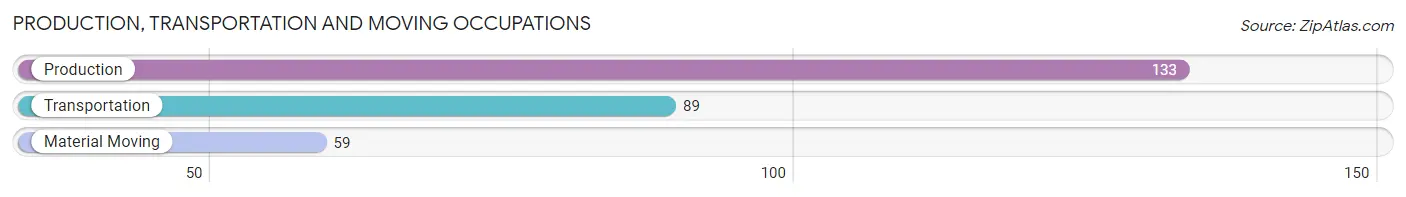
Production, Transportation and Moving Occupations
The most common Production, Transportation and Moving occupations in Hanceville are Production (133 | 10.2%), Transportation (89 | 6.8%), and Material Moving (59 | 4.5%).
Production, Transportation and Moving Occupations by Sex
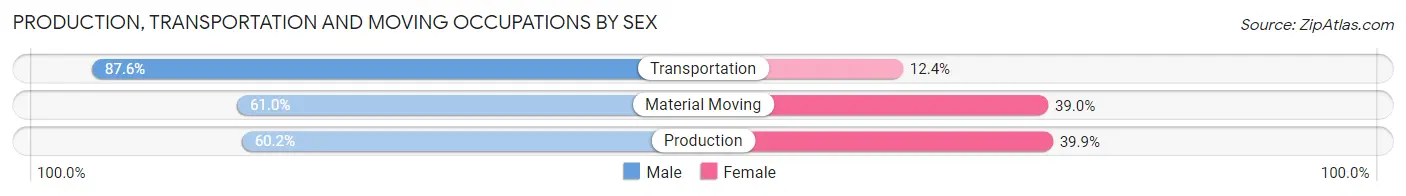
| Occupation | Male | Female |
| Production | 80 (60.2%) | 53 (39.9%) |
| Transportation | 78 (87.6%) | 11 (12.4%) |
| Material Moving | 36 (61.0%) | 23 (39.0%) |
| Total (Category) | 194 (69.0%) | 87 (31.0%) |
| Total (Overall) | 684 (52.5%) | 619 (47.5%) |
Employment Industries by Sex in Hanceville
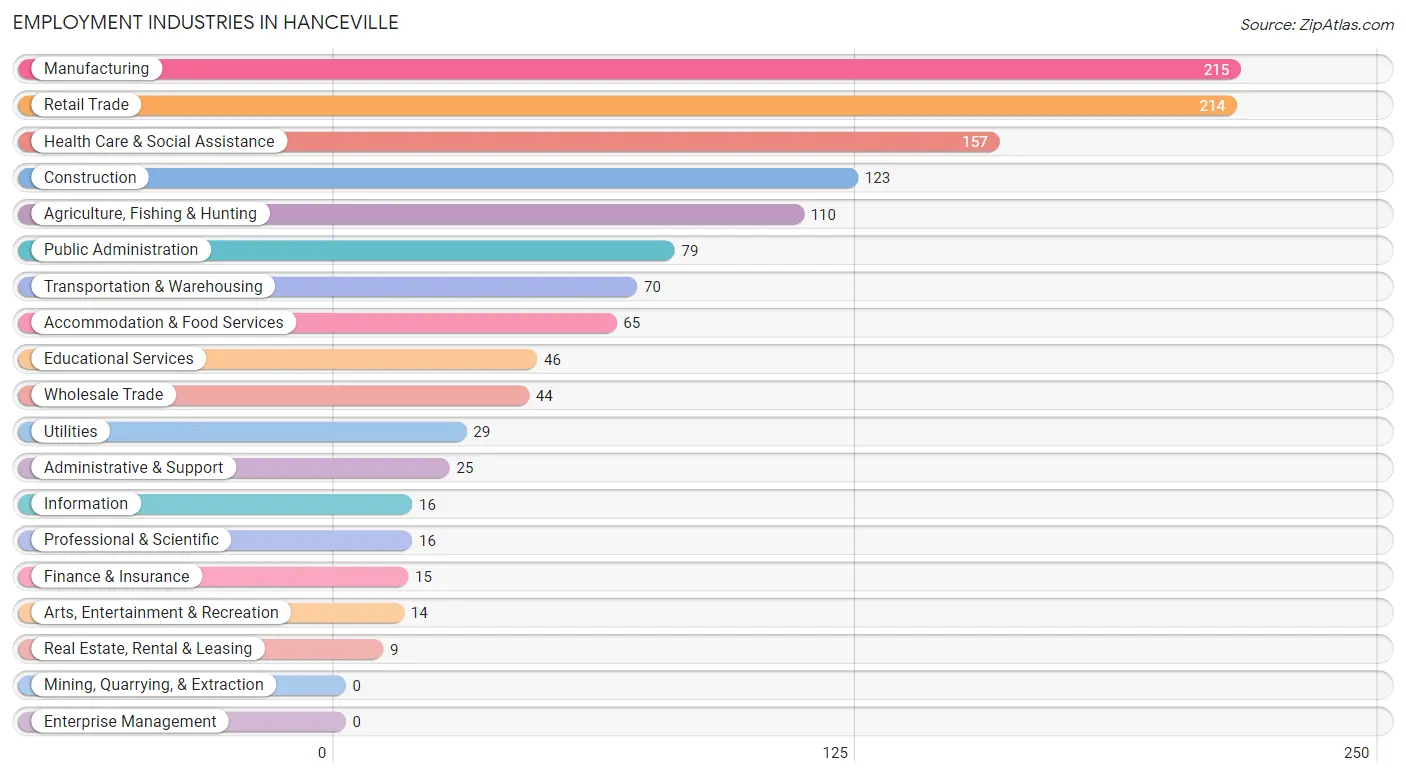
Employment Industries in Hanceville
The major employment industries in Hanceville include Manufacturing (215 | 16.5%), Retail Trade (214 | 16.4%), Health Care & Social Assistance (157 | 12.0%), Construction (123 | 9.4%), and Agriculture, Fishing & Hunting (110 | 8.4%).
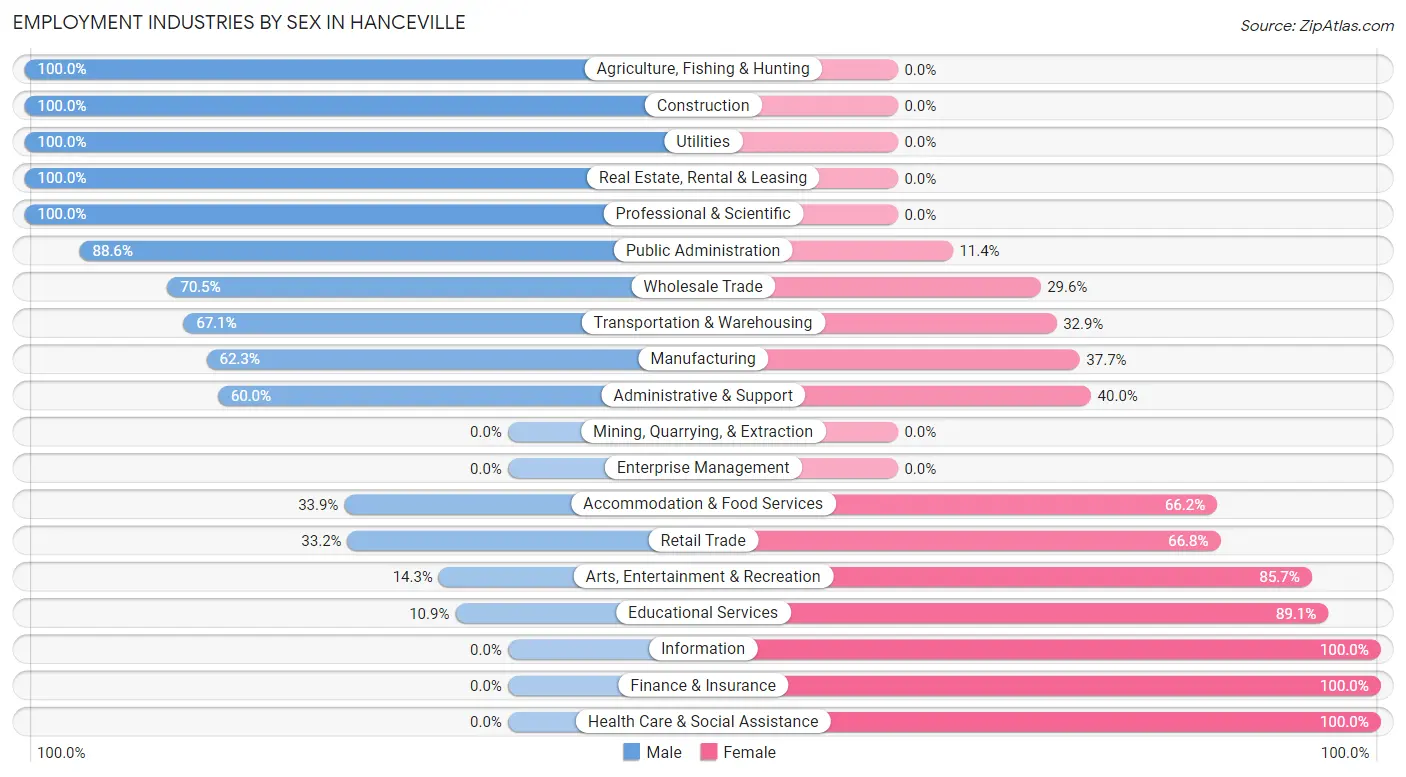
Employment Industries by Sex in Hanceville
The Hanceville industries that see more men than women are Agriculture, Fishing & Hunting (100.0%), Construction (100.0%), and Utilities (100.0%), whereas the industries that tend to have a higher number of women are Information (100.0%), Finance & Insurance (100.0%), and Health Care & Social Assistance (100.0%).
| Industry | Male | Female |
| Agriculture, Fishing & Hunting | 110 (100.0%) | 0 (0.0%) |
| Mining, Quarrying, & Extraction | 0 (0.0%) | 0 (0.0%) |
| Construction | 123 (100.0%) | 0 (0.0%) |
| Manufacturing | 134 (62.3%) | 81 (37.7%) |
| Wholesale Trade | 31 (70.5%) | 13 (29.5%) |
| Retail Trade | 71 (33.2%) | 143 (66.8%) |
| Transportation & Warehousing | 47 (67.1%) | 23 (32.9%) |
| Utilities | 29 (100.0%) | 0 (0.0%) |
| Information | 0 (0.0%) | 16 (100.0%) |
| Finance & Insurance | 0 (0.0%) | 15 (100.0%) |
| Real Estate, Rental & Leasing | 9 (100.0%) | 0 (0.0%) |
| Professional & Scientific | 16 (100.0%) | 0 (0.0%) |
| Enterprise Management | 0 (0.0%) | 0 (0.0%) |
| Administrative & Support | 15 (60.0%) | 10 (40.0%) |
| Educational Services | 5 (10.9%) | 41 (89.1%) |
| Health Care & Social Assistance | 0 (0.0%) | 157 (100.0%) |
| Arts, Entertainment & Recreation | 2 (14.3%) | 12 (85.7%) |
| Accommodation & Food Services | 22 (33.9%) | 43 (66.1%) |
| Public Administration | 70 (88.6%) | 9 (11.4%) |
| Total | 684 (52.5%) | 619 (47.5%) |
Education in Hanceville
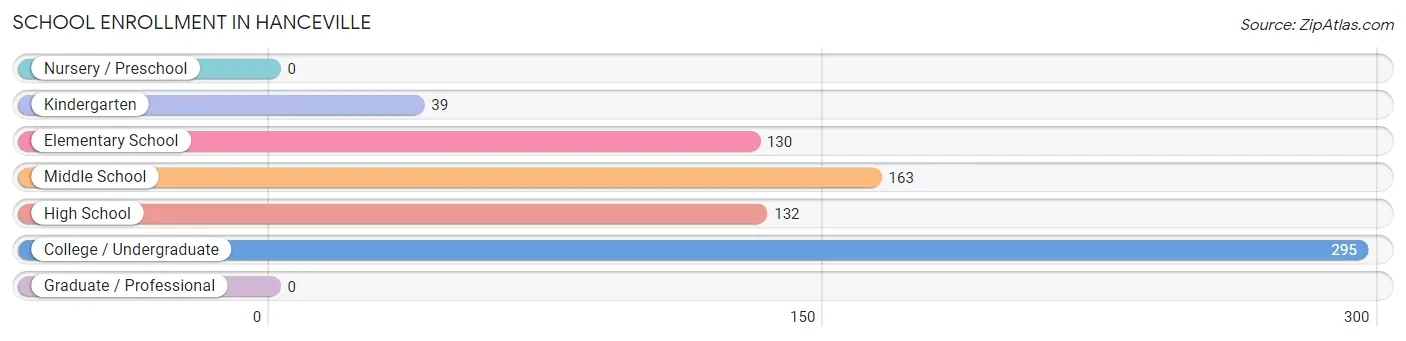
School Enrollment in Hanceville
The most common levels of schooling among the 759 students in Hanceville are college / undergraduate (295 | 38.9%), middle school (163 | 21.5%), and high school (132 | 17.4%).
| School Level | # Students | % Students |
| Nursery / Preschool | 0 | 0.0% |
| Kindergarten | 39 | 5.1% |
| Elementary School | 130 | 17.1% |
| Middle School | 163 | 21.5% |
| High School | 132 | 17.4% |
| College / Undergraduate | 295 | 38.9% |
| Graduate / Professional | 0 | 0.0% |
| Total | 759 | 100.0% |
School Enrollment by Age by Funding Source in Hanceville
Out of a total of 759 students who are enrolled in schools in Hanceville, 60 (7.9%) attend a private institution, while the remaining 699 (92.1%) are enrolled in public schools. The age group of 20 to 24 year olds has the highest likelihood of being enrolled in private schools, with 46 (29.7% in the age bracket) enrolled. Conversely, the age group of 5 to 9 year old has the lowest likelihood of being enrolled in a private school, with 169 (100.0% in the age bracket) attending a public institution.
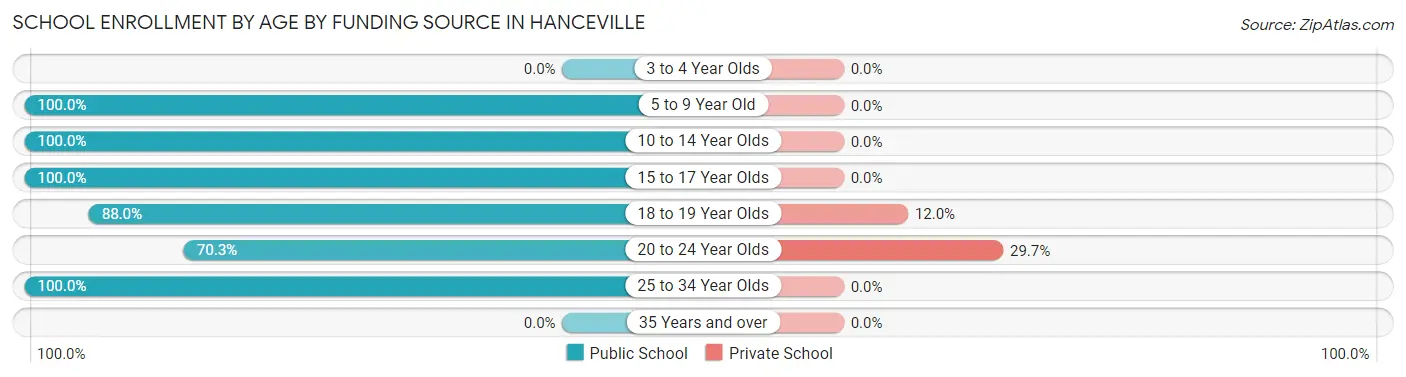
| Age Bracket | Public School | Private School |
| 3 to 4 Year Olds | 0 (0.0%) | 0 (0.0%) |
| 5 to 9 Year Old | 169 (100.0%) | 0 (0.0%) |
| 10 to 14 Year Olds | 177 (100.0%) | 0 (0.0%) |
| 15 to 17 Year Olds | 115 (100.0%) | 0 (0.0%) |
| 18 to 19 Year Olds | 103 (88.0%) | 14 (12.0%) |
| 20 to 24 Year Olds | 109 (70.3%) | 46 (29.7%) |
| 25 to 34 Year Olds | 26 (100.0%) | 0 (0.0%) |
| 35 Years and over | 0 (0.0%) | 0 (0.0%) |
| Total | 699 (92.1%) | 60 (7.9%) |
Educational Attainment by Field of Study in Hanceville
Business (46 | 22.2%), arts & humanities (45 | 21.7%), science & technology (44 | 21.3%), education (41 | 19.8%), and physical & health sciences (13 | 6.3%) are the most common fields of study among 207 individuals in Hanceville who have obtained a bachelor's degree or higher.
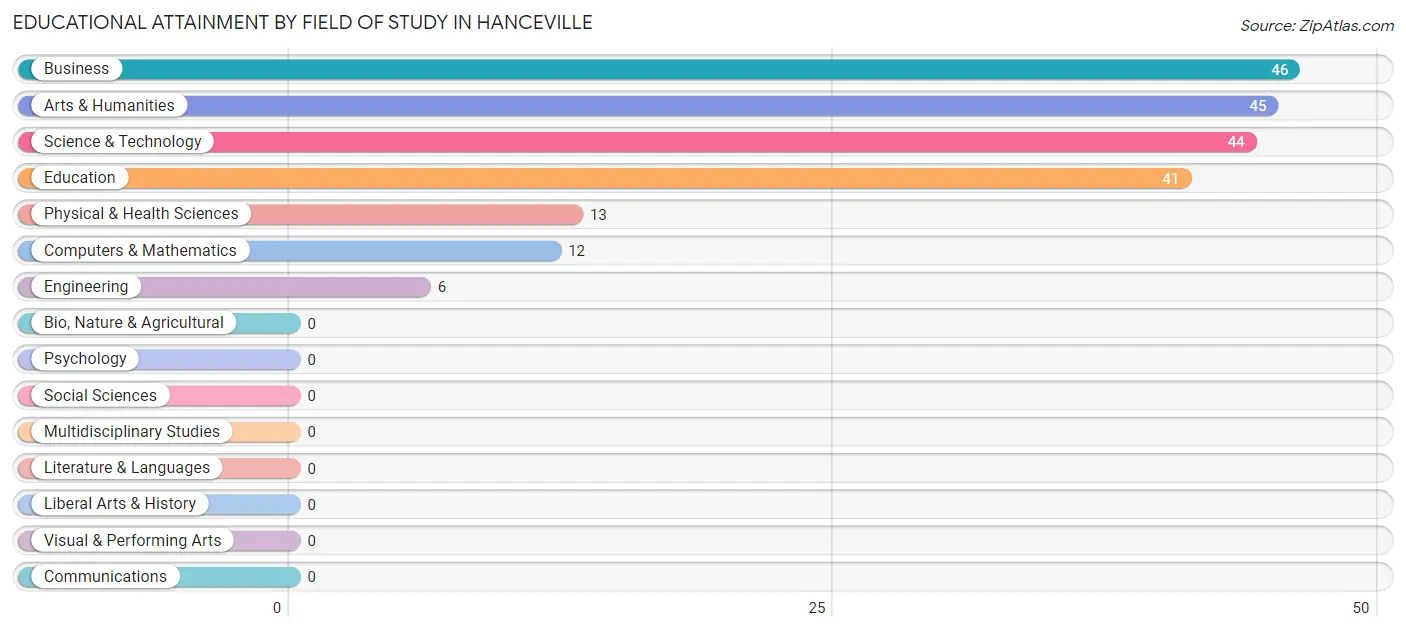
| Field of Study | # Graduates | % Graduates |
| Computers & Mathematics | 12 | 5.8% |
| Bio, Nature & Agricultural | 0 | 0.0% |
| Physical & Health Sciences | 13 | 6.3% |
| Psychology | 0 | 0.0% |
| Social Sciences | 0 | 0.0% |
| Engineering | 6 | 2.9% |
| Multidisciplinary Studies | 0 | 0.0% |
| Science & Technology | 44 | 21.3% |
| Business | 46 | 22.2% |
| Education | 41 | 19.8% |
| Literature & Languages | 0 | 0.0% |
| Liberal Arts & History | 0 | 0.0% |
| Visual & Performing Arts | 0 | 0.0% |
| Communications | 0 | 0.0% |
| Arts & Humanities | 45 | 21.7% |
| Total | 207 | 100.0% |
Transportation & Commute in Hanceville
Vehicle Availability by Sex in Hanceville
The most prevalent vehicle ownership categories in Hanceville are males with 3 vehicles (204, accounting for 32.1%) and females with 3 vehicles (185, making up 35.2%).
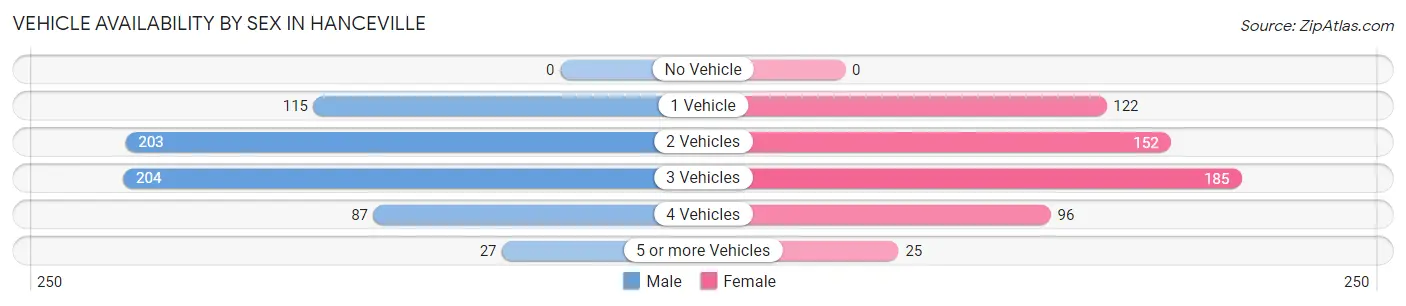
| Vehicles Available | Male | Female |
| No Vehicle | 0 (0.0%) | 0 (0.0%) |
| 1 Vehicle | 115 (18.1%) | 122 (21.0%) |
| 2 Vehicles | 203 (31.9%) | 152 (26.2%) |
| 3 Vehicles | 204 (32.1%) | 185 (31.9%) |
| 4 Vehicles | 87 (13.7%) | 96 (16.6%) |
| 5 or more Vehicles | 27 (4.3%) | 25 (4.3%) |
| Total | 636 (100.0%) | 580 (100.0%) |
Commute Time in Hanceville
The most frequently occuring commute durations in Hanceville are 20 to 24 minutes (203 commuters, 16.3%), 15 to 19 minutes (177 commuters, 14.2%), and 45 to 59 minutes (168 commuters, 13.5%).
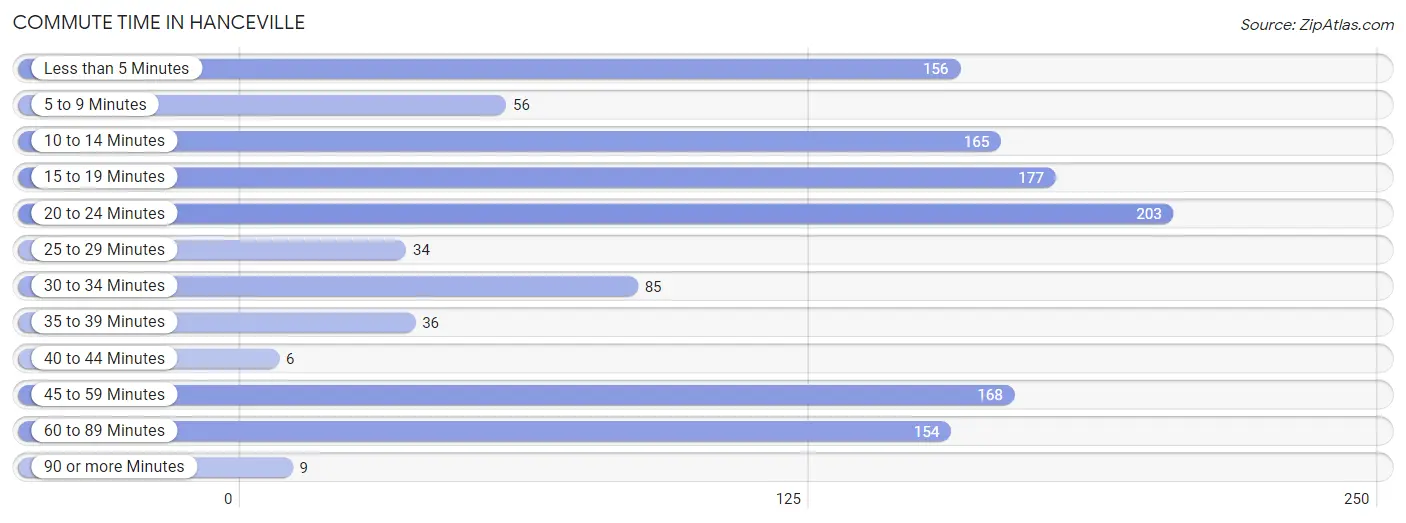
| Commute Time | # Commuters | % Commuters |
| Less than 5 Minutes | 156 | 12.5% |
| 5 to 9 Minutes | 56 | 4.5% |
| 10 to 14 Minutes | 165 | 13.2% |
| 15 to 19 Minutes | 177 | 14.2% |
| 20 to 24 Minutes | 203 | 16.3% |
| 25 to 29 Minutes | 34 | 2.7% |
| 30 to 34 Minutes | 85 | 6.8% |
| 35 to 39 Minutes | 36 | 2.9% |
| 40 to 44 Minutes | 6 | 0.5% |
| 45 to 59 Minutes | 168 | 13.5% |
| 60 to 89 Minutes | 154 | 12.3% |
| 90 or more Minutes | 9 | 0.7% |
Commute Time by Sex in Hanceville
The most common commute times in Hanceville are 45 to 59 minutes (128 commuters, 20.1%) for males and 15 to 19 minutes (150 commuters, 24.5%) for females.
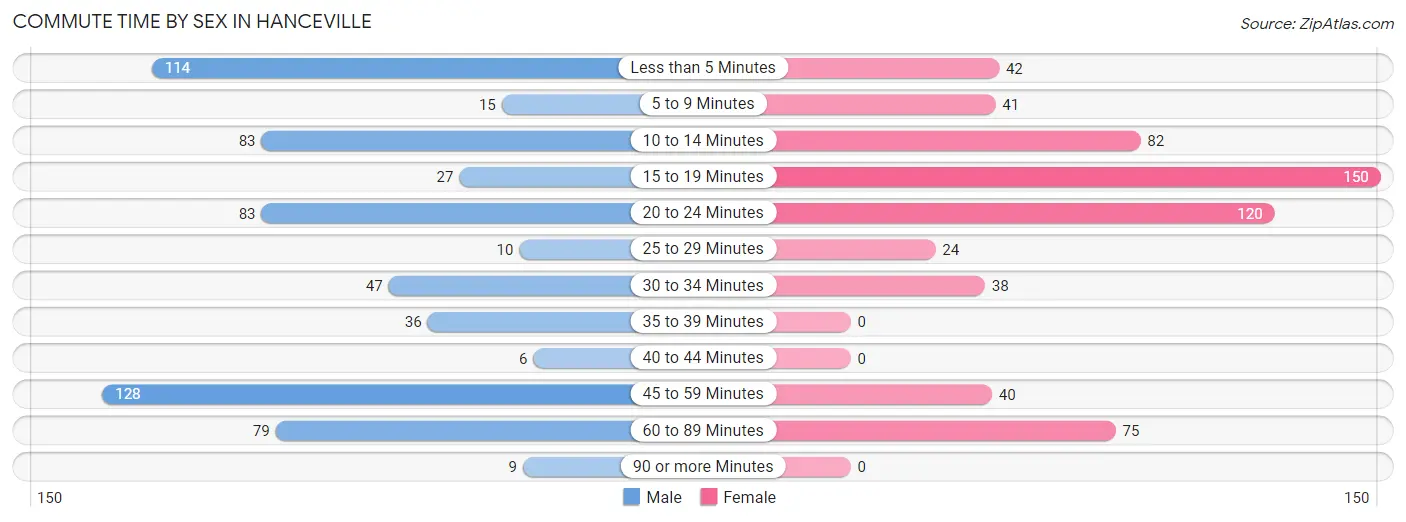
| Commute Time | Male | Female |
| Less than 5 Minutes | 114 (17.9%) | 42 (6.9%) |
| 5 to 9 Minutes | 15 (2.4%) | 41 (6.7%) |
| 10 to 14 Minutes | 83 (13.0%) | 82 (13.4%) |
| 15 to 19 Minutes | 27 (4.2%) | 150 (24.5%) |
| 20 to 24 Minutes | 83 (13.0%) | 120 (19.6%) |
| 25 to 29 Minutes | 10 (1.6%) | 24 (3.9%) |
| 30 to 34 Minutes | 47 (7.4%) | 38 (6.2%) |
| 35 to 39 Minutes | 36 (5.7%) | 0 (0.0%) |
| 40 to 44 Minutes | 6 (0.9%) | 0 (0.0%) |
| 45 to 59 Minutes | 128 (20.1%) | 40 (6.5%) |
| 60 to 89 Minutes | 79 (12.4%) | 75 (12.2%) |
| 90 or more Minutes | 9 (1.4%) | 0 (0.0%) |
Time of Departure to Work by Sex in Hanceville
The most frequent times of departure to work in Hanceville are 12:00 AM to 4:59 AM (197, 30.9%) for males and 7:30 AM to 7:59 AM (112, 18.3%) for females.
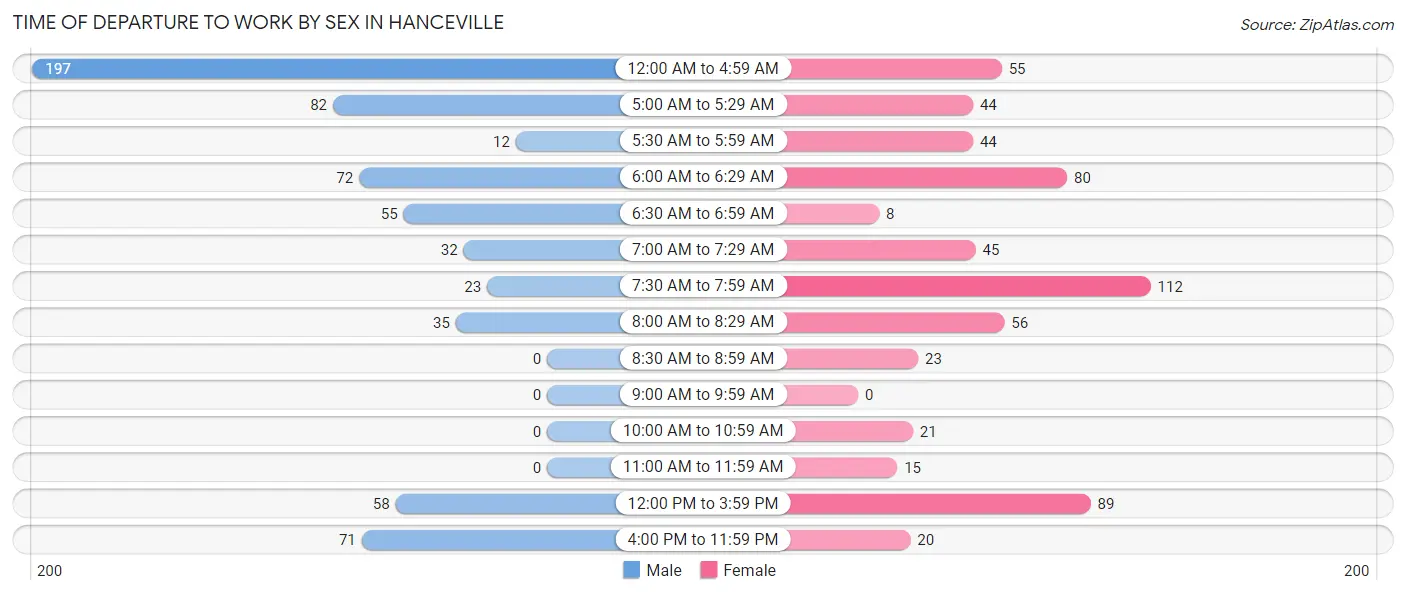
| Time of Departure | Male | Female |
| 12:00 AM to 4:59 AM | 197 (30.9%) | 55 (9.0%) |
| 5:00 AM to 5:29 AM | 82 (12.9%) | 44 (7.2%) |
| 5:30 AM to 5:59 AM | 12 (1.9%) | 44 (7.2%) |
| 6:00 AM to 6:29 AM | 72 (11.3%) | 80 (13.1%) |
| 6:30 AM to 6:59 AM | 55 (8.6%) | 8 (1.3%) |
| 7:00 AM to 7:29 AM | 32 (5.0%) | 45 (7.3%) |
| 7:30 AM to 7:59 AM | 23 (3.6%) | 112 (18.3%) |
| 8:00 AM to 8:29 AM | 35 (5.5%) | 56 (9.1%) |
| 8:30 AM to 8:59 AM | 0 (0.0%) | 23 (3.8%) |
| 9:00 AM to 9:59 AM | 0 (0.0%) | 0 (0.0%) |
| 10:00 AM to 10:59 AM | 0 (0.0%) | 21 (3.4%) |
| 11:00 AM to 11:59 AM | 0 (0.0%) | 15 (2.5%) |
| 12:00 PM to 3:59 PM | 58 (9.1%) | 89 (14.5%) |
| 4:00 PM to 11:59 PM | 71 (11.2%) | 20 (3.3%) |
| Total | 637 (100.0%) | 612 (100.0%) |
Housing Occupancy in Hanceville
Occupancy by Ownership in Hanceville
Of the total 1,265 dwellings in Hanceville, owner-occupied units account for 637 (50.4%), while renter-occupied units make up 628 (49.6%).
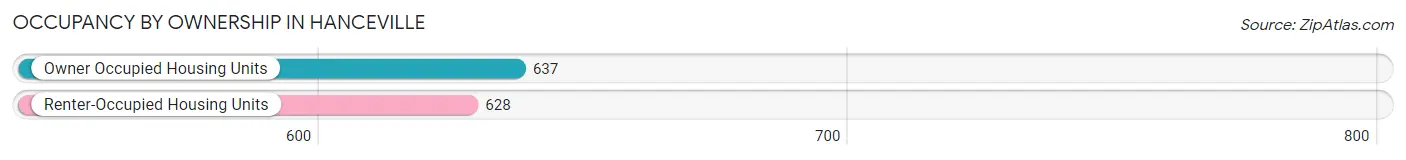
| Occupancy | # Housing Units | % Housing Units |
| Owner Occupied Housing Units | 637 | 50.4% |
| Renter-Occupied Housing Units | 628 | 49.6% |
| Total Occupied Housing Units | 1,265 | 100.0% |
Occupancy by Household Size in Hanceville
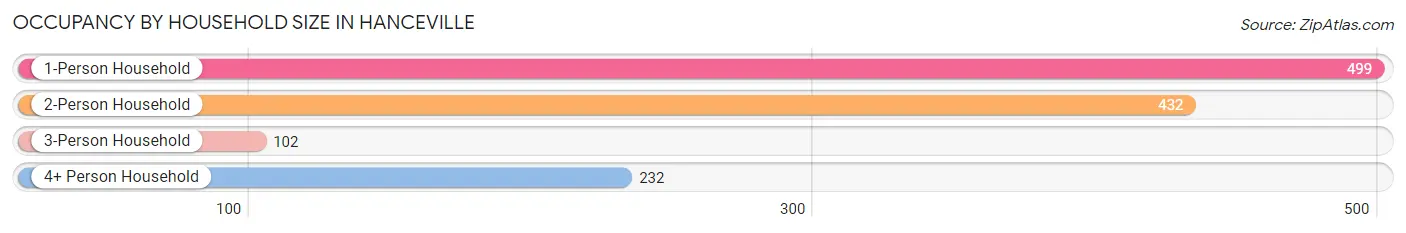
| Household Size | # Housing Units | % Housing Units |
| 1-Person Household | 499 | 39.5% |
| 2-Person Household | 432 | 34.2% |
| 3-Person Household | 102 | 8.1% |
| 4+ Person Household | 232 | 18.3% |
| Total Housing Units | 1,265 | 100.0% |
Occupancy by Ownership by Household Size in Hanceville
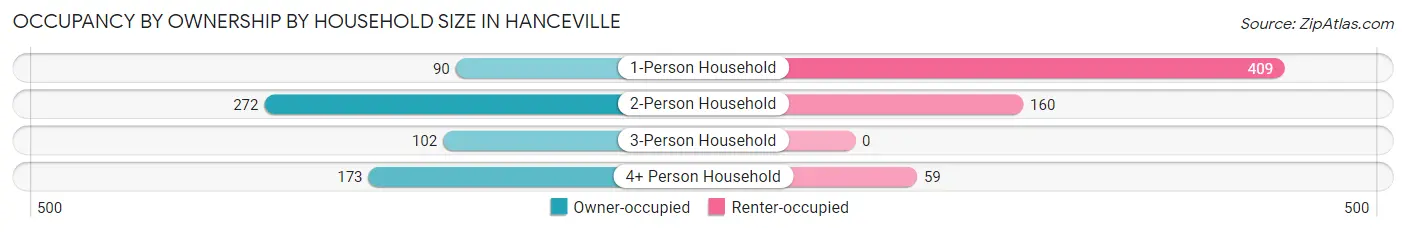
| Household Size | Owner-occupied | Renter-occupied |
| 1-Person Household | 90 (18.0%) | 409 (82.0%) |
| 2-Person Household | 272 (63.0%) | 160 (37.0%) |
| 3-Person Household | 102 (100.0%) | 0 (0.0%) |
| 4+ Person Household | 173 (74.6%) | 59 (25.4%) |
| Total Housing Units | 637 (50.4%) | 628 (49.6%) |
Occupancy by Educational Attainment in Hanceville
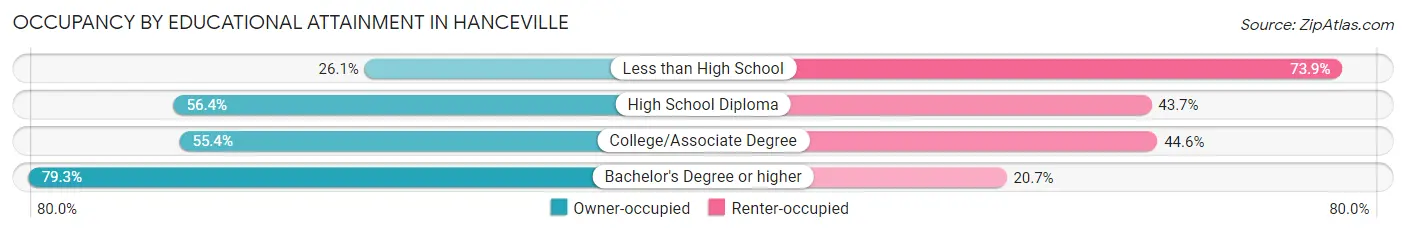
| Household Size | Owner-occupied | Renter-occupied |
| Less than High School | 86 (26.1%) | 244 (73.9%) |
| High School Diploma | 235 (56.4%) | 182 (43.6%) |
| College/Associate Degree | 220 (55.4%) | 177 (44.6%) |
| Bachelor's Degree or higher | 96 (79.3%) | 25 (20.7%) |
Occupancy by Age of Householder in Hanceville
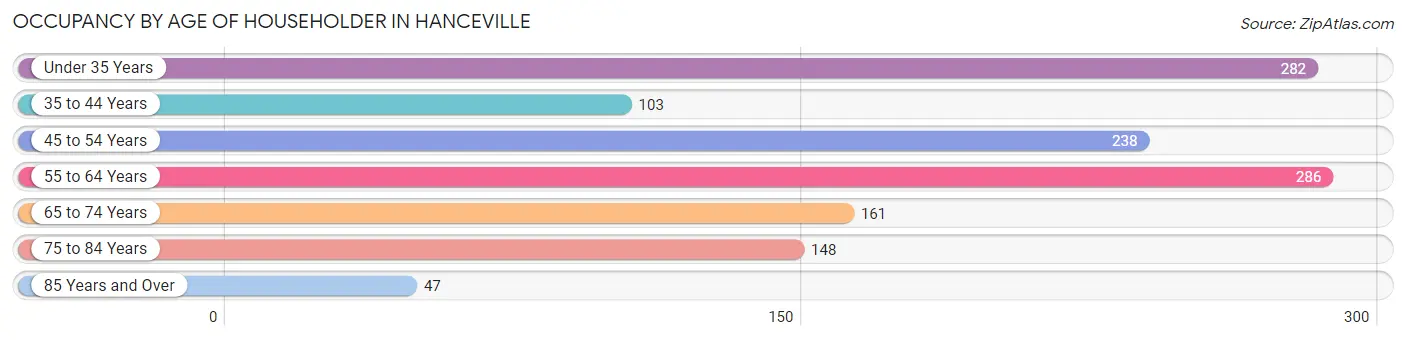
| Age Bracket | # Households | % Households |
| Under 35 Years | 282 | 22.3% |
| 35 to 44 Years | 103 | 8.1% |
| 45 to 54 Years | 238 | 18.8% |
| 55 to 64 Years | 286 | 22.6% |
| 65 to 74 Years | 161 | 12.7% |
| 75 to 84 Years | 148 | 11.7% |
| 85 Years and Over | 47 | 3.7% |
| Total | 1,265 | 100.0% |
Housing Finances in Hanceville
Median Income by Occupancy in Hanceville
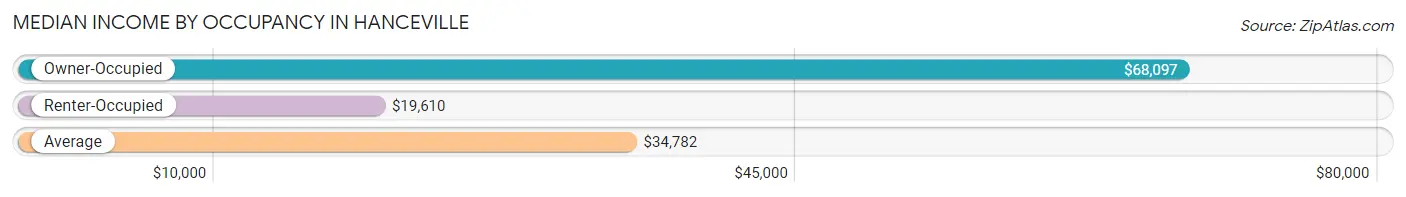
| Occupancy Type | # Households | Median Income |
| Owner-Occupied | 637 (50.4%) | $68,097 |
| Renter-Occupied | 628 (49.6%) | $19,610 |
| Average | 1,265 (100.0%) | $34,782 |
Occupancy by Householder Income Bracket in Hanceville
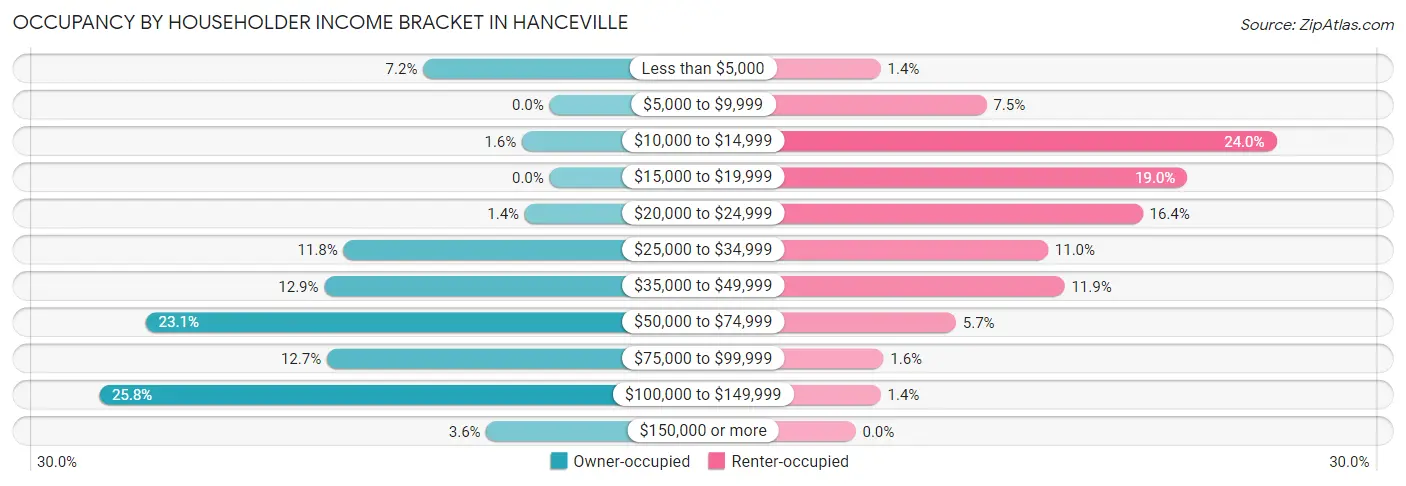
| Income Bracket | Owner-occupied | Renter-occupied |
| Less than $5,000 | 46 (7.2%) | 9 (1.4%) |
| $5,000 to $9,999 | 0 (0.0%) | 47 (7.5%) |
| $10,000 to $14,999 | 10 (1.6%) | 151 (24.0%) |
| $15,000 to $19,999 | 0 (0.0%) | 119 (19.0%) |
| $20,000 to $24,999 | 9 (1.4%) | 103 (16.4%) |
| $25,000 to $34,999 | 75 (11.8%) | 69 (11.0%) |
| $35,000 to $49,999 | 82 (12.9%) | 75 (11.9%) |
| $50,000 to $74,999 | 147 (23.1%) | 36 (5.7%) |
| $75,000 to $99,999 | 81 (12.7%) | 10 (1.6%) |
| $100,000 to $149,999 | 164 (25.8%) | 9 (1.4%) |
| $150,000 or more | 23 (3.6%) | 0 (0.0%) |
| Total | 637 (100.0%) | 628 (100.0%) |
Monthly Housing Cost Tiers in Hanceville
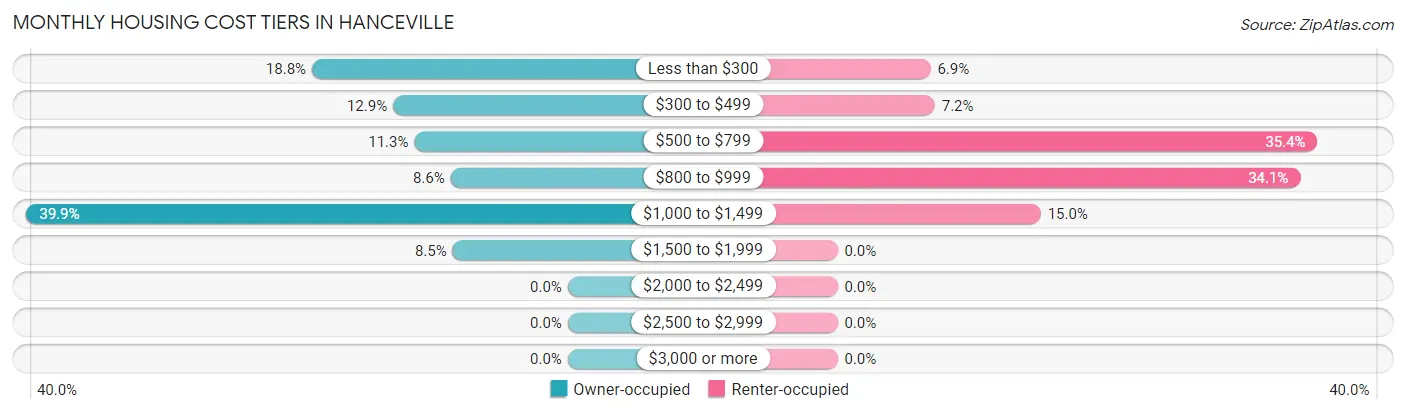
| Monthly Cost | Owner-occupied | Renter-occupied |
| Less than $300 | 120 (18.8%) | 43 (6.9%) |
| $300 to $499 | 82 (12.9%) | 45 (7.2%) |
| $500 to $799 | 72 (11.3%) | 222 (35.3%) |
| $800 to $999 | 55 (8.6%) | 214 (34.1%) |
| $1,000 to $1,499 | 254 (39.9%) | 94 (15.0%) |
| $1,500 to $1,999 | 54 (8.5%) | 0 (0.0%) |
| $2,000 to $2,499 | 0 (0.0%) | 0 (0.0%) |
| $2,500 to $2,999 | 0 (0.0%) | 0 (0.0%) |
| $3,000 or more | 0 (0.0%) | 0 (0.0%) |
| Total | 637 (100.0%) | 628 (100.0%) |
Physical Housing Characteristics in Hanceville
Housing Structures in Hanceville
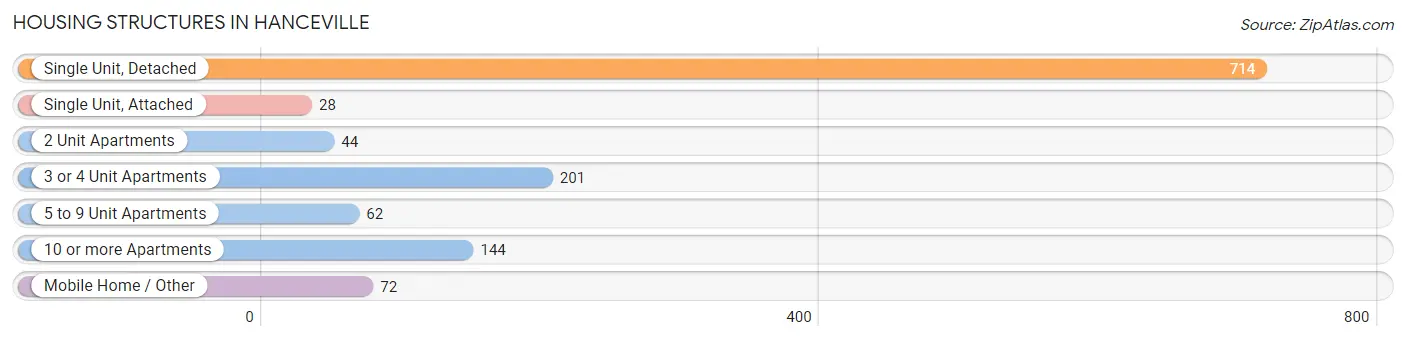
| Structure Type | # Housing Units | % Housing Units |
| Single Unit, Detached | 714 | 56.4% |
| Single Unit, Attached | 28 | 2.2% |
| 2 Unit Apartments | 44 | 3.5% |
| 3 or 4 Unit Apartments | 201 | 15.9% |
| 5 to 9 Unit Apartments | 62 | 4.9% |
| 10 or more Apartments | 144 | 11.4% |
| Mobile Home / Other | 72 | 5.7% |
| Total | 1,265 | 100.0% |
Housing Structures by Occupancy in Hanceville
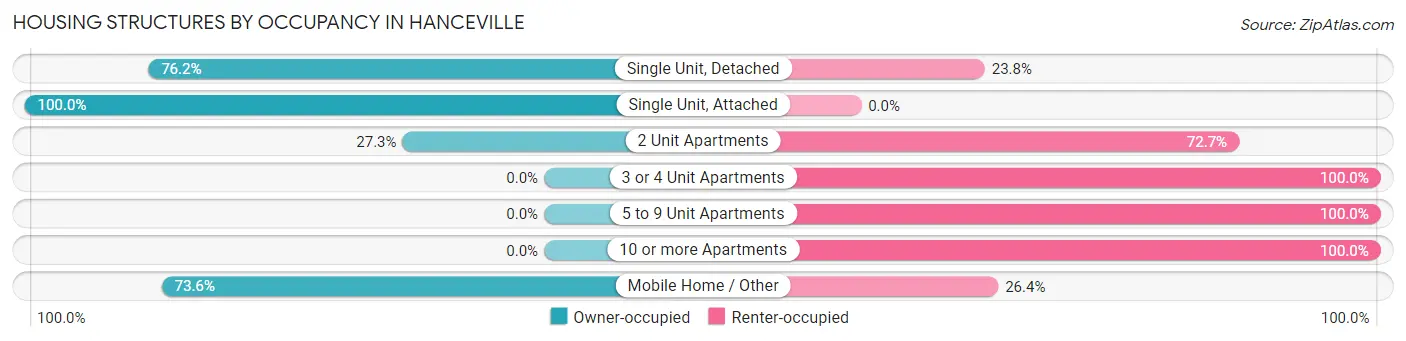
| Structure Type | Owner-occupied | Renter-occupied |
| Single Unit, Detached | 544 (76.2%) | 170 (23.8%) |
| Single Unit, Attached | 28 (100.0%) | 0 (0.0%) |
| 2 Unit Apartments | 12 (27.3%) | 32 (72.7%) |
| 3 or 4 Unit Apartments | 0 (0.0%) | 201 (100.0%) |
| 5 to 9 Unit Apartments | 0 (0.0%) | 62 (100.0%) |
| 10 or more Apartments | 0 (0.0%) | 144 (100.0%) |
| Mobile Home / Other | 53 (73.6%) | 19 (26.4%) |
| Total | 637 (50.4%) | 628 (49.6%) |
Housing Structures by Number of Rooms in Hanceville
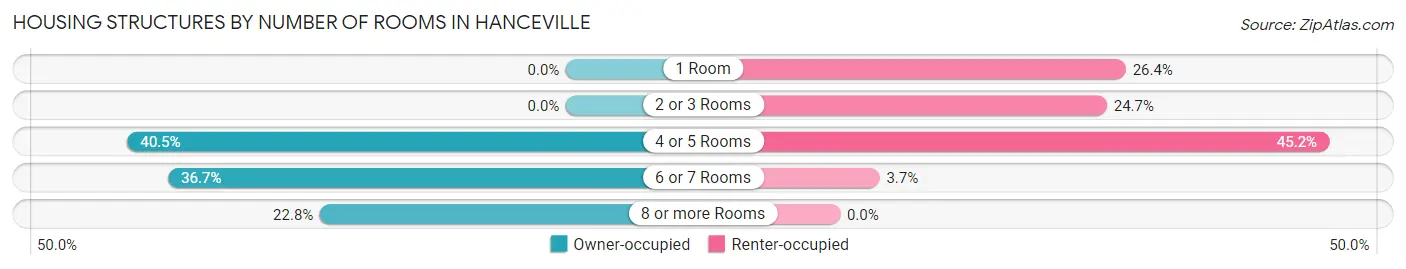
| Number of Rooms | Owner-occupied | Renter-occupied |
| 1 Room | 0 (0.0%) | 166 (26.4%) |
| 2 or 3 Rooms | 0 (0.0%) | 155 (24.7%) |
| 4 or 5 Rooms | 258 (40.5%) | 284 (45.2%) |
| 6 or 7 Rooms | 234 (36.7%) | 23 (3.7%) |
| 8 or more Rooms | 145 (22.8%) | 0 (0.0%) |
| Total | 637 (100.0%) | 628 (100.0%) |
Housing Structure by Heating Type in Hanceville
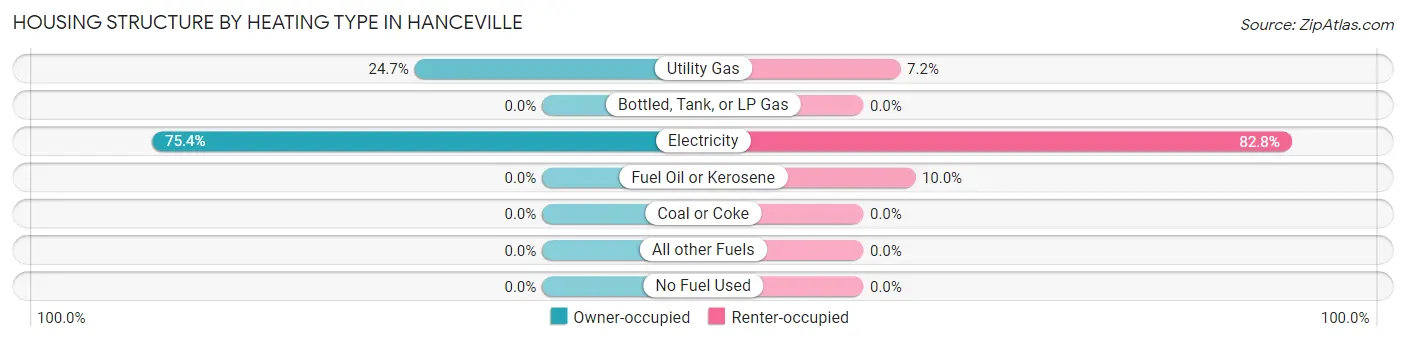
| Heating Type | Owner-occupied | Renter-occupied |
| Utility Gas | 157 (24.6%) | 45 (7.2%) |
| Bottled, Tank, or LP Gas | 0 (0.0%) | 0 (0.0%) |
| Electricity | 480 (75.3%) | 520 (82.8%) |
| Fuel Oil or Kerosene | 0 (0.0%) | 63 (10.0%) |
| Coal or Coke | 0 (0.0%) | 0 (0.0%) |
| All other Fuels | 0 (0.0%) | 0 (0.0%) |
| No Fuel Used | 0 (0.0%) | 0 (0.0%) |
| Total | 637 (100.0%) | 628 (100.0%) |
Household Vehicle Usage in Hanceville
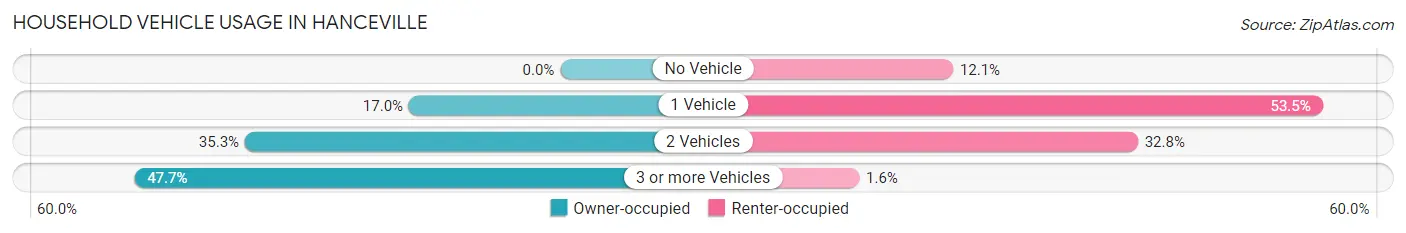
| Vehicles per Household | Owner-occupied | Renter-occupied |
| No Vehicle | 0 (0.0%) | 76 (12.1%) |
| 1 Vehicle | 108 (17.0%) | 336 (53.5%) |
| 2 Vehicles | 225 (35.3%) | 206 (32.8%) |
| 3 or more Vehicles | 304 (47.7%) | 10 (1.6%) |
| Total | 637 (100.0%) | 628 (100.0%) |
Real Estate & Mortgages in Hanceville
Real Estate and Mortgage Overview in Hanceville
| Characteristic | Without Mortgage | With Mortgage |
| Housing Units | 259 | 378 |
| Median Property Value | - | - |
| Median Household Income | - | - |
| Monthly Housing Costs | $351 | $0 |
| Real Estate Taxes | $254 | $75 |
Property Value by Mortgage Status in Hanceville
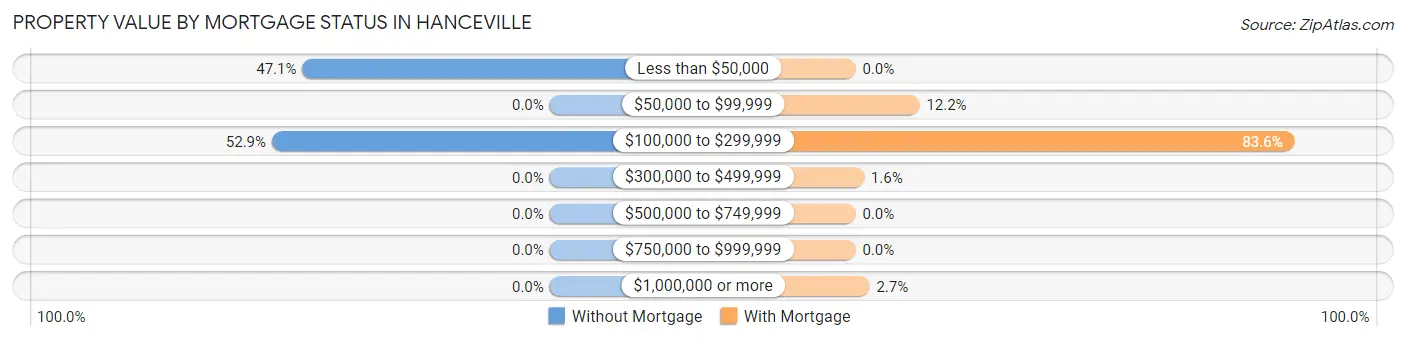
| Property Value | Without Mortgage | With Mortgage |
| Less than $50,000 | 122 (47.1%) | 0 (0.0%) |
| $50,000 to $99,999 | 0 (0.0%) | 46 (12.2%) |
| $100,000 to $299,999 | 137 (52.9%) | 316 (83.6%) |
| $300,000 to $499,999 | 0 (0.0%) | 6 (1.6%) |
| $500,000 to $749,999 | 0 (0.0%) | 0 (0.0%) |
| $750,000 to $999,999 | 0 (0.0%) | 0 (0.0%) |
| $1,000,000 or more | 0 (0.0%) | 10 (2.6%) |
| Total | 259 (100.0%) | 378 (100.0%) |
Household Income by Mortgage Status in Hanceville
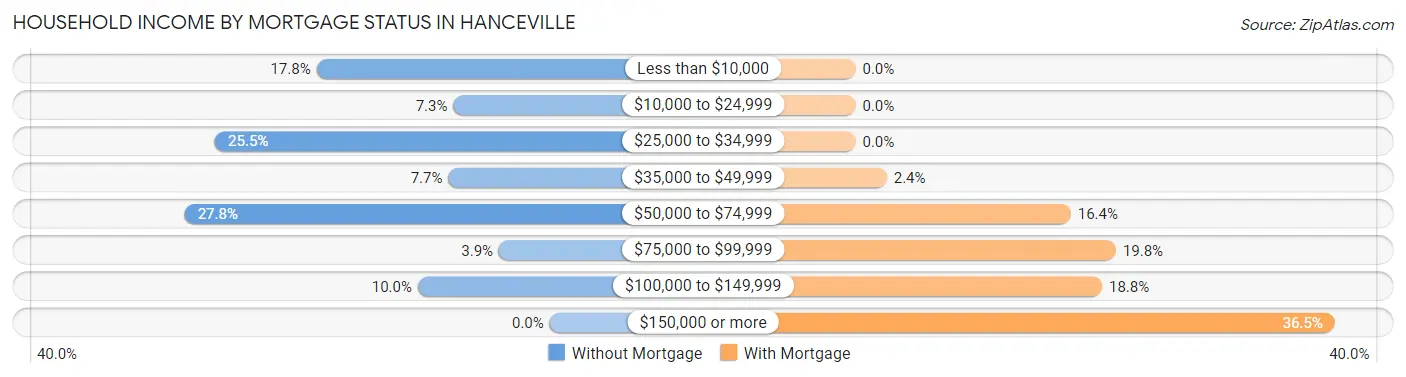
| Household Income | Without Mortgage | With Mortgage |
| Less than $10,000 | 46 (17.8%) | 0 (0.0%) |
| $10,000 to $24,999 | 19 (7.3%) | 0 (0.0%) |
| $25,000 to $34,999 | 66 (25.5%) | 0 (0.0%) |
| $35,000 to $49,999 | 20 (7.7%) | 9 (2.4%) |
| $50,000 to $74,999 | 72 (27.8%) | 62 (16.4%) |
| $75,000 to $99,999 | 10 (3.9%) | 75 (19.8%) |
| $100,000 to $149,999 | 26 (10.0%) | 71 (18.8%) |
| $150,000 or more | 0 (0.0%) | 138 (36.5%) |
| Total | 259 (100.0%) | 378 (100.0%) |
Property Value to Household Income Ratio in Hanceville
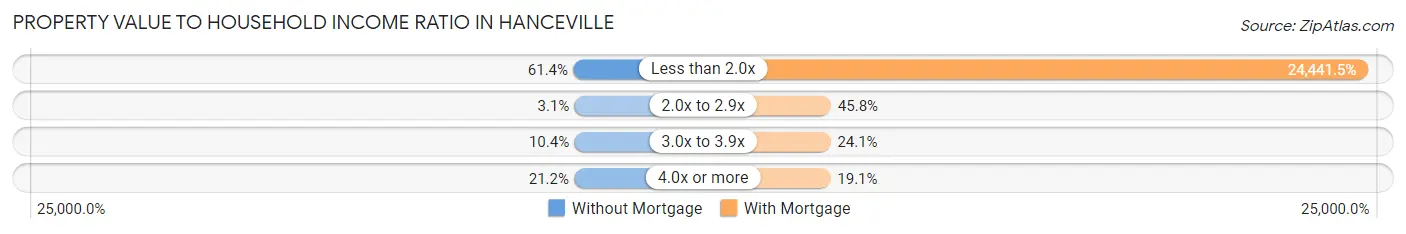
| Value-to-Income Ratio | Without Mortgage | With Mortgage |
| Less than 2.0x | 159 (61.4%) | 92,389 (24,441.5%) |
| 2.0x to 2.9x | 8 (3.1%) | 173 (45.8%) |
| 3.0x to 3.9x | 27 (10.4%) | 91 (24.1%) |
| 4.0x or more | 55 (21.2%) | 72 (19.1%) |
| Total | 259 (100.0%) | 378 (100.0%) |
Real Estate Taxes by Mortgage Status in Hanceville
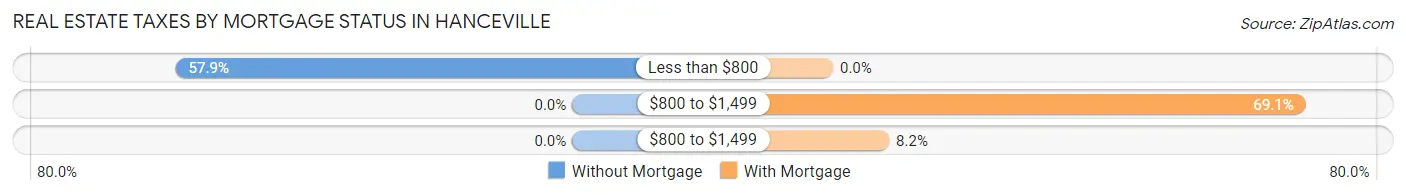
| Property Taxes | Without Mortgage | With Mortgage |
| Less than $800 | 150 (57.9%) | 0 (0.0%) |
| $800 to $1,499 | 0 (0.0%) | 261 (69.1%) |
| $800 to $1,499 | 0 (0.0%) | 31 (8.2%) |
| Total | 259 (100.0%) | 378 (100.0%) |
Health & Disability in Hanceville
Health Insurance Coverage by Age in Hanceville
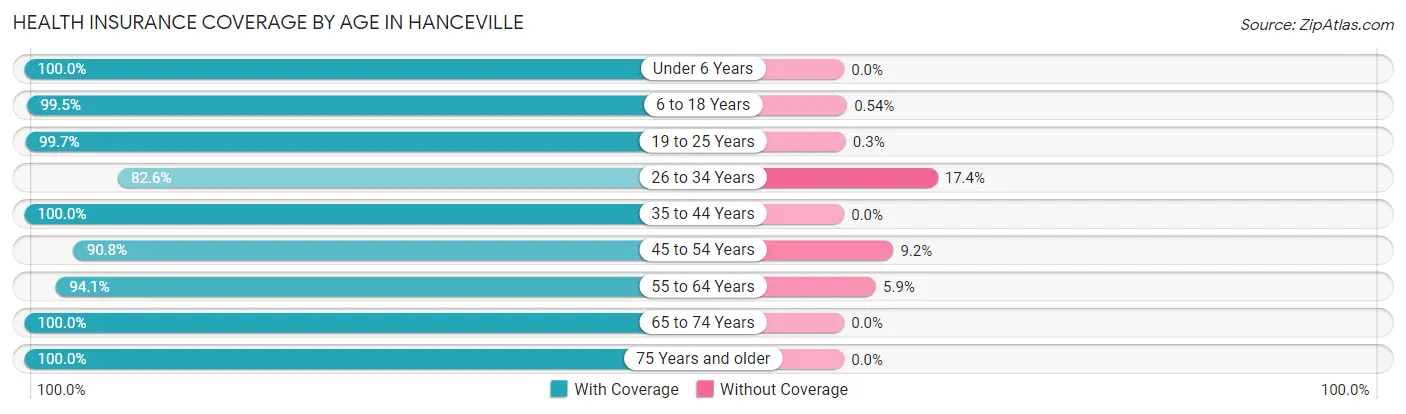
| Age Bracket | With Coverage | Without Coverage |
| Under 6 Years | 105 (100.0%) | 0 (0.0%) |
| 6 to 18 Years | 554 (99.5%) | 3 (0.5%) |
| 19 to 25 Years | 328 (99.7%) | 1 (0.3%) |
| 26 to 34 Years | 374 (82.6%) | 79 (17.4%) |
| 35 to 44 Years | 217 (100.0%) | 0 (0.0%) |
| 45 to 54 Years | 376 (90.8%) | 38 (9.2%) |
| 55 to 64 Years | 317 (94.1%) | 20 (5.9%) |
| 65 to 74 Years | 266 (100.0%) | 0 (0.0%) |
| 75 Years and older | 296 (100.0%) | 0 (0.0%) |
| Total | 2,833 (95.3%) | 141 (4.7%) |
Health Insurance Coverage by Citizenship Status in Hanceville
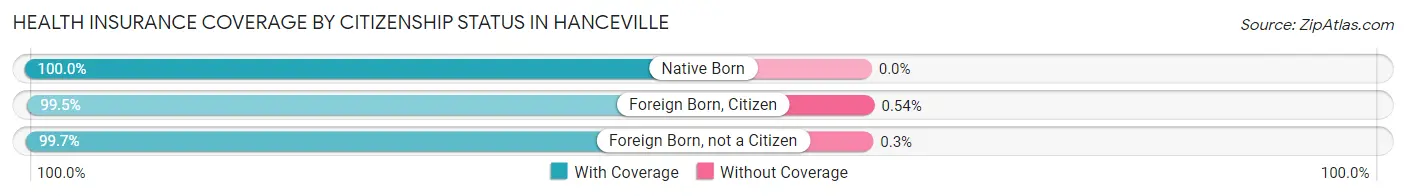
| Citizenship Status | With Coverage | Without Coverage |
| Native Born | 105 (100.0%) | 0 (0.0%) |
| Foreign Born, Citizen | 554 (99.5%) | 3 (0.5%) |
| Foreign Born, not a Citizen | 328 (99.7%) | 1 (0.3%) |
Health Insurance Coverage by Household Income in Hanceville
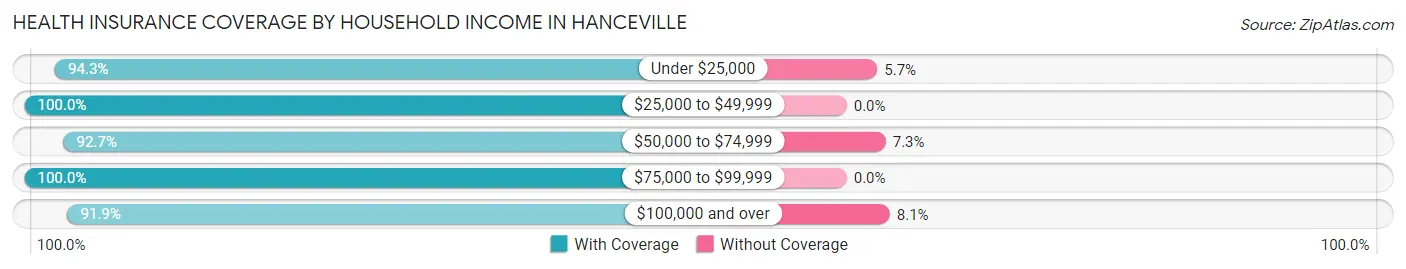
| Household Income | With Coverage | Without Coverage |
| Under $25,000 | 790 (94.3%) | 48 (5.7%) |
| $25,000 to $49,999 | 607 (100.0%) | 0 (0.0%) |
| $50,000 to $74,999 | 482 (92.7%) | 38 (7.3%) |
| $75,000 to $99,999 | 191 (100.0%) | 0 (0.0%) |
| $100,000 and over | 582 (91.9%) | 51 (8.1%) |
Public vs Private Health Insurance Coverage by Age in Hanceville
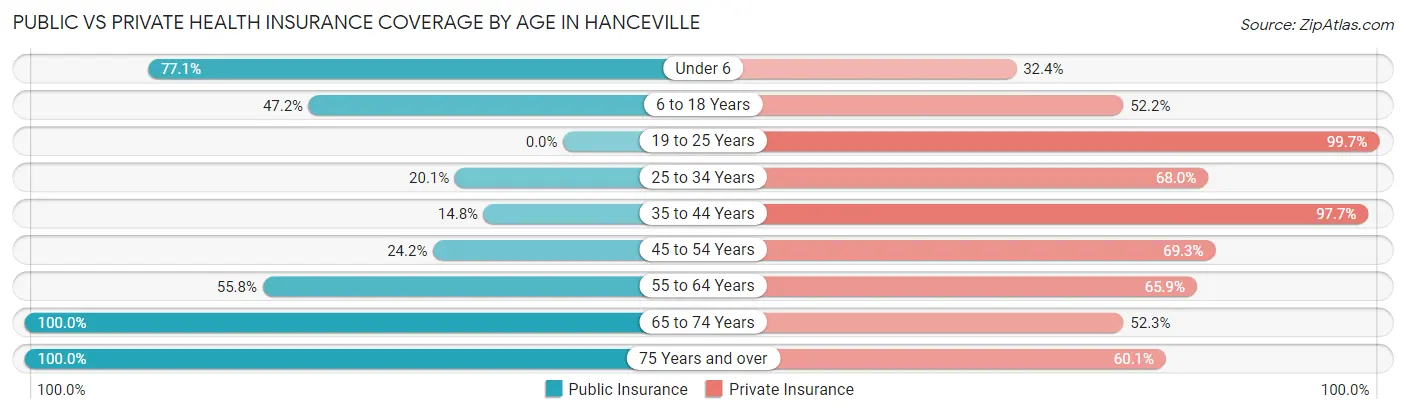
| Age Bracket | Public Insurance | Private Insurance |
| Under 6 | 81 (77.1%) | 34 (32.4%) |
| 6 to 18 Years | 263 (47.2%) | 291 (52.2%) |
| 19 to 25 Years | 0 (0.0%) | 328 (99.7%) |
| 25 to 34 Years | 91 (20.1%) | 308 (68.0%) |
| 35 to 44 Years | 32 (14.7%) | 212 (97.7%) |
| 45 to 54 Years | 100 (24.1%) | 287 (69.3%) |
| 55 to 64 Years | 188 (55.8%) | 222 (65.9%) |
| 65 to 74 Years | 266 (100.0%) | 139 (52.3%) |
| 75 Years and over | 296 (100.0%) | 178 (60.1%) |
| Total | 1,317 (44.3%) | 1,999 (67.2%) |
Disability Status by Sex by Age in Hanceville
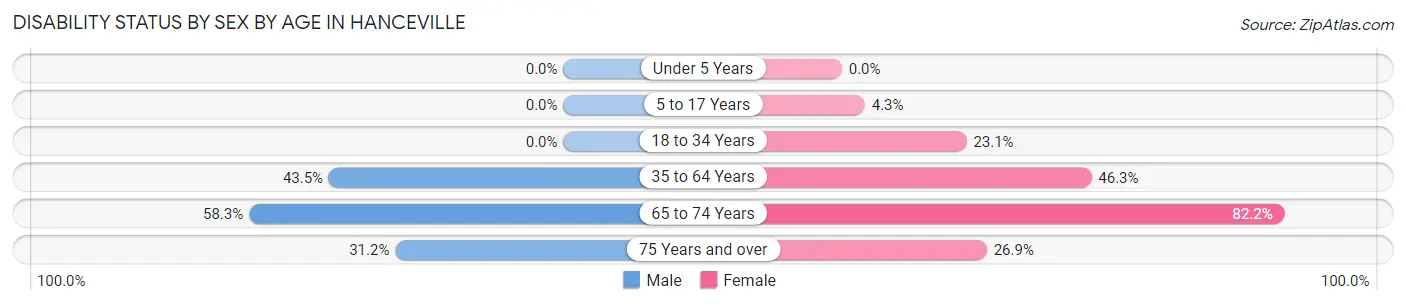
| Age Bracket | Male | Female |
| Under 5 Years | 0 (0.0%) | 0 (0.0%) |
| 5 to 17 Years | 0 (0.0%) | 9 (4.3%) |
| 18 to 34 Years | 0 (0.0%) | 112 (23.1%) |
| 35 to 64 Years | 238 (43.5%) | 195 (46.3%) |
| 65 to 74 Years | 70 (58.3%) | 120 (82.2%) |
| 75 Years and over | 39 (31.2%) | 46 (26.9%) |
Disability Class by Sex by Age in Hanceville
Disability Class: Hearing Difficulty
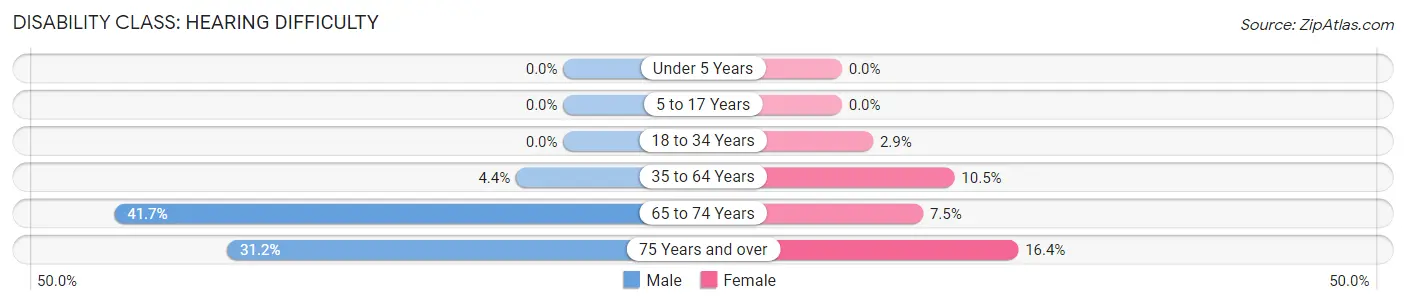
| Age Bracket | Male | Female |
| Under 5 Years | 0 (0.0%) | 0 (0.0%) |
| 5 to 17 Years | 0 (0.0%) | 0 (0.0%) |
| 18 to 34 Years | 0 (0.0%) | 14 (2.9%) |
| 35 to 64 Years | 24 (4.4%) | 44 (10.4%) |
| 65 to 74 Years | 50 (41.7%) | 11 (7.5%) |
| 75 Years and over | 39 (31.2%) | 28 (16.4%) |
Disability Class: Vision Difficulty
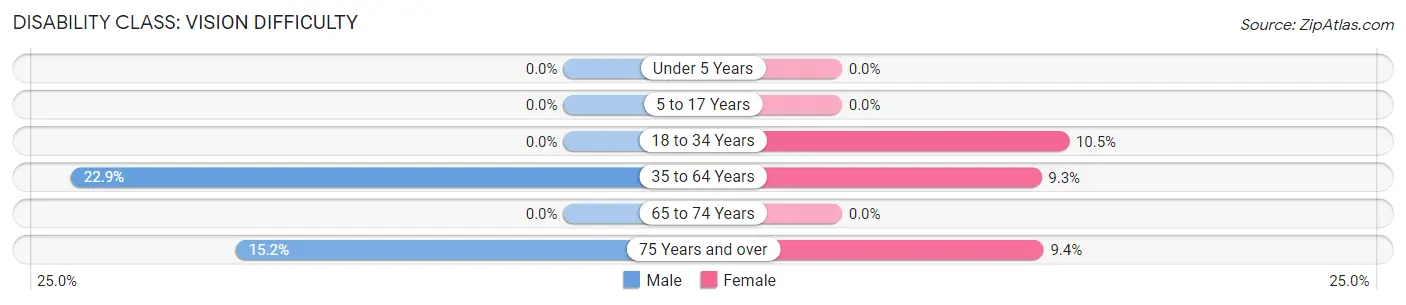
| Age Bracket | Male | Female |
| Under 5 Years | 0 (0.0%) | 0 (0.0%) |
| 5 to 17 Years | 0 (0.0%) | 0 (0.0%) |
| 18 to 34 Years | 0 (0.0%) | 51 (10.5%) |
| 35 to 64 Years | 125 (22.9%) | 39 (9.3%) |
| 65 to 74 Years | 0 (0.0%) | 0 (0.0%) |
| 75 Years and over | 19 (15.2%) | 16 (9.4%) |
Disability Class: Cognitive Difficulty
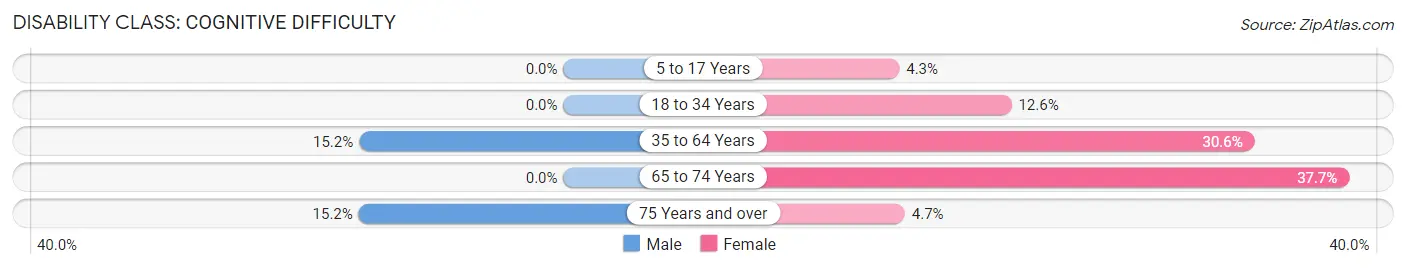
| Age Bracket | Male | Female |
| 5 to 17 Years | 0 (0.0%) | 9 (4.3%) |
| 18 to 34 Years | 0 (0.0%) | 61 (12.6%) |
| 35 to 64 Years | 83 (15.2%) | 129 (30.6%) |
| 65 to 74 Years | 0 (0.0%) | 55 (37.7%) |
| 75 Years and over | 19 (15.2%) | 8 (4.7%) |
Disability Class: Ambulatory Difficulty
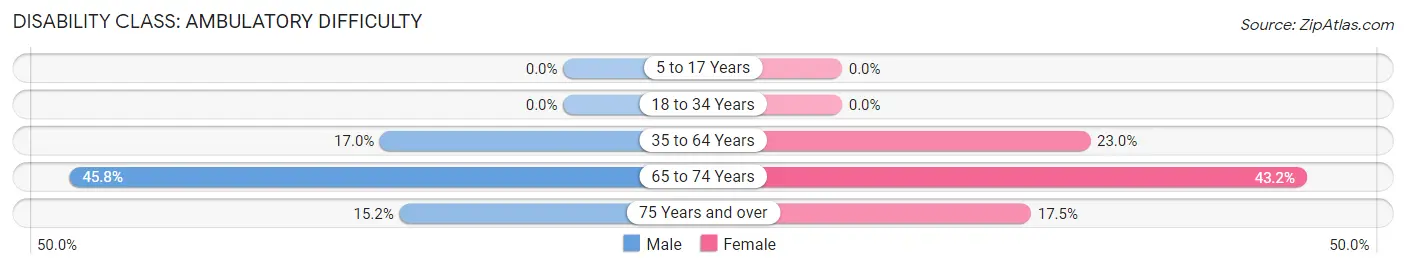
| Age Bracket | Male | Female |
| 5 to 17 Years | 0 (0.0%) | 0 (0.0%) |
| 18 to 34 Years | 0 (0.0%) | 0 (0.0%) |
| 35 to 64 Years | 93 (17.0%) | 97 (23.0%) |
| 65 to 74 Years | 55 (45.8%) | 63 (43.1%) |
| 75 Years and over | 19 (15.2%) | 30 (17.5%) |
Disability Class: Self-Care Difficulty
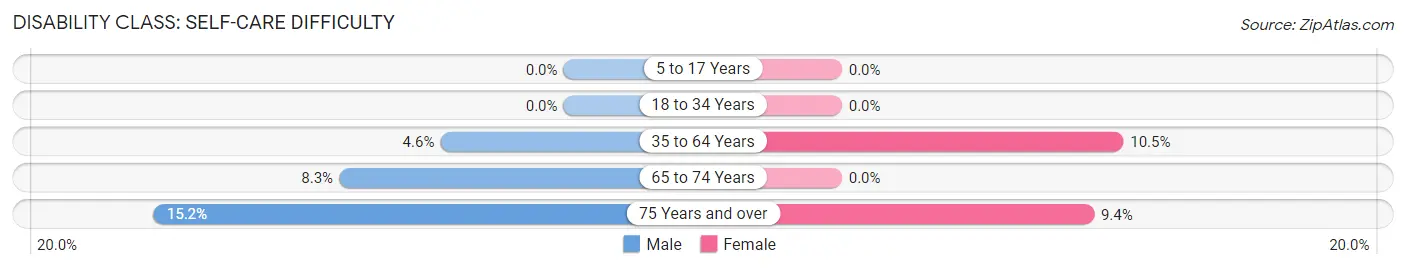
| Age Bracket | Male | Female |
| 5 to 17 Years | 0 (0.0%) | 0 (0.0%) |
| 18 to 34 Years | 0 (0.0%) | 0 (0.0%) |
| 35 to 64 Years | 25 (4.6%) | 44 (10.4%) |
| 65 to 74 Years | 10 (8.3%) | 0 (0.0%) |
| 75 Years and over | 19 (15.2%) | 16 (9.4%) |
Technology Access in Hanceville
Computing Device Access in Hanceville
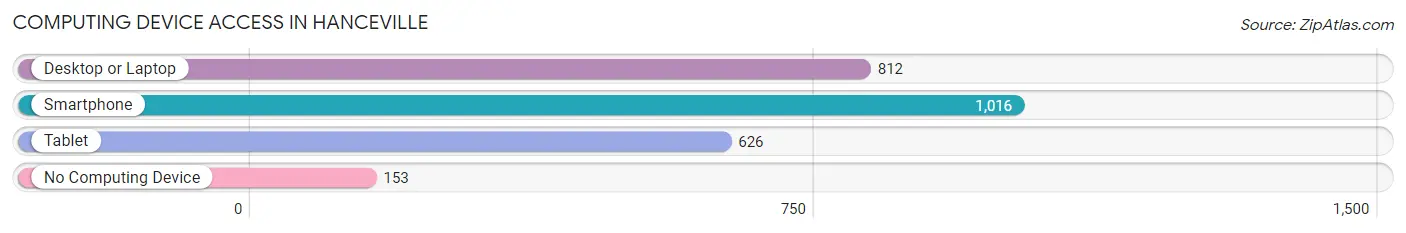
| Device Type | # Households | % Households |
| Desktop or Laptop | 812 | 64.2% |
| Smartphone | 1,016 | 80.3% |
| Tablet | 626 | 49.5% |
| No Computing Device | 153 | 12.1% |
| Total | 1,265 | 100.0% |
Internet Access in Hanceville
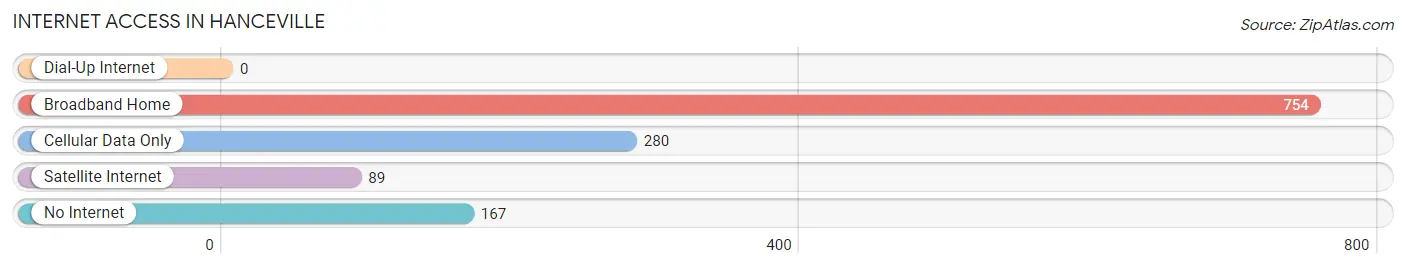
| Internet Type | # Households | % Households |
| Dial-Up Internet | 0 | 0.0% |
| Broadband Home | 754 | 59.6% |
| Cellular Data Only | 280 | 22.1% |
| Satellite Internet | 89 | 7.0% |
| No Internet | 167 | 13.2% |
| Total | 1,265 | 100.0% |
Hanceville Summary
Hanceville is a small city located in Cullman County, Alabama. It is situated in the foothills of the Appalachian Mountains and is part of the Birmingham-Hoover Metropolitan Statistical Area. The city has a population of 3,097 as of the 2010 census.
History
Hanceville was founded in 1883 by William Hance, a former Confederate soldier. He named the town after himself and it was incorporated in 1891. The town was originally a farming community and was known for its production of cotton, corn, and livestock.
In the early 1900s, the town began to grow and develop. The first bank was established in 1906 and the first newspaper, The Hanceville News, was published in 1907. The town also had a cotton gin, a grist mill, and a sawmill.
In the 1920s, the town began to experience a period of growth and development. The first school was built in 1921 and the first hospital was established in 1923. The town also had a movie theater, a library, and a post office.
In the 1940s, the town experienced a period of decline due to the Great Depression and World War II. However, the town began to experience a period of growth and development in the 1950s. The first shopping center was built in 1954 and the first hospital was built in 1956.
Geography
Hanceville is located in the foothills of the Appalachian Mountains in northern Alabama. The city is situated at the intersection of US Highway 31 and Alabama State Route 91. The city is located approximately 30 miles north of Birmingham and approximately 50 miles south of Huntsville.
The city has a total area of 4.2 square miles, all of which is land. The city is located at an elevation of 845 feet above sea level. The city is located in the humid subtropical climate zone and has hot, humid summers and mild winters.
Economy
The economy of Hanceville is largely based on agriculture and manufacturing. The city is home to several large manufacturing companies, including a paper mill, a furniture factory, and a plastics factory. The city is also home to several small businesses, including restaurants, retail stores, and service providers.
The city is also home to Wallace State Community College, which offers a variety of educational programs. The college also serves as a major employer in the city.
Demographics
As of the 2010 census, the population of Hanceville was 3,097. The racial makeup of the city was 94.3% White, 3.2% African American, 0.3% Native American, 0.3% Asian, 0.1% Pacific Islander, 0.7% from other races, and 1.2% from two or more races. Hispanic or Latino of any race were 1.7% of the population.
The median income for a household in the city was $31,250 and the median income for a family was $37,500. The per capita income for the city was $17,845. About 16.2% of the population was below the poverty line.
Common Questions
What is Per Capita Income in Hanceville?
Per Capita income in Hanceville is $21,528.
What is the Median Family Income in Hanceville?
Median Family Income in Hanceville is $51,705.
What is the Median Household income in Hanceville?
Median Household Income in Hanceville is $34,782.
What is Income or Wage Gap in Hanceville?
Income or Wage Gap in Hanceville is 47.3%.
Women in Hanceville earn 52.7 cents for every dollar earned by a man.
What is Inequality or Gini Index in Hanceville?
Inequality or Gini Index in Hanceville is 0.48.
What is the Total Population of Hanceville?
Total Population of Hanceville is 3,216.
What is the Total Male Population of Hanceville?
Total Male Population of Hanceville is 1,573.
What is the Total Female Population of Hanceville?
Total Female Population of Hanceville is 1,643.
What is the Ratio of Males per 100 Females in Hanceville?
There are 95.74 Males per 100 Females in Hanceville.
What is the Ratio of Females per 100 Males in Hanceville?
There are 104.45 Females per 100 Males in Hanceville.
What is the Median Population Age in Hanceville?
Median Population Age in Hanceville is 41.4 Years.
What is the Average Family Size in Hanceville
Average Family Size in Hanceville is 3.0 People.
What is the Average Household Size in Hanceville
Average Household Size in Hanceville is 2.2 People.
How Large is the Labor Force in Hanceville?
There are 1,420 People in the Labor Forcein in Hanceville.
What is the Percentage of People in the Labor Force in Hanceville?
51.6% of People are in the Labor Force in Hanceville.
What is the Unemployment Rate in Hanceville?
Unemployment Rate in Hanceville is 8.2%.