Grand Bay, AL Map & Demographics
Grand Bay Map
Grand Bay Overview
$35,288
PER CAPITA INCOME
$82,328
AVG FAMILY INCOME
$72,125
AVG HOUSEHOLD INCOME
23.1%
WAGE / INCOME GAP [ % ]
76.9¢/ $1
WAGE / INCOME GAP [ $ ]
0.31
INEQUALITY / GINI INDEX
3,607
TOTAL POPULATION
1,824
MALE POPULATION
1,783
FEMALE POPULATION
102.30
MALES / 100 FEMALES
97.75
FEMALES / 100 MALES
41.3
MEDIAN AGE
3.0
AVG FAMILY SIZE
2.3
AVG HOUSEHOLD SIZE
1,828
LABOR FORCE [ PEOPLE ]
65.6%
PERCENT IN LABOR FORCE
4.4%
UNEMPLOYMENT RATE
Grand Bay Zip Codes
Grand Bay Area Codes
Income in Grand Bay
Income Overview in Grand Bay
Per Capita Income in Grand Bay is $35,288, while median incomes of families and households are $82,328 and $72,125 respectively.
| Characteristic | Number | Measure |
| Per Capita Income | 3,607 | $35,288 |
| Median Family Income | 891 | $82,328 |
| Mean Family Income | 891 | $94,367 |
| Median Household Income | 1,505 | $72,125 |
| Mean Household Income | 1,505 | $82,785 |
| Income Deficit | 891 | $0 |
| Wage / Income Gap (%) | 3,607 | 23.06% |
| Wage / Income Gap ($) | 3,607 | 76.94¢ per $1 |
| Gini / Inequality Index | 3,607 | 0.31 |
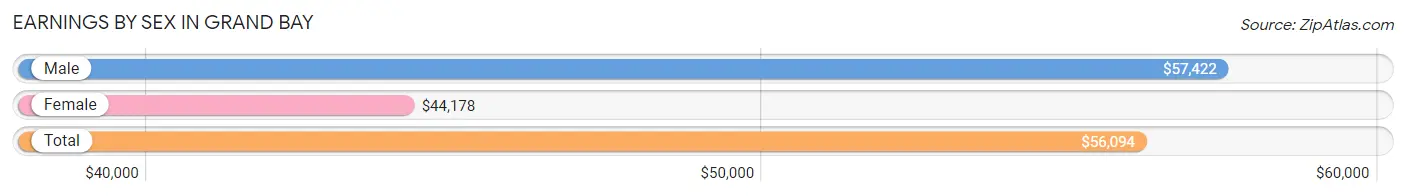
Earnings by Sex in Grand Bay
Average Earnings in Grand Bay are $56,094, $57,422 for men and $44,178 for women, a difference of 23.1%.
| Sex | Number | Average Earnings |
| Male | 1,035 (55.2%) | $57,422 |
| Female | 841 (44.8%) | $44,178 |
| Total | 1,876 (100.0%) | $56,094 |
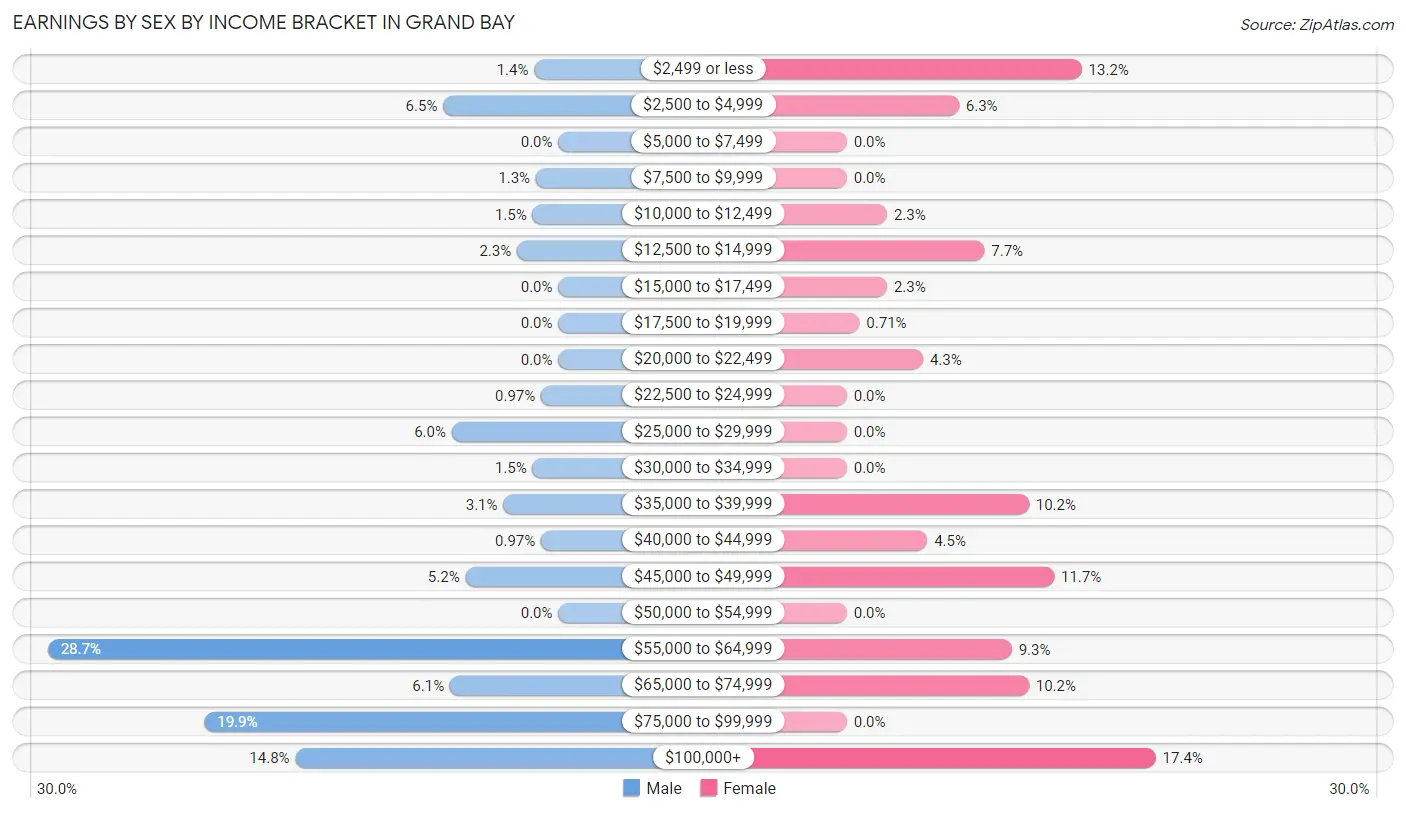
Earnings by Sex by Income Bracket in Grand Bay
The most common earnings brackets in Grand Bay are $55,000 to $64,999 for men (297 | 28.7%) and $100,000+ for women (146 | 17.4%).
| Income | Male | Female |
| $2,499 or less | 14 (1.3%) | 111 (13.2%) |
| $2,500 to $4,999 | 67 (6.5%) | 53 (6.3%) |
| $5,000 to $7,499 | 0 (0.0%) | 0 (0.0%) |
| $7,500 to $9,999 | 13 (1.3%) | 0 (0.0%) |
| $10,000 to $12,499 | 15 (1.5%) | 19 (2.3%) |
| $12,500 to $14,999 | 24 (2.3%) | 65 (7.7%) |
| $15,000 to $17,499 | 0 (0.0%) | 19 (2.3%) |
| $17,500 to $19,999 | 0 (0.0%) | 6 (0.7%) |
| $20,000 to $22,499 | 0 (0.0%) | 36 (4.3%) |
| $22,500 to $24,999 | 10 (1.0%) | 0 (0.0%) |
| $25,000 to $29,999 | 62 (6.0%) | 0 (0.0%) |
| $30,000 to $34,999 | 15 (1.5%) | 0 (0.0%) |
| $35,000 to $39,999 | 32 (3.1%) | 86 (10.2%) |
| $40,000 to $44,999 | 10 (1.0%) | 38 (4.5%) |
| $45,000 to $49,999 | 54 (5.2%) | 98 (11.7%) |
| $50,000 to $54,999 | 0 (0.0%) | 0 (0.0%) |
| $55,000 to $64,999 | 297 (28.7%) | 78 (9.3%) |
| $65,000 to $74,999 | 63 (6.1%) | 86 (10.2%) |
| $75,000 to $99,999 | 206 (19.9%) | 0 (0.0%) |
| $100,000+ | 153 (14.8%) | 146 (17.4%) |
| Total | 1,035 (100.0%) | 841 (100.0%) |
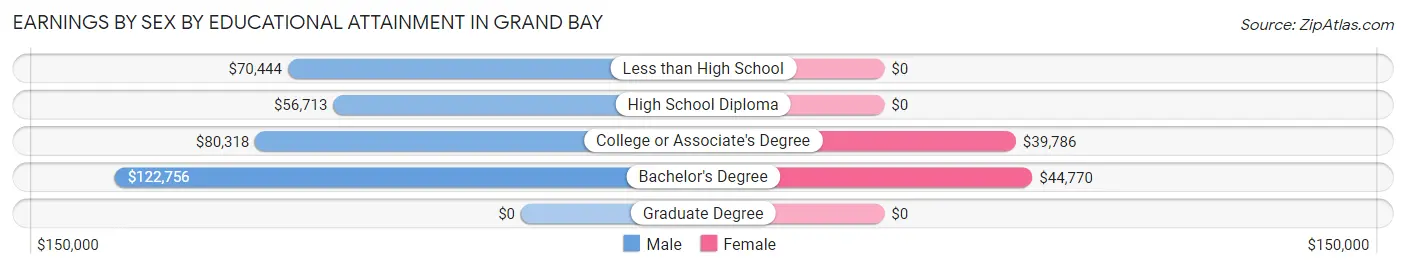
Earnings by Sex by Educational Attainment in Grand Bay
Average earnings in Grand Bay are $60,653 for men and $45,667 for women, a difference of 24.7%. Men with an educational attainment of bachelor's degree enjoy the highest average annual earnings of $122,756, while those with high school diploma education earn the least with $56,713. Women with an educational attainment of bachelor's degree earn the most with the average annual earnings of $44,770, while those with college or associate's degree education have the smallest earnings of $39,786.
| Educational Attainment | Male Income | Female Income |
| Less than High School | $70,444 | $0 |
| High School Diploma | $56,713 | $0 |
| College or Associate's Degree | $80,318 | $39,786 |
| Bachelor's Degree | $122,756 | $44,770 |
| Graduate Degree | - | - |
| Total | $60,653 | $45,667 |
Family Income in Grand Bay
Family Income Brackets in Grand Bay
According to the Grand Bay family income data, there are 234 families falling into the $100,000 to $149,999 income range, which is the most common income bracket and makes up 26.3% of all families.
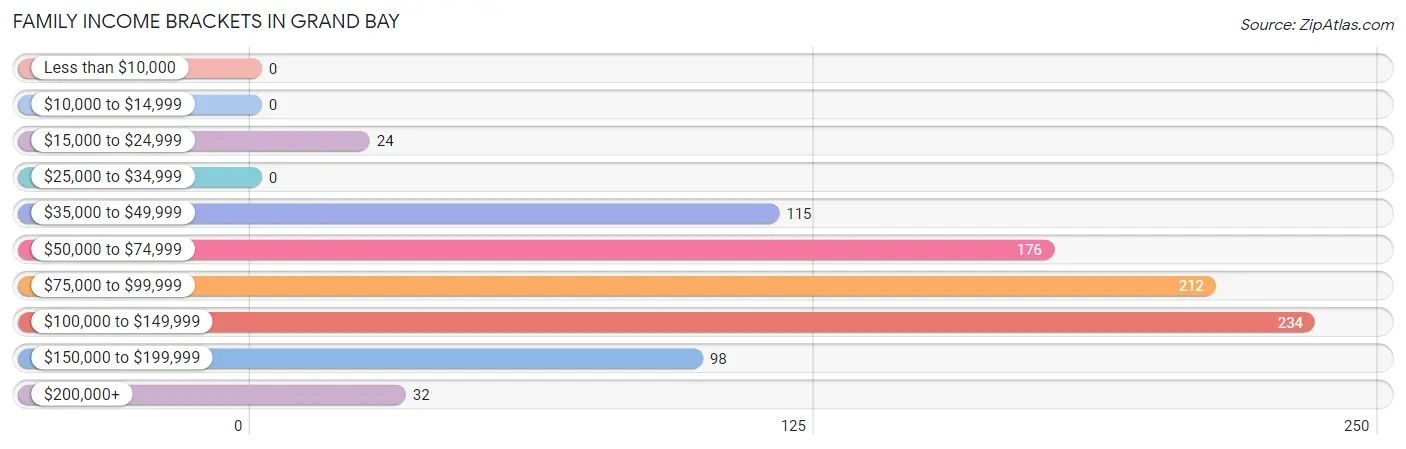
| Income Bracket | # Families | % Families |
| Less than $10,000 | 0 | 0.0% |
| $10,000 to $14,999 | 0 | 0.0% |
| $15,000 to $24,999 | 24 | 2.7% |
| $25,000 to $34,999 | 0 | 0.0% |
| $35,000 to $49,999 | 115 | 12.9% |
| $50,000 to $74,999 | 176 | 19.8% |
| $75,000 to $99,999 | 212 | 23.8% |
| $100,000 to $149,999 | 234 | 26.3% |
| $150,000 to $199,999 | 98 | 11.0% |
| $200,000+ | 32 | 3.6% |
Family Income by Famaliy Size in Grand Bay
4-person families (103 | 11.6%) account for the highest median family income in Grand Bay with $83,125 per family, while 2-person families (496 | 55.7%) have the highest median income of $41,397 per family member.
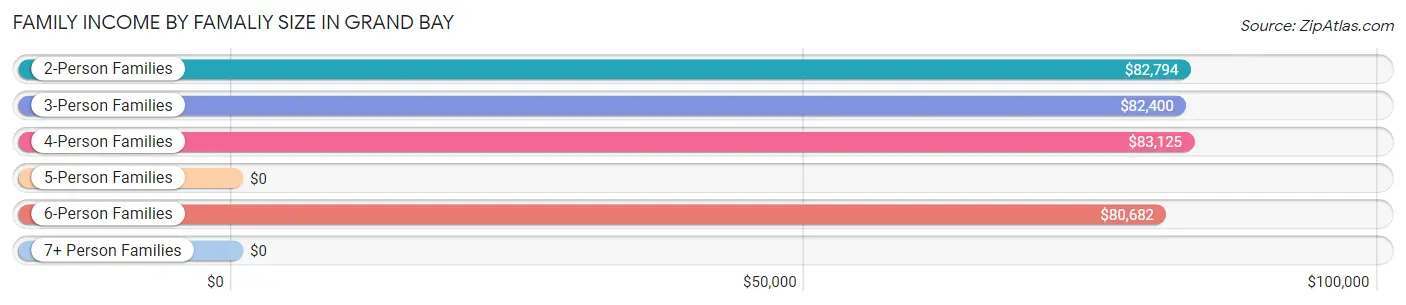
| Income Bracket | # Families | Median Income |
| 2-Person Families | 496 (55.7%) | $82,794 |
| 3-Person Families | 168 (18.9%) | $82,400 |
| 4-Person Families | 103 (11.6%) | $83,125 |
| 5-Person Families | 68 (7.6%) | $0 |
| 6-Person Families | 56 (6.3%) | $80,682 |
| 7+ Person Families | 0 (0.0%) | $0 |
| Total | 891 (100.0%) | $82,328 |
Family Income by Number of Earners in Grand Bay
The median family income in Grand Bay is $82,328, with families comprising 2 earners (296) having the highest median family income of $122,321, while families with no earners (85) have the lowest median family income of $42,202, accounting for 33.2% and 9.5% of families, respectively.
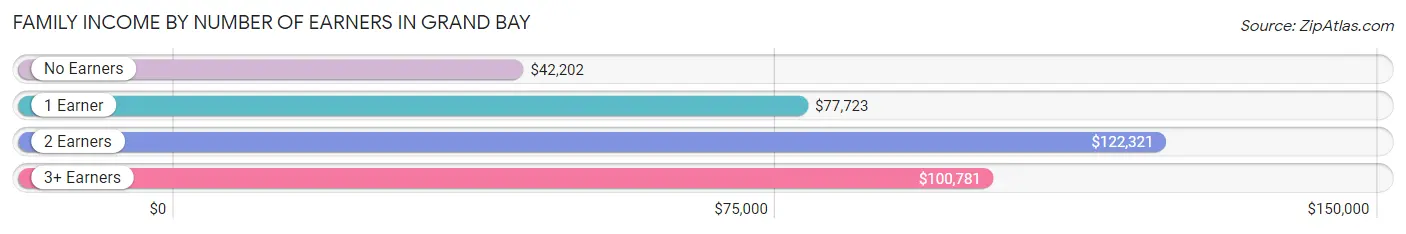
| Number of Earners | # Families | Median Income |
| No Earners | 85 (9.5%) | $42,202 |
| 1 Earner | 395 (44.3%) | $77,723 |
| 2 Earners | 296 (33.2%) | $122,321 |
| 3+ Earners | 115 (12.9%) | $100,781 |
| Total | 891 (100.0%) | $82,328 |
Household Income in Grand Bay
Household Income Brackets in Grand Bay
With 379 households falling in the category, the $50,000 to $74,999 income range is the most frequent in Grand Bay, accounting for 25.2% of all households. In contrast, only 8 households (0.5%) fall into the $10,000 to $14,999 income bracket, making it the least populous group.
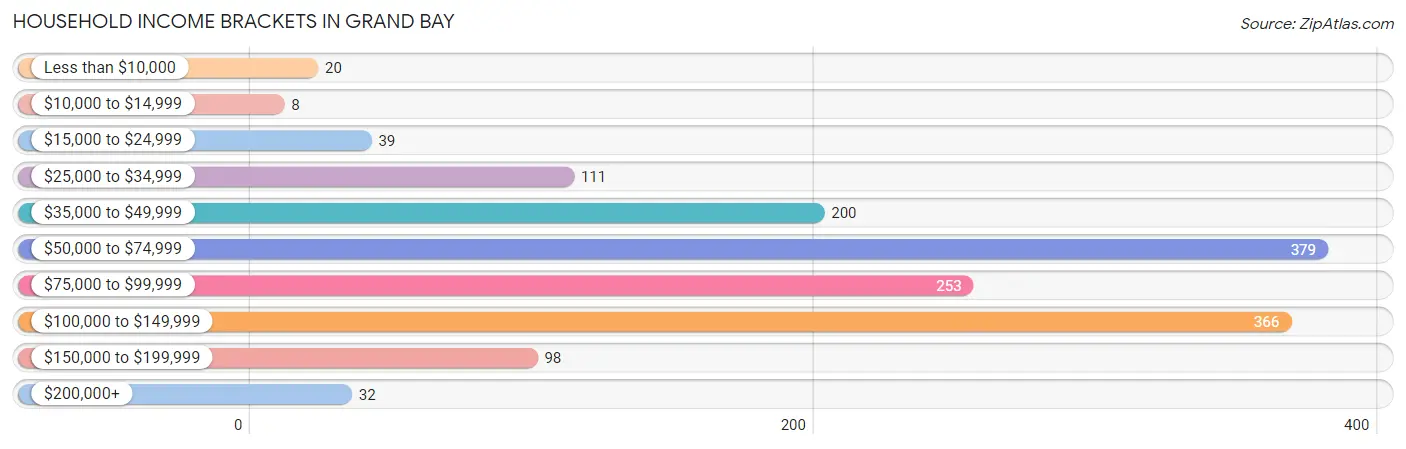
| Income Bracket | # Households | % Households |
| Less than $10,000 | 20 | 1.3% |
| $10,000 to $14,999 | 8 | 0.5% |
| $15,000 to $24,999 | 39 | 2.6% |
| $25,000 to $34,999 | 111 | 7.4% |
| $35,000 to $49,999 | 200 | 13.3% |
| $50,000 to $74,999 | 379 | 25.2% |
| $75,000 to $99,999 | 253 | 16.8% |
| $100,000 to $149,999 | 366 | 24.3% |
| $150,000 to $199,999 | 98 | 6.5% |
| $200,000+ | 32 | 2.1% |
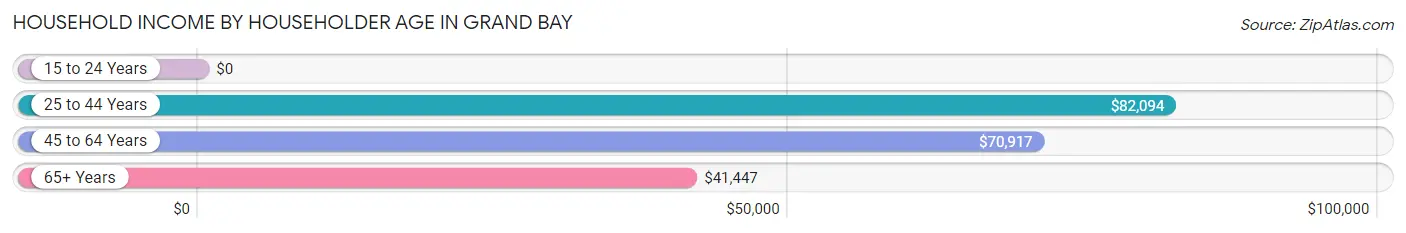
Household Income by Householder Age in Grand Bay
The median household income in Grand Bay is $72,125, with the highest median household income of $82,094 found in the 25 to 44 years age bracket for the primary householder. A total of 470 households (31.2%) fall into this category. Meanwhile, the 15 to 24 years age bracket for the primary householder has the lowest median household income of $0, with 21 households (1.4%) in this group.
| Income Bracket | # Households | Median Income |
| 15 to 24 Years | 21 (1.4%) | $0 |
| 25 to 44 Years | 470 (31.2%) | $82,094 |
| 45 to 64 Years | 570 (37.9%) | $70,917 |
| 65+ Years | 444 (29.5%) | $41,447 |
| Total | 1,505 (100.0%) | $72,125 |
Poverty in Grand Bay
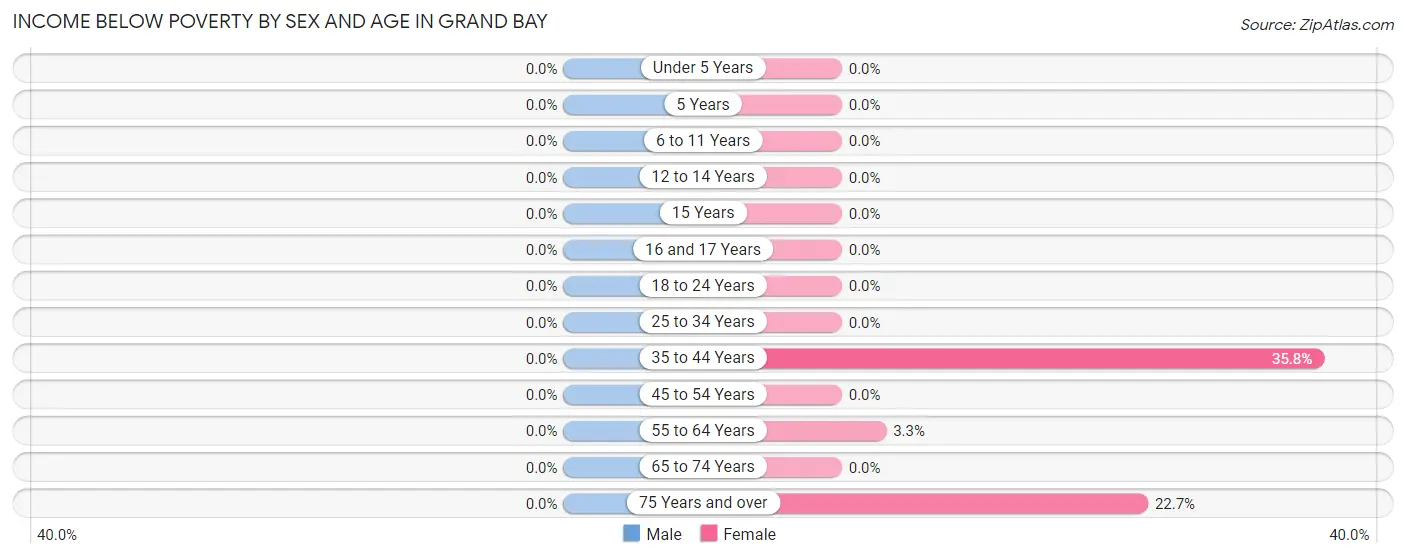
Income Below Poverty by Sex and Age in Grand Bay
| Age Bracket | Male | Female |
| Under 5 Years | 0 (0.0%) | 0 (0.0%) |
| 5 Years | 0 (0.0%) | 0 (0.0%) |
| 6 to 11 Years | 0 (0.0%) | 0 (0.0%) |
| 12 to 14 Years | 0 (0.0%) | 0 (0.0%) |
| 15 Years | 0 (0.0%) | 0 (0.0%) |
| 16 and 17 Years | 0 (0.0%) | 0 (0.0%) |
| 18 to 24 Years | 0 (0.0%) | 0 (0.0%) |
| 25 to 34 Years | 0 (0.0%) | 0 (0.0%) |
| 35 to 44 Years | 0 (0.0%) | 92 (35.8%) |
| 45 to 54 Years | 0 (0.0%) | 0 (0.0%) |
| 55 to 64 Years | 0 (0.0%) | 7 (3.3%) |
| 65 to 74 Years | 0 (0.0%) | 0 (0.0%) |
| 75 Years and over | 0 (0.0%) | 20 (22.7%) |
| Total | 0 (0.0%) | 119 (7.0%) |
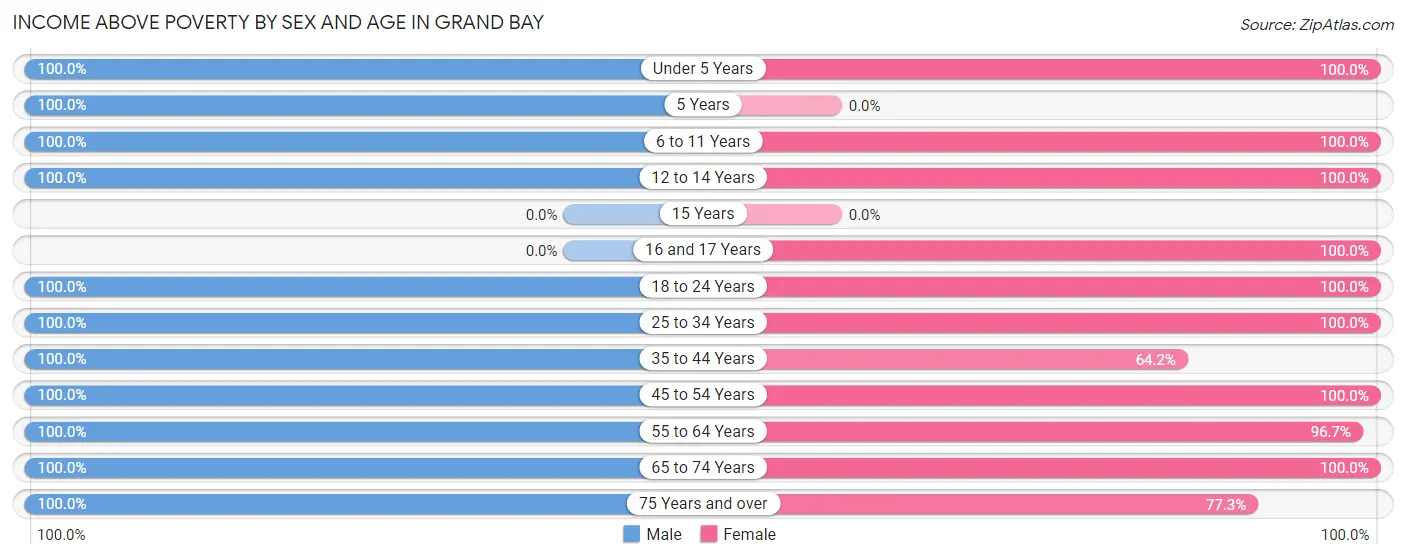
Income Above Poverty by Sex and Age in Grand Bay
According to the poverty statistics in Grand Bay, males aged under 5 years and females aged under 5 years are the age groups that are most secure financially, with 100.0% of males and 100.0% of females in these age groups living above the poverty line.
| Age Bracket | Male | Female |
| Under 5 Years | 17 (100.0%) | 120 (100.0%) |
| 5 Years | 20 (100.0%) | 0 (0.0%) |
| 6 to 11 Years | 148 (100.0%) | 162 (100.0%) |
| 12 to 14 Years | 218 (100.0%) | 73 (100.0%) |
| 15 Years | 0 (0.0%) | 0 (0.0%) |
| 16 and 17 Years | 0 (0.0%) | 42 (100.0%) |
| 18 to 24 Years | 90 (100.0%) | 77 (100.0%) |
| 25 to 34 Years | 182 (100.0%) | 171 (100.0%) |
| 35 to 44 Years | 313 (100.0%) | 165 (64.2%) |
| 45 to 54 Years | 88 (100.0%) | 298 (100.0%) |
| 55 to 64 Years | 354 (100.0%) | 205 (96.7%) |
| 65 to 74 Years | 234 (100.0%) | 200 (100.0%) |
| 75 Years and over | 94 (100.0%) | 68 (77.3%) |
| Total | 1,758 (100.0%) | 1,581 (93.0%) |
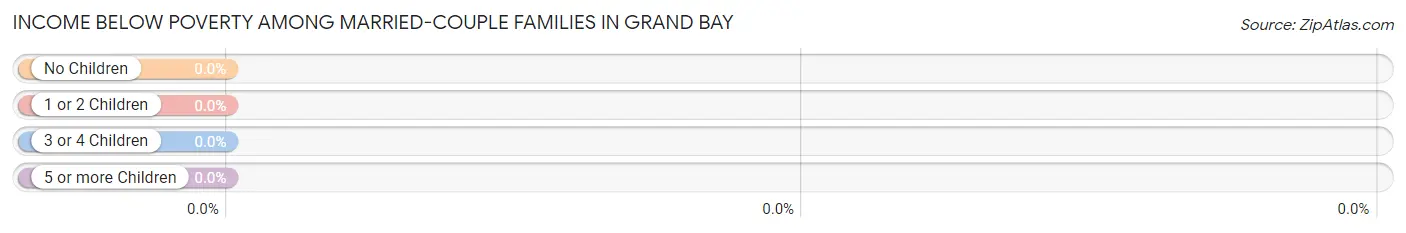
Income Below Poverty Among Married-Couple Families in Grand Bay
| Children | Above Poverty | Below Poverty |
| No Children | 463 (100.0%) | 0 (0.0%) |
| 1 or 2 Children | 119 (100.0%) | 0 (0.0%) |
| 3 or 4 Children | 100 (100.0%) | 0 (0.0%) |
| 5 or more Children | 0 (0.0%) | 0 (0.0%) |
| Total | 682 (100.0%) | 0 (0.0%) |
Income Below Poverty Among Single-Parent Households in Grand Bay
| Children | Single Father | Single Mother |
| No Children | 0 (0.0%) | 0 (0.0%) |
| 1 or 2 Children | 0 (0.0%) | 0 (0.0%) |
| 3 or 4 Children | 0 (0.0%) | 0 (0.0%) |
| 5 or more Children | 0 (0.0%) | 0 (0.0%) |
| Total | 0 (0.0%) | 0 (0.0%) |
Income Below Poverty Among Married-Couple vs Single-Parent Households in Grand Bay
| Children | Married-Couple Families | Single-Parent Households |
| No Children | 0 (0.0%) | 0 (0.0%) |
| 1 or 2 Children | 0 (0.0%) | 0 (0.0%) |
| 3 or 4 Children | 0 (0.0%) | 0 (0.0%) |
| 5 or more Children | 0 (0.0%) | 0 (0.0%) |
| Total | 0 (0.0%) | 0 (0.0%) |
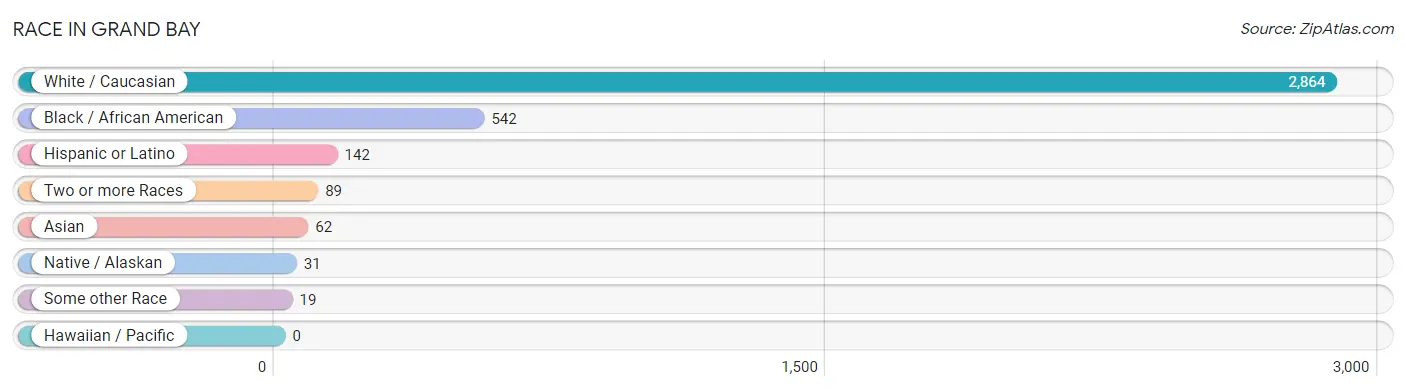
Race in Grand Bay
The most populous races in Grand Bay are White / Caucasian (2,864 | 79.4%), Black / African American (542 | 15.0%), and Hispanic or Latino (142 | 3.9%).
| Race | # Population | % Population |
| Asian | 62 | 1.7% |
| Black / African American | 542 | 15.0% |
| Hawaiian / Pacific | 0 | 0.0% |
| Hispanic or Latino | 142 | 3.9% |
| Native / Alaskan | 31 | 0.9% |
| White / Caucasian | 2,864 | 79.4% |
| Two or more Races | 89 | 2.5% |
| Some other Race | 19 | 0.5% |
| Total | 3,607 | 100.0% |
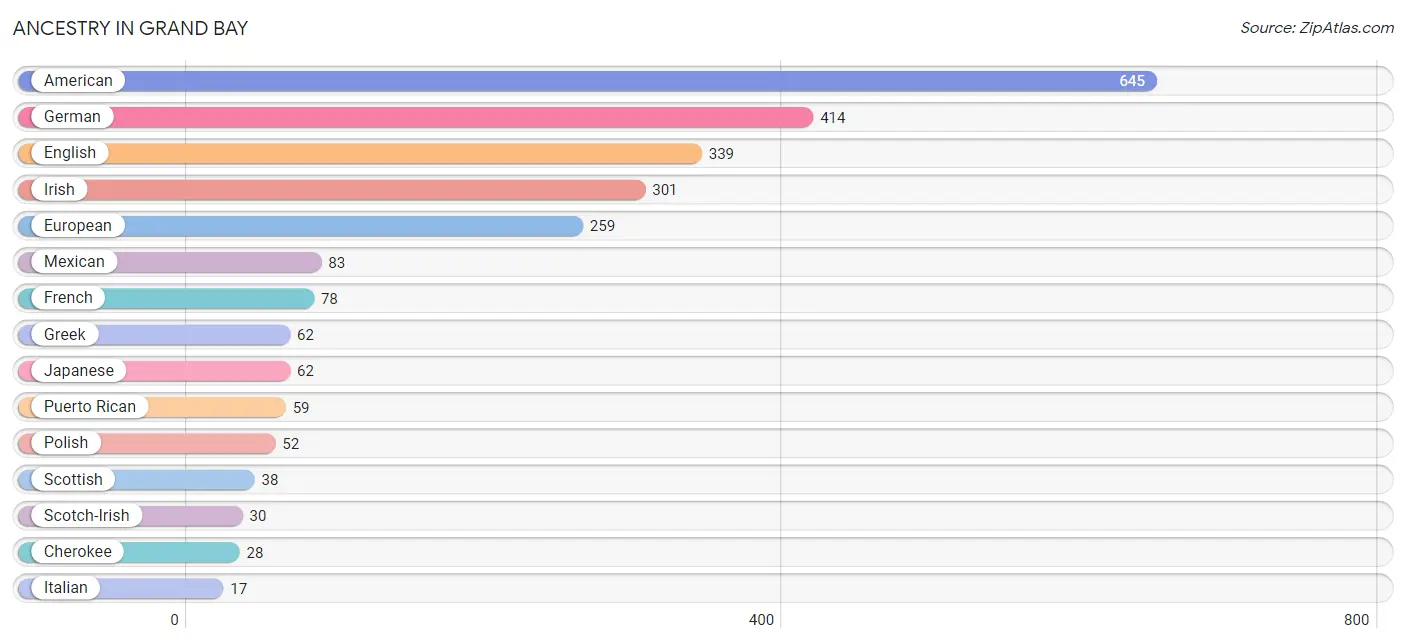
Ancestry in Grand Bay
The most populous ancestries reported in Grand Bay are American (645 | 17.9%), German (414 | 11.5%), English (339 | 9.4%), Irish (301 | 8.3%), and European (259 | 7.2%), together accounting for 54.3% of all Grand Bay residents.
| Ancestry | # Population | % Population |
| American | 645 | 17.9% |
| British | 6 | 0.2% |
| Cherokee | 28 | 0.8% |
| Croatian | 9 | 0.3% |
| English | 339 | 9.4% |
| European | 259 | 7.2% |
| French | 78 | 2.2% |
| German | 414 | 11.5% |
| Greek | 62 | 1.7% |
| Irish | 301 | 8.3% |
| Italian | 17 | 0.5% |
| Japanese | 62 | 1.7% |
| Mexican | 83 | 2.3% |
| Polish | 52 | 1.4% |
| Puerto Rican | 59 | 1.6% |
| Scotch-Irish | 30 | 0.8% |
| Scottish | 38 | 1.1% |
| Swedish | 5 | 0.1% |
| Ukrainian | 14 | 0.4% |
| Welsh | 5 | 0.1% | View All 20 Rows |
Immigrants in Grand Bay
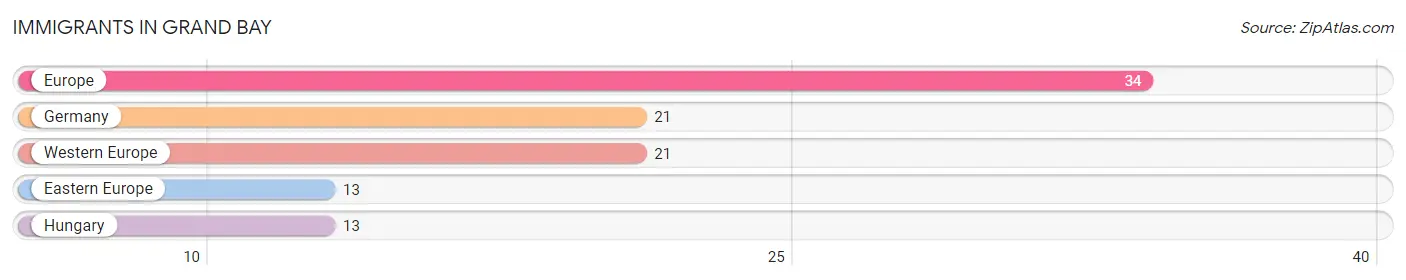
The most numerous immigrant groups reported in Grand Bay came from Europe (34 | 0.9%), Germany (21 | 0.6%), Western Europe (21 | 0.6%), Eastern Europe (13 | 0.4%), and Hungary (13 | 0.4%), together accounting for 2.8% of all Grand Bay residents.
| Immigration Origin | # Population | % Population |
| Eastern Europe | 13 | 0.4% |
| Europe | 34 | 0.9% |
| Germany | 21 | 0.6% |
| Hungary | 13 | 0.4% |
| Western Europe | 21 | 0.6% | View All 5 Rows |
Sex and Age in Grand Bay
Sex and Age in Grand Bay
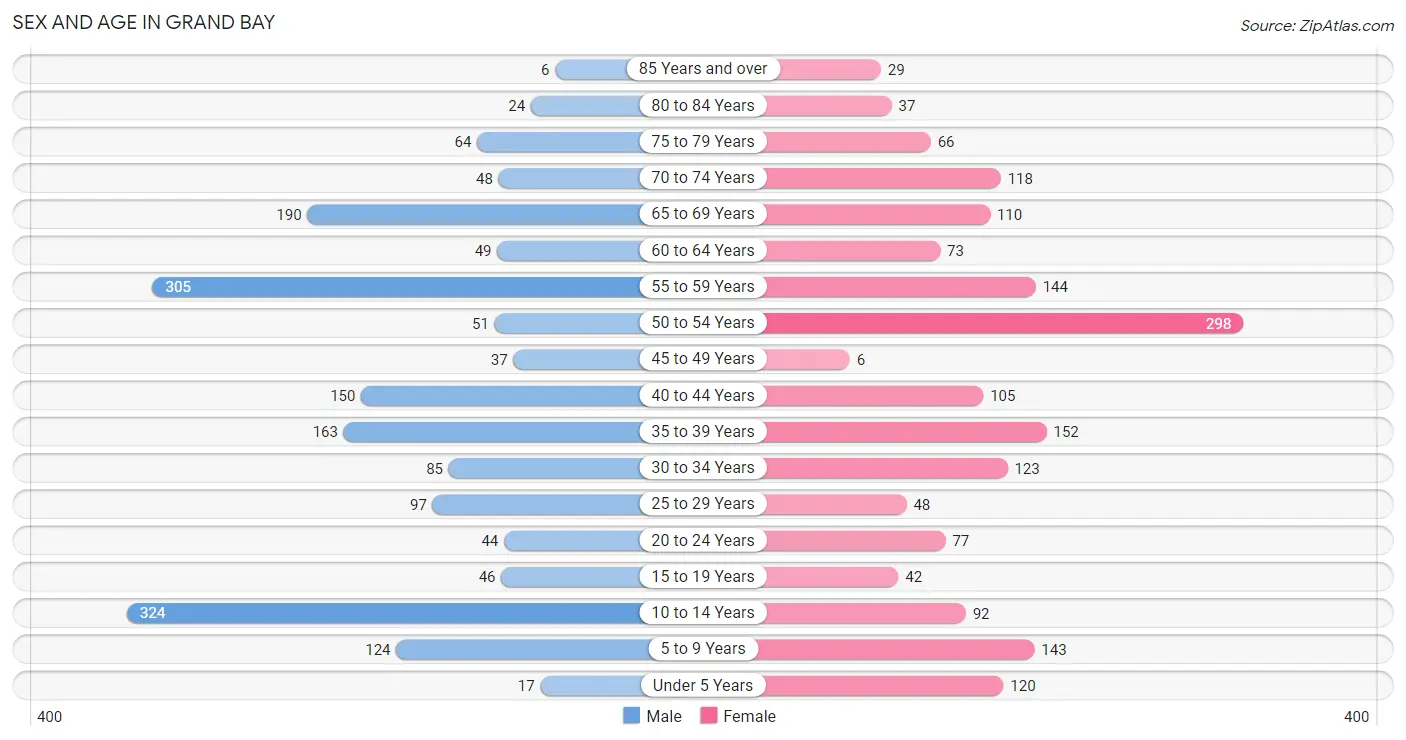
The most populous age groups in Grand Bay are 10 to 14 Years (324 | 17.8%) for men and 50 to 54 Years (298 | 16.7%) for women.
| Age Bracket | Male | Female |
| Under 5 Years | 17 (0.9%) | 120 (6.7%) |
| 5 to 9 Years | 124 (6.8%) | 143 (8.0%) |
| 10 to 14 Years | 324 (17.8%) | 92 (5.2%) |
| 15 to 19 Years | 46 (2.5%) | 42 (2.4%) |
| 20 to 24 Years | 44 (2.4%) | 77 (4.3%) |
| 25 to 29 Years | 97 (5.3%) | 48 (2.7%) |
| 30 to 34 Years | 85 (4.7%) | 123 (6.9%) |
| 35 to 39 Years | 163 (8.9%) | 152 (8.5%) |
| 40 to 44 Years | 150 (8.2%) | 105 (5.9%) |
| 45 to 49 Years | 37 (2.0%) | 6 (0.3%) |
| 50 to 54 Years | 51 (2.8%) | 298 (16.7%) |
| 55 to 59 Years | 305 (16.7%) | 144 (8.1%) |
| 60 to 64 Years | 49 (2.7%) | 73 (4.1%) |
| 65 to 69 Years | 190 (10.4%) | 110 (6.2%) |
| 70 to 74 Years | 48 (2.6%) | 118 (6.6%) |
| 75 to 79 Years | 64 (3.5%) | 66 (3.7%) |
| 80 to 84 Years | 24 (1.3%) | 37 (2.1%) |
| 85 Years and over | 6 (0.3%) | 29 (1.6%) |
| Total | 1,824 (100.0%) | 1,783 (100.0%) |
Families and Households in Grand Bay
Median Family Size in Grand Bay
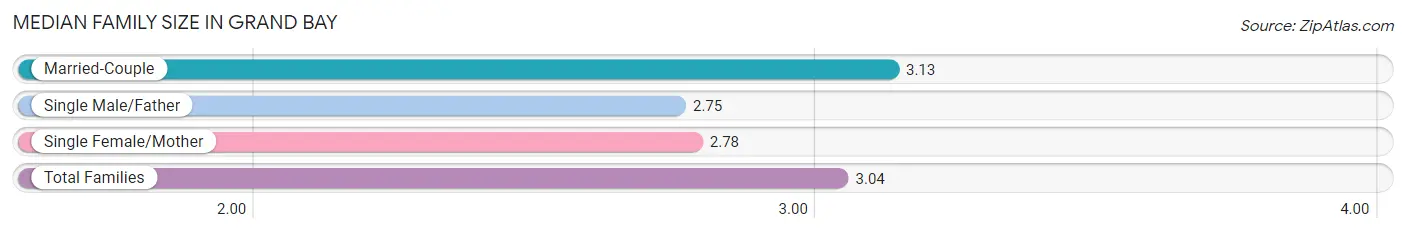
The median family size in Grand Bay is 3.04 persons per family, with married-couple families (682 | 76.5%) accounting for the largest median family size of 3.13 persons per family. On the other hand, single male/father families (105 | 11.8%) represent the smallest median family size with 2.75 persons per family.
| Family Type | # Families | Family Size |
| Married-Couple | 682 (76.5%) | 3.13 |
| Single Male/Father | 105 (11.8%) | 2.75 |
| Single Female/Mother | 104 (11.7%) | 2.78 |
| Total Families | 891 (100.0%) | 3.04 |
Median Household Size in Grand Bay
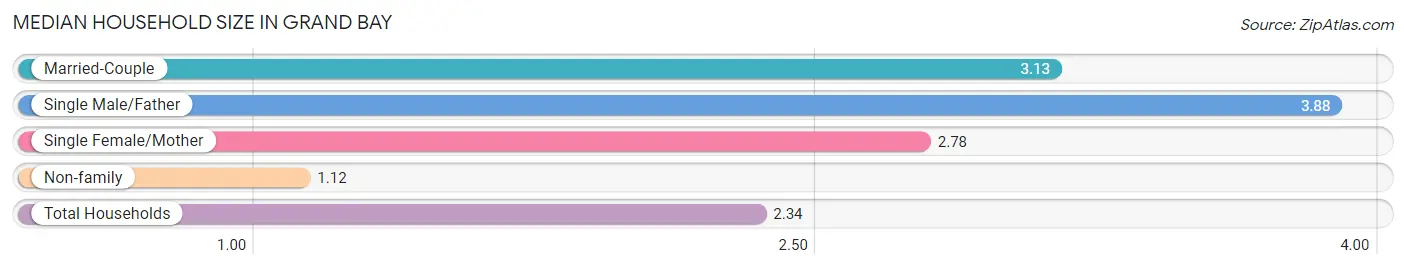
The median household size in Grand Bay is 2.34 persons per household, with single male/father households (105 | 7.0%) accounting for the largest median household size of 3.88 persons per household. non-family households (614 | 40.8%) represent the smallest median household size with 1.12 persons per household.
| Household Type | # Households | Household Size |
| Married-Couple | 682 (45.3%) | 3.13 |
| Single Male/Father | 105 (7.0%) | 3.88 |
| Single Female/Mother | 104 (6.9%) | 2.78 |
| Non-family | 614 (40.8%) | 1.12 |
| Total Households | 1,505 (100.0%) | 2.34 |
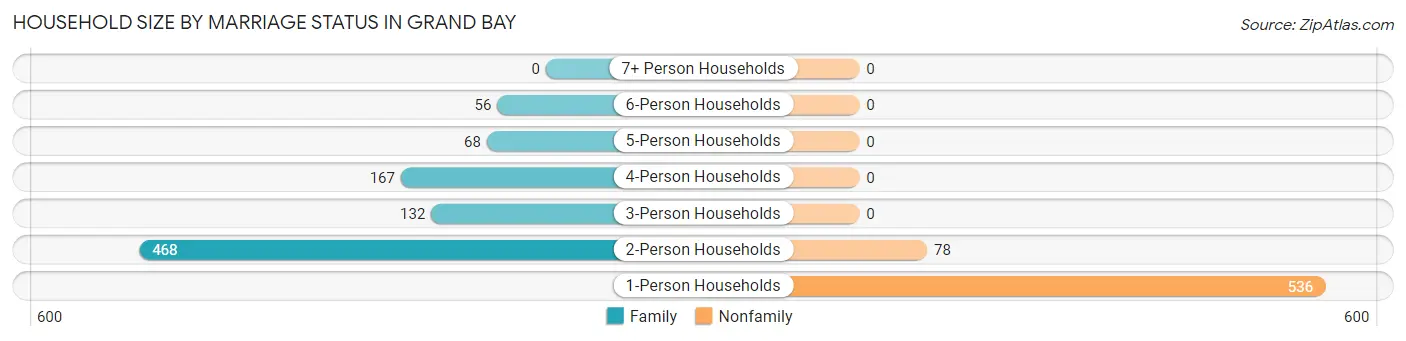
Household Size by Marriage Status in Grand Bay
Out of a total of 1,505 households in Grand Bay, 891 (59.2%) are family households, while 614 (40.8%) are nonfamily households. The most numerous type of family households are 2-person households, comprising 468, and the most common type of nonfamily households are 1-person households, comprising 536.
| Household Size | Family Households | Nonfamily Households |
| 1-Person Households | - | 536 (35.6%) |
| 2-Person Households | 468 (31.1%) | 78 (5.2%) |
| 3-Person Households | 132 (8.8%) | 0 (0.0%) |
| 4-Person Households | 167 (11.1%) | 0 (0.0%) |
| 5-Person Households | 68 (4.5%) | 0 (0.0%) |
| 6-Person Households | 56 (3.7%) | 0 (0.0%) |
| 7+ Person Households | 0 (0.0%) | 0 (0.0%) |
| Total | 891 (59.2%) | 614 (40.8%) |
Female Fertility in Grand Bay
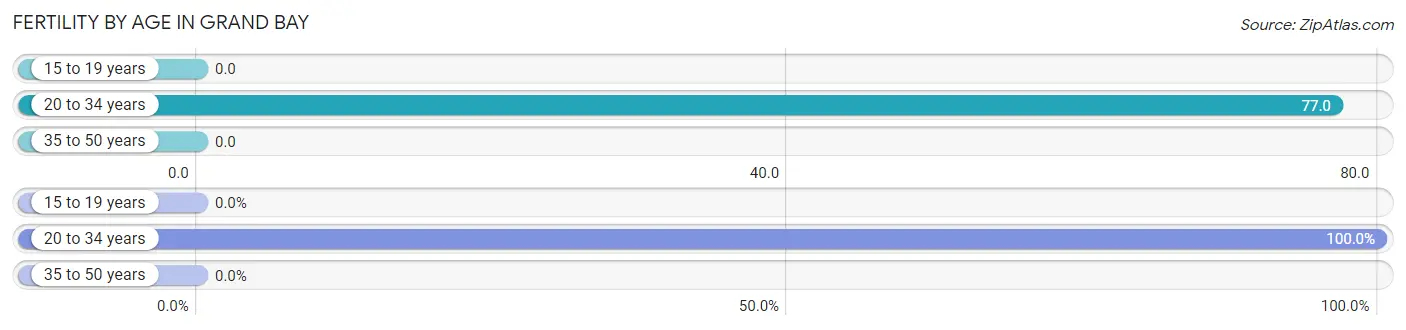
Fertility by Age in Grand Bay
Average fertility rate in Grand Bay is 27.0 births per 1,000 women. Women in the age bracket of 20 to 34 years have the highest fertility rate with 77.0 births per 1,000 women. Women in the age bracket of 20 to 34 years acount for 100.0% of all women with births.
| Age Bracket | Women with Births | Births / 1,000 Women |
| 15 to 19 years | 0 (0.0%) | 0.0 |
| 20 to 34 years | 19 (100.0%) | 77.0 |
| 35 to 50 years | 0 (0.0%) | 0.0 |
| Total | 19 (100.0%) | 27.0 |
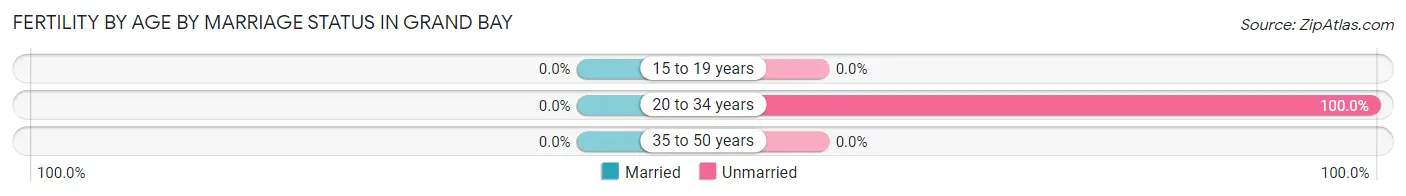
Fertility by Age by Marriage Status in Grand Bay
| Age Bracket | Married | Unmarried |
| 15 to 19 years | 0 (0.0%) | 0 (0.0%) |
| 20 to 34 years | 0 (0.0%) | 19 (100.0%) |
| 35 to 50 years | 0 (0.0%) | 0 (0.0%) |
| Total | 0 (0.0%) | 19 (100.0%) |
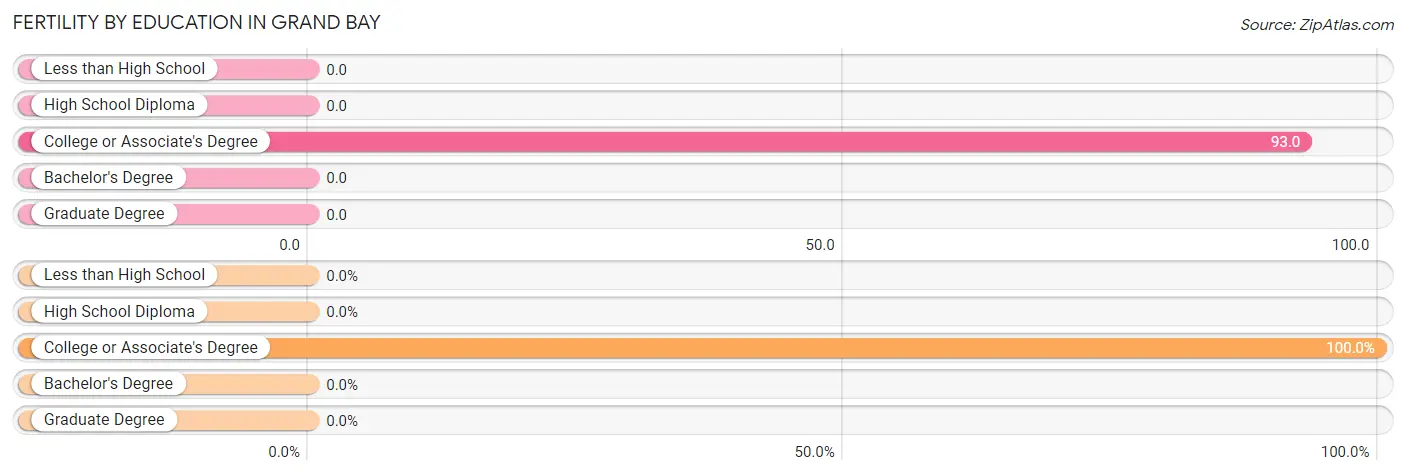
Fertility by Education in Grand Bay
| Educational Attainment | Women with Births | Births / 1,000 Women |
| Less than High School | 0 (0.0%) | 0.0 |
| High School Diploma | 0 (0.0%) | 0.0 |
| College or Associate's Degree | 19 (100.0%) | 93.0 |
| Bachelor's Degree | 0 (0.0%) | 0.0 |
| Graduate Degree | 0 (0.0%) | 0.0 |
| Total | 19 (100.0%) | 27.0 |
Fertility by Education by Marriage Status in Grand Bay
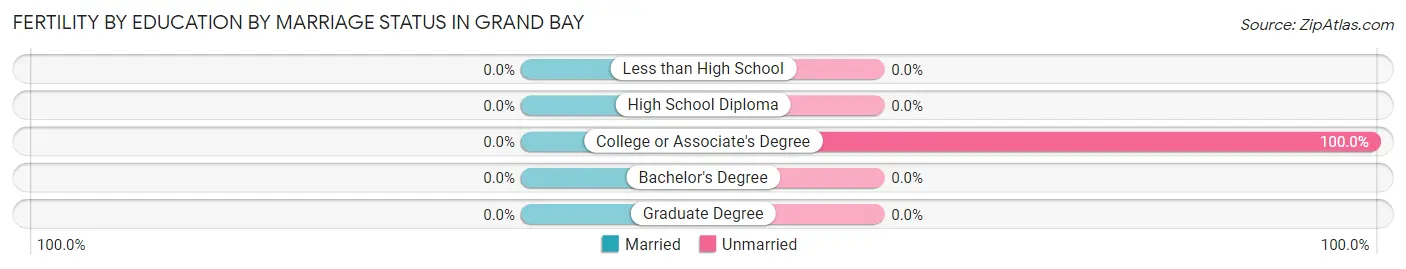
| Educational Attainment | Married | Unmarried |
| Less than High School | 0 (0.0%) | 0 (0.0%) |
| High School Diploma | 0 (0.0%) | 0 (0.0%) |
| College or Associate's Degree | 0 (0.0%) | 19 (100.0%) |
| Bachelor's Degree | 0 (0.0%) | 0 (0.0%) |
| Graduate Degree | 0 (0.0%) | 0 (0.0%) |
| Total | 0 (0.0%) | 19 (100.0%) |
Employment Characteristics in Grand Bay
Employment by Class of Employer in Grand Bay
Among the 1,742 employed individuals in Grand Bay, private company employees (1,282 | 73.6%), self-employed (incorporated) (190 | 10.9%), and self-employed (not incorporated) (81 | 4.6%) make up the most common classes of employment.
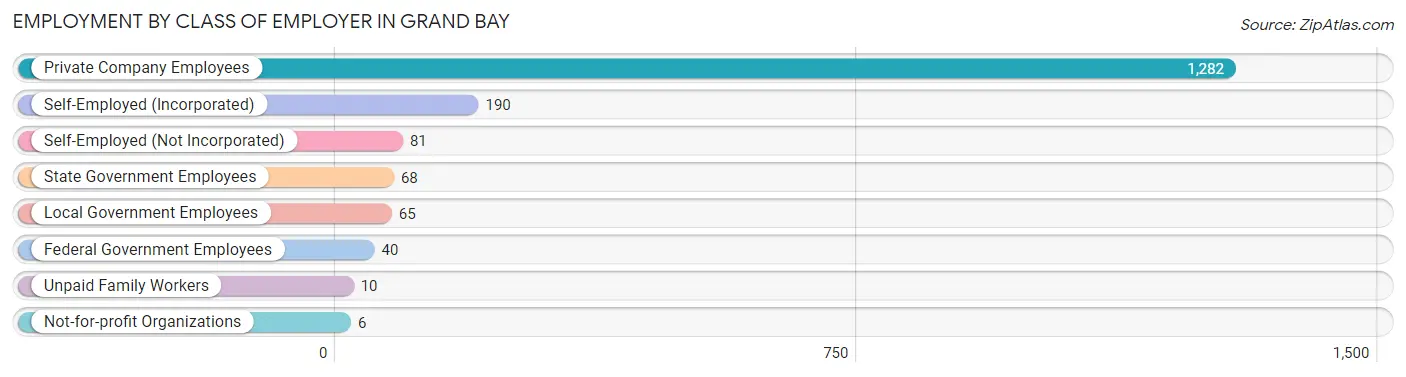
| Employer Class | # Employees | % Employees |
| Private Company Employees | 1,282 | 73.6% |
| Self-Employed (Incorporated) | 190 | 10.9% |
| Self-Employed (Not Incorporated) | 81 | 4.6% |
| Not-for-profit Organizations | 6 | 0.3% |
| Local Government Employees | 65 | 3.7% |
| State Government Employees | 68 | 3.9% |
| Federal Government Employees | 40 | 2.3% |
| Unpaid Family Workers | 10 | 0.6% |
| Total | 1,742 | 100.0% |
Employment Status by Age in Grand Bay
According to the labor force statistics for Grand Bay, out of the total population over 16 years of age (2,787), 65.6% or 1,828 individuals are in the labor force, with 4.4% or 80 of them unemployed. The age group with the highest labor force participation rate is 20 to 24 years, with 100.0% or 121 individuals in the labor force. Within the labor force, the 60 to 64 years age range has the highest percentage of unemployed individuals, with 11.3% or 9 of them being unemployed.
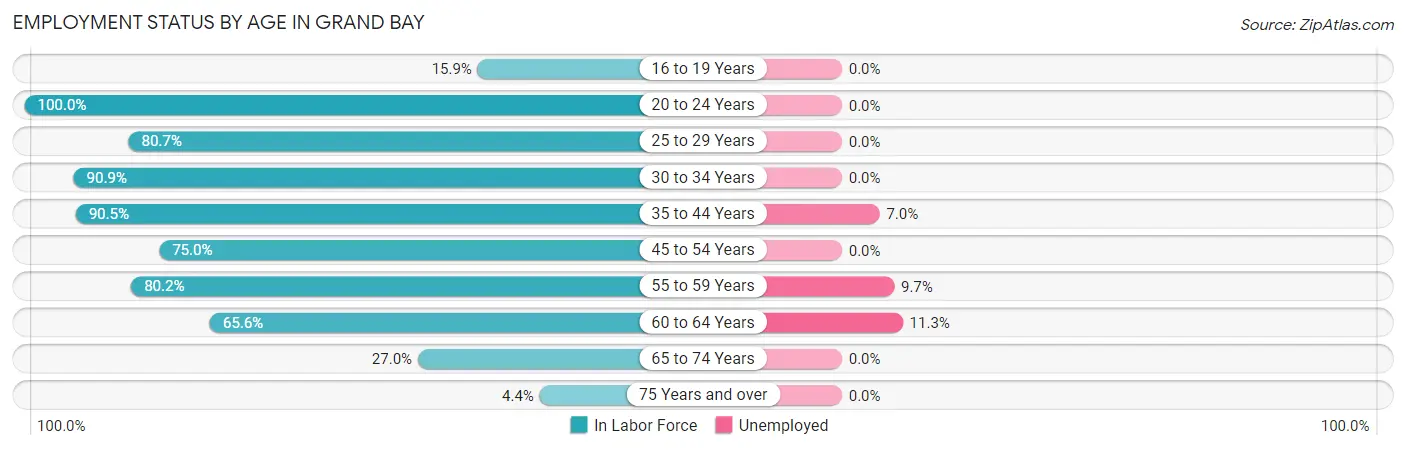
| Age Bracket | In Labor Force | Unemployed |
| 16 to 19 Years | 14 (15.9%) | 0 (0.0%) |
| 20 to 24 Years | 121 (100.0%) | 0 (0.0%) |
| 25 to 29 Years | 117 (80.7%) | 0 (0.0%) |
| 30 to 34 Years | 189 (90.9%) | 0 (0.0%) |
| 35 to 44 Years | 516 (90.5%) | 36 (7.0%) |
| 45 to 54 Years | 294 (75.0%) | 0 (0.0%) |
| 55 to 59 Years | 360 (80.2%) | 35 (9.7%) |
| 60 to 64 Years | 80 (65.6%) | 9 (11.3%) |
| 65 to 74 Years | 126 (27.0%) | 0 (0.0%) |
| 75 Years and over | 10 (4.4%) | 0 (0.0%) |
| Total | 1,828 (65.6%) | 80 (4.4%) |
Employment Status by Educational Attainment in Grand Bay
According to labor force statistics for Grand Bay, 82.5% of individuals (1,556) out of the total population between 25 and 64 years of age (1,886) are in the labor force, with 5.1% or 79 of them being unemployed. The group with the highest labor force participation rate are those with the educational attainment of bachelor's degree or higher, with 89.8% or 219 individuals in the labor force. Within the labor force, individuals with college / associate degree education have the highest percentage of unemployment, with 12.4% or 38 of them being unemployed.
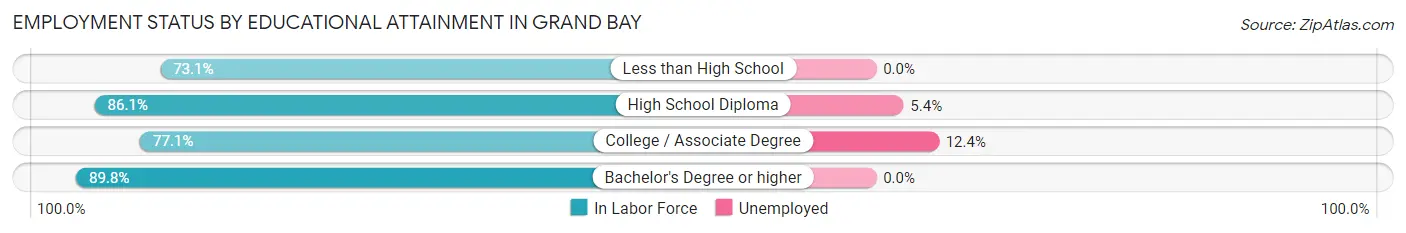
| Educational Attainment | In Labor Force | Unemployed |
| Less than High School | 225 (73.1%) | 0 (0.0%) |
| High School Diploma | 803 (86.1%) | 50 (5.4%) |
| College / Associate Degree | 309 (77.1%) | 50 (12.4%) |
| Bachelor's Degree or higher | 219 (89.8%) | 0 (0.0%) |
| Total | 1,556 (82.5%) | 96 (5.1%) |
Employment Occupations by Sex in Grand Bay
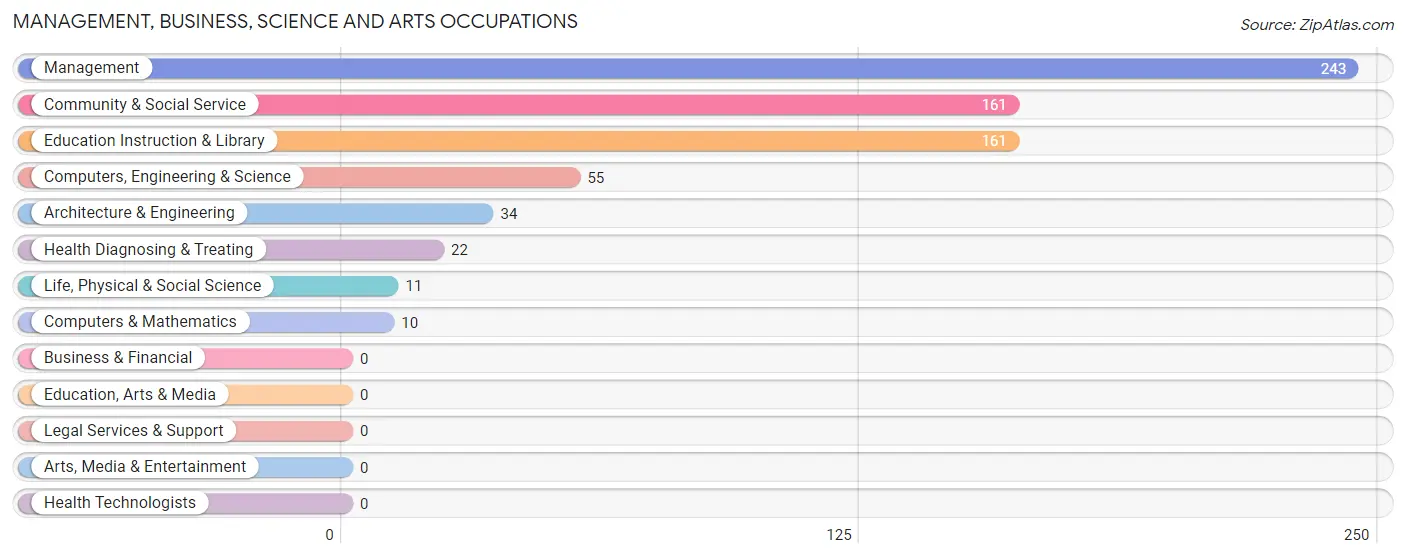
Management, Business, Science and Arts Occupations
The most common Management, Business, Science and Arts occupations in Grand Bay are Management (243 | 14.1%), Community & Social Service (161 | 9.3%), Education Instruction & Library (161 | 9.3%), Computers, Engineering & Science (55 | 3.2%), and Architecture & Engineering (34 | 2.0%).
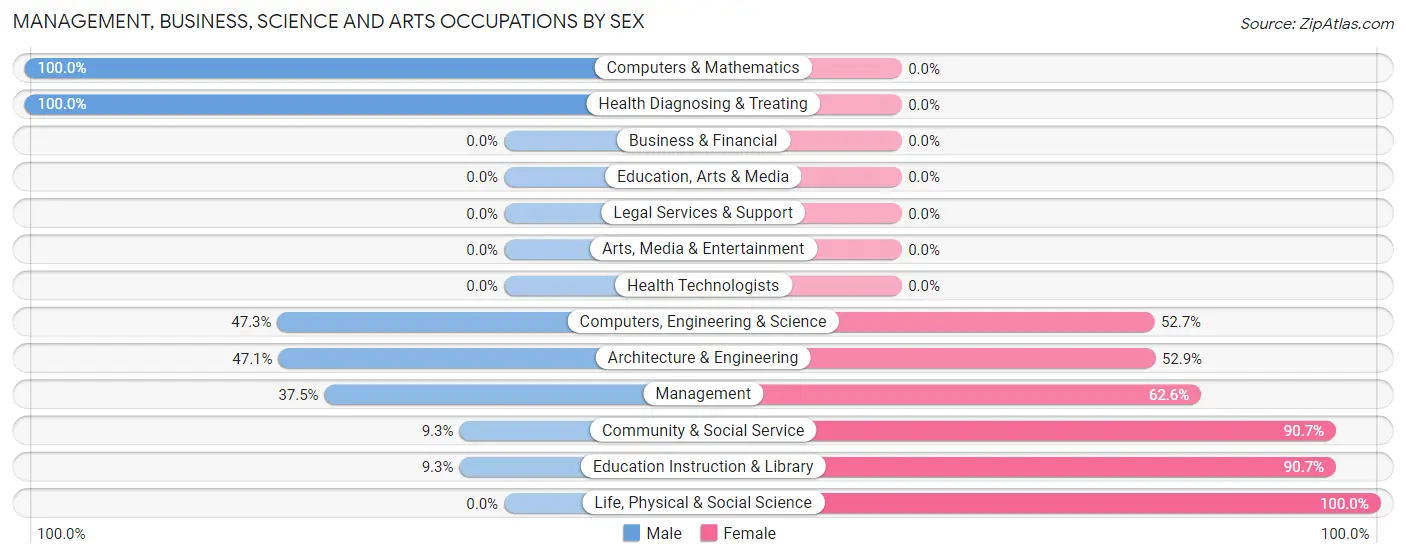
Management, Business, Science and Arts Occupations by Sex
Within the Management, Business, Science and Arts occupations in Grand Bay, the most male-oriented occupations are Computers & Mathematics (100.0%), Health Diagnosing & Treating (100.0%), and Computers, Engineering & Science (47.3%), while the most female-oriented occupations are Life, Physical & Social Science (100.0%), Community & Social Service (90.7%), and Education Instruction & Library (90.7%).
| Occupation | Male | Female |
| Management | 91 (37.4%) | 152 (62.5%) |
| Business & Financial | 0 (0.0%) | 0 (0.0%) |
| Computers, Engineering & Science | 26 (47.3%) | 29 (52.7%) |
| Computers & Mathematics | 10 (100.0%) | 0 (0.0%) |
| Architecture & Engineering | 16 (47.1%) | 18 (52.9%) |
| Life, Physical & Social Science | 0 (0.0%) | 11 (100.0%) |
| Community & Social Service | 15 (9.3%) | 146 (90.7%) |
| Education, Arts & Media | 0 (0.0%) | 0 (0.0%) |
| Legal Services & Support | 0 (0.0%) | 0 (0.0%) |
| Education Instruction & Library | 15 (9.3%) | 146 (90.7%) |
| Arts, Media & Entertainment | 0 (0.0%) | 0 (0.0%) |
| Health Diagnosing & Treating | 22 (100.0%) | 0 (0.0%) |
| Health Technologists | 0 (0.0%) | 0 (0.0%) |
| Total (Category) | 154 (32.0%) | 327 (68.0%) |
| Total (Overall) | 941 (54.4%) | 788 (45.6%) |
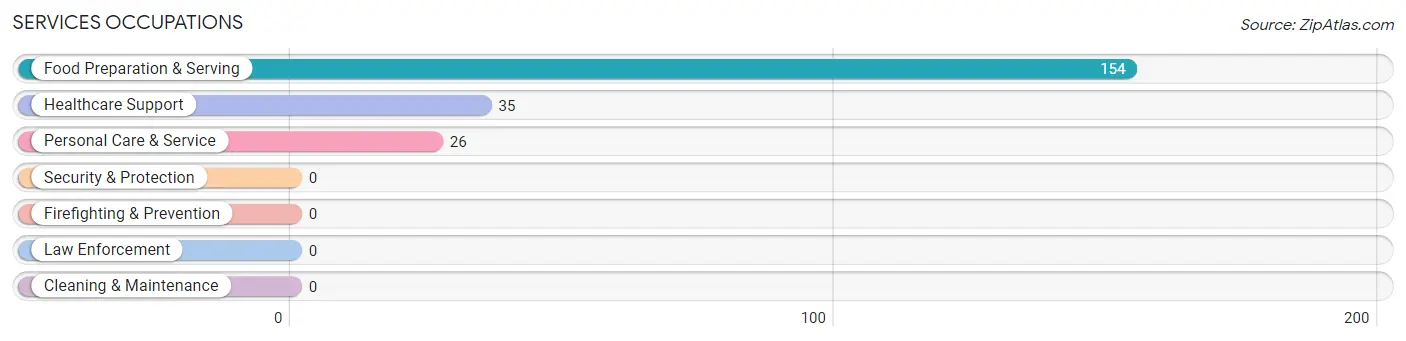
Services Occupations
The most common Services occupations in Grand Bay are Food Preparation & Serving (154 | 8.9%), Healthcare Support (35 | 2.0%), and Personal Care & Service (26 | 1.5%).
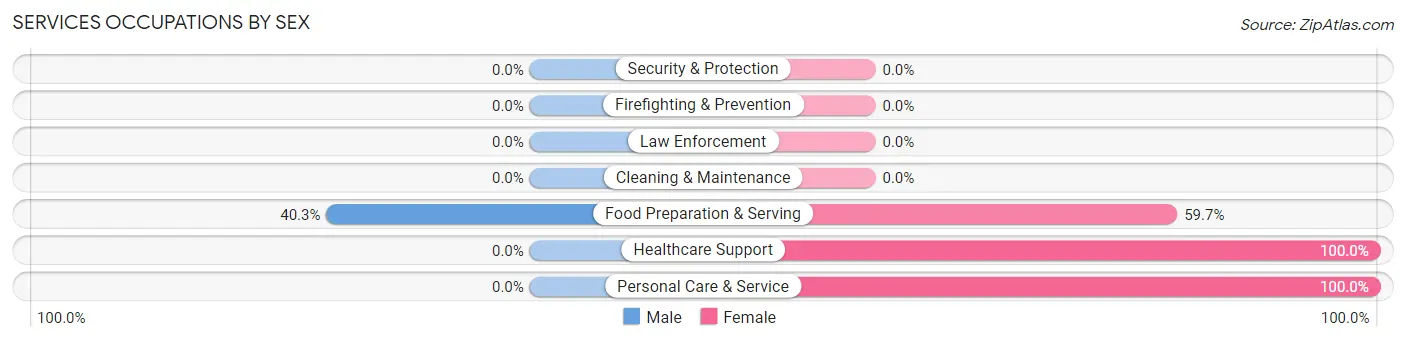
Services Occupations by Sex
| Occupation | Male | Female |
| Healthcare Support | 0 (0.0%) | 35 (100.0%) |
| Security & Protection | 0 (0.0%) | 0 (0.0%) |
| Firefighting & Prevention | 0 (0.0%) | 0 (0.0%) |
| Law Enforcement | 0 (0.0%) | 0 (0.0%) |
| Food Preparation & Serving | 62 (40.3%) | 92 (59.7%) |
| Cleaning & Maintenance | 0 (0.0%) | 0 (0.0%) |
| Personal Care & Service | 0 (0.0%) | 26 (100.0%) |
| Total (Category) | 62 (28.8%) | 153 (71.2%) |
| Total (Overall) | 941 (54.4%) | 788 (45.6%) |
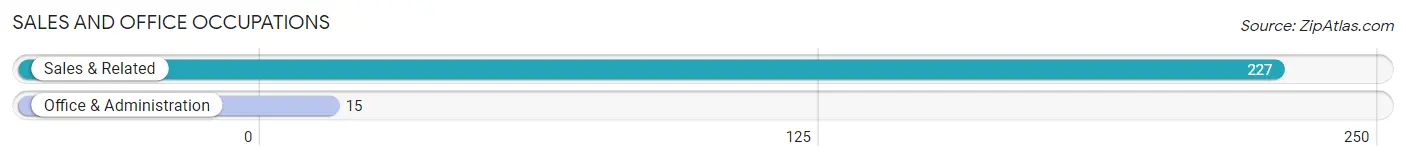
Sales and Office Occupations
The most common Sales and Office occupations in Grand Bay are Sales & Related (227 | 13.1%), and Office & Administration (15 | 0.9%).
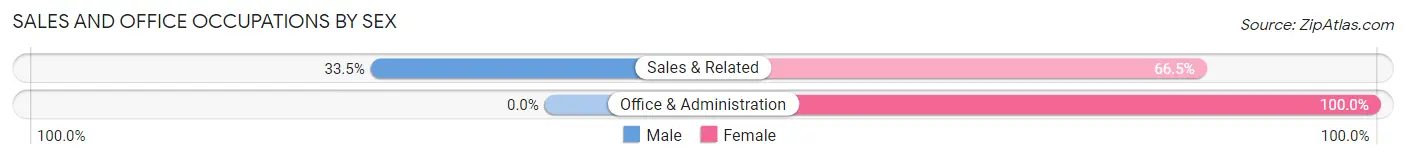
Sales and Office Occupations by Sex
| Occupation | Male | Female |
| Sales & Related | 76 (33.5%) | 151 (66.5%) |
| Office & Administration | 0 (0.0%) | 15 (100.0%) |
| Total (Category) | 76 (31.4%) | 166 (68.6%) |
| Total (Overall) | 941 (54.4%) | 788 (45.6%) |
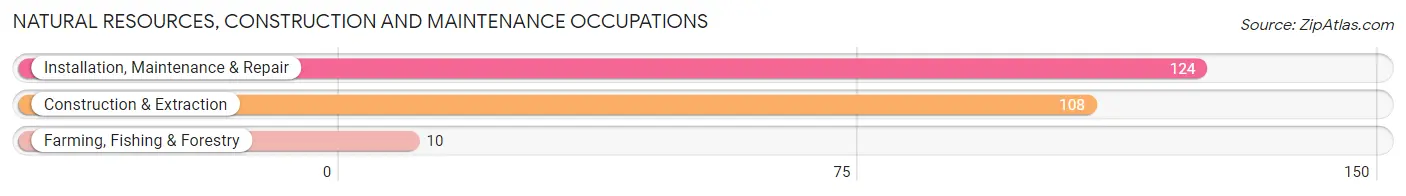
Natural Resources, Construction and Maintenance Occupations
The most common Natural Resources, Construction and Maintenance occupations in Grand Bay are Installation, Maintenance & Repair (124 | 7.2%), Construction & Extraction (108 | 6.2%), and Farming, Fishing & Forestry (10 | 0.6%).
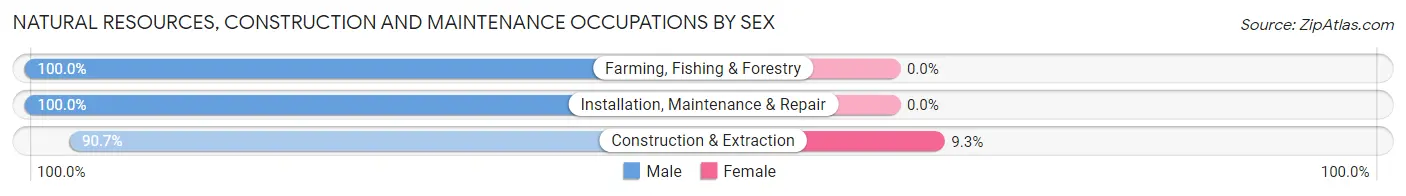
Natural Resources, Construction and Maintenance Occupations by Sex
| Occupation | Male | Female |
| Farming, Fishing & Forestry | 10 (100.0%) | 0 (0.0%) |
| Construction & Extraction | 98 (90.7%) | 10 (9.3%) |
| Installation, Maintenance & Repair | 124 (100.0%) | 0 (0.0%) |
| Total (Category) | 232 (95.9%) | 10 (4.1%) |
| Total (Overall) | 941 (54.4%) | 788 (45.6%) |
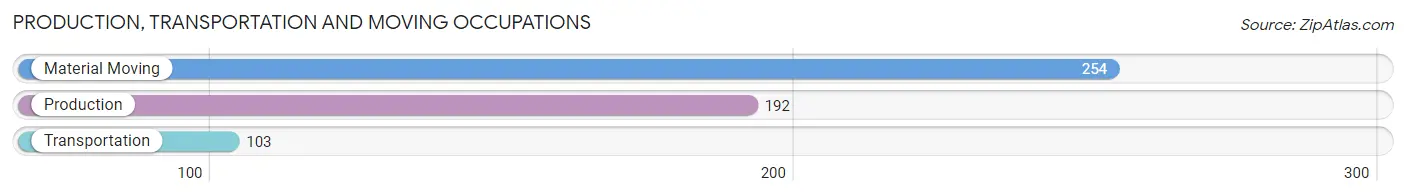
Production, Transportation and Moving Occupations
The most common Production, Transportation and Moving occupations in Grand Bay are Material Moving (254 | 14.7%), Production (192 | 11.1%), and Transportation (103 | 6.0%).
Production, Transportation and Moving Occupations by Sex
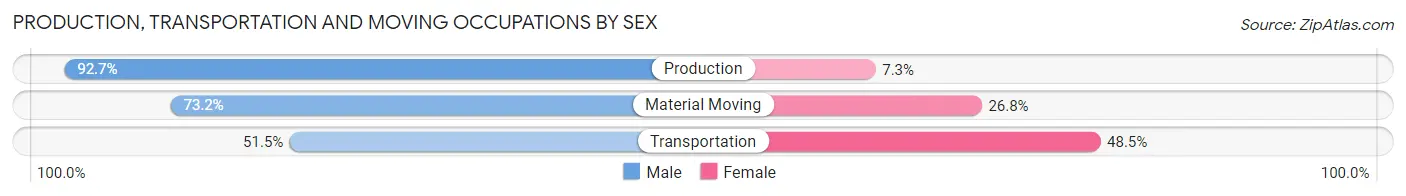
| Occupation | Male | Female |
| Production | 178 (92.7%) | 14 (7.3%) |
| Transportation | 53 (51.5%) | 50 (48.5%) |
| Material Moving | 186 (73.2%) | 68 (26.8%) |
| Total (Category) | 417 (76.0%) | 132 (24.0%) |
| Total (Overall) | 941 (54.4%) | 788 (45.6%) |
Employment Industries by Sex in Grand Bay
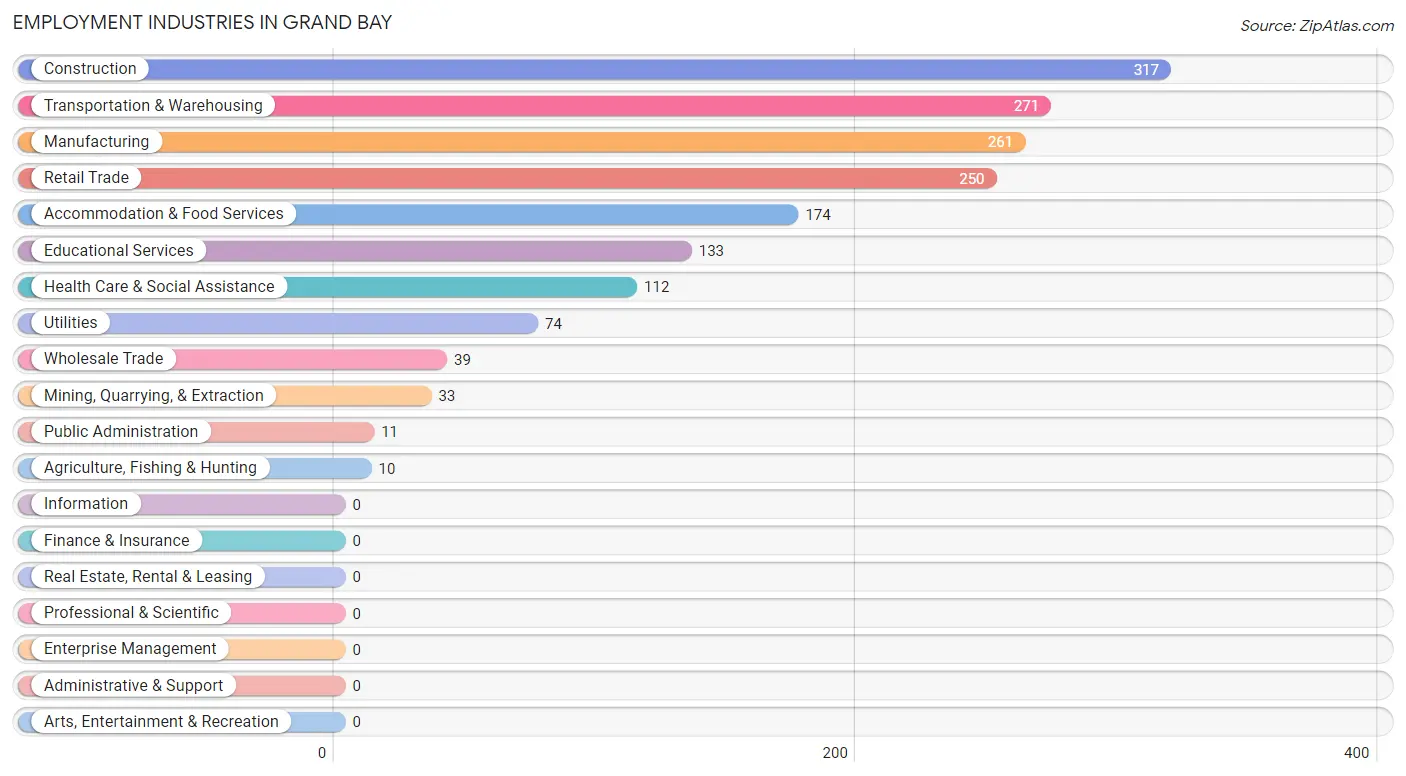
Employment Industries in Grand Bay
The major employment industries in Grand Bay include Construction (317 | 18.3%), Transportation & Warehousing (271 | 15.7%), Manufacturing (261 | 15.1%), Retail Trade (250 | 14.5%), and Accommodation & Food Services (174 | 10.1%).
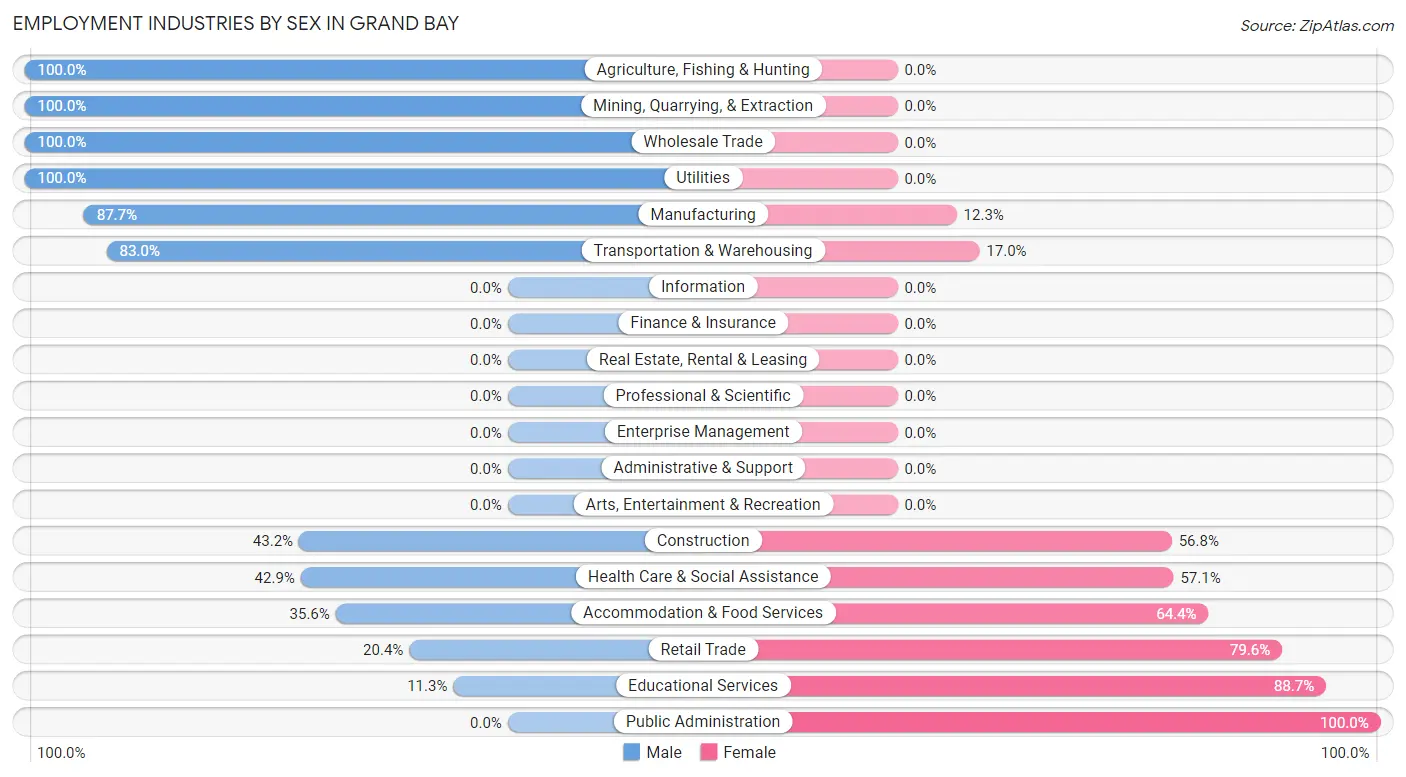
Employment Industries by Sex in Grand Bay
The Grand Bay industries that see more men than women are Agriculture, Fishing & Hunting (100.0%), Mining, Quarrying, & Extraction (100.0%), and Wholesale Trade (100.0%), whereas the industries that tend to have a higher number of women are Public Administration (100.0%), Educational Services (88.7%), and Retail Trade (79.6%).
| Industry | Male | Female |
| Agriculture, Fishing & Hunting | 10 (100.0%) | 0 (0.0%) |
| Mining, Quarrying, & Extraction | 33 (100.0%) | 0 (0.0%) |
| Construction | 137 (43.2%) | 180 (56.8%) |
| Manufacturing | 229 (87.7%) | 32 (12.3%) |
| Wholesale Trade | 39 (100.0%) | 0 (0.0%) |
| Retail Trade | 51 (20.4%) | 199 (79.6%) |
| Transportation & Warehousing | 225 (83.0%) | 46 (17.0%) |
| Utilities | 74 (100.0%) | 0 (0.0%) |
| Information | 0 (0.0%) | 0 (0.0%) |
| Finance & Insurance | 0 (0.0%) | 0 (0.0%) |
| Real Estate, Rental & Leasing | 0 (0.0%) | 0 (0.0%) |
| Professional & Scientific | 0 (0.0%) | 0 (0.0%) |
| Enterprise Management | 0 (0.0%) | 0 (0.0%) |
| Administrative & Support | 0 (0.0%) | 0 (0.0%) |
| Educational Services | 15 (11.3%) | 118 (88.7%) |
| Health Care & Social Assistance | 48 (42.9%) | 64 (57.1%) |
| Arts, Entertainment & Recreation | 0 (0.0%) | 0 (0.0%) |
| Accommodation & Food Services | 62 (35.6%) | 112 (64.4%) |
| Public Administration | 0 (0.0%) | 11 (100.0%) |
| Total | 941 (54.4%) | 788 (45.6%) |
Education in Grand Bay
School Enrollment in Grand Bay
The most common levels of schooling among the 844 students in Grand Bay are middle school (292 | 34.6%), elementary school (261 | 30.9%), and college / undergraduate (112 | 13.3%).
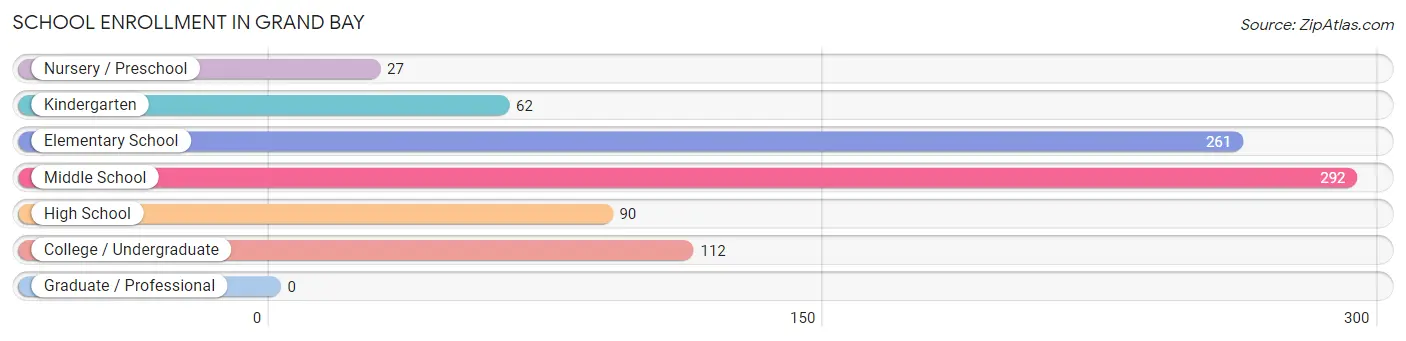
| School Level | # Students | % Students |
| Nursery / Preschool | 27 | 3.2% |
| Kindergarten | 62 | 7.3% |
| Elementary School | 261 | 30.9% |
| Middle School | 292 | 34.6% |
| High School | 90 | 10.7% |
| College / Undergraduate | 112 | 13.3% |
| Graduate / Professional | 0 | 0.0% |
| Total | 844 | 100.0% |
School Enrollment by Age by Funding Source in Grand Bay
Out of a total of 844 students who are enrolled in schools in Grand Bay, 107 (12.7%) attend a private institution, while the remaining 737 (87.3%) are enrolled in public schools. The age group of 3 to 4 year olds has the highest likelihood of being enrolled in private schools, with 27 (100.0% in the age bracket) enrolled. Conversely, the age group of 15 to 17 year olds has the lowest likelihood of being enrolled in a private school, with 42 (100.0% in the age bracket) attending a public institution.
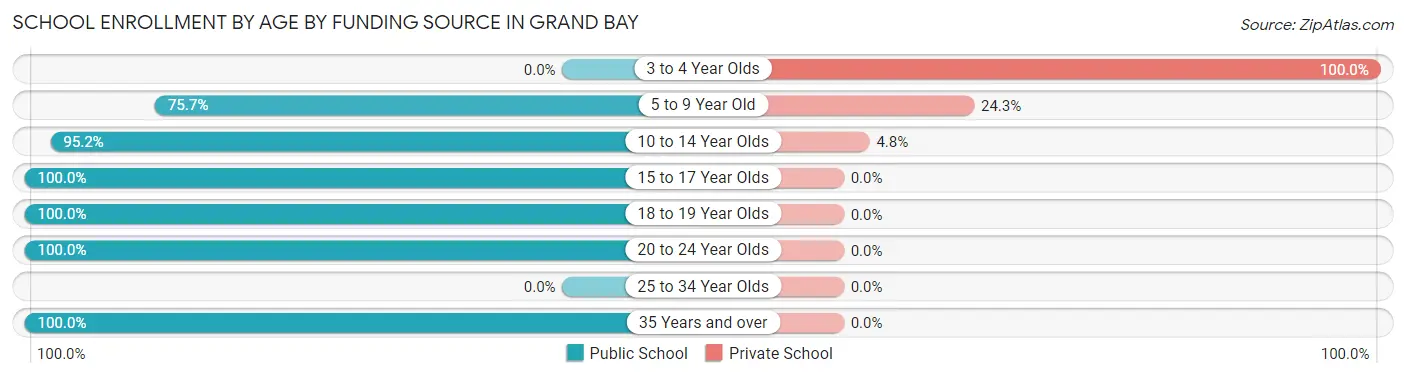
| Age Bracket | Public School | Private School |
| 3 to 4 Year Olds | 0 (0.0%) | 27 (100.0%) |
| 5 to 9 Year Old | 187 (75.7%) | 60 (24.3%) |
| 10 to 14 Year Olds | 396 (95.2%) | 20 (4.8%) |
| 15 to 17 Year Olds | 42 (100.0%) | 0 (0.0%) |
| 18 to 19 Year Olds | 46 (100.0%) | 0 (0.0%) |
| 20 to 24 Year Olds | 31 (100.0%) | 0 (0.0%) |
| 25 to 34 Year Olds | 0 (0.0%) | 0 (0.0%) |
| 35 Years and over | 35 (100.0%) | 0 (0.0%) |
| Total | 737 (87.3%) | 107 (12.7%) |
Educational Attainment by Field of Study in Grand Bay
Education (110 | 30.0%), business (86 | 23.4%), arts & humanities (64 | 17.4%), science & technology (62 | 16.9%), and liberal arts & history (12 | 3.3%) are the most common fields of study among 367 individuals in Grand Bay who have obtained a bachelor's degree or higher.
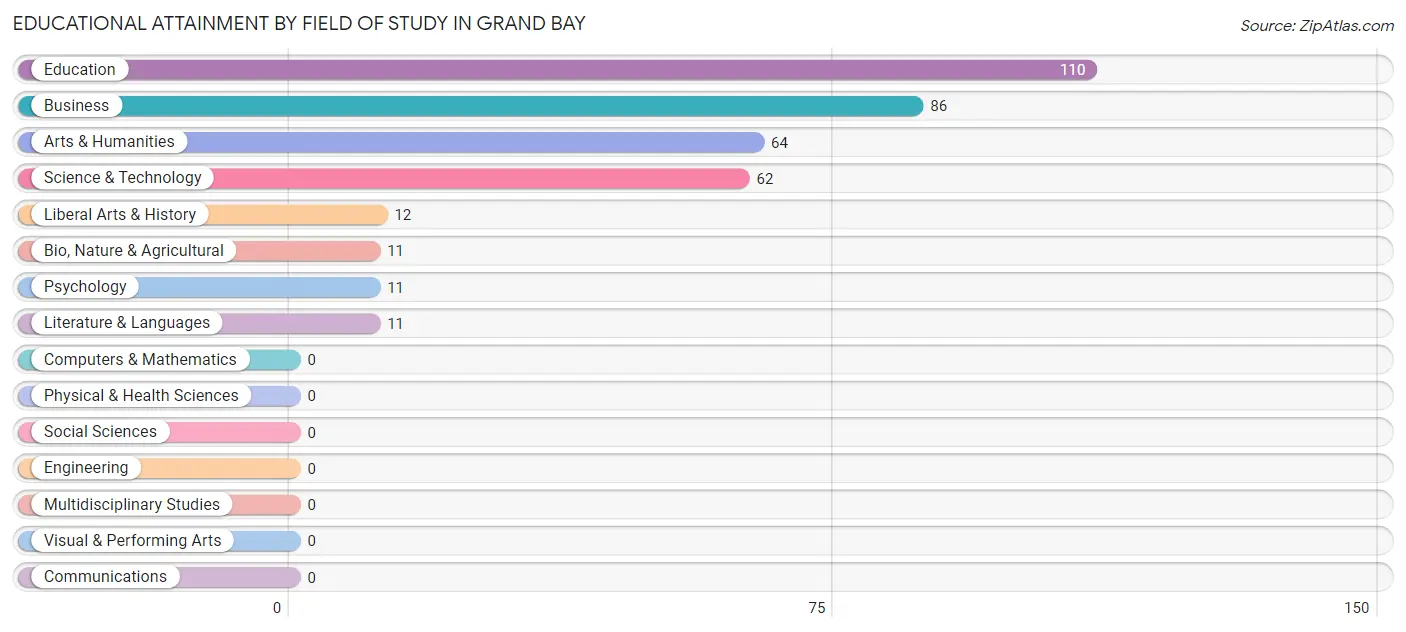
| Field of Study | # Graduates | % Graduates |
| Computers & Mathematics | 0 | 0.0% |
| Bio, Nature & Agricultural | 11 | 3.0% |
| Physical & Health Sciences | 0 | 0.0% |
| Psychology | 11 | 3.0% |
| Social Sciences | 0 | 0.0% |
| Engineering | 0 | 0.0% |
| Multidisciplinary Studies | 0 | 0.0% |
| Science & Technology | 62 | 16.9% |
| Business | 86 | 23.4% |
| Education | 110 | 30.0% |
| Literature & Languages | 11 | 3.0% |
| Liberal Arts & History | 12 | 3.3% |
| Visual & Performing Arts | 0 | 0.0% |
| Communications | 0 | 0.0% |
| Arts & Humanities | 64 | 17.4% |
| Total | 367 | 100.0% |
Transportation & Commute in Grand Bay
Vehicle Availability by Sex in Grand Bay
The most prevalent vehicle ownership categories in Grand Bay are males with 3 vehicles (332, accounting for 34.8%) and females with 3 vehicles (292, making up 42.1%).
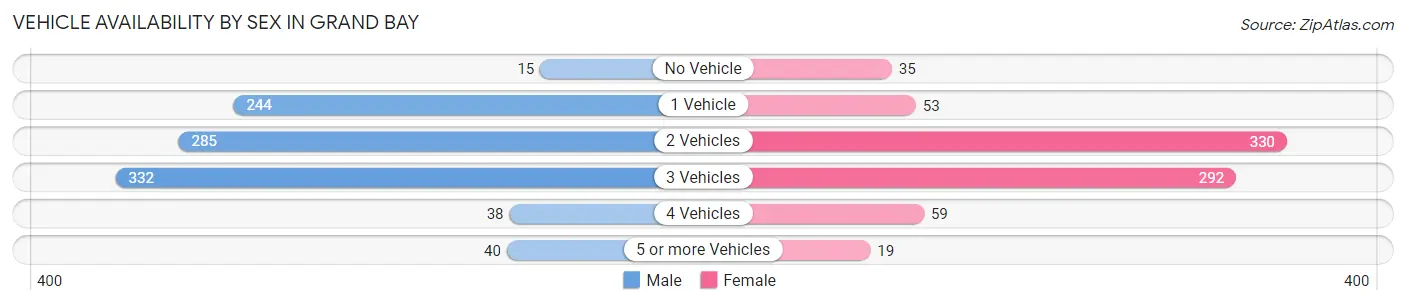
| Vehicles Available | Male | Female |
| No Vehicle | 15 (1.6%) | 35 (4.4%) |
| 1 Vehicle | 244 (25.6%) | 53 (6.7%) |
| 2 Vehicles | 285 (29.9%) | 330 (41.9%) |
| 3 Vehicles | 332 (34.8%) | 292 (37.1%) |
| 4 Vehicles | 38 (4.0%) | 59 (7.5%) |
| 5 or more Vehicles | 40 (4.2%) | 19 (2.4%) |
| Total | 954 (100.0%) | 788 (100.0%) |
Commute Time in Grand Bay
The most frequently occuring commute durations in Grand Bay are 30 to 34 minutes (397 commuters, 23.9%), 20 to 24 minutes (312 commuters, 18.8%), and 90 or more minutes (254 commuters, 15.3%).
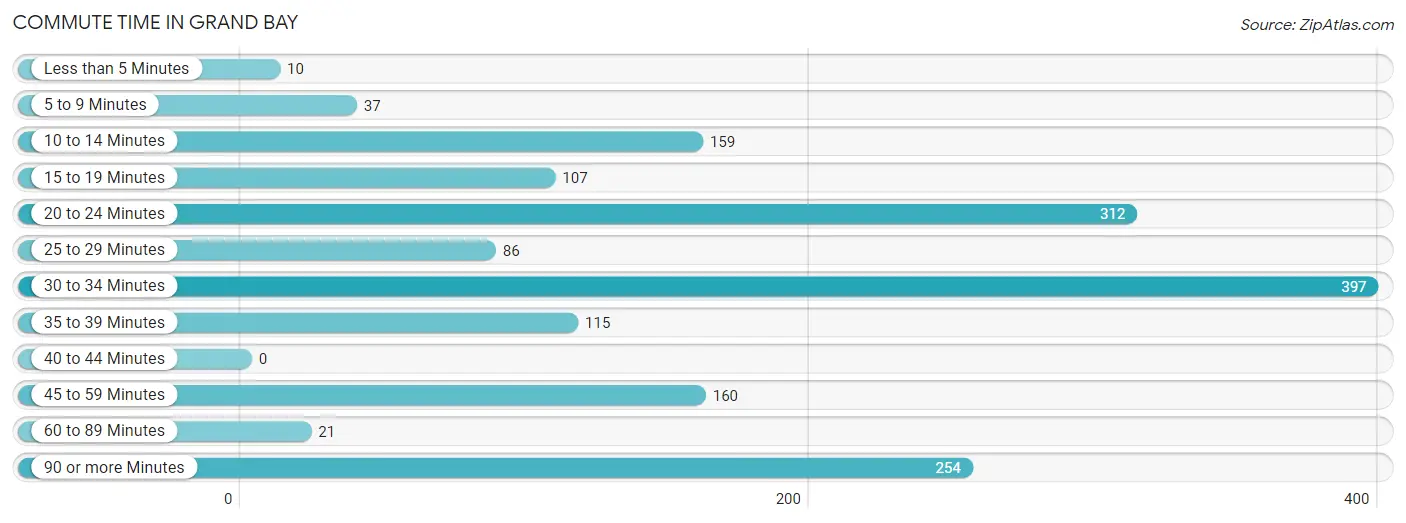
| Commute Time | # Commuters | % Commuters |
| Less than 5 Minutes | 10 | 0.6% |
| 5 to 9 Minutes | 37 | 2.2% |
| 10 to 14 Minutes | 159 | 9.6% |
| 15 to 19 Minutes | 107 | 6.5% |
| 20 to 24 Minutes | 312 | 18.8% |
| 25 to 29 Minutes | 86 | 5.2% |
| 30 to 34 Minutes | 397 | 23.9% |
| 35 to 39 Minutes | 115 | 6.9% |
| 40 to 44 Minutes | 0 | 0.0% |
| 45 to 59 Minutes | 160 | 9.7% |
| 60 to 89 Minutes | 21 | 1.3% |
| 90 or more Minutes | 254 | 15.3% |
Commute Time by Sex in Grand Bay
The most common commute times in Grand Bay are 30 to 34 minutes (272 commuters, 31.3%) for males and 10 to 14 minutes (159 commuters, 20.2%) for females.
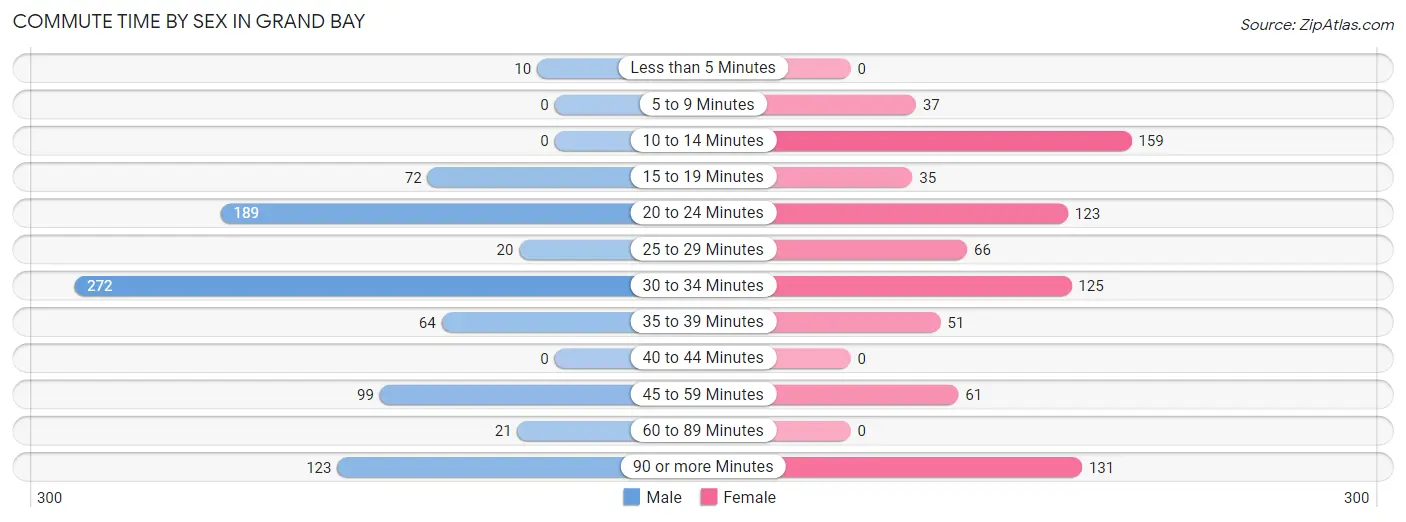
| Commute Time | Male | Female |
| Less than 5 Minutes | 10 (1.1%) | 0 (0.0%) |
| 5 to 9 Minutes | 0 (0.0%) | 37 (4.7%) |
| 10 to 14 Minutes | 0 (0.0%) | 159 (20.2%) |
| 15 to 19 Minutes | 72 (8.3%) | 35 (4.4%) |
| 20 to 24 Minutes | 189 (21.7%) | 123 (15.6%) |
| 25 to 29 Minutes | 20 (2.3%) | 66 (8.4%) |
| 30 to 34 Minutes | 272 (31.3%) | 125 (15.9%) |
| 35 to 39 Minutes | 64 (7.4%) | 51 (6.5%) |
| 40 to 44 Minutes | 0 (0.0%) | 0 (0.0%) |
| 45 to 59 Minutes | 99 (11.4%) | 61 (7.7%) |
| 60 to 89 Minutes | 21 (2.4%) | 0 (0.0%) |
| 90 or more Minutes | 123 (14.1%) | 131 (16.6%) |
Time of Departure to Work by Sex in Grand Bay
The most frequent times of departure to work in Grand Bay are 7:00 AM to 7:29 AM (336, 38.6%) for males and 7:00 AM to 7:29 AM (278, 35.3%) for females.
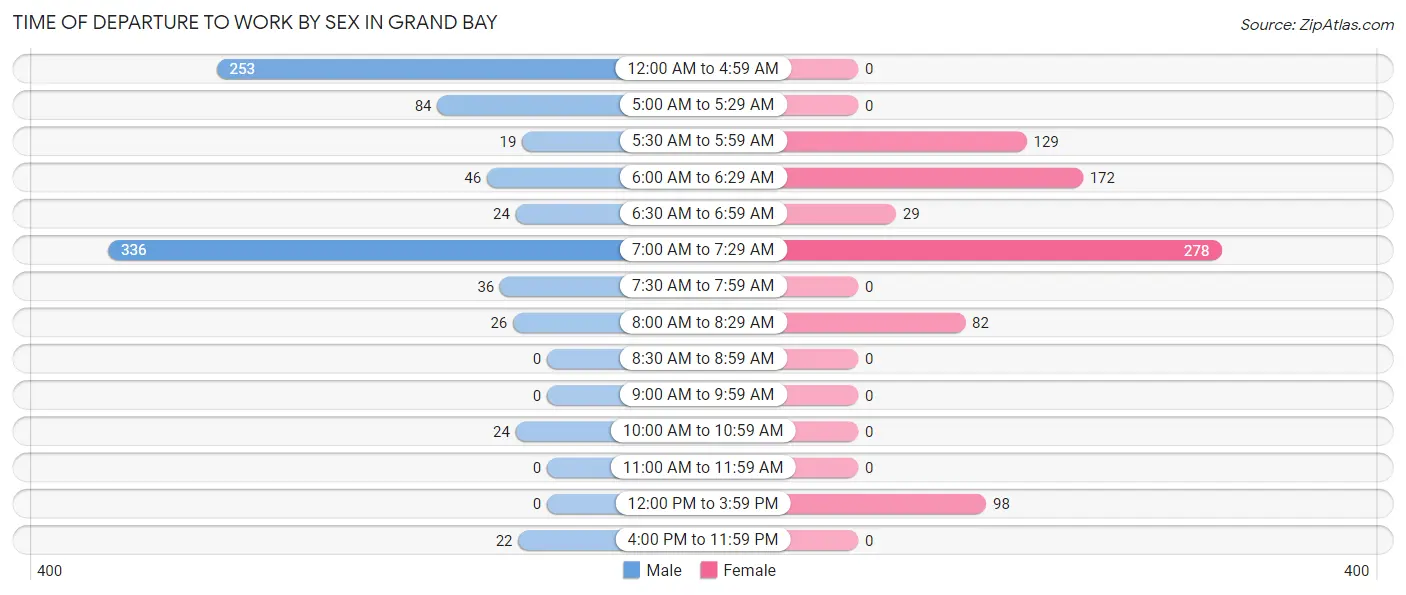
| Time of Departure | Male | Female |
| 12:00 AM to 4:59 AM | 253 (29.1%) | 0 (0.0%) |
| 5:00 AM to 5:29 AM | 84 (9.7%) | 0 (0.0%) |
| 5:30 AM to 5:59 AM | 19 (2.2%) | 129 (16.4%) |
| 6:00 AM to 6:29 AM | 46 (5.3%) | 172 (21.8%) |
| 6:30 AM to 6:59 AM | 24 (2.8%) | 29 (3.7%) |
| 7:00 AM to 7:29 AM | 336 (38.6%) | 278 (35.3%) |
| 7:30 AM to 7:59 AM | 36 (4.1%) | 0 (0.0%) |
| 8:00 AM to 8:29 AM | 26 (3.0%) | 82 (10.4%) |
| 8:30 AM to 8:59 AM | 0 (0.0%) | 0 (0.0%) |
| 9:00 AM to 9:59 AM | 0 (0.0%) | 0 (0.0%) |
| 10:00 AM to 10:59 AM | 24 (2.8%) | 0 (0.0%) |
| 11:00 AM to 11:59 AM | 0 (0.0%) | 0 (0.0%) |
| 12:00 PM to 3:59 PM | 0 (0.0%) | 98 (12.4%) |
| 4:00 PM to 11:59 PM | 22 (2.5%) | 0 (0.0%) |
| Total | 870 (100.0%) | 788 (100.0%) |
Housing Occupancy in Grand Bay
Occupancy by Ownership in Grand Bay
Of the total 1,505 dwellings in Grand Bay, owner-occupied units account for 1,206 (80.1%), while renter-occupied units make up 299 (19.9%).
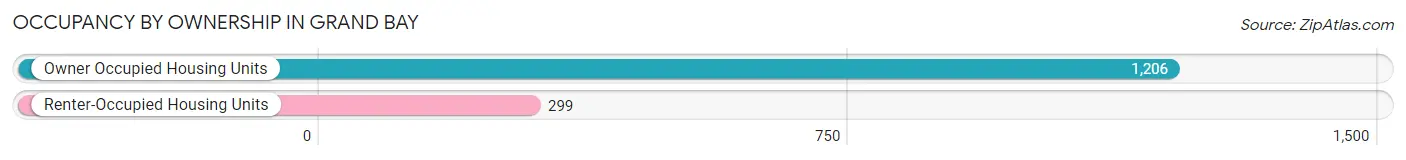
| Occupancy | # Housing Units | % Housing Units |
| Owner Occupied Housing Units | 1,206 | 80.1% |
| Renter-Occupied Housing Units | 299 | 19.9% |
| Total Occupied Housing Units | 1,505 | 100.0% |
Occupancy by Household Size in Grand Bay
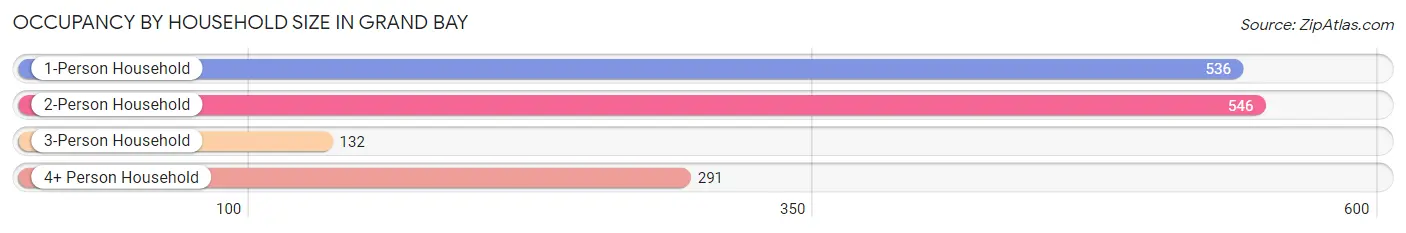
| Household Size | # Housing Units | % Housing Units |
| 1-Person Household | 536 | 35.6% |
| 2-Person Household | 546 | 36.3% |
| 3-Person Household | 132 | 8.8% |
| 4+ Person Household | 291 | 19.3% |
| Total Housing Units | 1,505 | 100.0% |
Occupancy by Ownership by Household Size in Grand Bay
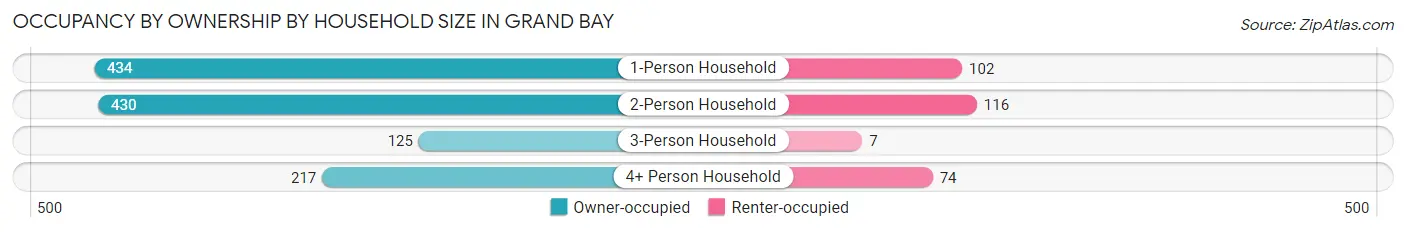
| Household Size | Owner-occupied | Renter-occupied |
| 1-Person Household | 434 (81.0%) | 102 (19.0%) |
| 2-Person Household | 430 (78.7%) | 116 (21.2%) |
| 3-Person Household | 125 (94.7%) | 7 (5.3%) |
| 4+ Person Household | 217 (74.6%) | 74 (25.4%) |
| Total Housing Units | 1,206 (80.1%) | 299 (19.9%) |
Occupancy by Educational Attainment in Grand Bay
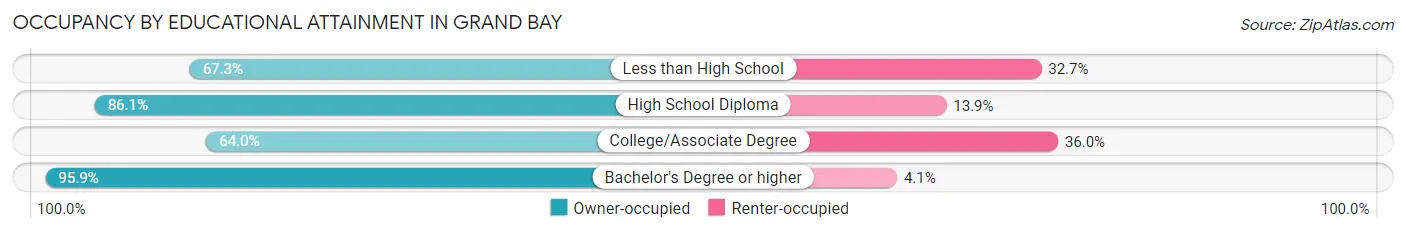
| Household Size | Owner-occupied | Renter-occupied |
| Less than High School | 113 (67.3%) | 55 (32.7%) |
| High School Diploma | 625 (86.1%) | 101 (13.9%) |
| College/Associate Degree | 236 (64.0%) | 133 (36.0%) |
| Bachelor's Degree or higher | 232 (95.9%) | 10 (4.1%) |
Occupancy by Age of Householder in Grand Bay
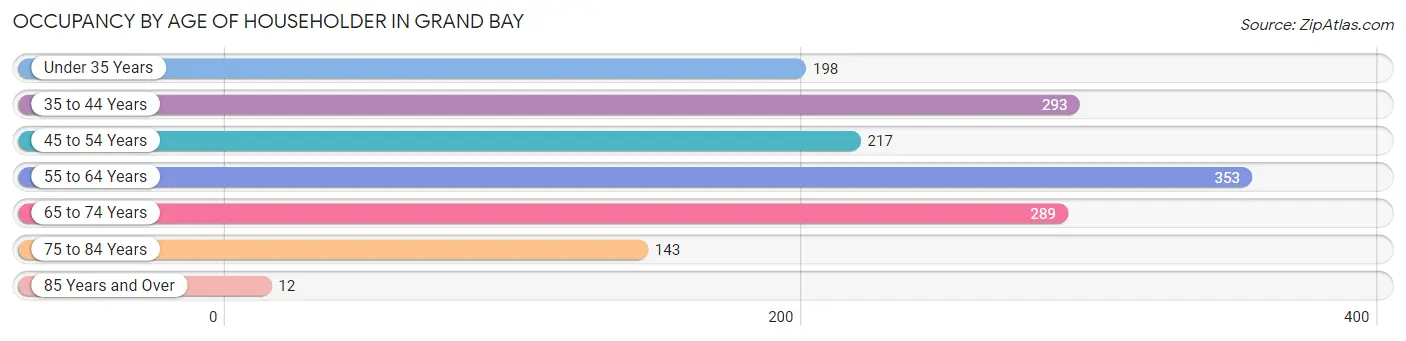
| Age Bracket | # Households | % Households |
| Under 35 Years | 198 | 13.2% |
| 35 to 44 Years | 293 | 19.5% |
| 45 to 54 Years | 217 | 14.4% |
| 55 to 64 Years | 353 | 23.5% |
| 65 to 74 Years | 289 | 19.2% |
| 75 to 84 Years | 143 | 9.5% |
| 85 Years and Over | 12 | 0.8% |
| Total | 1,505 | 100.0% |
Housing Finances in Grand Bay
Median Income by Occupancy in Grand Bay
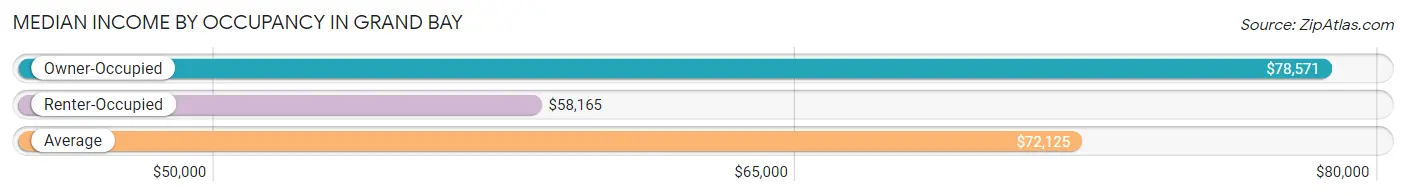
| Occupancy Type | # Households | Median Income |
| Owner-Occupied | 1,206 (80.1%) | $78,571 |
| Renter-Occupied | 299 (19.9%) | $58,165 |
| Average | 1,505 (100.0%) | $72,125 |
Occupancy by Householder Income Bracket in Grand Bay
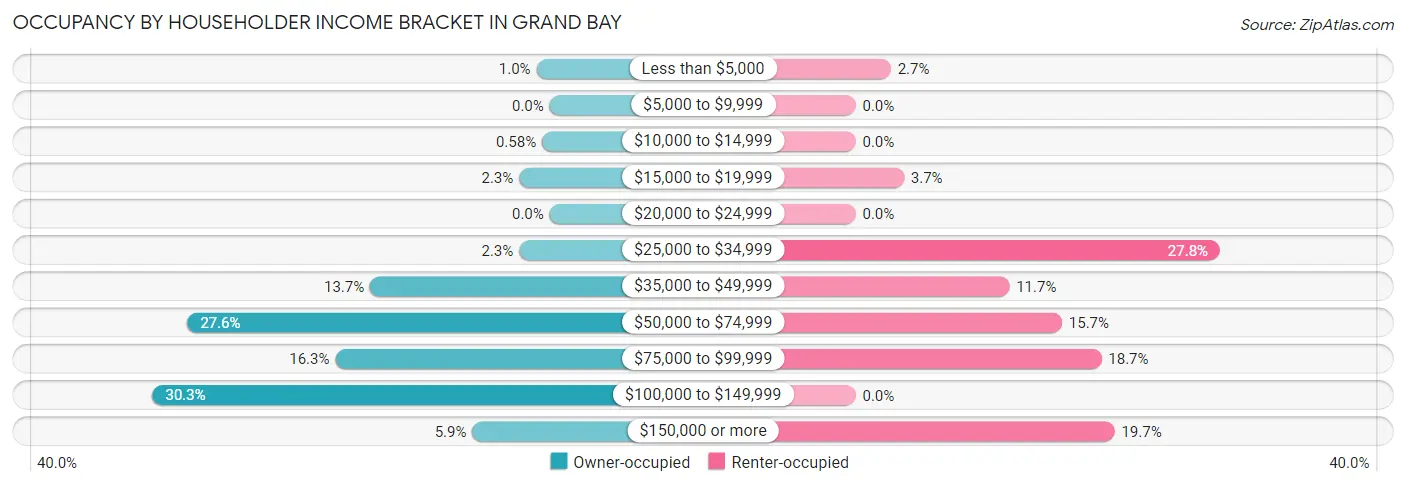
| Income Bracket | Owner-occupied | Renter-occupied |
| Less than $5,000 | 12 (1.0%) | 8 (2.7%) |
| $5,000 to $9,999 | 0 (0.0%) | 0 (0.0%) |
| $10,000 to $14,999 | 7 (0.6%) | 0 (0.0%) |
| $15,000 to $19,999 | 28 (2.3%) | 11 (3.7%) |
| $20,000 to $24,999 | 0 (0.0%) | 0 (0.0%) |
| $25,000 to $34,999 | 28 (2.3%) | 83 (27.8%) |
| $35,000 to $49,999 | 165 (13.7%) | 35 (11.7%) |
| $50,000 to $74,999 | 333 (27.6%) | 47 (15.7%) |
| $75,000 to $99,999 | 197 (16.3%) | 56 (18.7%) |
| $100,000 to $149,999 | 365 (30.3%) | 0 (0.0%) |
| $150,000 or more | 71 (5.9%) | 59 (19.7%) |
| Total | 1,206 (100.0%) | 299 (100.0%) |
Monthly Housing Cost Tiers in Grand Bay
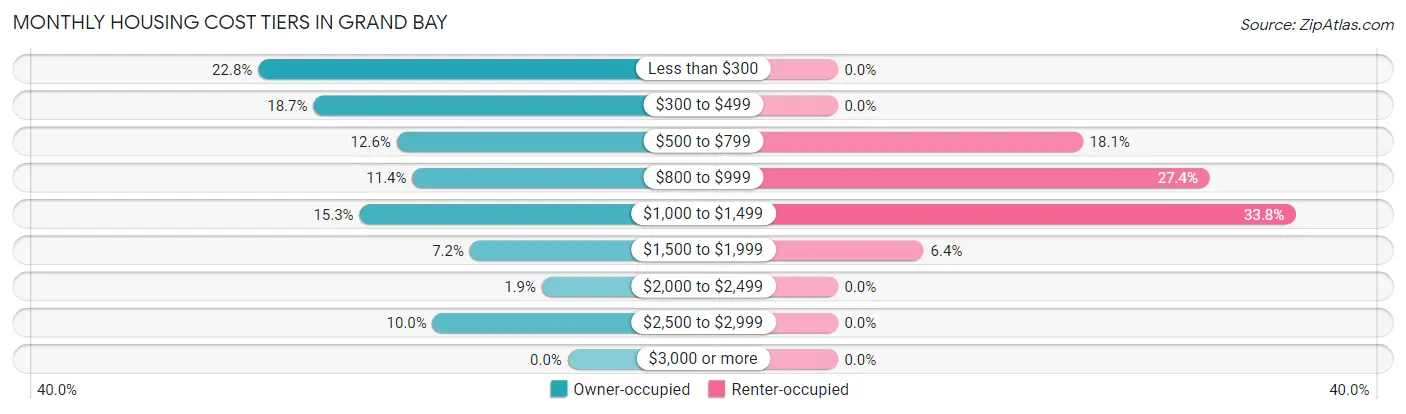
| Monthly Cost | Owner-occupied | Renter-occupied |
| Less than $300 | 275 (22.8%) | 0 (0.0%) |
| $300 to $499 | 226 (18.7%) | 0 (0.0%) |
| $500 to $799 | 152 (12.6%) | 54 (18.1%) |
| $800 to $999 | 138 (11.4%) | 82 (27.4%) |
| $1,000 to $1,499 | 185 (15.3%) | 101 (33.8%) |
| $1,500 to $1,999 | 87 (7.2%) | 19 (6.4%) |
| $2,000 to $2,499 | 23 (1.9%) | 0 (0.0%) |
| $2,500 to $2,999 | 120 (10.0%) | 0 (0.0%) |
| $3,000 or more | 0 (0.0%) | 0 (0.0%) |
| Total | 1,206 (100.0%) | 299 (100.0%) |
Physical Housing Characteristics in Grand Bay
Housing Structures in Grand Bay
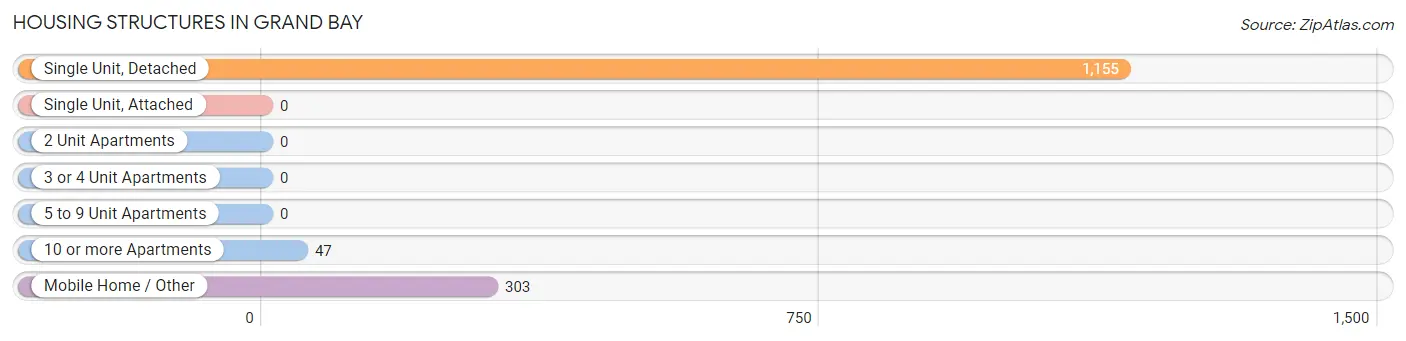
| Structure Type | # Housing Units | % Housing Units |
| Single Unit, Detached | 1,155 | 76.7% |
| Single Unit, Attached | 0 | 0.0% |
| 2 Unit Apartments | 0 | 0.0% |
| 3 or 4 Unit Apartments | 0 | 0.0% |
| 5 to 9 Unit Apartments | 0 | 0.0% |
| 10 or more Apartments | 47 | 3.1% |
| Mobile Home / Other | 303 | 20.1% |
| Total | 1,505 | 100.0% |
Housing Structures by Occupancy in Grand Bay
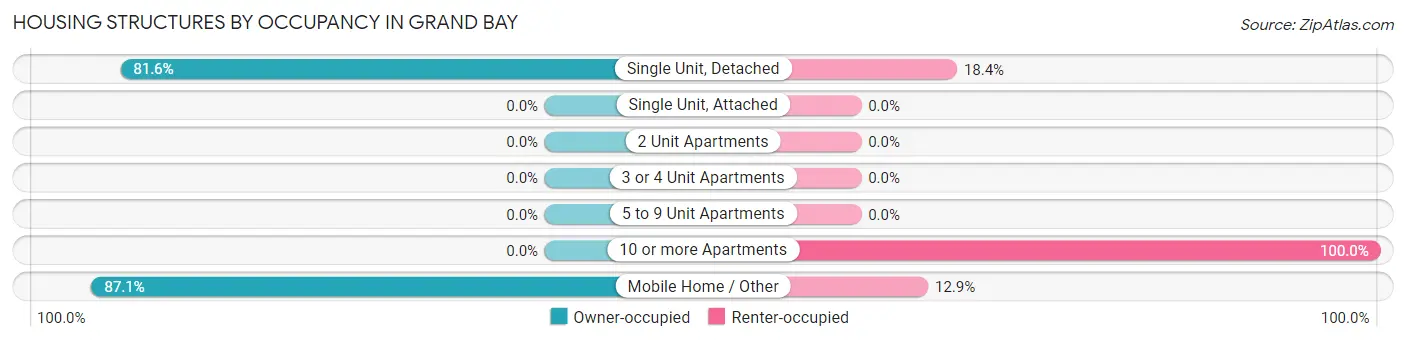
| Structure Type | Owner-occupied | Renter-occupied |
| Single Unit, Detached | 942 (81.6%) | 213 (18.4%) |
| Single Unit, Attached | 0 (0.0%) | 0 (0.0%) |
| 2 Unit Apartments | 0 (0.0%) | 0 (0.0%) |
| 3 or 4 Unit Apartments | 0 (0.0%) | 0 (0.0%) |
| 5 to 9 Unit Apartments | 0 (0.0%) | 0 (0.0%) |
| 10 or more Apartments | 0 (0.0%) | 47 (100.0%) |
| Mobile Home / Other | 264 (87.1%) | 39 (12.9%) |
| Total | 1,206 (80.1%) | 299 (19.9%) |
Housing Structures by Number of Rooms in Grand Bay
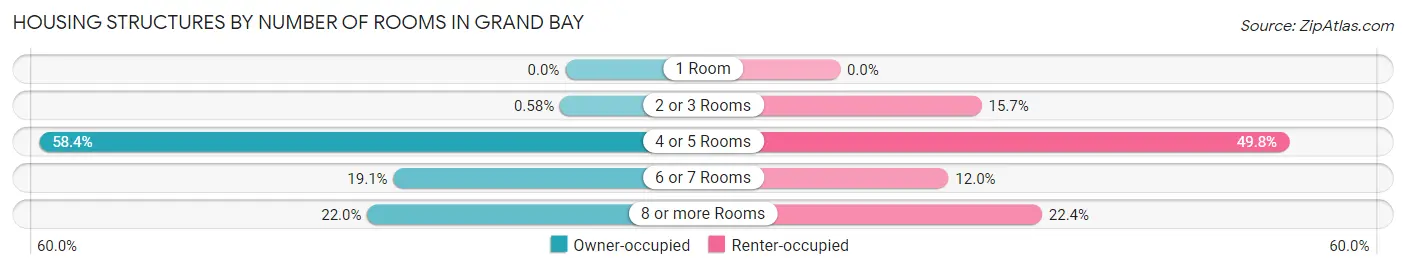
| Number of Rooms | Owner-occupied | Renter-occupied |
| 1 Room | 0 (0.0%) | 0 (0.0%) |
| 2 or 3 Rooms | 7 (0.6%) | 47 (15.7%) |
| 4 or 5 Rooms | 704 (58.4%) | 149 (49.8%) |
| 6 or 7 Rooms | 230 (19.1%) | 36 (12.0%) |
| 8 or more Rooms | 265 (22.0%) | 67 (22.4%) |
| Total | 1,206 (100.0%) | 299 (100.0%) |
Housing Structure by Heating Type in Grand Bay
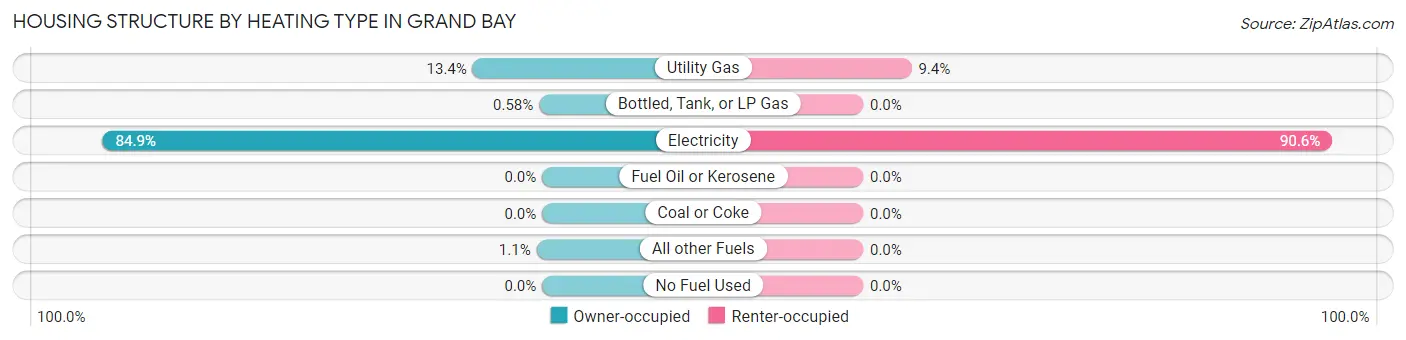
| Heating Type | Owner-occupied | Renter-occupied |
| Utility Gas | 162 (13.4%) | 28 (9.4%) |
| Bottled, Tank, or LP Gas | 7 (0.6%) | 0 (0.0%) |
| Electricity | 1,024 (84.9%) | 271 (90.6%) |
| Fuel Oil or Kerosene | 0 (0.0%) | 0 (0.0%) |
| Coal or Coke | 0 (0.0%) | 0 (0.0%) |
| All other Fuels | 13 (1.1%) | 0 (0.0%) |
| No Fuel Used | 0 (0.0%) | 0 (0.0%) |
| Total | 1,206 (100.0%) | 299 (100.0%) |
Household Vehicle Usage in Grand Bay
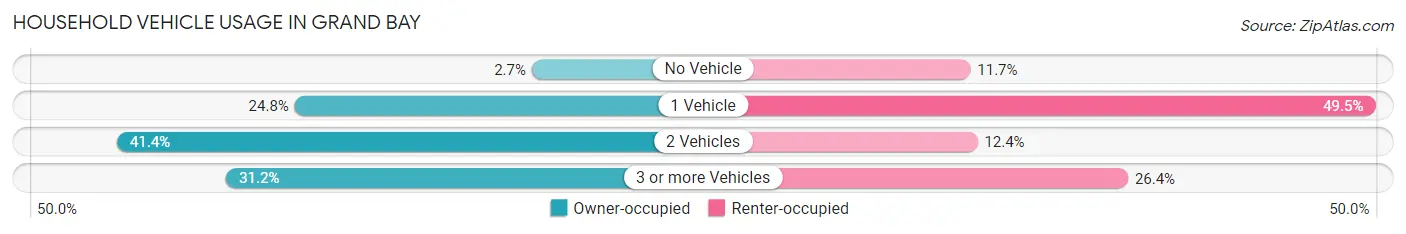
| Vehicles per Household | Owner-occupied | Renter-occupied |
| No Vehicle | 32 (2.6%) | 35 (11.7%) |
| 1 Vehicle | 299 (24.8%) | 148 (49.5%) |
| 2 Vehicles | 499 (41.4%) | 37 (12.4%) |
| 3 or more Vehicles | 376 (31.2%) | 79 (26.4%) |
| Total | 1,206 (100.0%) | 299 (100.0%) |
Real Estate & Mortgages in Grand Bay
Real Estate and Mortgage Overview in Grand Bay
| Characteristic | Without Mortgage | With Mortgage |
| Housing Units | 571 | 635 |
| Median Property Value | - | - |
| Median Household Income | $56,074 | $71 |
| Monthly Housing Costs | - | - |
| Real Estate Taxes | $318 | $33 |
Property Value by Mortgage Status in Grand Bay
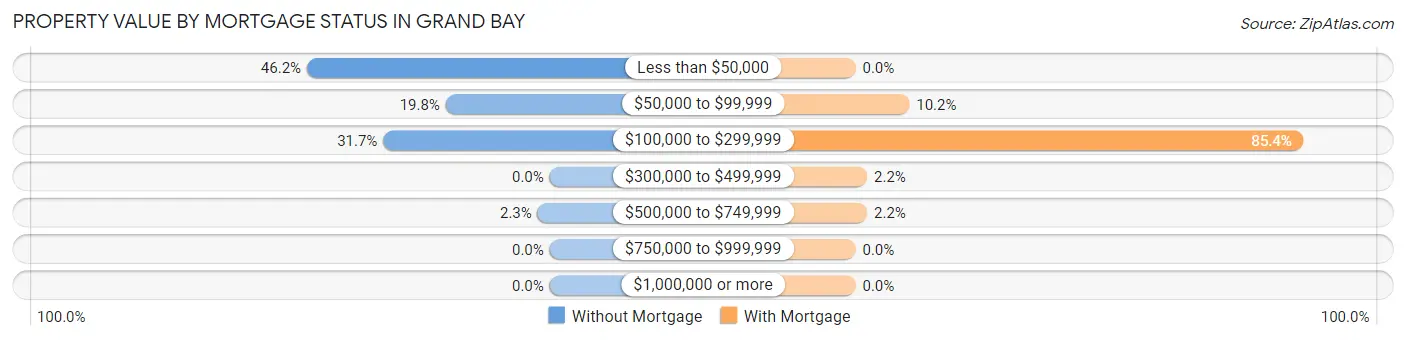
| Property Value | Without Mortgage | With Mortgage |
| Less than $50,000 | 264 (46.2%) | 0 (0.0%) |
| $50,000 to $99,999 | 113 (19.8%) | 65 (10.2%) |
| $100,000 to $299,999 | 181 (31.7%) | 542 (85.4%) |
| $300,000 to $499,999 | 0 (0.0%) | 14 (2.2%) |
| $500,000 to $749,999 | 13 (2.3%) | 14 (2.2%) |
| $750,000 to $999,999 | 0 (0.0%) | 0 (0.0%) |
| $1,000,000 or more | 0 (0.0%) | 0 (0.0%) |
| Total | 571 (100.0%) | 635 (100.0%) |
Household Income by Mortgage Status in Grand Bay
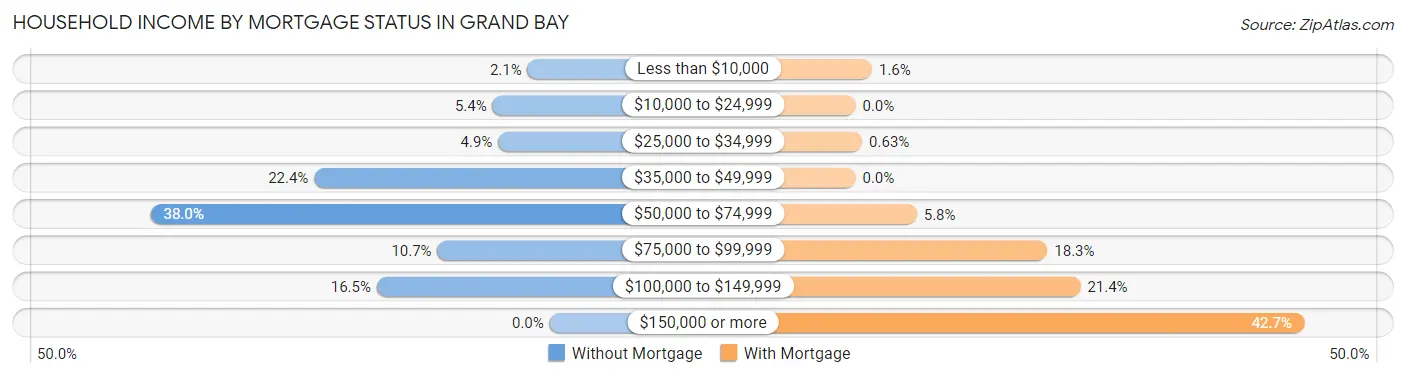
| Household Income | Without Mortgage | With Mortgage |
| Less than $10,000 | 12 (2.1%) | 10 (1.6%) |
| $10,000 to $24,999 | 31 (5.4%) | 0 (0.0%) |
| $25,000 to $34,999 | 28 (4.9%) | 4 (0.6%) |
| $35,000 to $49,999 | 128 (22.4%) | 0 (0.0%) |
| $50,000 to $74,999 | 217 (38.0%) | 37 (5.8%) |
| $75,000 to $99,999 | 61 (10.7%) | 116 (18.3%) |
| $100,000 to $149,999 | 94 (16.5%) | 136 (21.4%) |
| $150,000 or more | 0 (0.0%) | 271 (42.7%) |
| Total | 571 (100.0%) | 635 (100.0%) |
Property Value to Household Income Ratio in Grand Bay
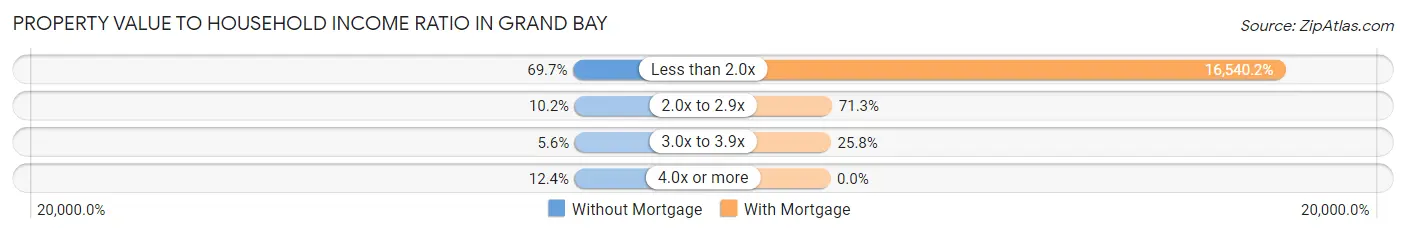
| Value-to-Income Ratio | Without Mortgage | With Mortgage |
| Less than 2.0x | 398 (69.7%) | 105,030 (16,540.2%) |
| 2.0x to 2.9x | 58 (10.2%) | 453 (71.3%) |
| 3.0x to 3.9x | 32 (5.6%) | 164 (25.8%) |
| 4.0x or more | 71 (12.4%) | 0 (0.0%) |
| Total | 571 (100.0%) | 635 (100.0%) |
Real Estate Taxes by Mortgage Status in Grand Bay
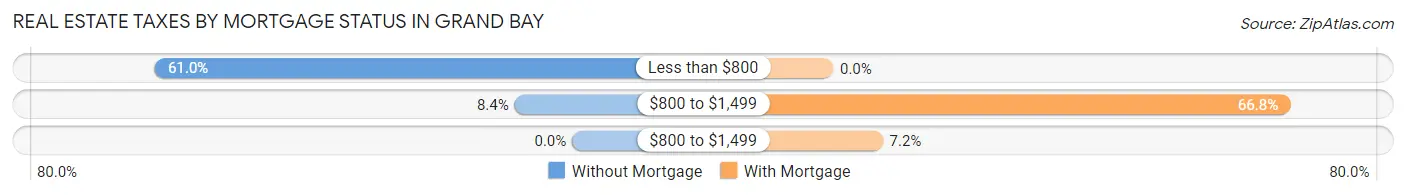
| Property Taxes | Without Mortgage | With Mortgage |
| Less than $800 | 348 (61.0%) | 0 (0.0%) |
| $800 to $1,499 | 48 (8.4%) | 424 (66.8%) |
| $800 to $1,499 | 0 (0.0%) | 46 (7.2%) |
| Total | 571 (100.0%) | 635 (100.0%) |
Health & Disability in Grand Bay
Health Insurance Coverage by Age in Grand Bay
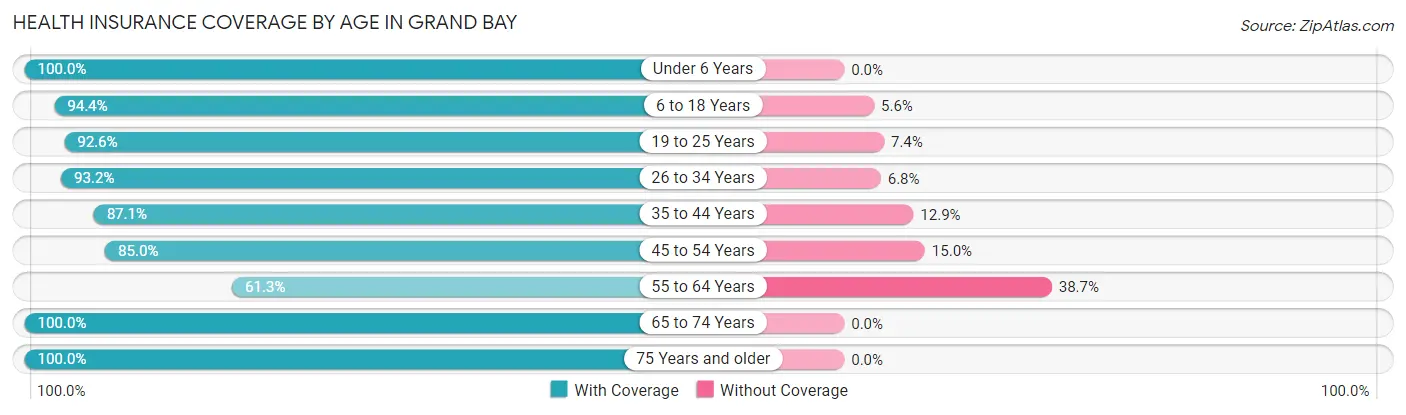
| Age Bracket | With Coverage | Without Coverage |
| Under 6 Years | 157 (100.0%) | 0 (0.0%) |
| 6 to 18 Years | 696 (94.4%) | 41 (5.6%) |
| 19 to 25 Years | 125 (92.6%) | 10 (7.4%) |
| 26 to 34 Years | 329 (93.2%) | 24 (6.8%) |
| 35 to 44 Years | 480 (87.1%) | 71 (12.9%) |
| 45 to 54 Years | 328 (85.0%) | 58 (15.0%) |
| 55 to 64 Years | 347 (61.3%) | 219 (38.7%) |
| 65 to 74 Years | 434 (100.0%) | 0 (0.0%) |
| 75 Years and older | 182 (100.0%) | 0 (0.0%) |
| Total | 3,078 (87.9%) | 423 (12.1%) |
Health Insurance Coverage by Citizenship Status in Grand Bay
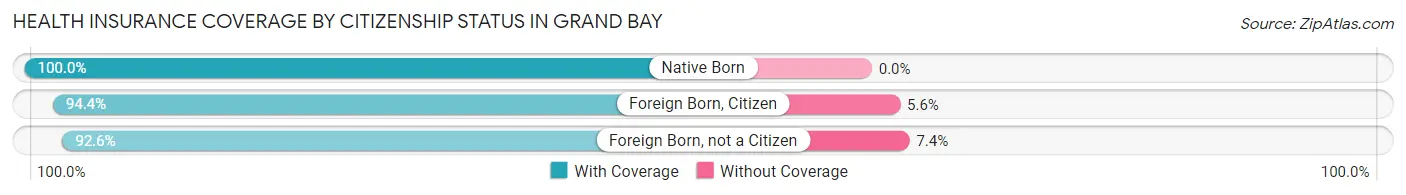
| Citizenship Status | With Coverage | Without Coverage |
| Native Born | 157 (100.0%) | 0 (0.0%) |
| Foreign Born, Citizen | 696 (94.4%) | 41 (5.6%) |
| Foreign Born, not a Citizen | 125 (92.6%) | 10 (7.4%) |
Health Insurance Coverage by Household Income in Grand Bay
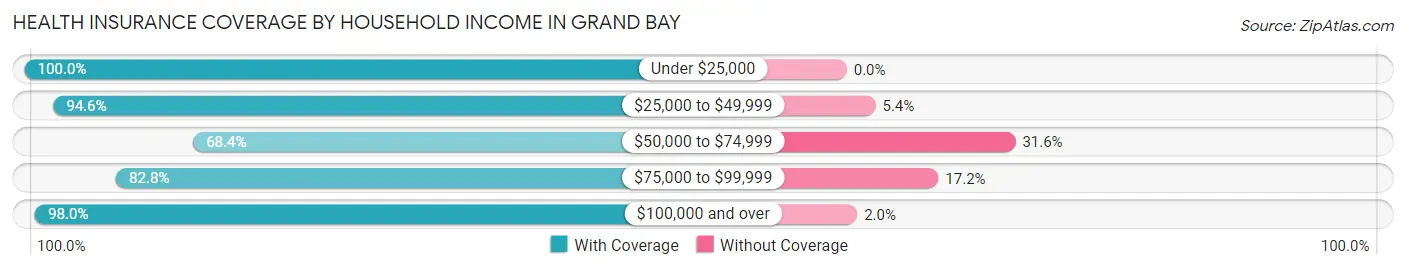
| Household Income | With Coverage | Without Coverage |
| Under $25,000 | 89 (100.0%) | 0 (0.0%) |
| $25,000 to $49,999 | 615 (94.6%) | 35 (5.4%) |
| $50,000 to $74,999 | 474 (68.4%) | 219 (31.6%) |
| $75,000 to $99,999 | 700 (82.8%) | 145 (17.2%) |
| $100,000 and over | 1,200 (98.0%) | 24 (2.0%) |
Public vs Private Health Insurance Coverage by Age in Grand Bay
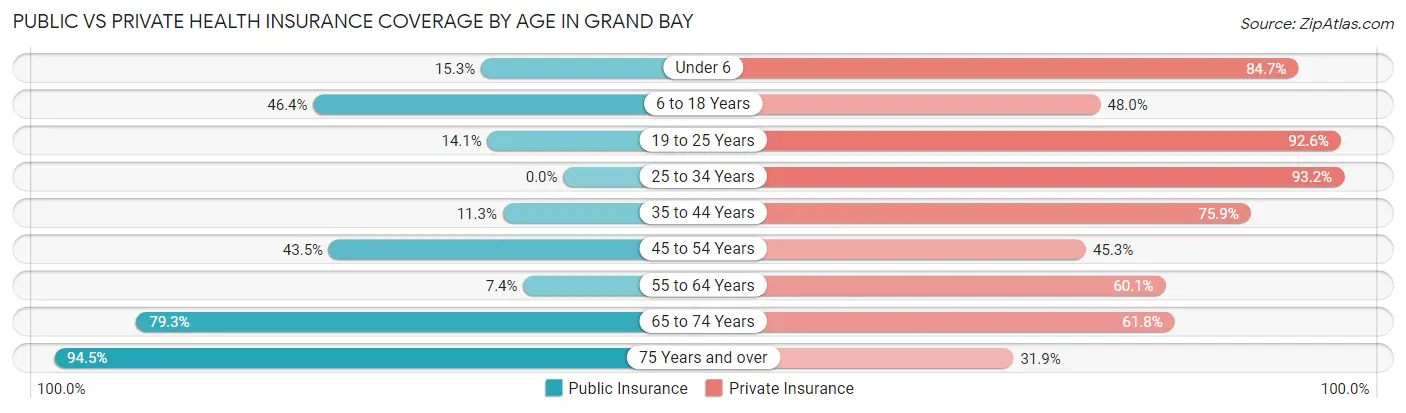
| Age Bracket | Public Insurance | Private Insurance |
| Under 6 | 24 (15.3%) | 133 (84.7%) |
| 6 to 18 Years | 342 (46.4%) | 354 (48.0%) |
| 19 to 25 Years | 19 (14.1%) | 125 (92.6%) |
| 25 to 34 Years | 0 (0.0%) | 329 (93.2%) |
| 35 to 44 Years | 62 (11.3%) | 418 (75.9%) |
| 45 to 54 Years | 168 (43.5%) | 175 (45.3%) |
| 55 to 64 Years | 42 (7.4%) | 340 (60.1%) |
| 65 to 74 Years | 344 (79.3%) | 268 (61.8%) |
| 75 Years and over | 172 (94.5%) | 58 (31.9%) |
| Total | 1,173 (33.5%) | 2,200 (62.8%) |
Disability Status by Sex by Age in Grand Bay
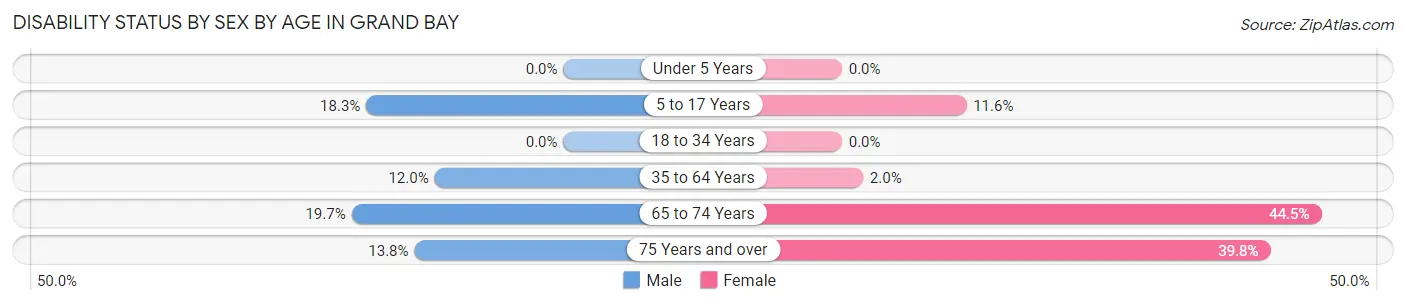
| Age Bracket | Male | Female |
| Under 5 Years | 0 (0.0%) | 0 (0.0%) |
| 5 to 17 Years | 82 (18.3%) | 32 (11.6%) |
| 18 to 34 Years | 0 (0.0%) | 0 (0.0%) |
| 35 to 64 Years | 88 (12.0%) | 15 (2.0%) |
| 65 to 74 Years | 46 (19.7%) | 89 (44.5%) |
| 75 Years and over | 13 (13.8%) | 35 (39.8%) |
Disability Class by Sex by Age in Grand Bay
Disability Class: Hearing Difficulty
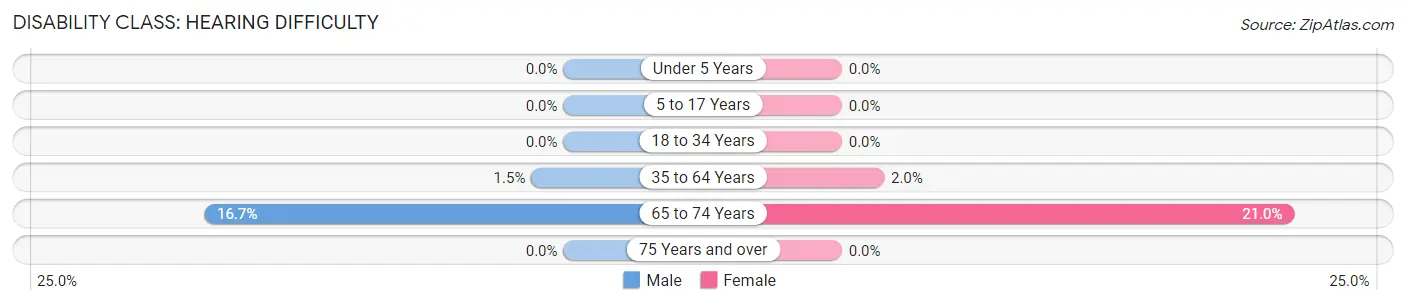
| Age Bracket | Male | Female |
| Under 5 Years | 0 (0.0%) | 0 (0.0%) |
| 5 to 17 Years | 0 (0.0%) | 0 (0.0%) |
| 18 to 34 Years | 0 (0.0%) | 0 (0.0%) |
| 35 to 64 Years | 11 (1.5%) | 15 (2.0%) |
| 65 to 74 Years | 39 (16.7%) | 42 (21.0%) |
| 75 Years and over | 0 (0.0%) | 0 (0.0%) |
Disability Class: Vision Difficulty
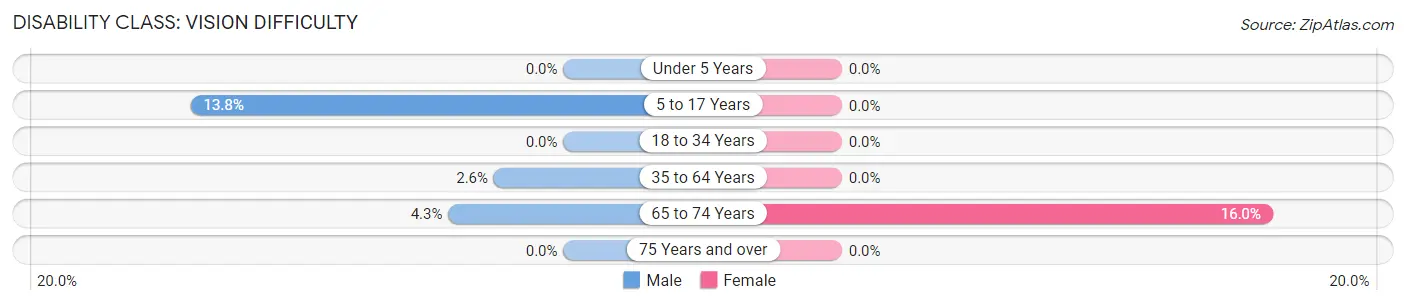
| Age Bracket | Male | Female |
| Under 5 Years | 0 (0.0%) | 0 (0.0%) |
| 5 to 17 Years | 62 (13.8%) | 0 (0.0%) |
| 18 to 34 Years | 0 (0.0%) | 0 (0.0%) |
| 35 to 64 Years | 19 (2.6%) | 0 (0.0%) |
| 65 to 74 Years | 10 (4.3%) | 32 (16.0%) |
| 75 Years and over | 0 (0.0%) | 0 (0.0%) |
Disability Class: Cognitive Difficulty
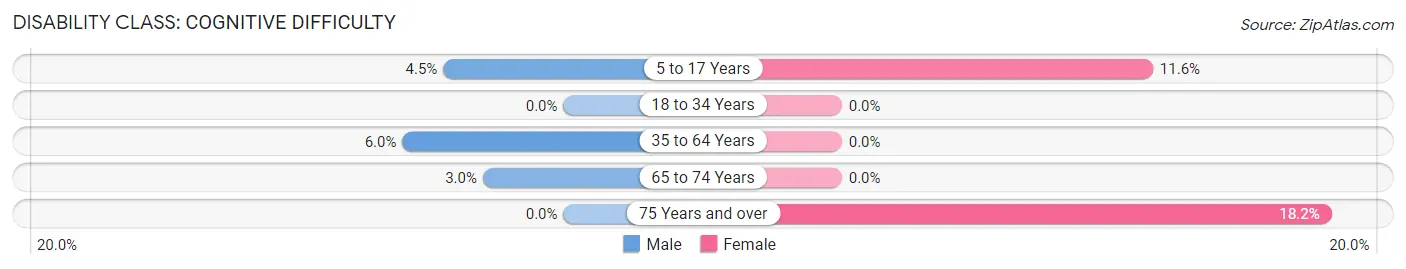
| Age Bracket | Male | Female |
| 5 to 17 Years | 20 (4.5%) | 32 (11.6%) |
| 18 to 34 Years | 0 (0.0%) | 0 (0.0%) |
| 35 to 64 Years | 44 (6.0%) | 0 (0.0%) |
| 65 to 74 Years | 7 (3.0%) | 0 (0.0%) |
| 75 Years and over | 0 (0.0%) | 16 (18.2%) |
Disability Class: Ambulatory Difficulty
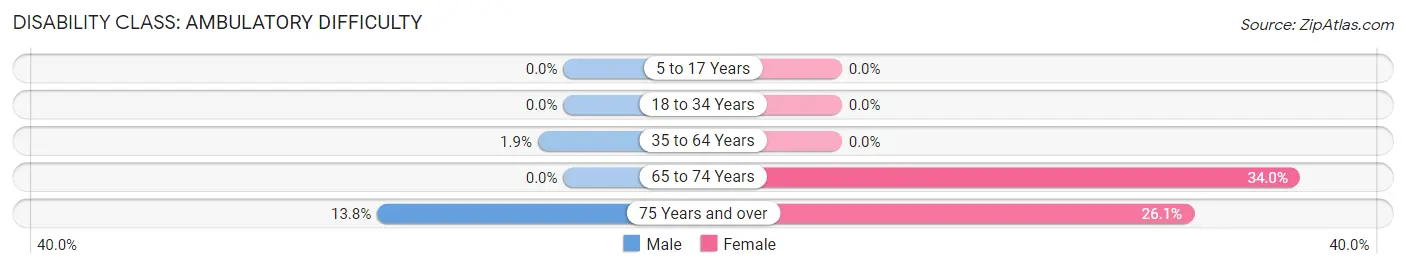
| Age Bracket | Male | Female |
| 5 to 17 Years | 0 (0.0%) | 0 (0.0%) |
| 18 to 34 Years | 0 (0.0%) | 0 (0.0%) |
| 35 to 64 Years | 14 (1.9%) | 0 (0.0%) |
| 65 to 74 Years | 0 (0.0%) | 68 (34.0%) |
| 75 Years and over | 13 (13.8%) | 23 (26.1%) |
Disability Class: Self-Care Difficulty
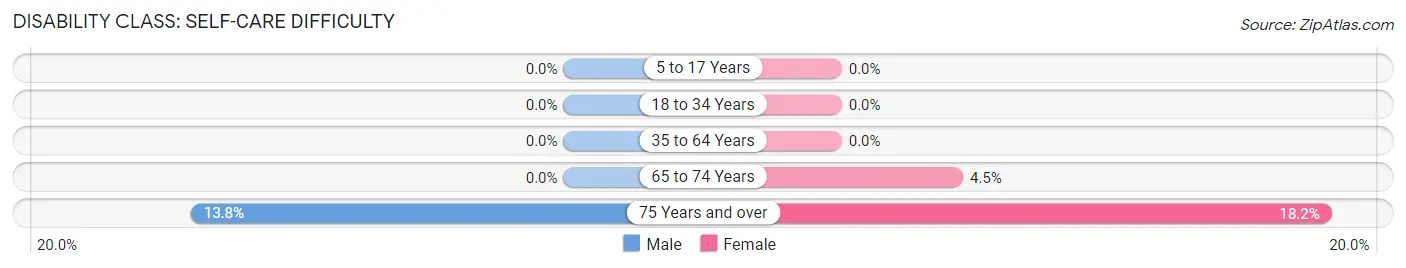
| Age Bracket | Male | Female |
| 5 to 17 Years | 0 (0.0%) | 0 (0.0%) |
| 18 to 34 Years | 0 (0.0%) | 0 (0.0%) |
| 35 to 64 Years | 0 (0.0%) | 0 (0.0%) |
| 65 to 74 Years | 0 (0.0%) | 9 (4.5%) |
| 75 Years and over | 13 (13.8%) | 16 (18.2%) |
Technology Access in Grand Bay
Computing Device Access in Grand Bay
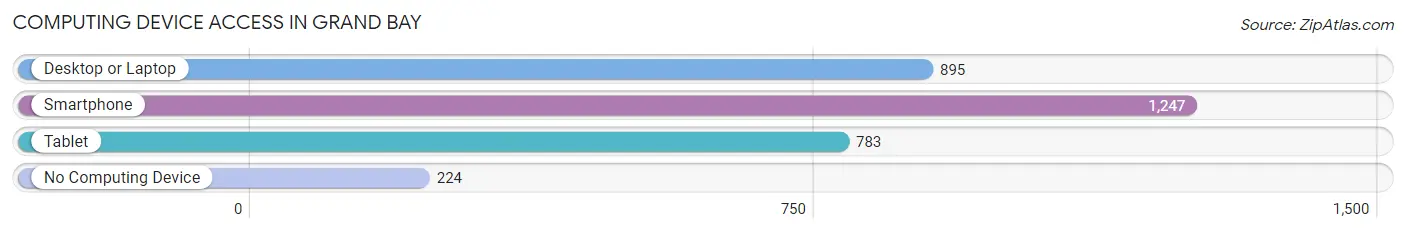
| Device Type | # Households | % Households |
| Desktop or Laptop | 895 | 59.5% |
| Smartphone | 1,247 | 82.9% |
| Tablet | 783 | 52.0% |
| No Computing Device | 224 | 14.9% |
| Total | 1,505 | 100.0% |
Internet Access in Grand Bay
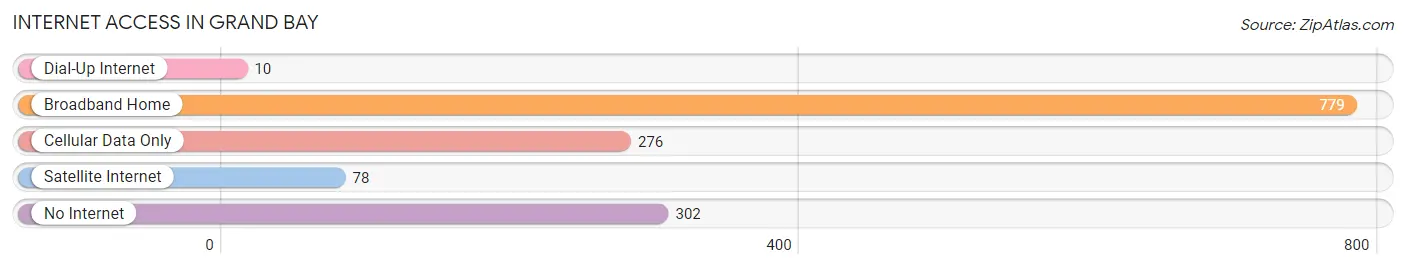
| Internet Type | # Households | % Households |
| Dial-Up Internet | 10 | 0.7% |
| Broadband Home | 779 | 51.8% |
| Cellular Data Only | 276 | 18.3% |
| Satellite Internet | 78 | 5.2% |
| No Internet | 302 | 20.1% |
| Total | 1,505 | 100.0% |
Grand Bay Summary
Introduction
Grand Bay is a small town located in Mobile County, Alabama. It is situated on the western shore of Mobile Bay, approximately 20 miles north of Mobile. The town has a population of approximately 2,000 people and is part of the Mobile metropolitan area. Grand Bay is known for its rural charm and its proximity to the Gulf of Mexico.
History
Grand Bay was first settled in the early 1800s by French settlers. The town was originally known as Grand Bayou, and was a small fishing village. In 1819, the town was officially incorporated as Grand Bay. The town was named after the nearby bay, which was named by French explorer Pierre Le Moyne d'Iberville.
In the late 1800s, Grand Bay began to grow as a port town. The town was a major shipping hub for the lumber industry, and was also home to several sawmills. The town also had a thriving fishing industry, and was home to several seafood processing plants.
In the early 1900s, Grand Bay began to experience a decline in its economy. The lumber industry began to decline, and the seafood processing plants began to close. The town also experienced a population decline, as many of its residents moved away in search of better economic opportunities.
Geography
Grand Bay is located in Mobile County, Alabama. The town is situated on the western shore of Mobile Bay, approximately 20 miles north of Mobile. The town is bordered by the cities of Bayou La Batre and Coden to the south, and the city of Irvington to the north.
The town is located in a humid subtropical climate zone, and experiences hot, humid summers and mild winters. The average annual temperature is around 70 degrees Fahrenheit, and the average annual precipitation is around 60 inches.
Economy
Grand Bay's economy is largely based on the seafood industry. The town is home to several seafood processing plants, and is a major hub for the seafood industry in the region. The town is also home to several boatyards, which build and repair boats for the fishing industry.
The town is also home to several small businesses, including restaurants, retail stores, and service providers. The town is also home to a small airport, which serves the local area.
Demographics
As of the 2010 census, Grand Bay had a population of 2,000 people. The racial makeup of the town was 97.5% White, 0.5% African American, 0.5% Native American, 0.5% Asian, and 0.5% from other races. The median household income was $37,500, and the median family income was $45,000.
Conclusion
Grand Bay is a small town located in Mobile County, Alabama. The town has a population of approximately 2,000 people and is part of the Mobile metropolitan area. Grand Bay is known for its rural charm and its proximity to the Gulf of Mexico. The town's economy is largely based on the seafood industry, and the town is home to several seafood processing plants and boatyards. The town is also home to several small businesses, including restaurants, retail stores, and service providers. The town has a diverse population, with a median household income of $37,500 and a median family income of $45,000.
Common Questions
What is Per Capita Income in Grand Bay?
Per Capita income in Grand Bay is $35,288.
What is the Median Family Income in Grand Bay?
Median Family Income in Grand Bay is $82,328.
What is the Median Household income in Grand Bay?
Median Household Income in Grand Bay is $72,125.
What is Income or Wage Gap in Grand Bay?
Income or Wage Gap in Grand Bay is 23.1%.
Women in Grand Bay earn 76.9 cents for every dollar earned by a man.
What is Inequality or Gini Index in Grand Bay?
Inequality or Gini Index in Grand Bay is 0.31.
What is the Total Population of Grand Bay?
Total Population of Grand Bay is 3,607.
What is the Total Male Population of Grand Bay?
Total Male Population of Grand Bay is 1,824.
What is the Total Female Population of Grand Bay?
Total Female Population of Grand Bay is 1,783.
What is the Ratio of Males per 100 Females in Grand Bay?
There are 102.30 Males per 100 Females in Grand Bay.
What is the Ratio of Females per 100 Males in Grand Bay?
There are 97.75 Females per 100 Males in Grand Bay.
What is the Median Population Age in Grand Bay?
Median Population Age in Grand Bay is 41.3 Years.
What is the Average Family Size in Grand Bay
Average Family Size in Grand Bay is 3.0 People.
What is the Average Household Size in Grand Bay
Average Household Size in Grand Bay is 2.3 People.
How Large is the Labor Force in Grand Bay?
There are 1,828 People in the Labor Forcein in Grand Bay.
What is the Percentage of People in the Labor Force in Grand Bay?
65.6% of People are in the Labor Force in Grand Bay.
What is the Unemployment Rate in Grand Bay?
Unemployment Rate in Grand Bay is 4.4%.