Goodwater, AL Map & Demographics
Goodwater Map
Goodwater Overview
$23,412
PER CAPITA INCOME
$43,750
AVG FAMILY INCOME
$35,724
AVG HOUSEHOLD INCOME
43.0%
WAGE / INCOME GAP [ % ]
57.0¢/ $1
WAGE / INCOME GAP [ $ ]
0.39
INEQUALITY / GINI INDEX
1,117
TOTAL POPULATION
562
MALE POPULATION
555
FEMALE POPULATION
101.26
MALES / 100 FEMALES
98.75
FEMALES / 100 MALES
50.7
MEDIAN AGE
2.8
AVG FAMILY SIZE
2.2
AVG HOUSEHOLD SIZE
321
LABOR FORCE [ PEOPLE ]
37.2%
PERCENT IN LABOR FORCE
2.9%
UNEMPLOYMENT RATE
Goodwater Zip Codes
Income in Goodwater
Income Overview in Goodwater
Per Capita Income in Goodwater is $23,412, while median incomes of families and households are $43,750 and $35,724 respectively.
| Characteristic | Number | Measure |
| Per Capita Income | 1,117 | $23,412 |
| Median Family Income | 294 | $43,750 |
| Mean Family Income | 294 | $47,476 |
| Median Household Income | 481 | $35,724 |
| Mean Household Income | 481 | $43,511 |
| Income Deficit | 294 | $0 |
| Wage / Income Gap (%) | 1,117 | 42.98% |
| Wage / Income Gap ($) | 1,117 | 57.02¢ per $1 |
| Gini / Inequality Index | 1,117 | 0.39 |
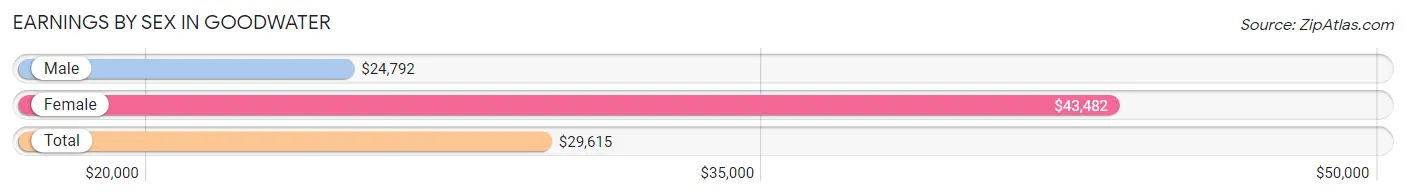
Earnings by Sex in Goodwater
Average Earnings in Goodwater are $29,615, $24,792 for men and $43,482 for women, a difference of 43.0%.
| Sex | Number | Average Earnings |
| Male | 175 (54.3%) | $24,792 |
| Female | 147 (45.7%) | $43,482 |
| Total | 322 (100.0%) | $29,615 |
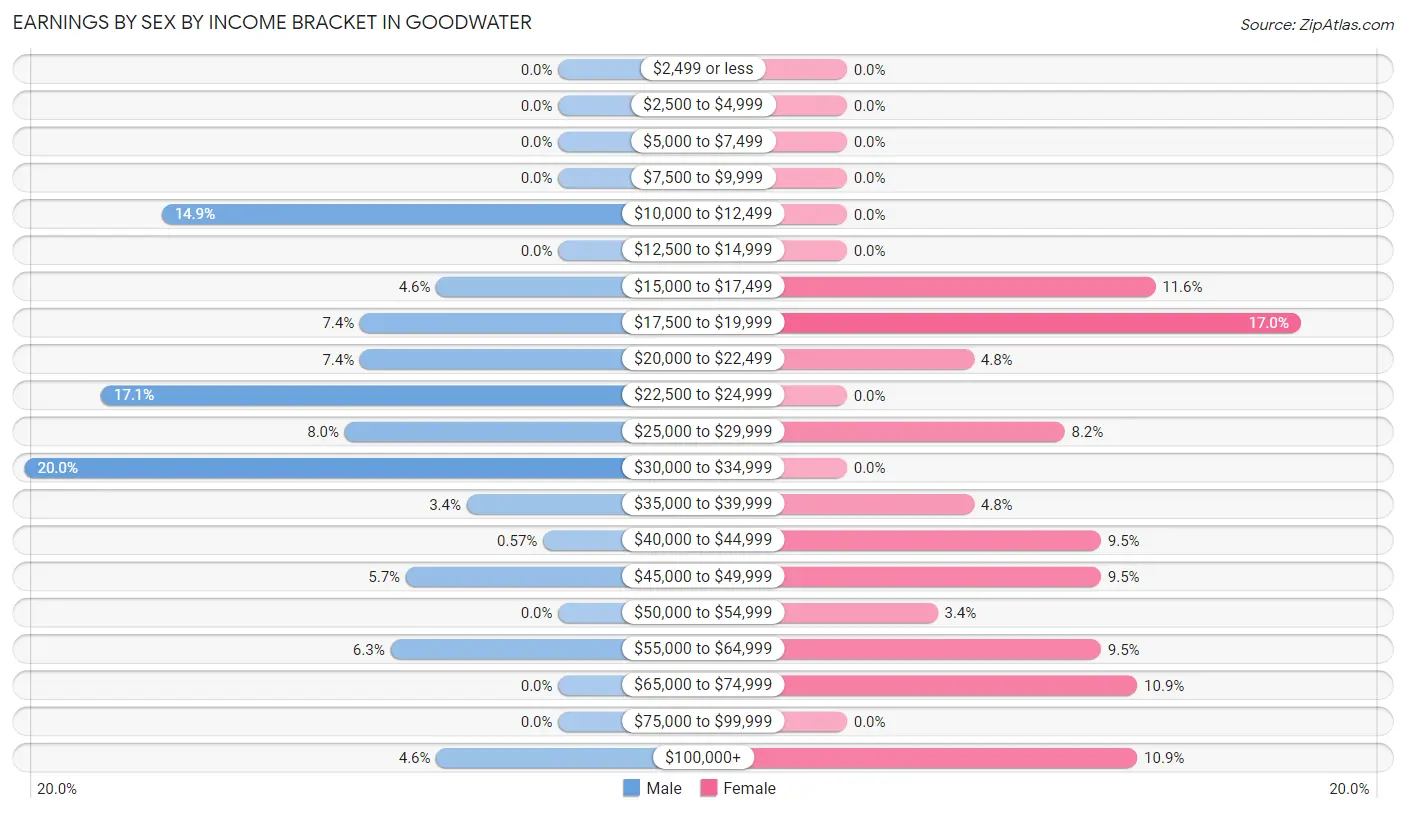
Earnings by Sex by Income Bracket in Goodwater
The most common earnings brackets in Goodwater are $30,000 to $34,999 for men (35 | 20.0%) and $17,500 to $19,999 for women (25 | 17.0%).
| Income | Male | Female |
| $2,499 or less | 0 (0.0%) | 0 (0.0%) |
| $2,500 to $4,999 | 0 (0.0%) | 0 (0.0%) |
| $5,000 to $7,499 | 0 (0.0%) | 0 (0.0%) |
| $7,500 to $9,999 | 0 (0.0%) | 0 (0.0%) |
| $10,000 to $12,499 | 26 (14.9%) | 0 (0.0%) |
| $12,500 to $14,999 | 0 (0.0%) | 0 (0.0%) |
| $15,000 to $17,499 | 8 (4.6%) | 17 (11.6%) |
| $17,500 to $19,999 | 13 (7.4%) | 25 (17.0%) |
| $20,000 to $22,499 | 13 (7.4%) | 7 (4.8%) |
| $22,500 to $24,999 | 30 (17.1%) | 0 (0.0%) |
| $25,000 to $29,999 | 14 (8.0%) | 12 (8.2%) |
| $30,000 to $34,999 | 35 (20.0%) | 0 (0.0%) |
| $35,000 to $39,999 | 6 (3.4%) | 7 (4.8%) |
| $40,000 to $44,999 | 1 (0.6%) | 14 (9.5%) |
| $45,000 to $49,999 | 10 (5.7%) | 14 (9.5%) |
| $50,000 to $54,999 | 0 (0.0%) | 5 (3.4%) |
| $55,000 to $64,999 | 11 (6.3%) | 14 (9.5%) |
| $65,000 to $74,999 | 0 (0.0%) | 16 (10.9%) |
| $75,000 to $99,999 | 0 (0.0%) | 0 (0.0%) |
| $100,000+ | 8 (4.6%) | 16 (10.9%) |
| Total | 175 (100.0%) | 147 (100.0%) |
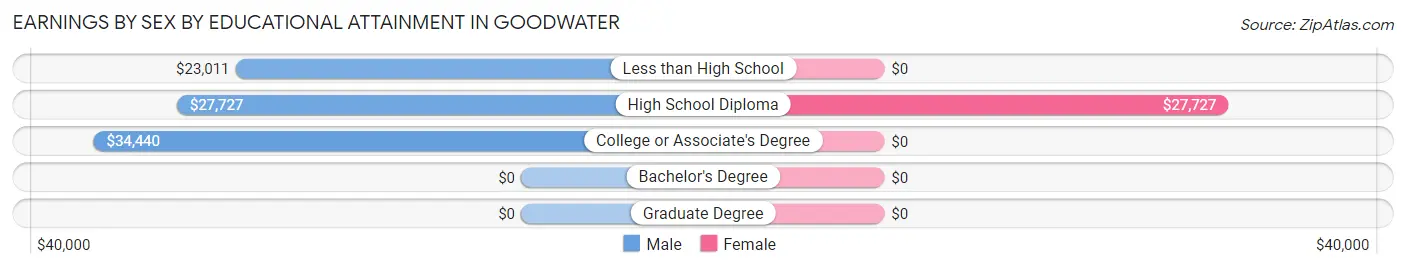
Earnings by Sex by Educational Attainment in Goodwater
Average earnings in Goodwater are $28,839 for men and $44,375 for women, a difference of 35.0%. Men with an educational attainment of college or associate's degree enjoy the highest average annual earnings of $34,440, while those with less than high school education earn the least with $23,011. Women with an educational attainment of high school diploma earn the most with the average annual earnings of $27,727, while those with high school diploma education have the smallest earnings of $27,727.
| Educational Attainment | Male Income | Female Income |
| Less than High School | $23,011 | $0 |
| High School Diploma | $27,727 | $27,727 |
| College or Associate's Degree | $34,440 | $0 |
| Bachelor's Degree | - | - |
| Graduate Degree | - | - |
| Total | $28,839 | $44,375 |
Family Income in Goodwater
Family Income Brackets in Goodwater
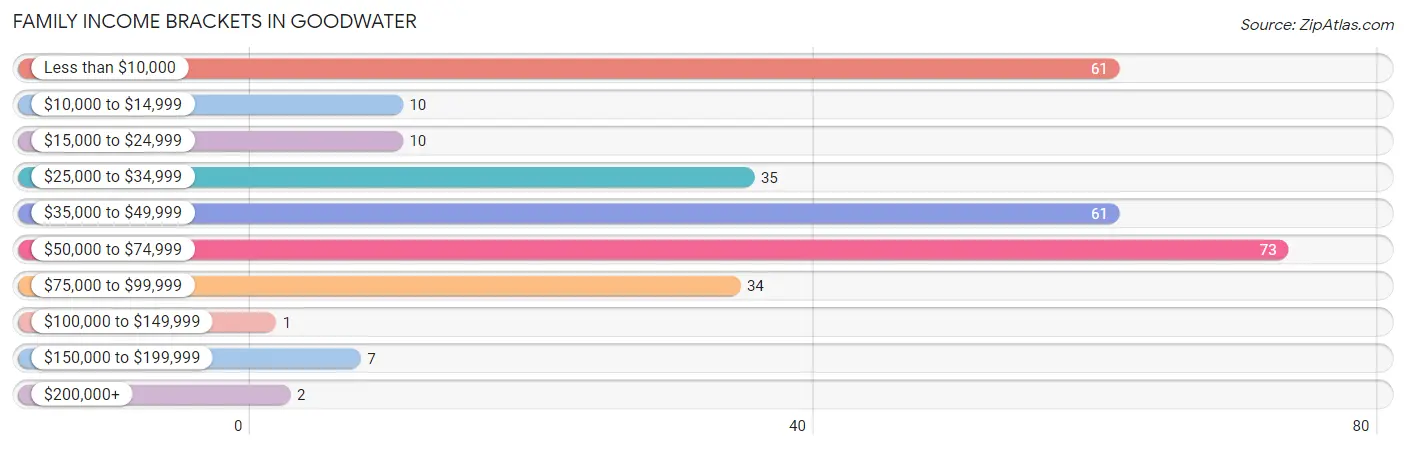
According to the Goodwater family income data, there are 73 families falling into the $50,000 to $74,999 income range, which is the most common income bracket and makes up 24.8% of all families. Conversely, the $100,000 to $149,999 income bracket is the least frequent group with only 1 families (0.3%) belonging to this category.
| Income Bracket | # Families | % Families |
| Less than $10,000 | 61 | 20.7% |
| $10,000 to $14,999 | 10 | 3.4% |
| $15,000 to $24,999 | 10 | 3.4% |
| $25,000 to $34,999 | 35 | 11.9% |
| $35,000 to $49,999 | 61 | 20.7% |
| $50,000 to $74,999 | 73 | 24.8% |
| $75,000 to $99,999 | 34 | 11.6% |
| $100,000 to $149,999 | 1 | 0.3% |
| $150,000 to $199,999 | 7 | 2.4% |
| $200,000+ | 2 | 0.7% |
Family Income by Famaliy Size in Goodwater
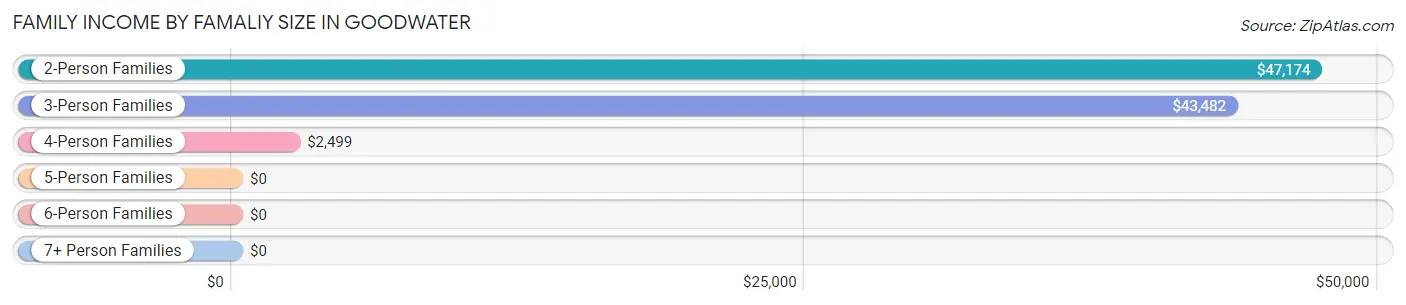
2-person families (178 | 60.5%) account for the highest median family income in Goodwater with $47,174 per family, while 2-person families (178 | 60.5%) have the highest median income of $23,587 per family member.
| Income Bracket | # Families | Median Income |
| 2-Person Families | 178 (60.5%) | $47,174 |
| 3-Person Families | 31 (10.5%) | $43,482 |
| 4-Person Families | 77 (26.2%) | $2,499 |
| 5-Person Families | 8 (2.7%) | $0 |
| 6-Person Families | 0 (0.0%) | $0 |
| 7+ Person Families | 0 (0.0%) | $0 |
| Total | 294 (100.0%) | $43,750 |
Family Income by Number of Earners in Goodwater
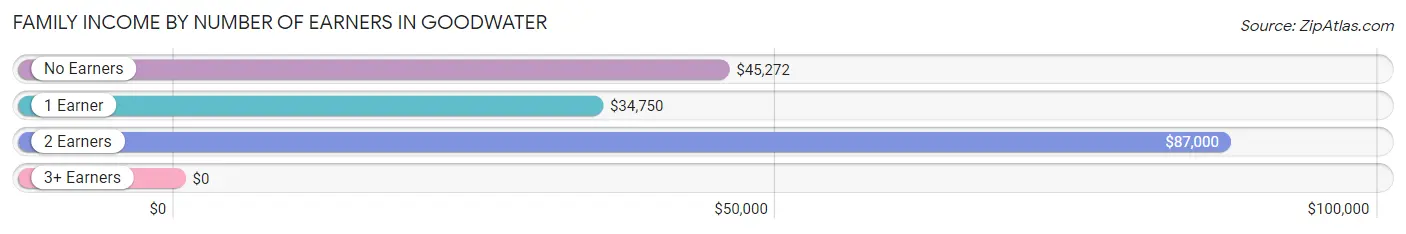
| Number of Earners | # Families | Median Income |
| No Earners | 169 (57.5%) | $45,272 |
| 1 Earner | 85 (28.9%) | $34,750 |
| 2 Earners | 32 (10.9%) | $87,000 |
| 3+ Earners | 8 (2.7%) | $0 |
| Total | 294 (100.0%) | $43,750 |
Household Income in Goodwater
Household Income Brackets in Goodwater
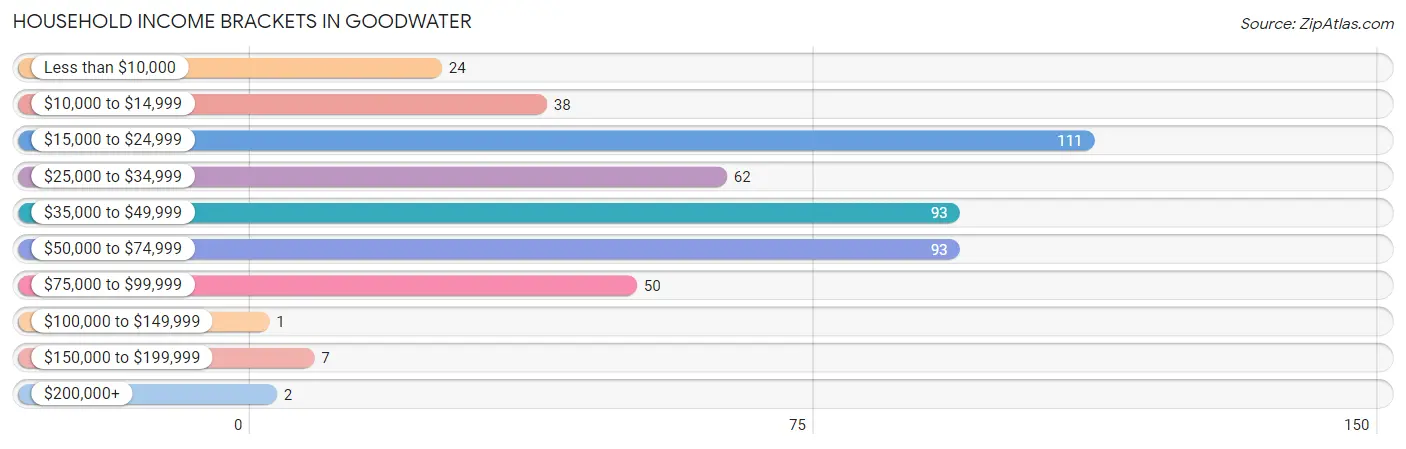
With 111 households falling in the category, the $15,000 to $24,999 income range is the most frequent in Goodwater, accounting for 23.1% of all households. In contrast, only 1 households (0.2%) fall into the $100,000 to $149,999 income bracket, making it the least populous group.
| Income Bracket | # Households | % Households |
| Less than $10,000 | 24 | 5.0% |
| $10,000 to $14,999 | 38 | 7.9% |
| $15,000 to $24,999 | 111 | 23.1% |
| $25,000 to $34,999 | 62 | 12.9% |
| $35,000 to $49,999 | 93 | 19.3% |
| $50,000 to $74,999 | 93 | 19.3% |
| $75,000 to $99,999 | 50 | 10.4% |
| $100,000 to $149,999 | 1 | 0.2% |
| $150,000 to $199,999 | 7 | 1.5% |
| $200,000+ | 2 | 0.4% |
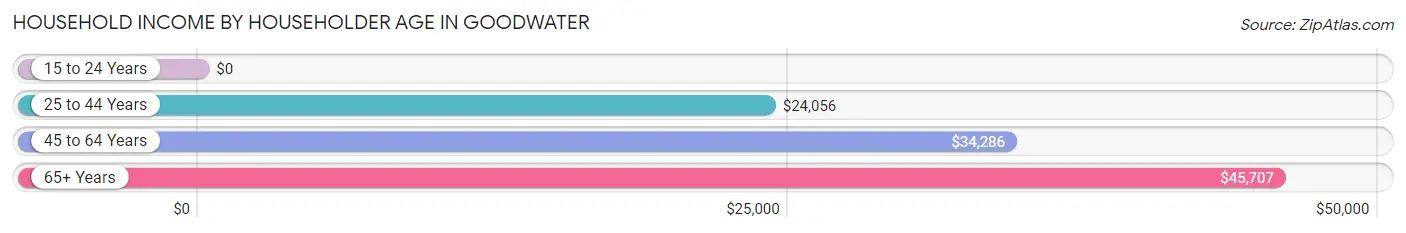
Household Income by Householder Age in Goodwater
The median household income in Goodwater is $35,724, with the highest median household income of $45,707 found in the 65+ years age bracket for the primary householder. A total of 183 households (38.1%) fall into this category. Meanwhile, the 15 to 24 years age bracket for the primary householder has the lowest median household income of $0, with 17 households (3.5%) in this group.
| Income Bracket | # Households | Median Income |
| 15 to 24 Years | 17 (3.5%) | $0 |
| 25 to 44 Years | 85 (17.7%) | $24,056 |
| 45 to 64 Years | 196 (40.7%) | $34,286 |
| 65+ Years | 183 (38.1%) | $45,707 |
| Total | 481 (100.0%) | $35,724 |
Poverty in Goodwater
Income Below Poverty by Sex and Age in Goodwater
With 35.6% poverty level for males and 31.5% for females among the residents of Goodwater, under 5 year old males and under 5 year old females are the most vulnerable to poverty, with 100 males (86.2%) and 6 females (100.0%) in their respective age groups living below the poverty level.
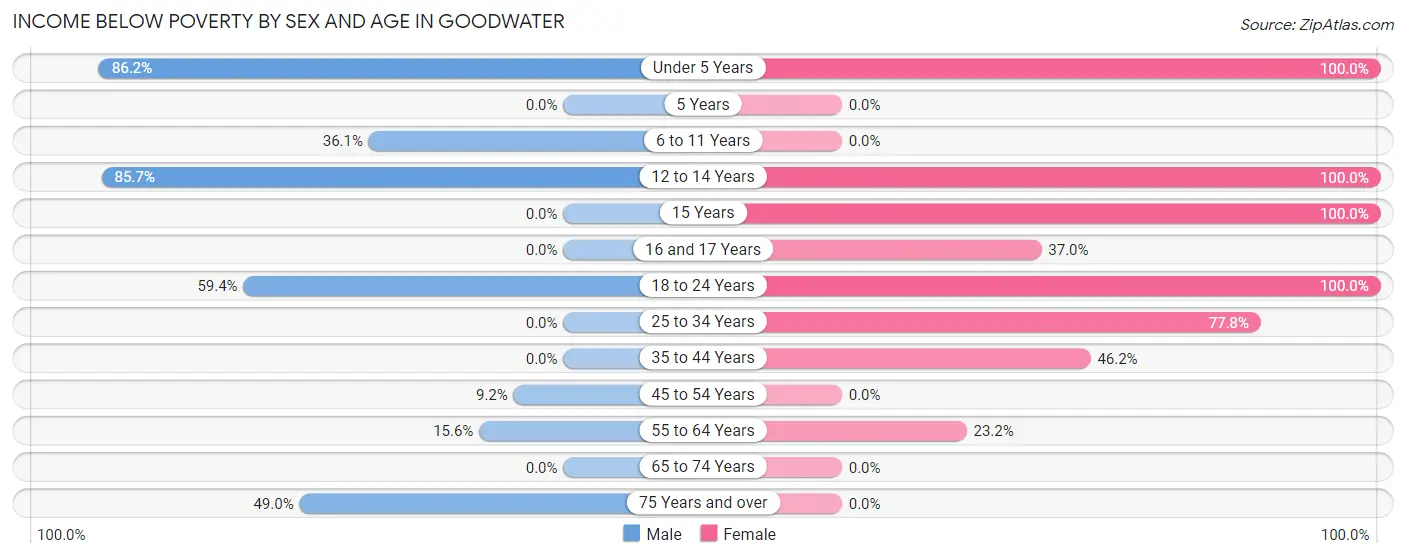
| Age Bracket | Male | Female |
| Under 5 Years | 100 (86.2%) | 6 (100.0%) |
| 5 Years | 0 (0.0%) | 0 (0.0%) |
| 6 to 11 Years | 13 (36.1%) | 0 (0.0%) |
| 12 to 14 Years | 18 (85.7%) | 36 (100.0%) |
| 15 Years | 0 (0.0%) | 18 (100.0%) |
| 16 and 17 Years | 0 (0.0%) | 10 (37.0%) |
| 18 to 24 Years | 19 (59.4%) | 10 (100.0%) |
| 25 to 34 Years | 0 (0.0%) | 49 (77.8%) |
| 35 to 44 Years | 0 (0.0%) | 12 (46.2%) |
| 45 to 54 Years | 6 (9.2%) | 0 (0.0%) |
| 55 to 64 Years | 10 (15.6%) | 22 (23.2%) |
| 65 to 74 Years | 0 (0.0%) | 0 (0.0%) |
| 75 Years and over | 24 (49.0%) | 0 (0.0%) |
| Total | 190 (35.6%) | 163 (31.5%) |
Income Above Poverty by Sex and Age in Goodwater
According to the poverty statistics in Goodwater, males aged 15 years and females aged 5 years are the age groups that are most secure financially, with 100.0% of males and 100.0% of females in these age groups living above the poverty line.
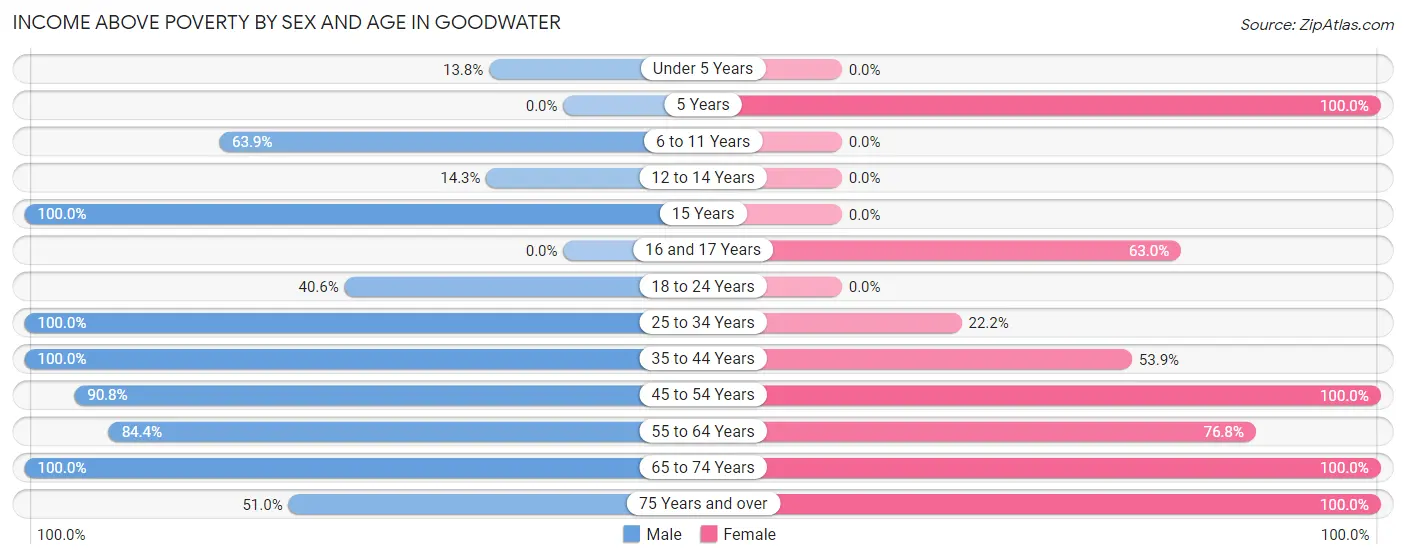
| Age Bracket | Male | Female |
| Under 5 Years | 16 (13.8%) | 0 (0.0%) |
| 5 Years | 0 (0.0%) | 11 (100.0%) |
| 6 to 11 Years | 23 (63.9%) | 0 (0.0%) |
| 12 to 14 Years | 3 (14.3%) | 0 (0.0%) |
| 15 Years | 10 (100.0%) | 0 (0.0%) |
| 16 and 17 Years | 0 (0.0%) | 17 (63.0%) |
| 18 to 24 Years | 13 (40.6%) | 0 (0.0%) |
| 25 to 34 Years | 35 (100.0%) | 14 (22.2%) |
| 35 to 44 Years | 18 (100.0%) | 14 (53.8%) |
| 45 to 54 Years | 59 (90.8%) | 94 (100.0%) |
| 55 to 64 Years | 54 (84.4%) | 73 (76.8%) |
| 65 to 74 Years | 87 (100.0%) | 107 (100.0%) |
| 75 Years and over | 25 (51.0%) | 25 (100.0%) |
| Total | 343 (64.3%) | 355 (68.5%) |
Income Below Poverty Among Married-Couple Families in Goodwater
The poverty statistics for married-couple families in Goodwater show that 7.5% or 10 of the total 133 families live below the poverty line. Families with no children have the highest poverty rate of 8.3%, comprising of 10 families. On the other hand, families with 1 or 2 children have the lowest poverty rate of 0.0%, which includes 0 families.
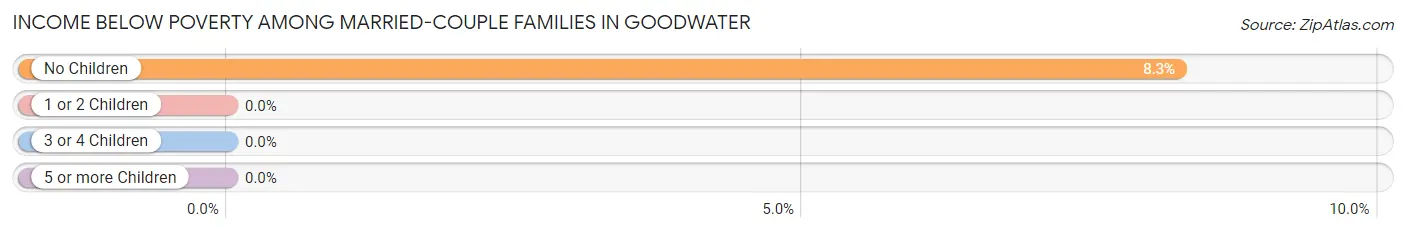
| Children | Above Poverty | Below Poverty |
| No Children | 111 (91.7%) | 10 (8.3%) |
| 1 or 2 Children | 12 (100.0%) | 0 (0.0%) |
| 3 or 4 Children | 0 (0.0%) | 0 (0.0%) |
| 5 or more Children | 0 (0.0%) | 0 (0.0%) |
| Total | 123 (92.5%) | 10 (7.5%) |
Income Below Poverty Among Single-Parent Households in Goodwater
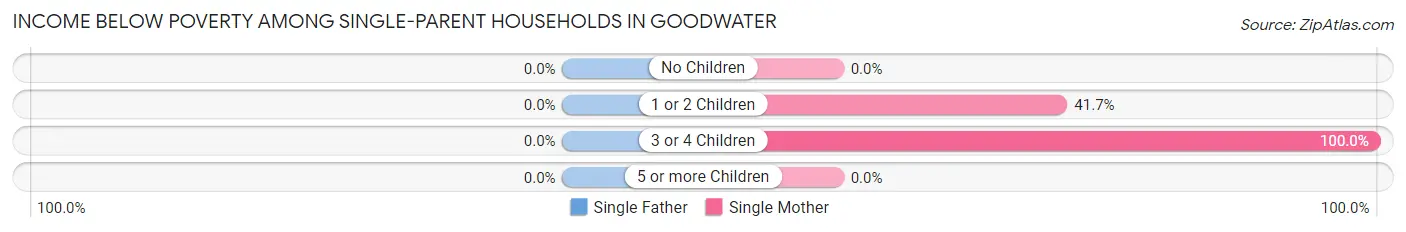
| Children | Single Father | Single Mother |
| No Children | 0 (0.0%) | 0 (0.0%) |
| 1 or 2 Children | 0 (0.0%) | 10 (41.7%) |
| 3 or 4 Children | 0 (0.0%) | 61 (100.0%) |
| 5 or more Children | 0 (0.0%) | 0 (0.0%) |
| Total | 0 (0.0%) | 71 (58.7%) |
Income Below Poverty Among Married-Couple vs Single-Parent Households in Goodwater
The poverty data for Goodwater shows that 10 of the married-couple family households (7.5%) and 71 of the single-parent households (44.1%) are living below the poverty level. Within the married-couple family households, those with no children have the highest poverty rate, with 10 households (8.3%) falling below the poverty line. Among the single-parent households, those with 3 or 4 children have the highest poverty rate, with 61 household (100.0%) living below poverty.
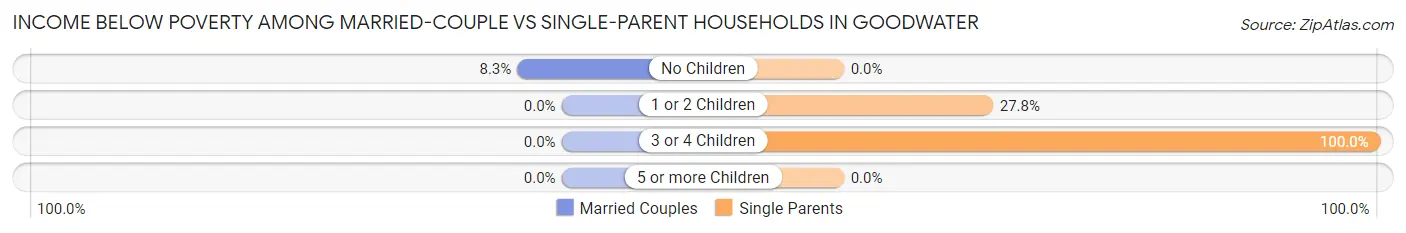
| Children | Married-Couple Families | Single-Parent Households |
| No Children | 10 (8.3%) | 0 (0.0%) |
| 1 or 2 Children | 0 (0.0%) | 10 (27.8%) |
| 3 or 4 Children | 0 (0.0%) | 61 (100.0%) |
| 5 or more Children | 0 (0.0%) | 0 (0.0%) |
| Total | 10 (7.5%) | 71 (44.1%) |
Race in Goodwater
The most populous races in Goodwater are Black / African American (872 | 78.1%), White / Caucasian (206 | 18.4%), and Two or more Races (39 | 3.5%).
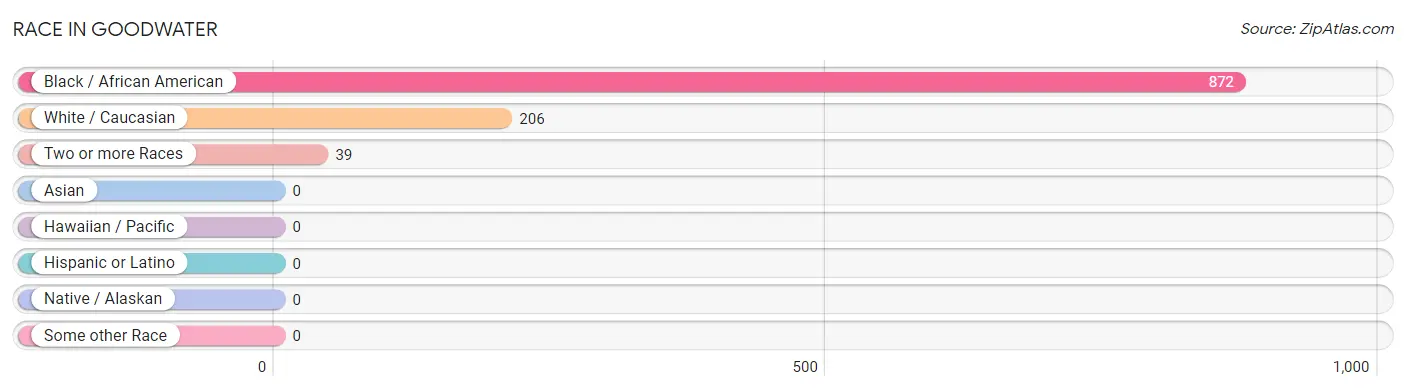
| Race | # Population | % Population |
| Asian | 0 | 0.0% |
| Black / African American | 872 | 78.1% |
| Hawaiian / Pacific | 0 | 0.0% |
| Hispanic or Latino | 0 | 0.0% |
| Native / Alaskan | 0 | 0.0% |
| White / Caucasian | 206 | 18.4% |
| Two or more Races | 39 | 3.5% |
| Some other Race | 0 | 0.0% |
| Total | 1,117 | 100.0% |
Ancestry in Goodwater
The most populous ancestries reported in Goodwater are American (120 | 10.7%), Scottish (31 | 2.8%), English (24 | 2.1%), European (24 | 2.1%), and Italian (24 | 2.1%), together accounting for 20.0% of all Goodwater residents.
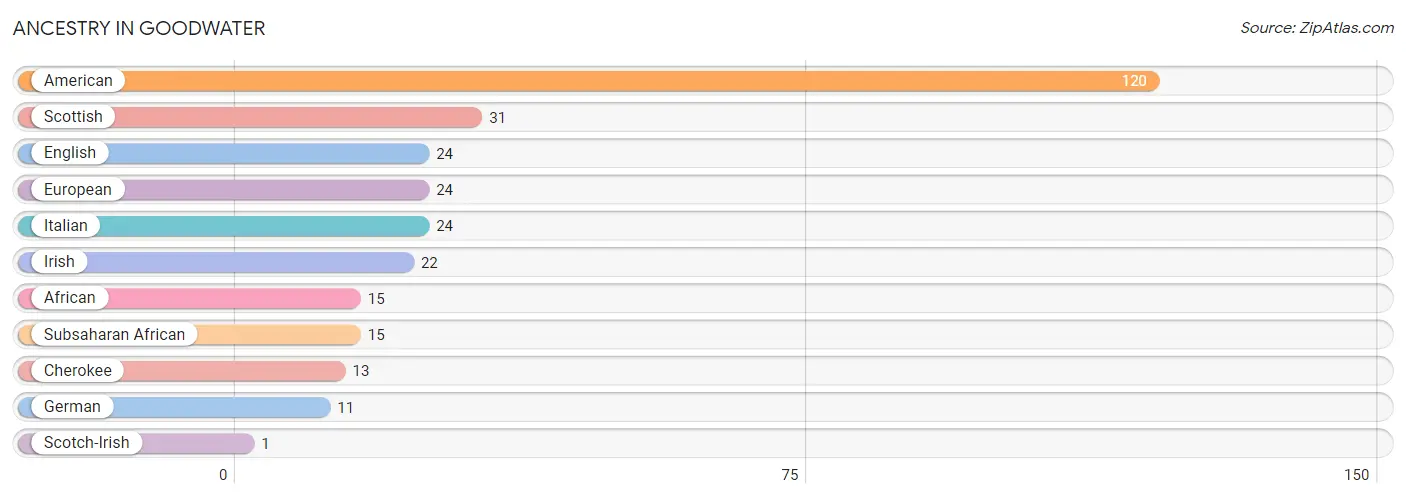
| Ancestry | # Population | % Population |
| African | 15 | 1.3% |
| American | 120 | 10.7% |
| Cherokee | 13 | 1.2% |
| English | 24 | 2.1% |
| European | 24 | 2.1% |
| German | 11 | 1.0% |
| Irish | 22 | 2.0% |
| Italian | 24 | 2.1% |
| Scotch-Irish | 1 | 0.1% |
| Scottish | 31 | 2.8% |
| Subsaharan African | 15 | 1.3% | View All 11 Rows |
Immigrants in Goodwater

| Immigration Origin | # Population | % Population | View All 0 Rows |
Sex and Age in Goodwater
Sex and Age in Goodwater
The most populous age groups in Goodwater are Under 5 Years (116 | 20.6%) for men and 70 to 74 Years (95 | 17.1%) for women.
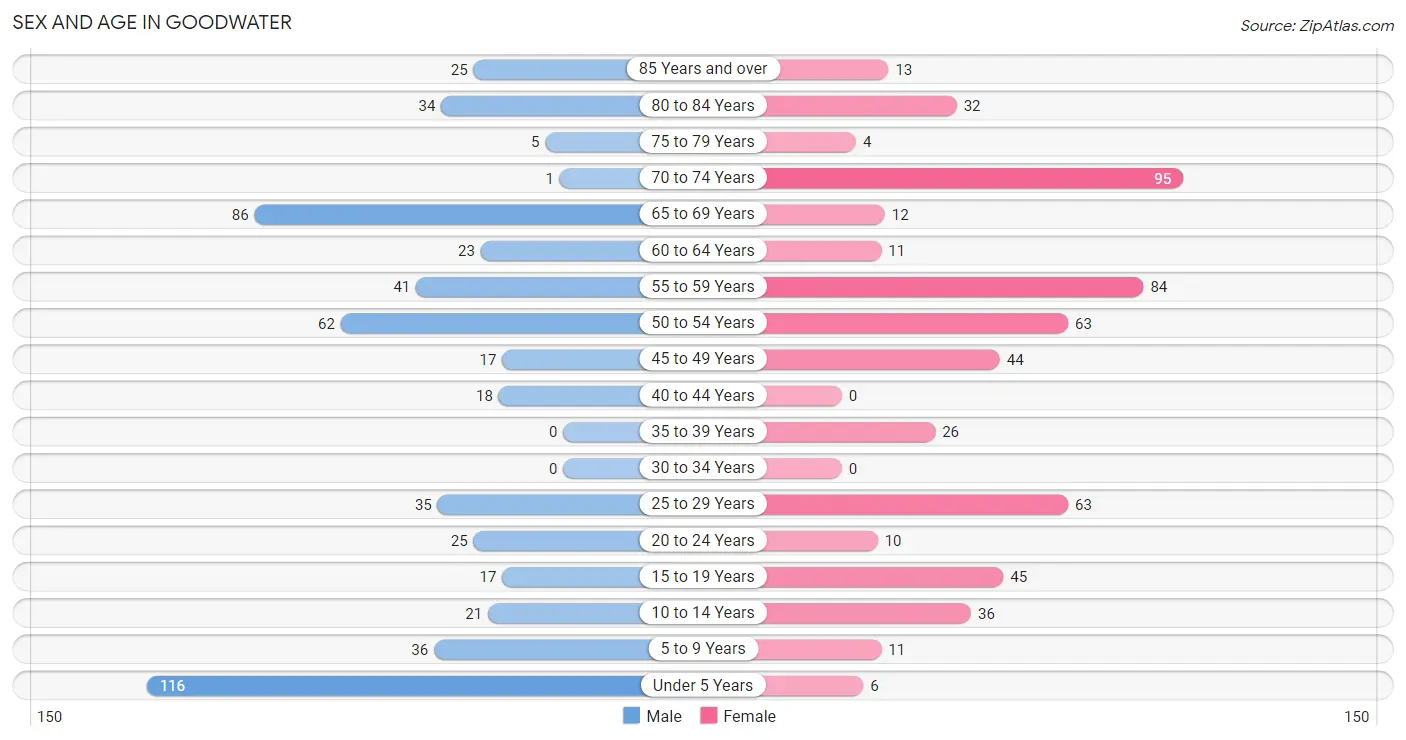
| Age Bracket | Male | Female |
| Under 5 Years | 116 (20.6%) | 6 (1.1%) |
| 5 to 9 Years | 36 (6.4%) | 11 (2.0%) |
| 10 to 14 Years | 21 (3.7%) | 36 (6.5%) |
| 15 to 19 Years | 17 (3.0%) | 45 (8.1%) |
| 20 to 24 Years | 25 (4.4%) | 10 (1.8%) |
| 25 to 29 Years | 35 (6.2%) | 63 (11.4%) |
| 30 to 34 Years | 0 (0.0%) | 0 (0.0%) |
| 35 to 39 Years | 0 (0.0%) | 26 (4.7%) |
| 40 to 44 Years | 18 (3.2%) | 0 (0.0%) |
| 45 to 49 Years | 17 (3.0%) | 44 (7.9%) |
| 50 to 54 Years | 62 (11.0%) | 63 (11.4%) |
| 55 to 59 Years | 41 (7.3%) | 84 (15.1%) |
| 60 to 64 Years | 23 (4.1%) | 11 (2.0%) |
| 65 to 69 Years | 86 (15.3%) | 12 (2.2%) |
| 70 to 74 Years | 1 (0.2%) | 95 (17.1%) |
| 75 to 79 Years | 5 (0.9%) | 4 (0.7%) |
| 80 to 84 Years | 34 (6.0%) | 32 (5.8%) |
| 85 Years and over | 25 (4.4%) | 13 (2.3%) |
| Total | 562 (100.0%) | 555 (100.0%) |
Families and Households in Goodwater
Median Family Size in Goodwater
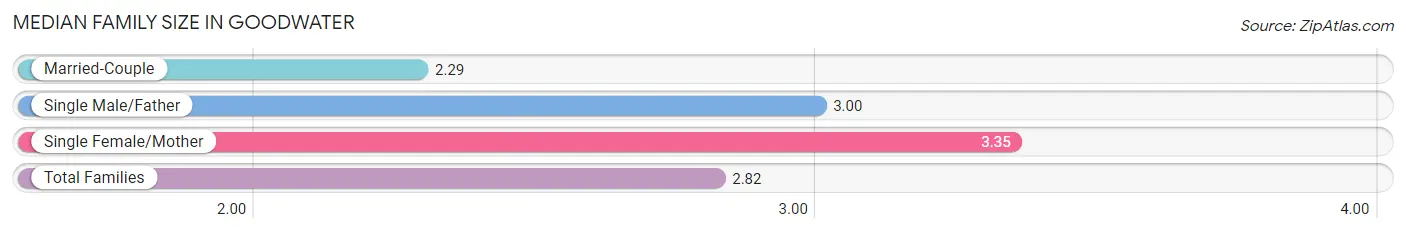
The median family size in Goodwater is 2.82 persons per family, with single female/mother families (121 | 41.2%) accounting for the largest median family size of 3.35 persons per family. On the other hand, married-couple families (133 | 45.2%) represent the smallest median family size with 2.29 persons per family.
| Family Type | # Families | Family Size |
| Married-Couple | 133 (45.2%) | 2.29 |
| Single Male/Father | 40 (13.6%) | 3.00 |
| Single Female/Mother | 121 (41.2%) | 3.35 |
| Total Families | 294 (100.0%) | 2.82 |
Median Household Size in Goodwater
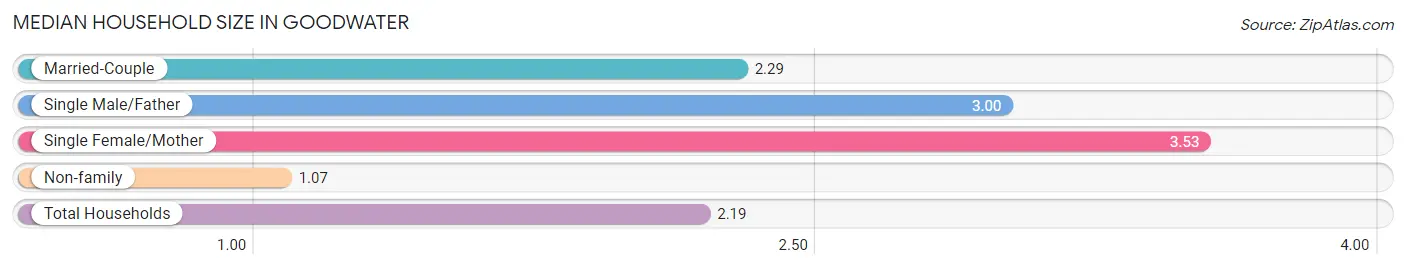
The median household size in Goodwater is 2.19 persons per household, with single female/mother households (121 | 25.2%) accounting for the largest median household size of 3.53 persons per household. non-family households (187 | 38.9%) represent the smallest median household size with 1.07 persons per household.
| Household Type | # Households | Household Size |
| Married-Couple | 133 (27.7%) | 2.29 |
| Single Male/Father | 40 (8.3%) | 3.00 |
| Single Female/Mother | 121 (25.2%) | 3.53 |
| Non-family | 187 (38.9%) | 1.07 |
| Total Households | 481 (100.0%) | 2.19 |
Household Size by Marriage Status in Goodwater
Out of a total of 481 households in Goodwater, 294 (61.1%) are family households, while 187 (38.9%) are nonfamily households. The most numerous type of family households are 2-person households, comprising 178, and the most common type of nonfamily households are 1-person households, comprising 168.
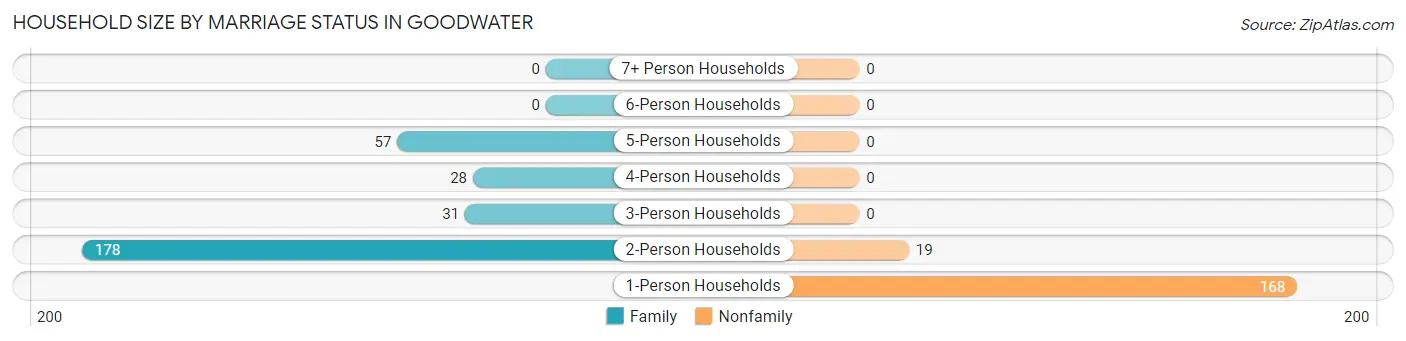
| Household Size | Family Households | Nonfamily Households |
| 1-Person Households | - | 168 (34.9%) |
| 2-Person Households | 178 (37.0%) | 19 (4.0%) |
| 3-Person Households | 31 (6.4%) | 0 (0.0%) |
| 4-Person Households | 28 (5.8%) | 0 (0.0%) |
| 5-Person Households | 57 (11.8%) | 0 (0.0%) |
| 6-Person Households | 0 (0.0%) | 0 (0.0%) |
| 7+ Person Households | 0 (0.0%) | 0 (0.0%) |
| Total | 294 (61.1%) | 187 (38.9%) |
Female Fertility in Goodwater
Fertility by Age in Goodwater
Average fertility rate in Goodwater is 138.0 births per 1,000 women. Women in the age bracket of 20 to 34 years have the highest fertility rate with 192.0 births per 1,000 women. Women in the age bracket of 35 to 50 years acount for 53.3% of all women with births.
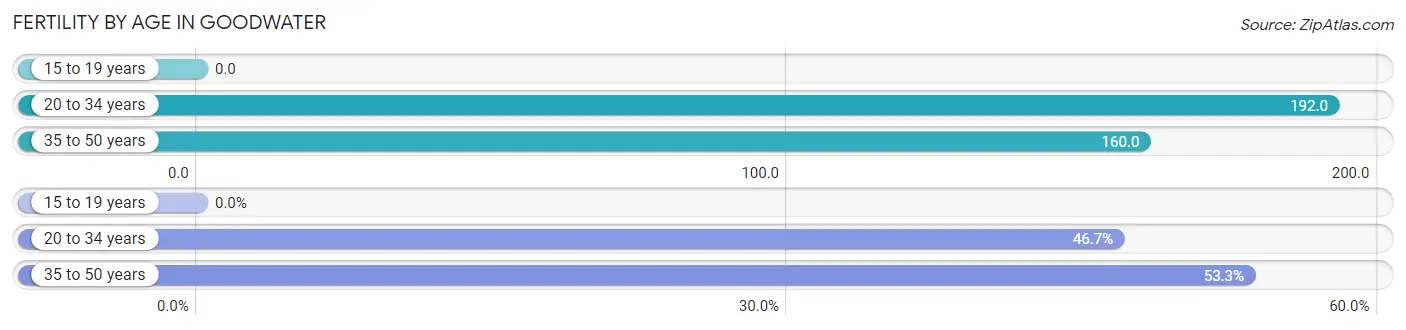
| Age Bracket | Women with Births | Births / 1,000 Women |
| 15 to 19 years | 0 (0.0%) | 0.0 |
| 20 to 34 years | 14 (46.7%) | 192.0 |
| 35 to 50 years | 16 (53.3%) | 160.0 |
| Total | 30 (100.0%) | 138.0 |
Fertility by Age by Marriage Status in Goodwater
53.3% of women with births (30) in Goodwater are married. The highest percentage of unmarried women with births falls into 20 to 34 years age bracket with 100.0% of them unmarried at the time of birth, while the lowest percentage of unmarried women with births belong to 35 to 50 years age bracket with 0.0% of them unmarried.
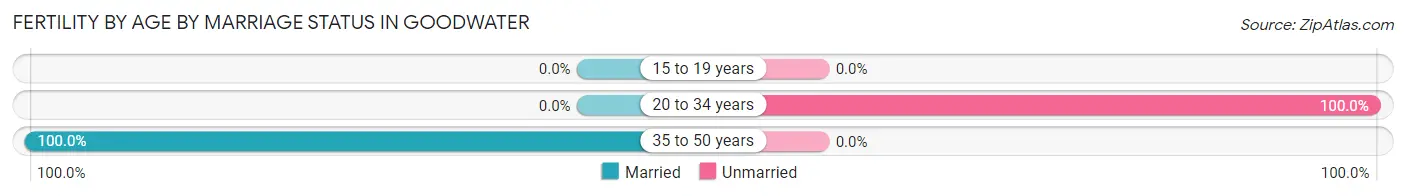
| Age Bracket | Married | Unmarried |
| 15 to 19 years | 0 (0.0%) | 0 (0.0%) |
| 20 to 34 years | 0 (0.0%) | 14 (100.0%) |
| 35 to 50 years | 16 (100.0%) | 0 (0.0%) |
| Total | 16 (53.3%) | 14 (46.7%) |
Fertility by Education in Goodwater
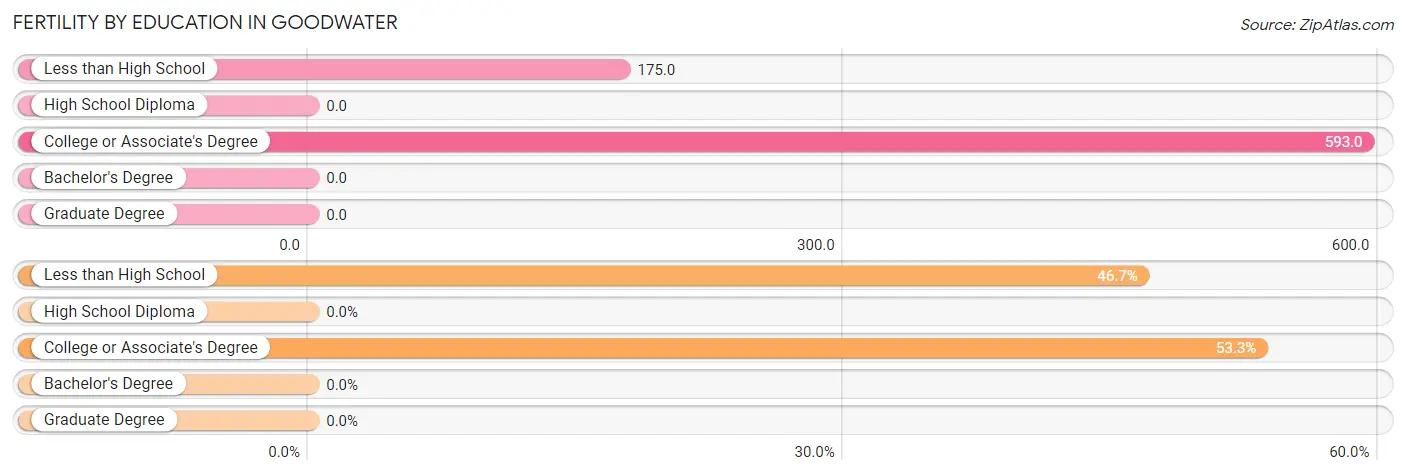
| Educational Attainment | Women with Births | Births / 1,000 Women |
| Less than High School | 14 (46.7%) | 175.0 |
| High School Diploma | 0 (0.0%) | 0.0 |
| College or Associate's Degree | 16 (53.3%) | 593.0 |
| Bachelor's Degree | 0 (0.0%) | 0.0 |
| Graduate Degree | 0 (0.0%) | 0.0 |
| Total | 30 (100.0%) | 138.0 |
Fertility by Education by Marriage Status in Goodwater
46.7% of women with births in Goodwater are unmarried. Women with the educational attainment of college or associate's degree are most likely to be married with 100.0% of them married at childbirth, while women with the educational attainment of less than high school are least likely to be married with 100.0% of them unmarried at childbirth.
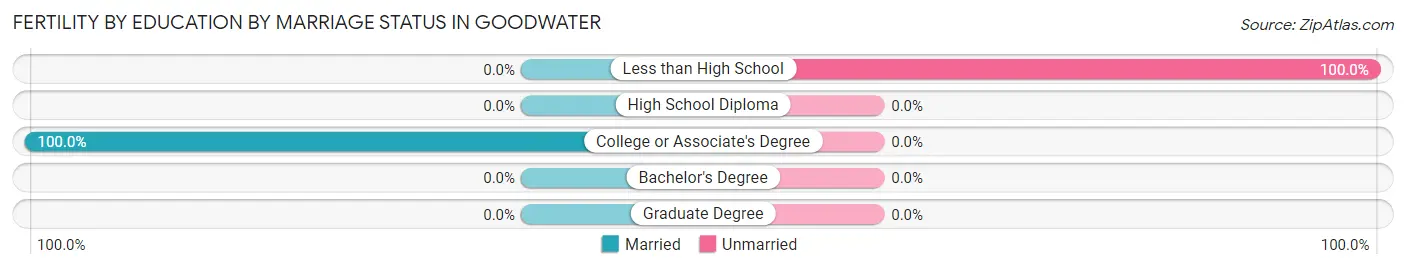
| Educational Attainment | Married | Unmarried |
| Less than High School | 0 (0.0%) | 14 (100.0%) |
| High School Diploma | 0 (0.0%) | 0 (0.0%) |
| College or Associate's Degree | 16 (100.0%) | 0 (0.0%) |
| Bachelor's Degree | 0 (0.0%) | 0 (0.0%) |
| Graduate Degree | 0 (0.0%) | 0 (0.0%) |
| Total | 16 (53.3%) | 14 (46.7%) |
Employment Characteristics in Goodwater
Employment by Class of Employer in Goodwater
Among the 291 employed individuals in Goodwater, private company employees (214 | 73.5%), federal government employees (27 | 9.3%), and local government employees (24 | 8.3%) make up the most common classes of employment.
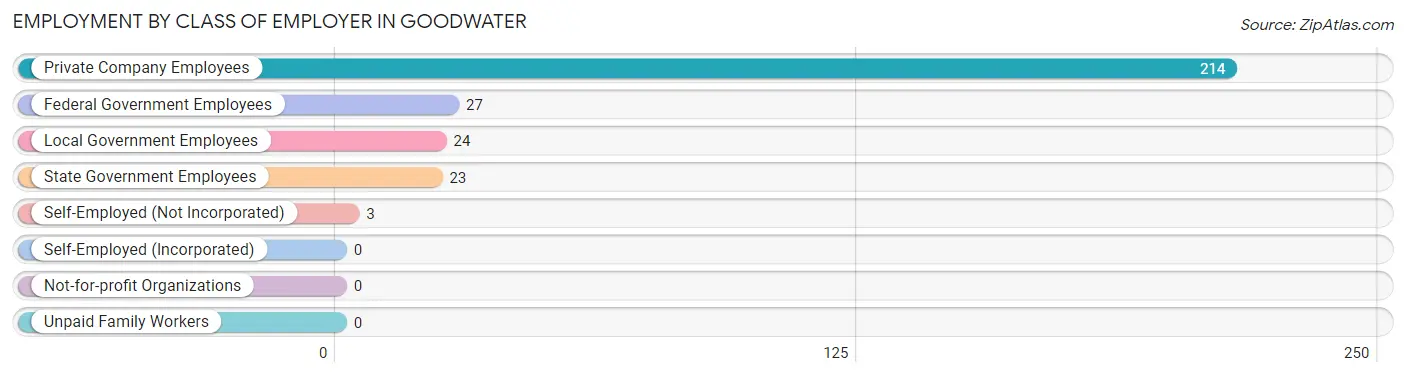
| Employer Class | # Employees | % Employees |
| Private Company Employees | 214 | 73.5% |
| Self-Employed (Incorporated) | 0 | 0.0% |
| Self-Employed (Not Incorporated) | 3 | 1.0% |
| Not-for-profit Organizations | 0 | 0.0% |
| Local Government Employees | 24 | 8.3% |
| State Government Employees | 23 | 7.9% |
| Federal Government Employees | 27 | 9.3% |
| Unpaid Family Workers | 0 | 0.0% |
| Total | 291 | 100.0% |
Employment Status by Age in Goodwater
According to the labor force statistics for Goodwater, out of the total population over 16 years of age (863), 37.2% or 321 individuals are in the labor force, with 2.9% or 9 of them unemployed. The age group with the highest labor force participation rate is 20 to 24 years, with 100.0% or 35 individuals in the labor force. Within the labor force, the 35 to 44 years age range has the highest percentage of unemployed individuals, with 11.1% or 4 of them being unemployed.
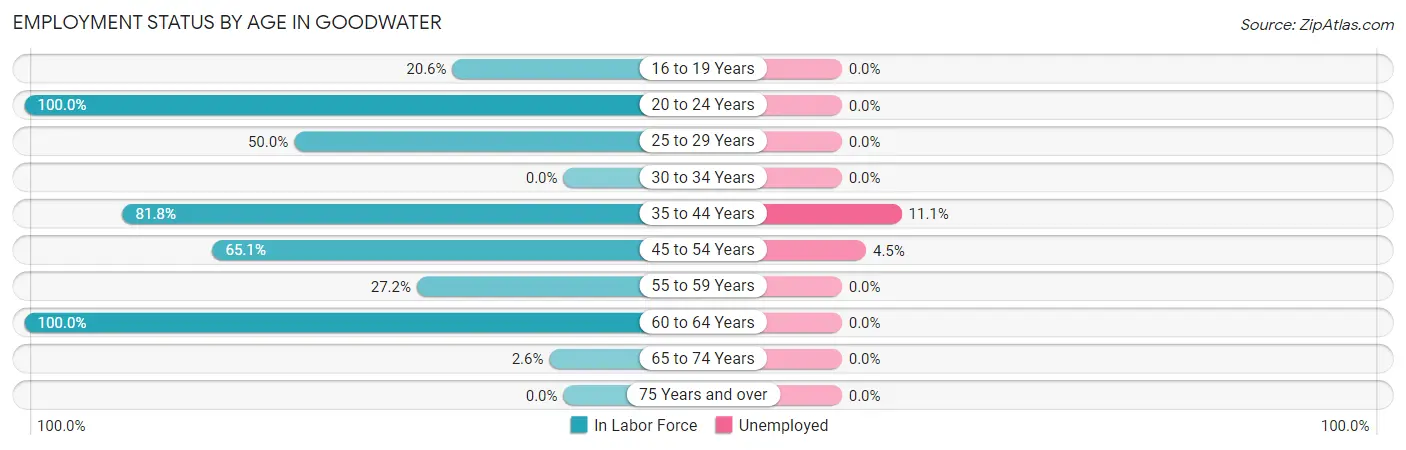
| Age Bracket | In Labor Force | Unemployed |
| 16 to 19 Years | 7 (20.6%) | 0 (0.0%) |
| 20 to 24 Years | 35 (100.0%) | 0 (0.0%) |
| 25 to 29 Years | 49 (50.0%) | 0 (0.0%) |
| 30 to 34 Years | 0 (0.0%) | 0 (0.0%) |
| 35 to 44 Years | 36 (81.8%) | 4 (11.1%) |
| 45 to 54 Years | 121 (65.1%) | 5 (4.5%) |
| 55 to 59 Years | 34 (27.2%) | 0 (0.0%) |
| 60 to 64 Years | 34 (100.0%) | 0 (0.0%) |
| 65 to 74 Years | 5 (2.6%) | 0 (0.0%) |
| 75 Years and over | 0 (0.0%) | 0 (0.0%) |
| Total | 321 (37.2%) | 9 (2.9%) |
Employment Status by Educational Attainment in Goodwater
According to labor force statistics for Goodwater, 56.3% of individuals (274) out of the total population between 25 and 64 years of age (487) are in the labor force, with 3.4% or 9 of them being unemployed. The group with the highest labor force participation rate are those with the educational attainment of bachelor's degree or higher, with 86.1% or 31 individuals in the labor force. Within the labor force, individuals with high school diploma education have the highest percentage of unemployment, with 8.4% or 10 of them being unemployed.
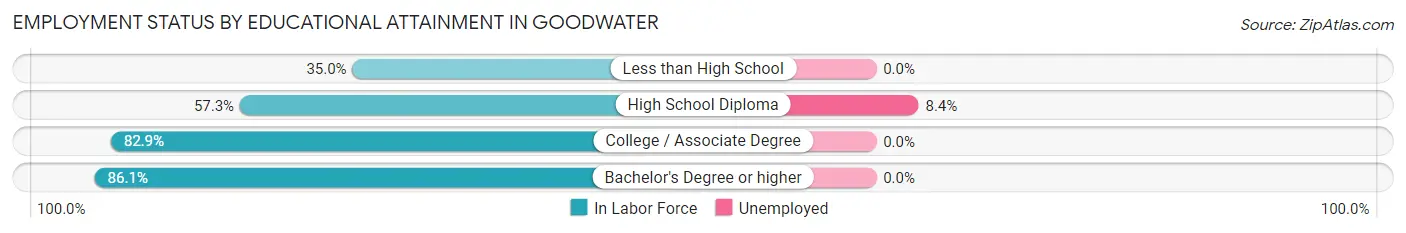
| Educational Attainment | In Labor Force | Unemployed |
| Less than High School | 57 (35.0%) | 0 (0.0%) |
| High School Diploma | 118 (57.3%) | 17 (8.4%) |
| College / Associate Degree | 68 (82.9%) | 0 (0.0%) |
| Bachelor's Degree or higher | 31 (86.1%) | 0 (0.0%) |
| Total | 274 (56.3%) | 17 (3.4%) |
Employment Occupations by Sex in Goodwater
Management, Business, Science and Arts Occupations
The most common Management, Business, Science and Arts occupations in Goodwater are Community & Social Service (38 | 12.6%), Education Instruction & Library (38 | 12.6%), Health Diagnosing & Treating (17 | 5.7%), Health Technologists (16 | 5.3%), and Computers, Engineering & Science (13 | 4.3%).
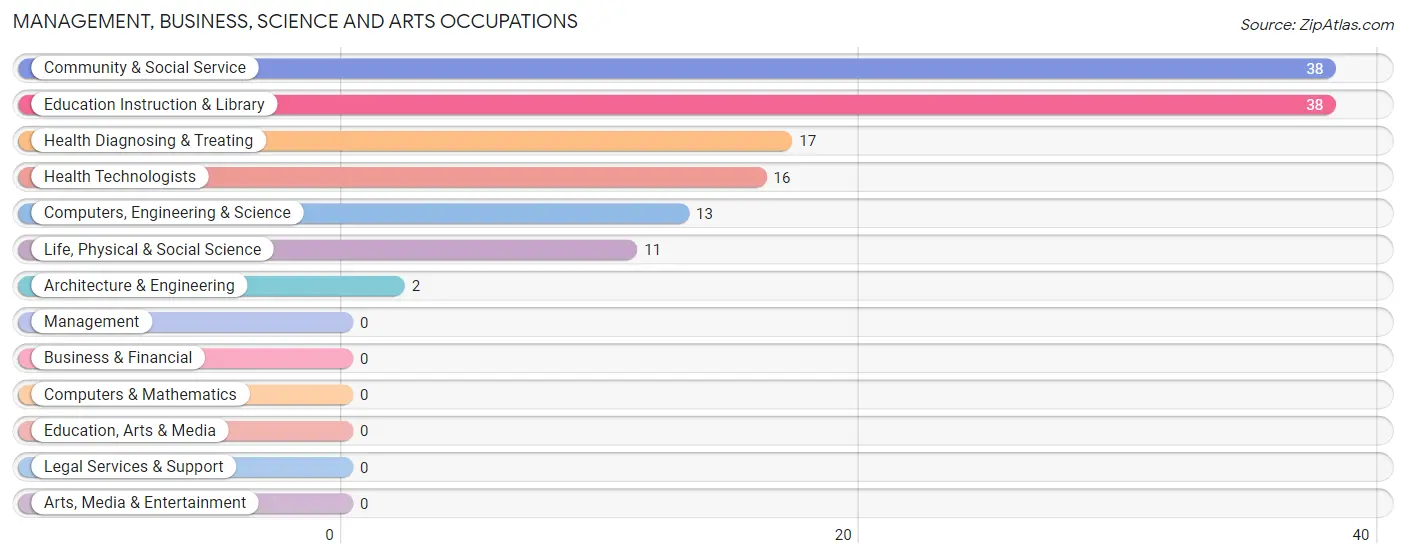
Management, Business, Science and Arts Occupations by Sex
Within the Management, Business, Science and Arts occupations in Goodwater, the most male-oriented occupations are Architecture & Engineering (100.0%), and Computers, Engineering & Science (15.4%), while the most female-oriented occupations are Life, Physical & Social Science (100.0%), Community & Social Service (100.0%), and Education Instruction & Library (100.0%).
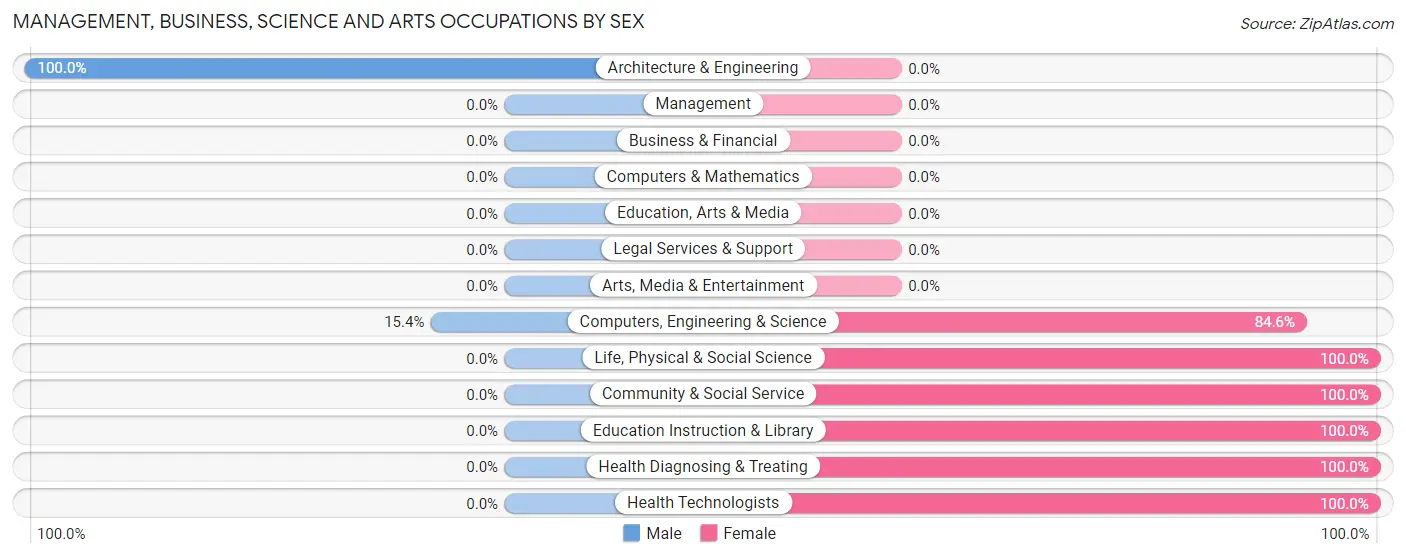
| Occupation | Male | Female |
| Management | 0 (0.0%) | 0 (0.0%) |
| Business & Financial | 0 (0.0%) | 0 (0.0%) |
| Computers, Engineering & Science | 2 (15.4%) | 11 (84.6%) |
| Computers & Mathematics | 0 (0.0%) | 0 (0.0%) |
| Architecture & Engineering | 2 (100.0%) | 0 (0.0%) |
| Life, Physical & Social Science | 0 (0.0%) | 11 (100.0%) |
| Community & Social Service | 0 (0.0%) | 38 (100.0%) |
| Education, Arts & Media | 0 (0.0%) | 0 (0.0%) |
| Legal Services & Support | 0 (0.0%) | 0 (0.0%) |
| Education Instruction & Library | 0 (0.0%) | 38 (100.0%) |
| Arts, Media & Entertainment | 0 (0.0%) | 0 (0.0%) |
| Health Diagnosing & Treating | 0 (0.0%) | 17 (100.0%) |
| Health Technologists | 0 (0.0%) | 16 (100.0%) |
| Total (Category) | 2 (2.9%) | 66 (97.1%) |
| Total (Overall) | 155 (51.5%) | 146 (48.5%) |
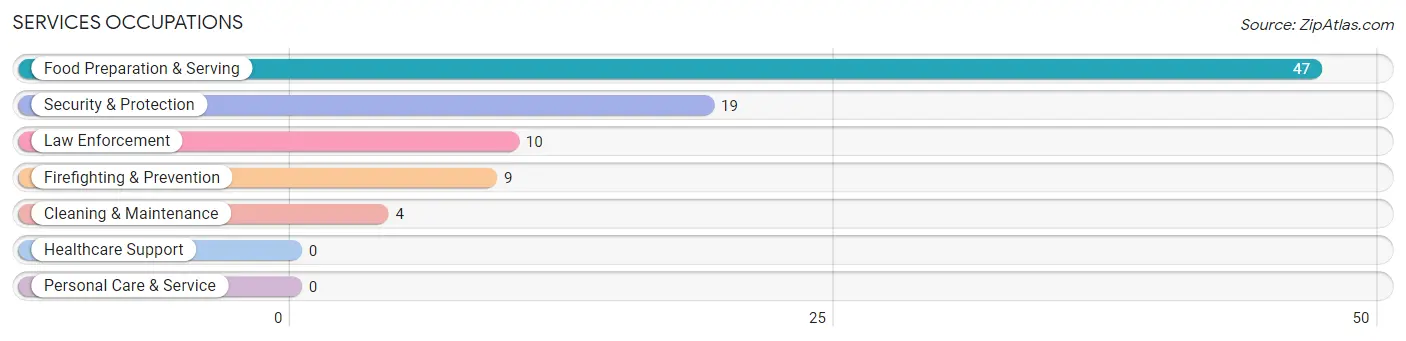
Services Occupations
The most common Services occupations in Goodwater are Food Preparation & Serving (47 | 15.6%), Security & Protection (19 | 6.3%), Law Enforcement (10 | 3.3%), Firefighting & Prevention (9 | 3.0%), and Cleaning & Maintenance (4 | 1.3%).
Services Occupations by Sex
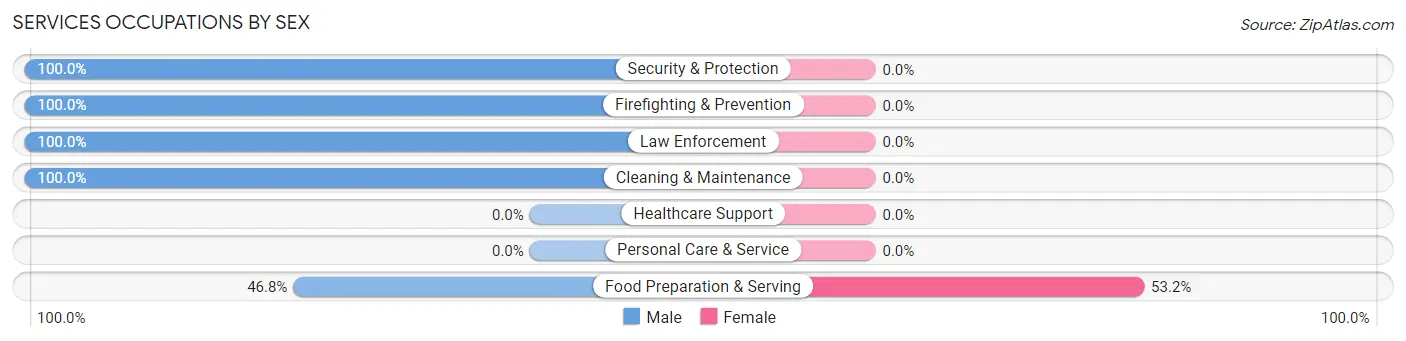
| Occupation | Male | Female |
| Healthcare Support | 0 (0.0%) | 0 (0.0%) |
| Security & Protection | 19 (100.0%) | 0 (0.0%) |
| Firefighting & Prevention | 9 (100.0%) | 0 (0.0%) |
| Law Enforcement | 10 (100.0%) | 0 (0.0%) |
| Food Preparation & Serving | 22 (46.8%) | 25 (53.2%) |
| Cleaning & Maintenance | 4 (100.0%) | 0 (0.0%) |
| Personal Care & Service | 0 (0.0%) | 0 (0.0%) |
| Total (Category) | 45 (64.3%) | 25 (35.7%) |
| Total (Overall) | 155 (51.5%) | 146 (48.5%) |
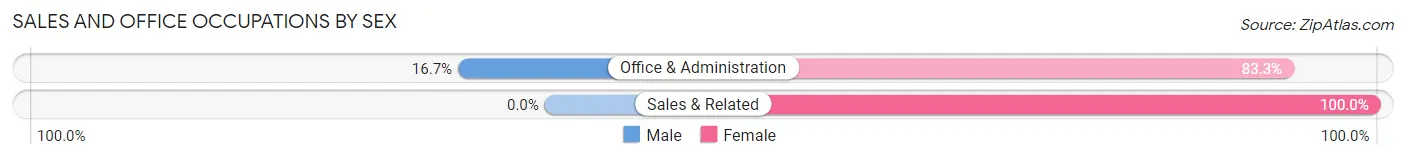
Sales and Office Occupations
The most common Sales and Office occupations in Goodwater are Sales & Related (7 | 2.3%), and Office & Administration (6 | 2.0%).
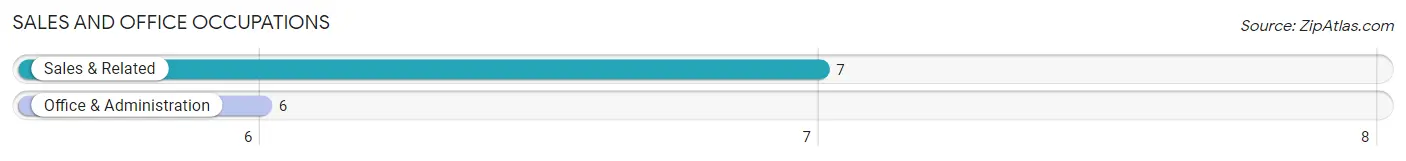
Sales and Office Occupations by Sex
| Occupation | Male | Female |
| Sales & Related | 0 (0.0%) | 7 (100.0%) |
| Office & Administration | 1 (16.7%) | 5 (83.3%) |
| Total (Category) | 1 (7.7%) | 12 (92.3%) |
| Total (Overall) | 155 (51.5%) | 146 (48.5%) |
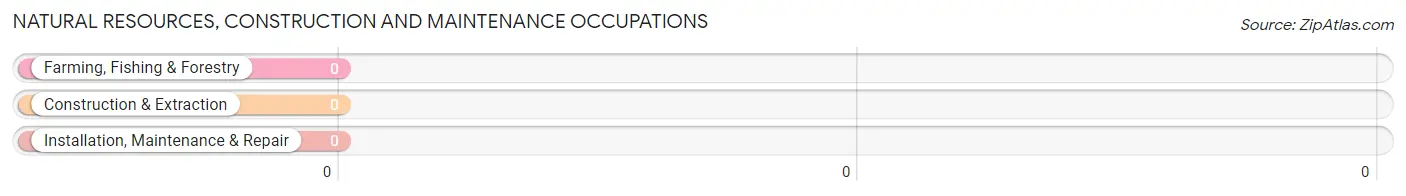
Natural Resources, Construction and Maintenance Occupations
Natural Resources, Construction and Maintenance Occupations by Sex
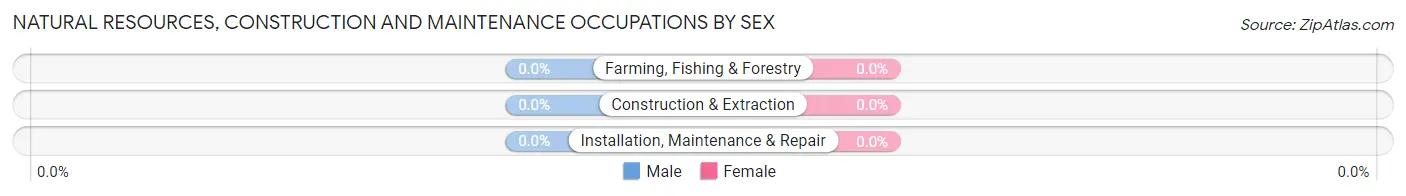
| Occupation | Male | Female |
| Farming, Fishing & Forestry | 0 (0.0%) | 0 (0.0%) |
| Construction & Extraction | 0 (0.0%) | 0 (0.0%) |
| Installation, Maintenance & Repair | 0 (0.0%) | 0 (0.0%) |
| Total (Category) | 0 (0.0%) | 0 (0.0%) |
| Total (Overall) | 155 (51.5%) | 146 (48.5%) |
Production, Transportation and Moving Occupations
The most common Production, Transportation and Moving occupations in Goodwater are Production (107 | 35.5%), Material Moving (27 | 9.0%), and Transportation (16 | 5.3%).
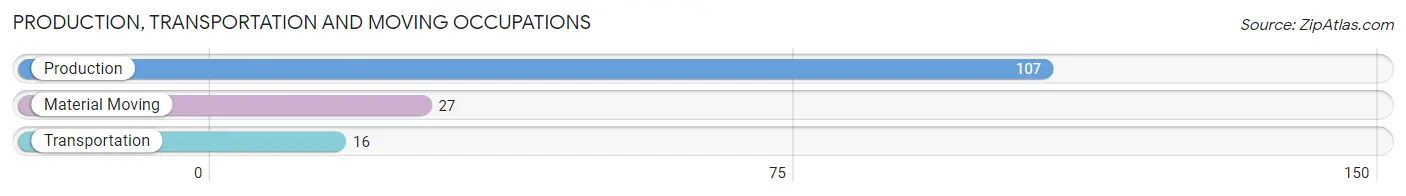
Production, Transportation and Moving Occupations by Sex
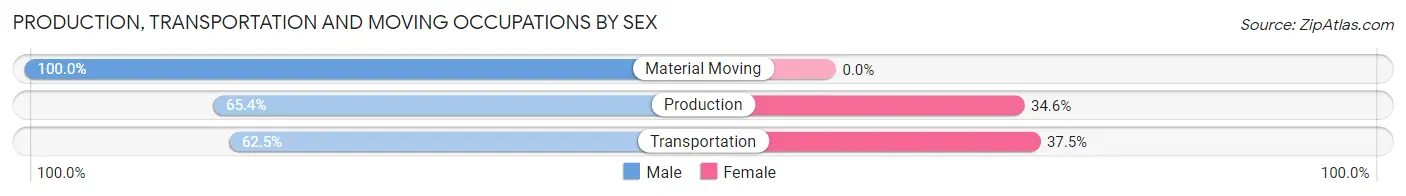
| Occupation | Male | Female |
| Production | 70 (65.4%) | 37 (34.6%) |
| Transportation | 10 (62.5%) | 6 (37.5%) |
| Material Moving | 27 (100.0%) | 0 (0.0%) |
| Total (Category) | 107 (71.3%) | 43 (28.7%) |
| Total (Overall) | 155 (51.5%) | 146 (48.5%) |
Employment Industries by Sex in Goodwater
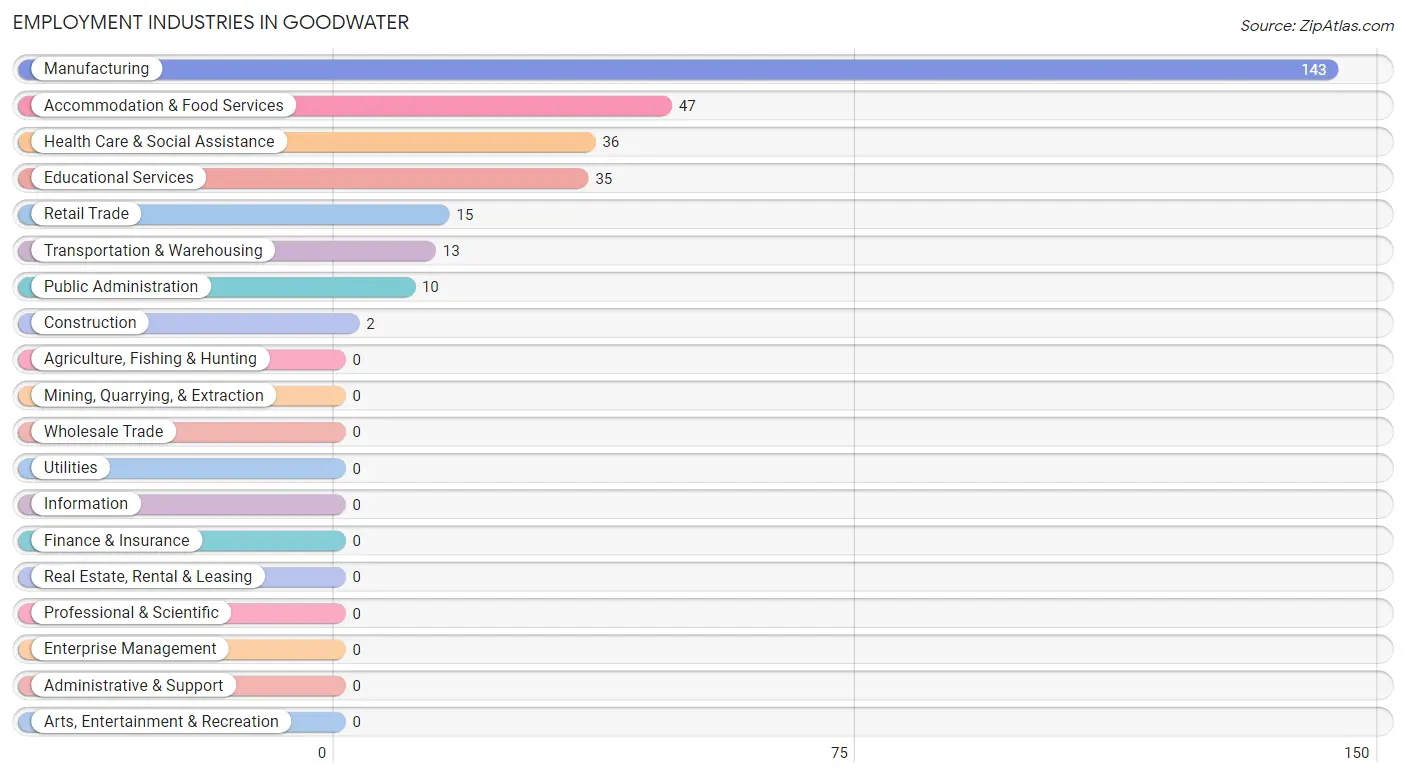
Employment Industries in Goodwater
The major employment industries in Goodwater include Manufacturing (143 | 47.5%), Accommodation & Food Services (47 | 15.6%), Health Care & Social Assistance (36 | 12.0%), Educational Services (35 | 11.6%), and Retail Trade (15 | 5.0%).
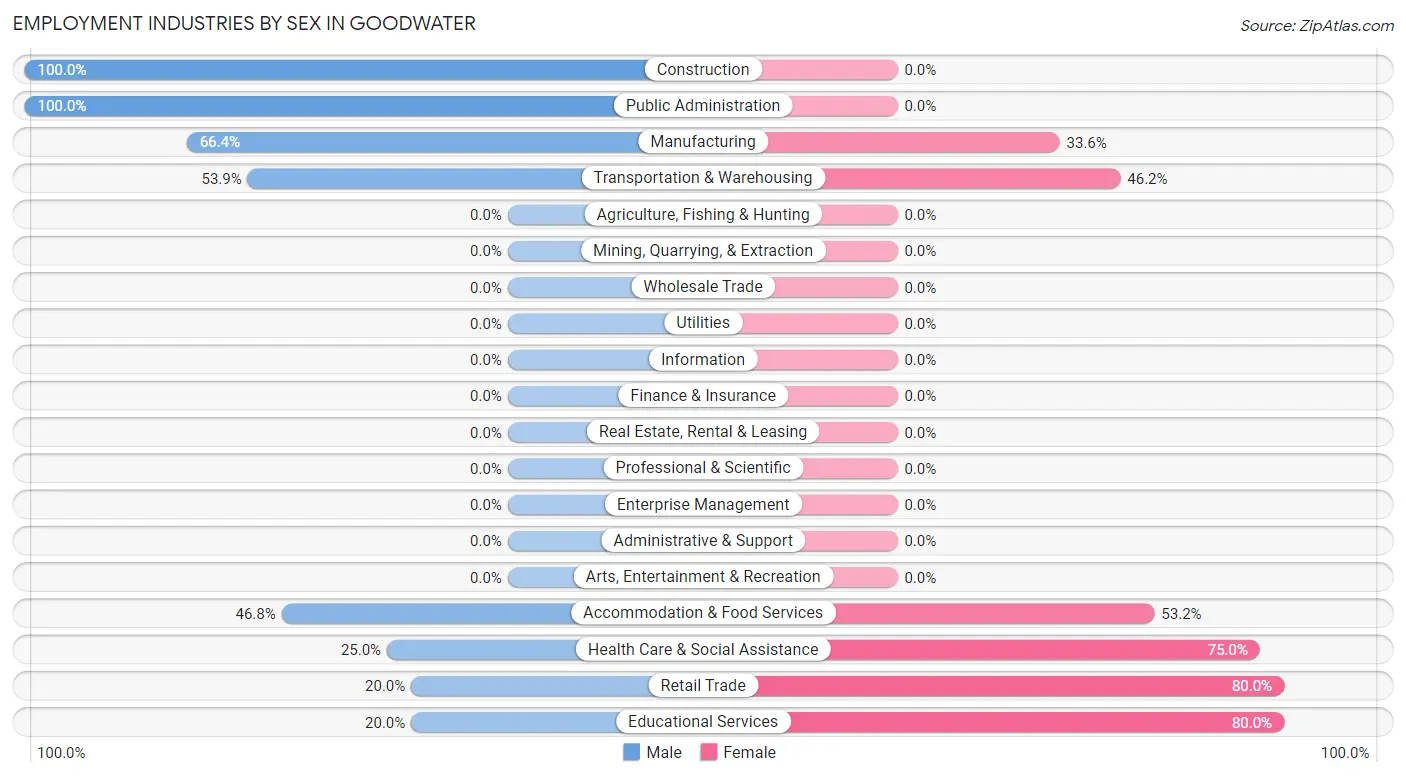
Employment Industries by Sex in Goodwater
The Goodwater industries that see more men than women are Construction (100.0%), Public Administration (100.0%), and Manufacturing (66.4%), whereas the industries that tend to have a higher number of women are Retail Trade (80.0%), Educational Services (80.0%), and Health Care & Social Assistance (75.0%).
| Industry | Male | Female |
| Agriculture, Fishing & Hunting | 0 (0.0%) | 0 (0.0%) |
| Mining, Quarrying, & Extraction | 0 (0.0%) | 0 (0.0%) |
| Construction | 2 (100.0%) | 0 (0.0%) |
| Manufacturing | 95 (66.4%) | 48 (33.6%) |
| Wholesale Trade | 0 (0.0%) | 0 (0.0%) |
| Retail Trade | 3 (20.0%) | 12 (80.0%) |
| Transportation & Warehousing | 7 (53.8%) | 6 (46.2%) |
| Utilities | 0 (0.0%) | 0 (0.0%) |
| Information | 0 (0.0%) | 0 (0.0%) |
| Finance & Insurance | 0 (0.0%) | 0 (0.0%) |
| Real Estate, Rental & Leasing | 0 (0.0%) | 0 (0.0%) |
| Professional & Scientific | 0 (0.0%) | 0 (0.0%) |
| Enterprise Management | 0 (0.0%) | 0 (0.0%) |
| Administrative & Support | 0 (0.0%) | 0 (0.0%) |
| Educational Services | 7 (20.0%) | 28 (80.0%) |
| Health Care & Social Assistance | 9 (25.0%) | 27 (75.0%) |
| Arts, Entertainment & Recreation | 0 (0.0%) | 0 (0.0%) |
| Accommodation & Food Services | 22 (46.8%) | 25 (53.2%) |
| Public Administration | 10 (100.0%) | 0 (0.0%) |
| Total | 155 (51.5%) | 146 (48.5%) |
Education in Goodwater
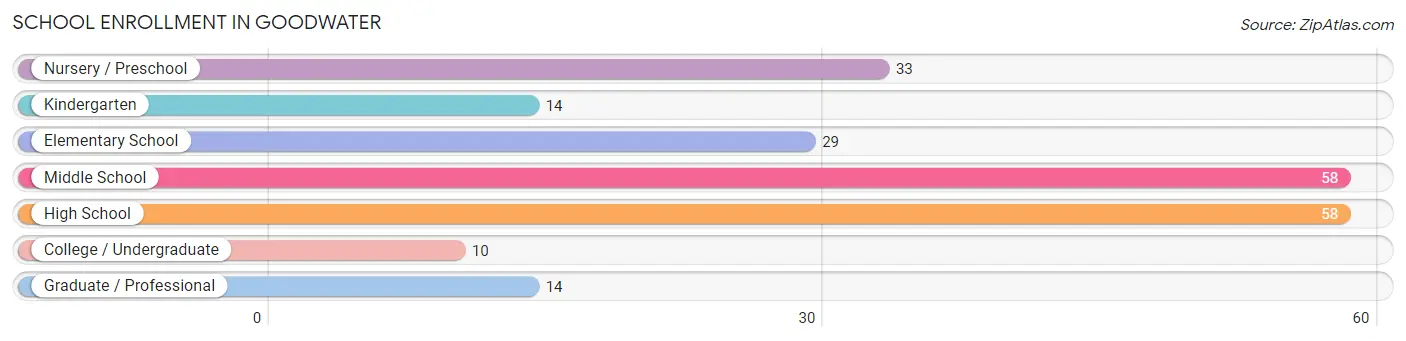
School Enrollment in Goodwater
The most common levels of schooling among the 216 students in Goodwater are middle school (58 | 26.9%), high school (58 | 26.9%), and nursery / preschool (33 | 15.3%).
| School Level | # Students | % Students |
| Nursery / Preschool | 33 | 15.3% |
| Kindergarten | 14 | 6.5% |
| Elementary School | 29 | 13.4% |
| Middle School | 58 | 26.9% |
| High School | 58 | 26.9% |
| College / Undergraduate | 10 | 4.6% |
| Graduate / Professional | 14 | 6.5% |
| Total | 216 | 100.0% |
School Enrollment by Age by Funding Source in Goodwater
Out of a total of 216 students who are enrolled in schools in Goodwater, 43 (19.9%) attend a private institution, while the remaining 173 (80.1%) are enrolled in public schools. The age group of 3 to 4 year olds has the highest likelihood of being enrolled in private schools, with 33 (100.0% in the age bracket) enrolled. Conversely, the age group of 5 to 9 year old has the lowest likelihood of being enrolled in a private school, with 47 (100.0% in the age bracket) attending a public institution.
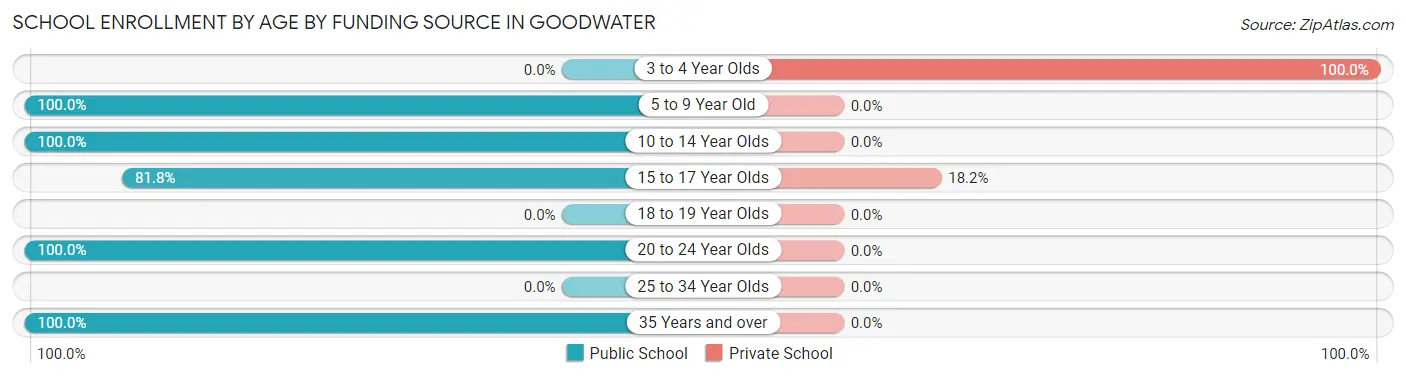
| Age Bracket | Public School | Private School |
| 3 to 4 Year Olds | 0 (0.0%) | 33 (100.0%) |
| 5 to 9 Year Old | 47 (100.0%) | 0 (0.0%) |
| 10 to 14 Year Olds | 57 (100.0%) | 0 (0.0%) |
| 15 to 17 Year Olds | 45 (81.8%) | 10 (18.2%) |
| 18 to 19 Year Olds | 0 (0.0%) | 0 (0.0%) |
| 20 to 24 Year Olds | 10 (100.0%) | 0 (0.0%) |
| 25 to 34 Year Olds | 0 (0.0%) | 0 (0.0%) |
| 35 Years and over | 14 (100.0%) | 0 (0.0%) |
| Total | 173 (80.1%) | 43 (19.9%) |
Educational Attainment by Field of Study in Goodwater
Education (28 | 56.0%), arts & humanities (13 | 26.0%), psychology (5 | 10.0%), liberal arts & history (3 | 6.0%), and science & technology (1 | 2.0%) are the most common fields of study among 50 individuals in Goodwater who have obtained a bachelor's degree or higher.
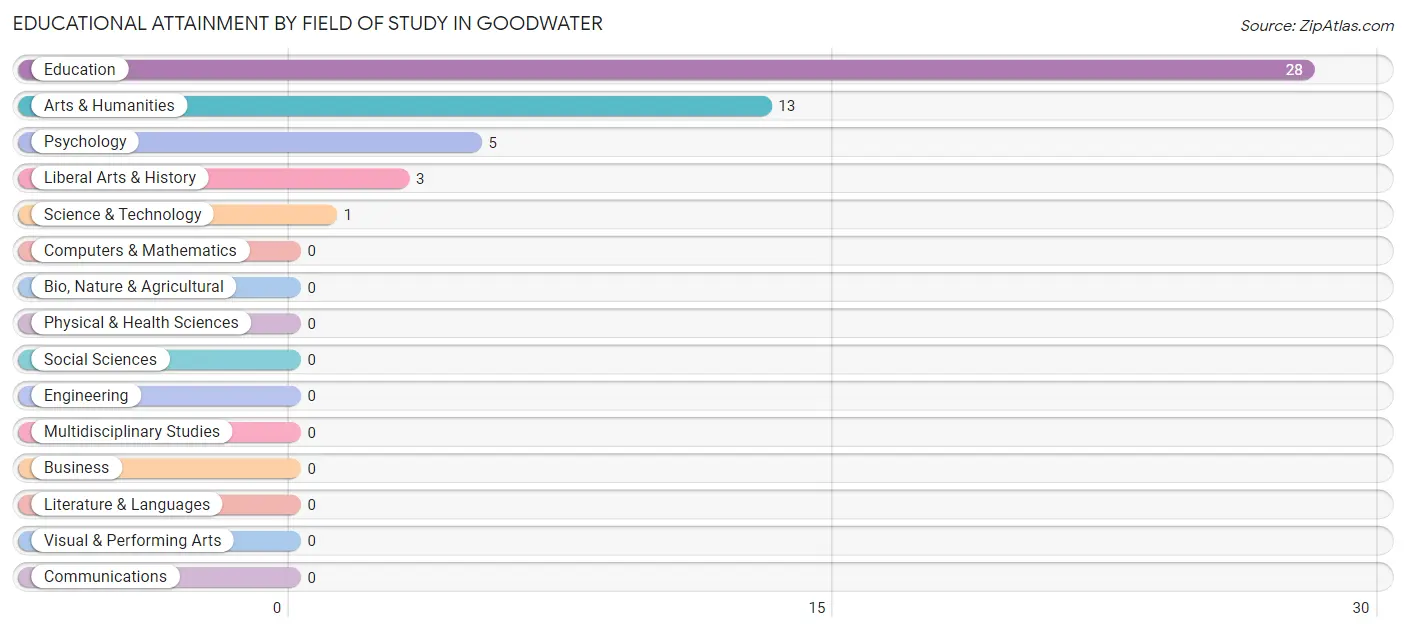
| Field of Study | # Graduates | % Graduates |
| Computers & Mathematics | 0 | 0.0% |
| Bio, Nature & Agricultural | 0 | 0.0% |
| Physical & Health Sciences | 0 | 0.0% |
| Psychology | 5 | 10.0% |
| Social Sciences | 0 | 0.0% |
| Engineering | 0 | 0.0% |
| Multidisciplinary Studies | 0 | 0.0% |
| Science & Technology | 1 | 2.0% |
| Business | 0 | 0.0% |
| Education | 28 | 56.0% |
| Literature & Languages | 0 | 0.0% |
| Liberal Arts & History | 3 | 6.0% |
| Visual & Performing Arts | 0 | 0.0% |
| Communications | 0 | 0.0% |
| Arts & Humanities | 13 | 26.0% |
| Total | 50 | 100.0% |
Transportation & Commute in Goodwater
Vehicle Availability by Sex in Goodwater
The most prevalent vehicle ownership categories in Goodwater are males with 2 vehicles (62, accounting for 37.3%) and females with 2 vehicles (16, making up 49.6%).
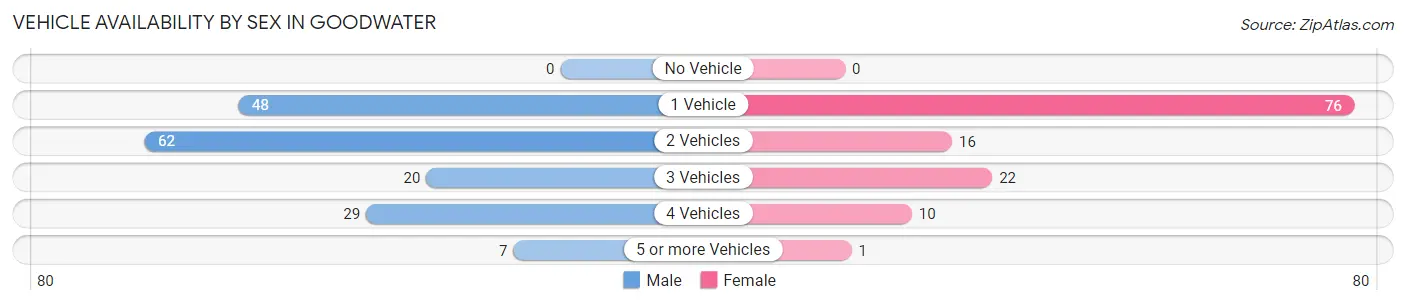
| Vehicles Available | Male | Female |
| No Vehicle | 0 (0.0%) | 0 (0.0%) |
| 1 Vehicle | 48 (28.9%) | 76 (60.8%) |
| 2 Vehicles | 62 (37.3%) | 16 (12.8%) |
| 3 Vehicles | 20 (12.0%) | 22 (17.6%) |
| 4 Vehicles | 29 (17.5%) | 10 (8.0%) |
| 5 or more Vehicles | 7 (4.2%) | 1 (0.8%) |
| Total | 166 (100.0%) | 125 (100.0%) |
Commute Time in Goodwater
The most frequently occuring commute durations in Goodwater are 30 to 34 minutes (62 commuters, 21.3%), 60 to 89 minutes (57 commuters, 19.6%), and 20 to 24 minutes (39 commuters, 13.4%).
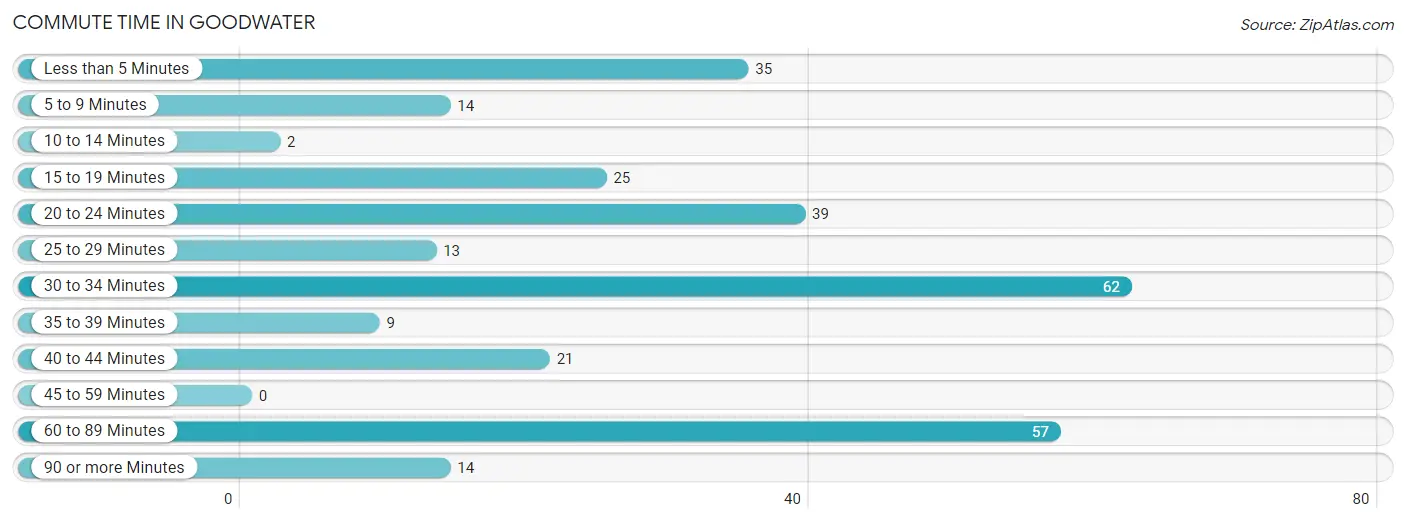
| Commute Time | # Commuters | % Commuters |
| Less than 5 Minutes | 35 | 12.0% |
| 5 to 9 Minutes | 14 | 4.8% |
| 10 to 14 Minutes | 2 | 0.7% |
| 15 to 19 Minutes | 25 | 8.6% |
| 20 to 24 Minutes | 39 | 13.4% |
| 25 to 29 Minutes | 13 | 4.5% |
| 30 to 34 Minutes | 62 | 21.3% |
| 35 to 39 Minutes | 9 | 3.1% |
| 40 to 44 Minutes | 21 | 7.2% |
| 45 to 59 Minutes | 0 | 0.0% |
| 60 to 89 Minutes | 57 | 19.6% |
| 90 or more Minutes | 14 | 4.8% |
Commute Time by Sex in Goodwater
The most common commute times in Goodwater are 30 to 34 minutes (46 commuters, 27.7%) for males and 60 to 89 minutes (37 commuters, 29.6%) for females.
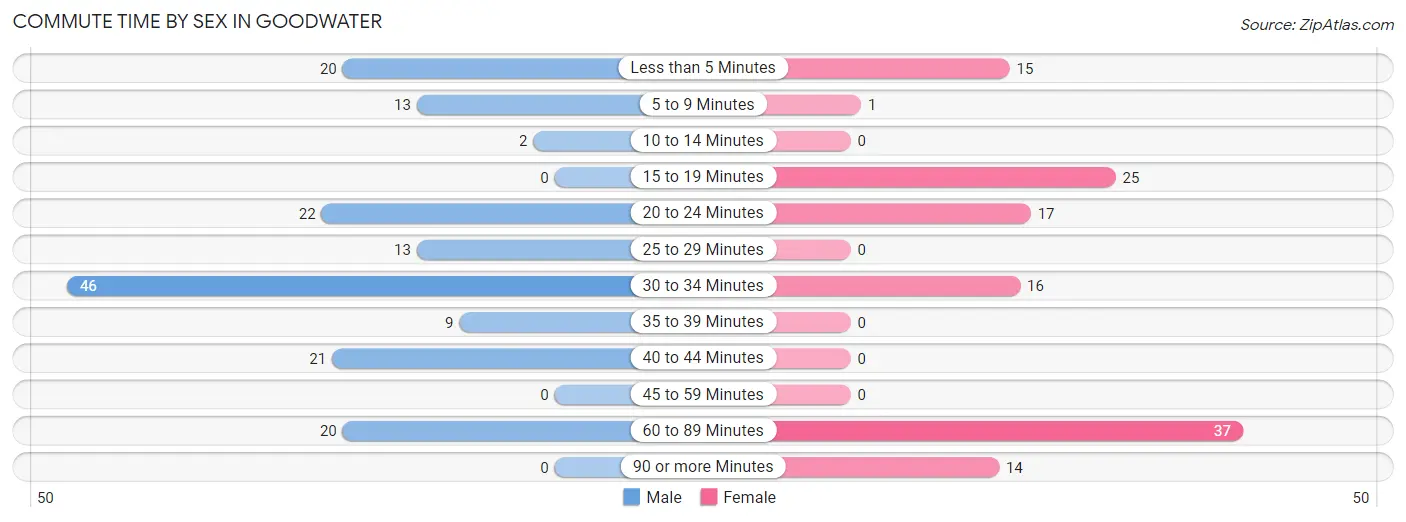
| Commute Time | Male | Female |
| Less than 5 Minutes | 20 (12.0%) | 15 (12.0%) |
| 5 to 9 Minutes | 13 (7.8%) | 1 (0.8%) |
| 10 to 14 Minutes | 2 (1.2%) | 0 (0.0%) |
| 15 to 19 Minutes | 0 (0.0%) | 25 (20.0%) |
| 20 to 24 Minutes | 22 (13.3%) | 17 (13.6%) |
| 25 to 29 Minutes | 13 (7.8%) | 0 (0.0%) |
| 30 to 34 Minutes | 46 (27.7%) | 16 (12.8%) |
| 35 to 39 Minutes | 9 (5.4%) | 0 (0.0%) |
| 40 to 44 Minutes | 21 (12.7%) | 0 (0.0%) |
| 45 to 59 Minutes | 0 (0.0%) | 0 (0.0%) |
| 60 to 89 Minutes | 20 (12.0%) | 37 (29.6%) |
| 90 or more Minutes | 0 (0.0%) | 14 (11.2%) |
Time of Departure to Work by Sex in Goodwater
The most frequent times of departure to work in Goodwater are 7:00 AM to 7:29 AM (27, 16.3%) for males and 6:00 AM to 6:29 AM (30, 24.0%) for females.
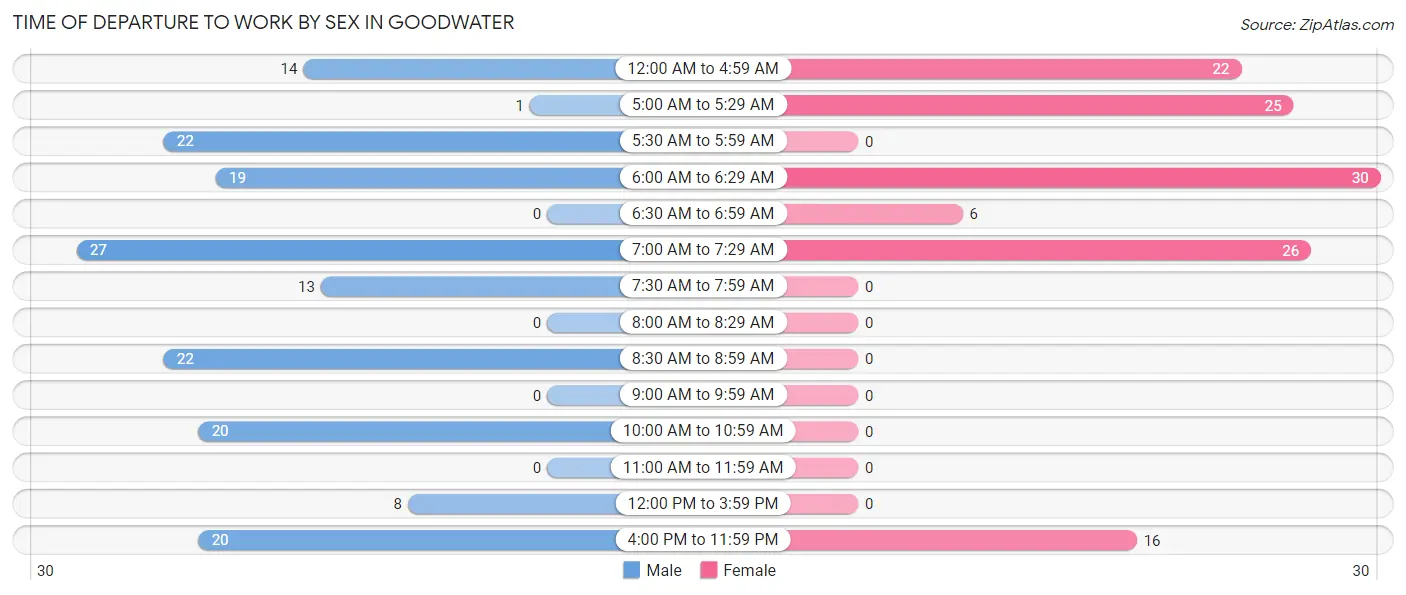
| Time of Departure | Male | Female |
| 12:00 AM to 4:59 AM | 14 (8.4%) | 22 (17.6%) |
| 5:00 AM to 5:29 AM | 1 (0.6%) | 25 (20.0%) |
| 5:30 AM to 5:59 AM | 22 (13.3%) | 0 (0.0%) |
| 6:00 AM to 6:29 AM | 19 (11.5%) | 30 (24.0%) |
| 6:30 AM to 6:59 AM | 0 (0.0%) | 6 (4.8%) |
| 7:00 AM to 7:29 AM | 27 (16.3%) | 26 (20.8%) |
| 7:30 AM to 7:59 AM | 13 (7.8%) | 0 (0.0%) |
| 8:00 AM to 8:29 AM | 0 (0.0%) | 0 (0.0%) |
| 8:30 AM to 8:59 AM | 22 (13.3%) | 0 (0.0%) |
| 9:00 AM to 9:59 AM | 0 (0.0%) | 0 (0.0%) |
| 10:00 AM to 10:59 AM | 20 (12.0%) | 0 (0.0%) |
| 11:00 AM to 11:59 AM | 0 (0.0%) | 0 (0.0%) |
| 12:00 PM to 3:59 PM | 8 (4.8%) | 0 (0.0%) |
| 4:00 PM to 11:59 PM | 20 (12.0%) | 16 (12.8%) |
| Total | 166 (100.0%) | 125 (100.0%) |
Housing Occupancy in Goodwater
Occupancy by Ownership in Goodwater
Of the total 481 dwellings in Goodwater, owner-occupied units account for 267 (55.5%), while renter-occupied units make up 214 (44.5%).
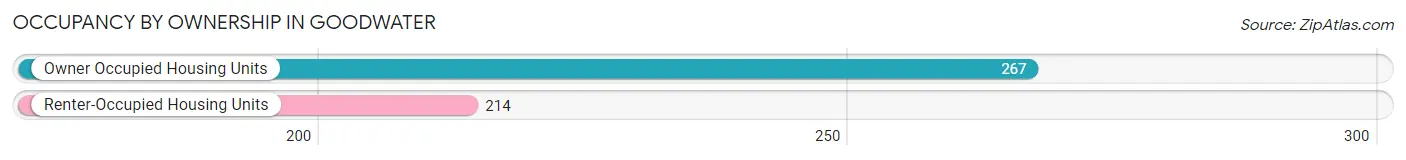
| Occupancy | # Housing Units | % Housing Units |
| Owner Occupied Housing Units | 267 | 55.5% |
| Renter-Occupied Housing Units | 214 | 44.5% |
| Total Occupied Housing Units | 481 | 100.0% |
Occupancy by Household Size in Goodwater
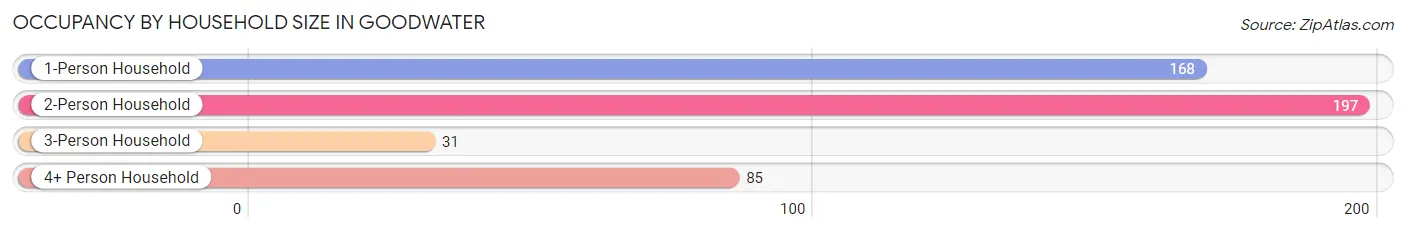
| Household Size | # Housing Units | % Housing Units |
| 1-Person Household | 168 | 34.9% |
| 2-Person Household | 197 | 41.0% |
| 3-Person Household | 31 | 6.4% |
| 4+ Person Household | 85 | 17.7% |
| Total Housing Units | 481 | 100.0% |
Occupancy by Ownership by Household Size in Goodwater
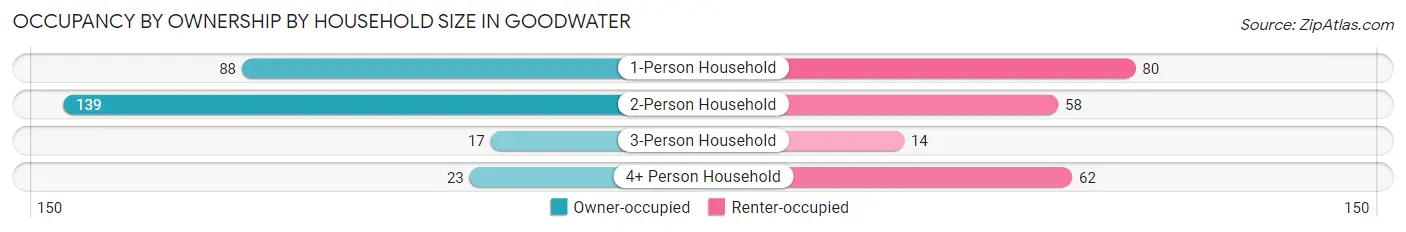
| Household Size | Owner-occupied | Renter-occupied |
| 1-Person Household | 88 (52.4%) | 80 (47.6%) |
| 2-Person Household | 139 (70.6%) | 58 (29.4%) |
| 3-Person Household | 17 (54.8%) | 14 (45.2%) |
| 4+ Person Household | 23 (27.1%) | 62 (72.9%) |
| Total Housing Units | 267 (55.5%) | 214 (44.5%) |
Occupancy by Educational Attainment in Goodwater
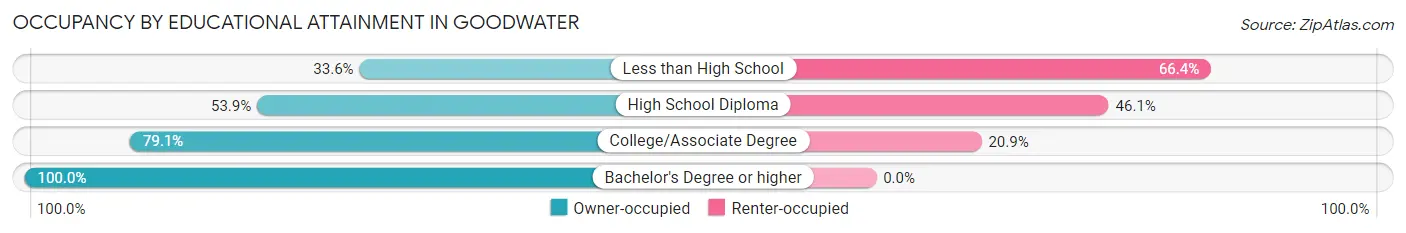
| Household Size | Owner-occupied | Renter-occupied |
| Less than High School | 39 (33.6%) | 77 (66.4%) |
| High School Diploma | 138 (53.9%) | 118 (46.1%) |
| College/Associate Degree | 72 (79.1%) | 19 (20.9%) |
| Bachelor's Degree or higher | 18 (100.0%) | 0 (0.0%) |
Occupancy by Age of Householder in Goodwater
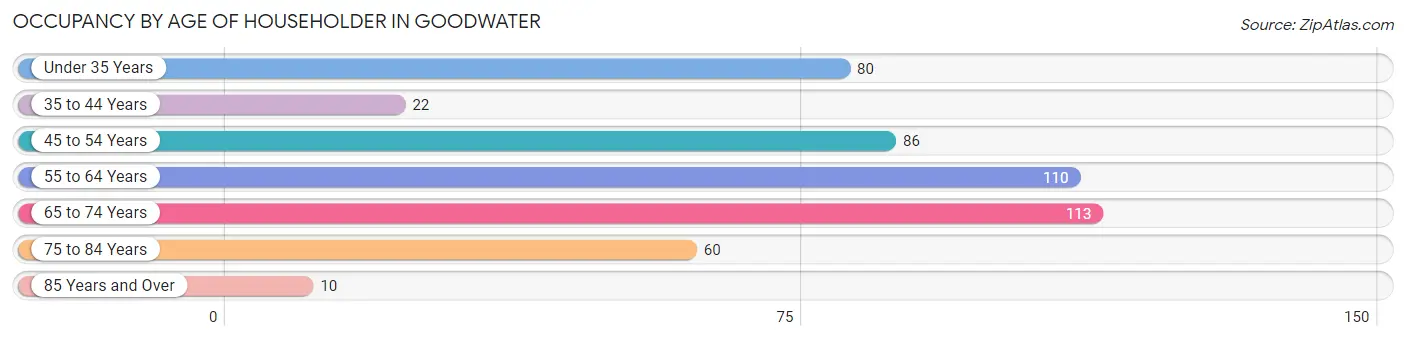
| Age Bracket | # Households | % Households |
| Under 35 Years | 80 | 16.6% |
| 35 to 44 Years | 22 | 4.6% |
| 45 to 54 Years | 86 | 17.9% |
| 55 to 64 Years | 110 | 22.9% |
| 65 to 74 Years | 113 | 23.5% |
| 75 to 84 Years | 60 | 12.5% |
| 85 Years and Over | 10 | 2.1% |
| Total | 481 | 100.0% |
Housing Finances in Goodwater
Median Income by Occupancy in Goodwater
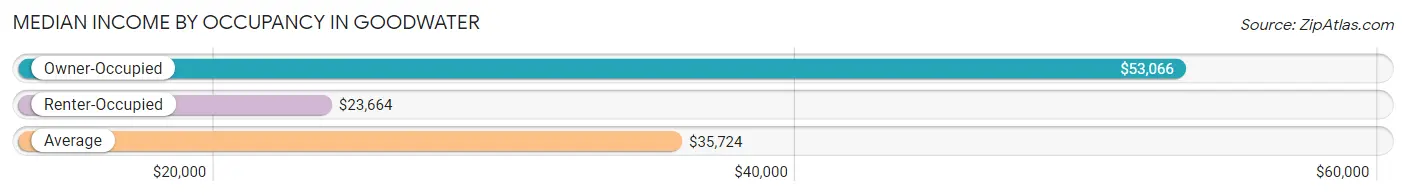
| Occupancy Type | # Households | Median Income |
| Owner-Occupied | 267 (55.5%) | $53,066 |
| Renter-Occupied | 214 (44.5%) | $23,664 |
| Average | 481 (100.0%) | $35,724 |
Occupancy by Householder Income Bracket in Goodwater
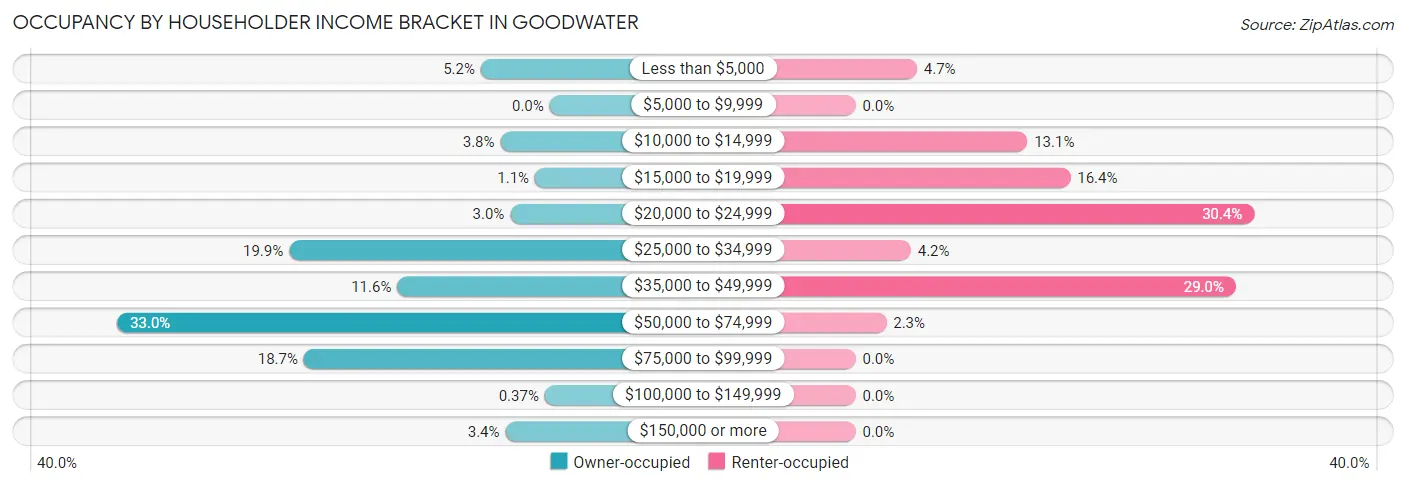
| Income Bracket | Owner-occupied | Renter-occupied |
| Less than $5,000 | 14 (5.2%) | 10 (4.7%) |
| $5,000 to $9,999 | 0 (0.0%) | 0 (0.0%) |
| $10,000 to $14,999 | 10 (3.7%) | 28 (13.1%) |
| $15,000 to $19,999 | 3 (1.1%) | 35 (16.4%) |
| $20,000 to $24,999 | 8 (3.0%) | 65 (30.4%) |
| $25,000 to $34,999 | 53 (19.9%) | 9 (4.2%) |
| $35,000 to $49,999 | 31 (11.6%) | 62 (29.0%) |
| $50,000 to $74,999 | 88 (33.0%) | 5 (2.3%) |
| $75,000 to $99,999 | 50 (18.7%) | 0 (0.0%) |
| $100,000 to $149,999 | 1 (0.4%) | 0 (0.0%) |
| $150,000 or more | 9 (3.4%) | 0 (0.0%) |
| Total | 267 (100.0%) | 214 (100.0%) |
Monthly Housing Cost Tiers in Goodwater
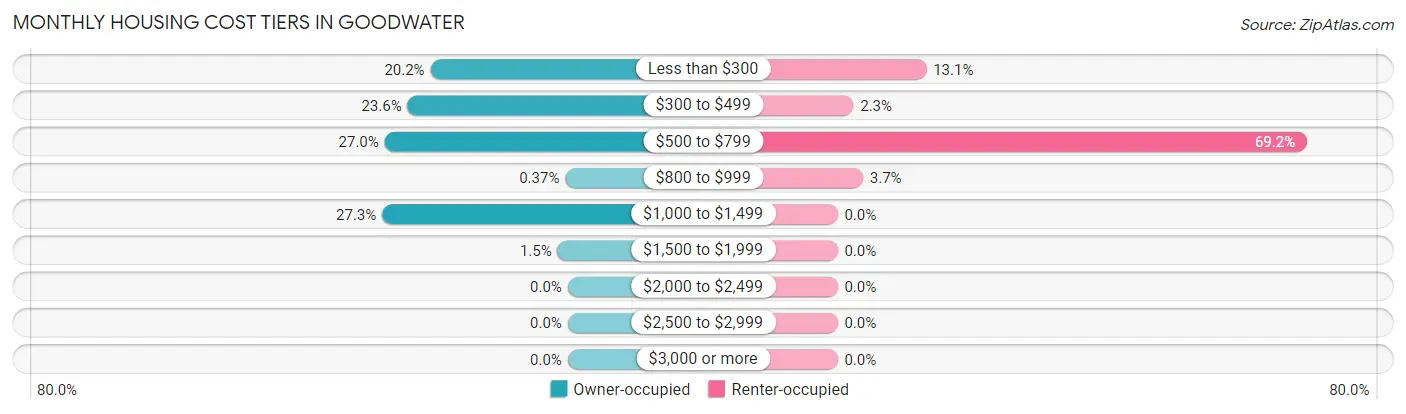
| Monthly Cost | Owner-occupied | Renter-occupied |
| Less than $300 | 54 (20.2%) | 28 (13.1%) |
| $300 to $499 | 63 (23.6%) | 5 (2.3%) |
| $500 to $799 | 72 (27.0%) | 148 (69.2%) |
| $800 to $999 | 1 (0.4%) | 8 (3.7%) |
| $1,000 to $1,499 | 73 (27.3%) | 0 (0.0%) |
| $1,500 to $1,999 | 4 (1.5%) | 0 (0.0%) |
| $2,000 to $2,499 | 0 (0.0%) | 0 (0.0%) |
| $2,500 to $2,999 | 0 (0.0%) | 0 (0.0%) |
| $3,000 or more | 0 (0.0%) | 0 (0.0%) |
| Total | 267 (100.0%) | 214 (100.0%) |
Physical Housing Characteristics in Goodwater
Housing Structures in Goodwater
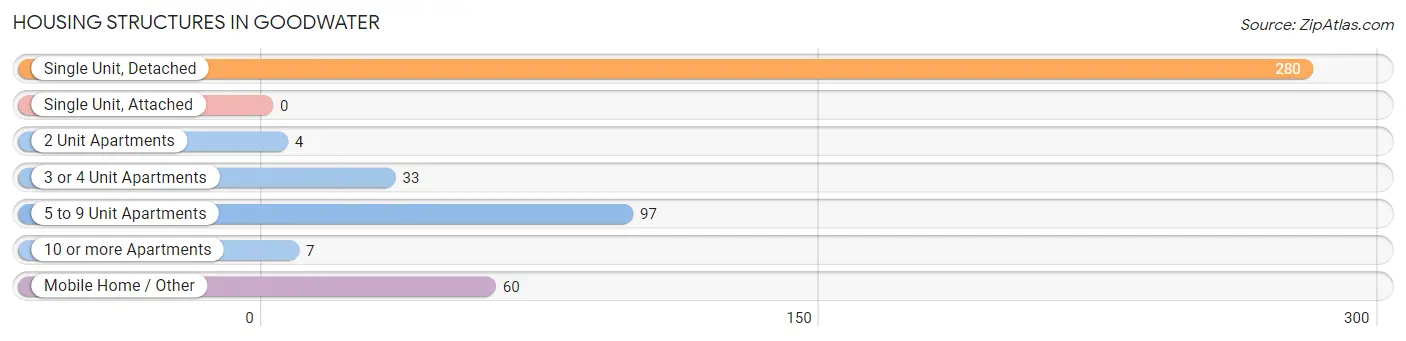
| Structure Type | # Housing Units | % Housing Units |
| Single Unit, Detached | 280 | 58.2% |
| Single Unit, Attached | 0 | 0.0% |
| 2 Unit Apartments | 4 | 0.8% |
| 3 or 4 Unit Apartments | 33 | 6.9% |
| 5 to 9 Unit Apartments | 97 | 20.2% |
| 10 or more Apartments | 7 | 1.5% |
| Mobile Home / Other | 60 | 12.5% |
| Total | 481 | 100.0% |
Housing Structures by Occupancy in Goodwater
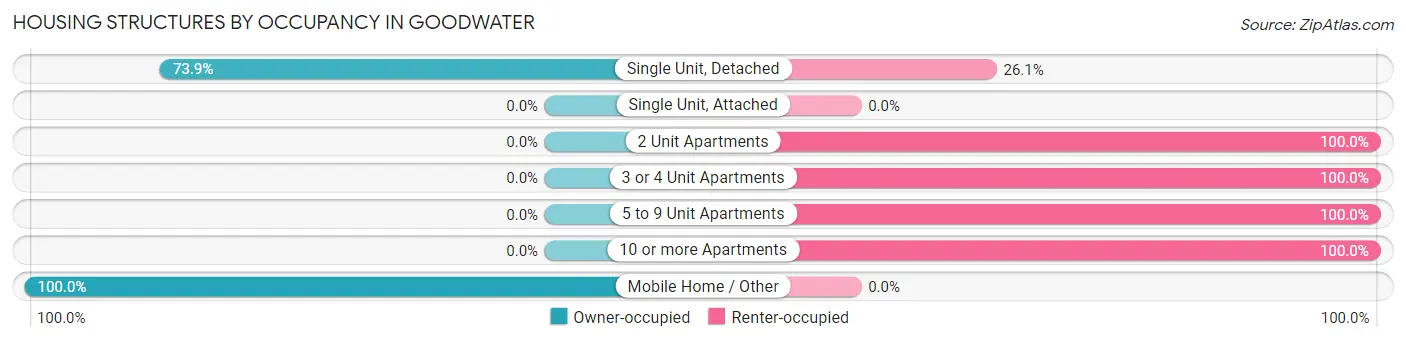
| Structure Type | Owner-occupied | Renter-occupied |
| Single Unit, Detached | 207 (73.9%) | 73 (26.1%) |
| Single Unit, Attached | 0 (0.0%) | 0 (0.0%) |
| 2 Unit Apartments | 0 (0.0%) | 4 (100.0%) |
| 3 or 4 Unit Apartments | 0 (0.0%) | 33 (100.0%) |
| 5 to 9 Unit Apartments | 0 (0.0%) | 97 (100.0%) |
| 10 or more Apartments | 0 (0.0%) | 7 (100.0%) |
| Mobile Home / Other | 60 (100.0%) | 0 (0.0%) |
| Total | 267 (55.5%) | 214 (44.5%) |
Housing Structures by Number of Rooms in Goodwater
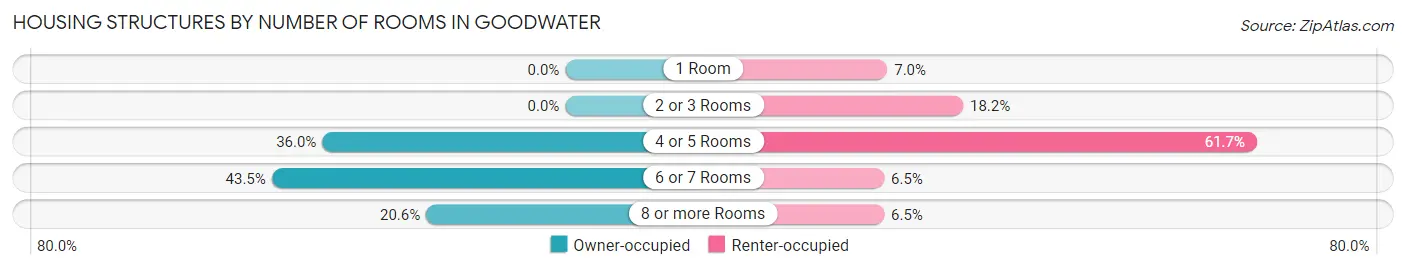
| Number of Rooms | Owner-occupied | Renter-occupied |
| 1 Room | 0 (0.0%) | 15 (7.0%) |
| 2 or 3 Rooms | 0 (0.0%) | 39 (18.2%) |
| 4 or 5 Rooms | 96 (36.0%) | 132 (61.7%) |
| 6 or 7 Rooms | 116 (43.4%) | 14 (6.5%) |
| 8 or more Rooms | 55 (20.6%) | 14 (6.5%) |
| Total | 267 (100.0%) | 214 (100.0%) |
Housing Structure by Heating Type in Goodwater
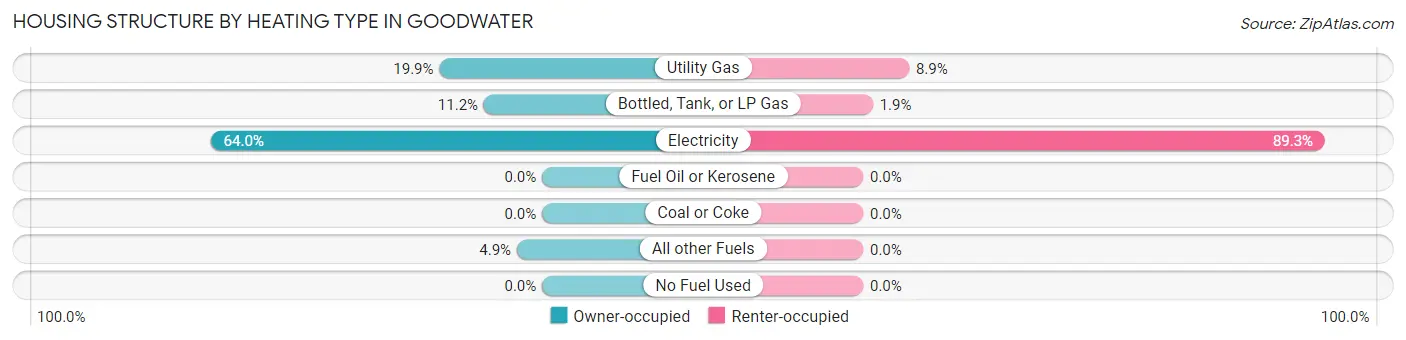
| Heating Type | Owner-occupied | Renter-occupied |
| Utility Gas | 53 (19.9%) | 19 (8.9%) |
| Bottled, Tank, or LP Gas | 30 (11.2%) | 4 (1.9%) |
| Electricity | 171 (64.0%) | 191 (89.2%) |
| Fuel Oil or Kerosene | 0 (0.0%) | 0 (0.0%) |
| Coal or Coke | 0 (0.0%) | 0 (0.0%) |
| All other Fuels | 13 (4.9%) | 0 (0.0%) |
| No Fuel Used | 0 (0.0%) | 0 (0.0%) |
| Total | 267 (100.0%) | 214 (100.0%) |
Household Vehicle Usage in Goodwater
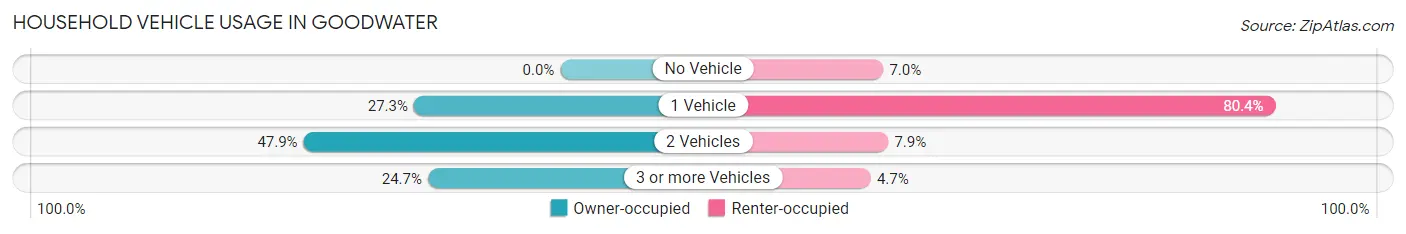
| Vehicles per Household | Owner-occupied | Renter-occupied |
| No Vehicle | 0 (0.0%) | 15 (7.0%) |
| 1 Vehicle | 73 (27.3%) | 172 (80.4%) |
| 2 Vehicles | 128 (47.9%) | 17 (7.9%) |
| 3 or more Vehicles | 66 (24.7%) | 10 (4.7%) |
| Total | 267 (100.0%) | 214 (100.0%) |
Real Estate & Mortgages in Goodwater
Real Estate and Mortgage Overview in Goodwater
| Characteristic | Without Mortgage | With Mortgage |
| Housing Units | 148 | 119 |
| Median Property Value | $56,300 | $103,200 |
| Median Household Income | $34,714 | $7 |
| Monthly Housing Costs | $448 | $0 |
| Real Estate Taxes | $199 | $98 |
Property Value by Mortgage Status in Goodwater
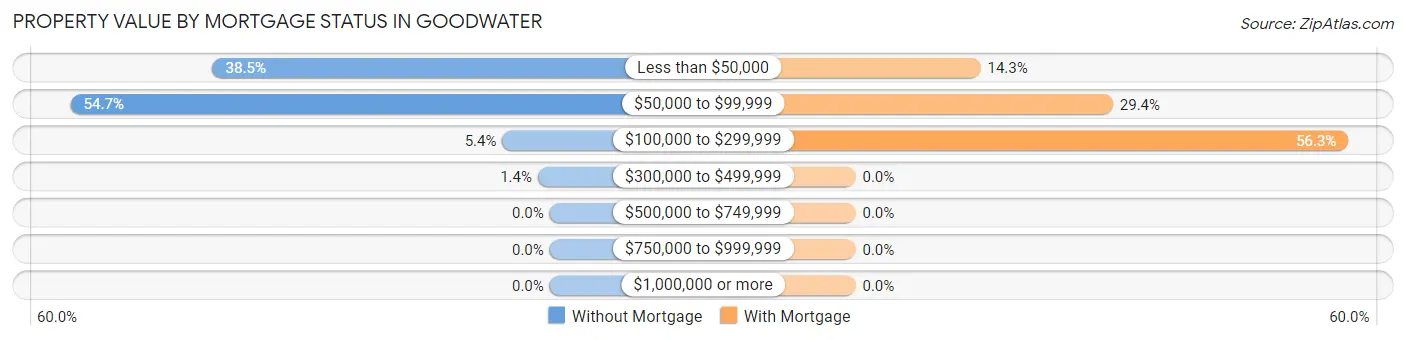
| Property Value | Without Mortgage | With Mortgage |
| Less than $50,000 | 57 (38.5%) | 17 (14.3%) |
| $50,000 to $99,999 | 81 (54.7%) | 35 (29.4%) |
| $100,000 to $299,999 | 8 (5.4%) | 67 (56.3%) |
| $300,000 to $499,999 | 2 (1.3%) | 0 (0.0%) |
| $500,000 to $749,999 | 0 (0.0%) | 0 (0.0%) |
| $750,000 to $999,999 | 0 (0.0%) | 0 (0.0%) |
| $1,000,000 or more | 0 (0.0%) | 0 (0.0%) |
| Total | 148 (100.0%) | 119 (100.0%) |
Household Income by Mortgage Status in Goodwater
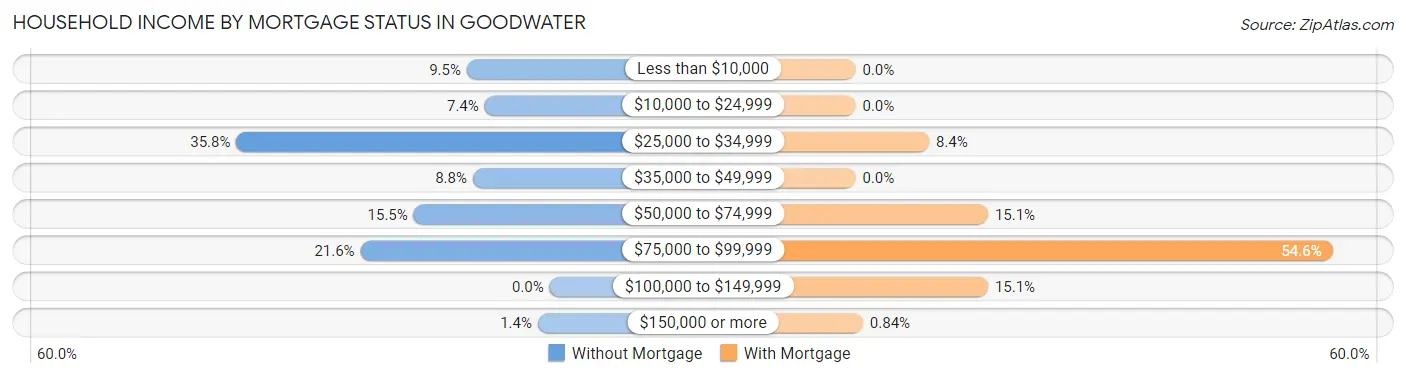
| Household Income | Without Mortgage | With Mortgage |
| Less than $10,000 | 14 (9.5%) | 0 (0.0%) |
| $10,000 to $24,999 | 11 (7.4%) | 0 (0.0%) |
| $25,000 to $34,999 | 53 (35.8%) | 10 (8.4%) |
| $35,000 to $49,999 | 13 (8.8%) | 0 (0.0%) |
| $50,000 to $74,999 | 23 (15.5%) | 18 (15.1%) |
| $75,000 to $99,999 | 32 (21.6%) | 65 (54.6%) |
| $100,000 to $149,999 | 0 (0.0%) | 18 (15.1%) |
| $150,000 or more | 2 (1.3%) | 1 (0.8%) |
| Total | 148 (100.0%) | 119 (100.0%) |
Property Value to Household Income Ratio in Goodwater
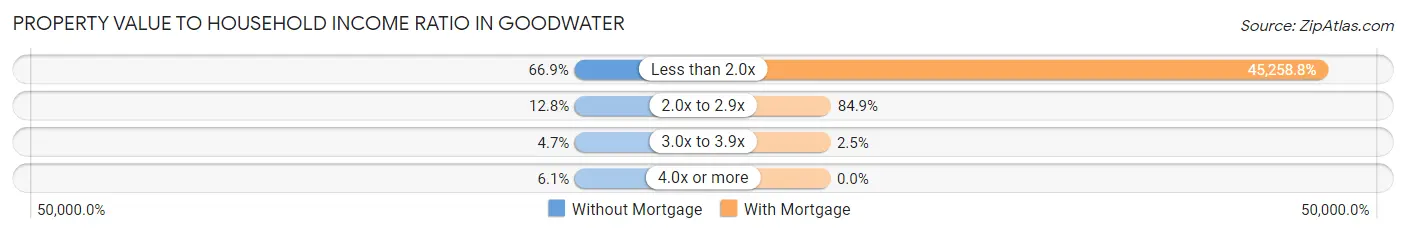
| Value-to-Income Ratio | Without Mortgage | With Mortgage |
| Less than 2.0x | 99 (66.9%) | 53,858 (45,258.8%) |
| 2.0x to 2.9x | 19 (12.8%) | 101 (84.9%) |
| 3.0x to 3.9x | 7 (4.7%) | 3 (2.5%) |
| 4.0x or more | 9 (6.1%) | 0 (0.0%) |
| Total | 148 (100.0%) | 119 (100.0%) |
Real Estate Taxes by Mortgage Status in Goodwater
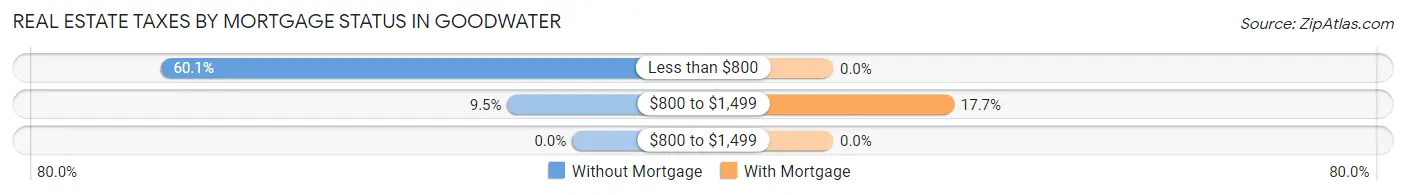
| Property Taxes | Without Mortgage | With Mortgage |
| Less than $800 | 89 (60.1%) | 0 (0.0%) |
| $800 to $1,499 | 14 (9.5%) | 21 (17.6%) |
| $800 to $1,499 | 0 (0.0%) | 0 (0.0%) |
| Total | 148 (100.0%) | 119 (100.0%) |
Health & Disability in Goodwater
Health Insurance Coverage by Age in Goodwater
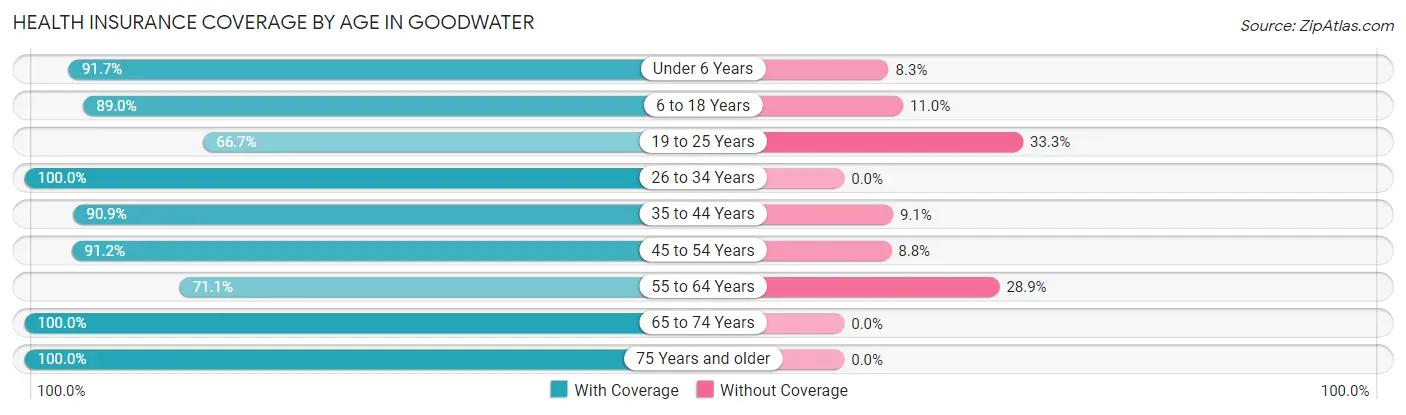
| Age Bracket | With Coverage | Without Coverage |
| Under 6 Years | 122 (91.7%) | 11 (8.3%) |
| 6 to 18 Years | 138 (89.0%) | 17 (11.0%) |
| 19 to 25 Years | 38 (66.7%) | 19 (33.3%) |
| 26 to 34 Years | 76 (100.0%) | 0 (0.0%) |
| 35 to 44 Years | 40 (90.9%) | 4 (9.1%) |
| 45 to 54 Years | 135 (91.2%) | 13 (8.8%) |
| 55 to 64 Years | 113 (71.1%) | 46 (28.9%) |
| 65 to 74 Years | 194 (100.0%) | 0 (0.0%) |
| 75 Years and older | 74 (100.0%) | 0 (0.0%) |
| Total | 930 (89.4%) | 110 (10.6%) |
Health Insurance Coverage by Citizenship Status in Goodwater
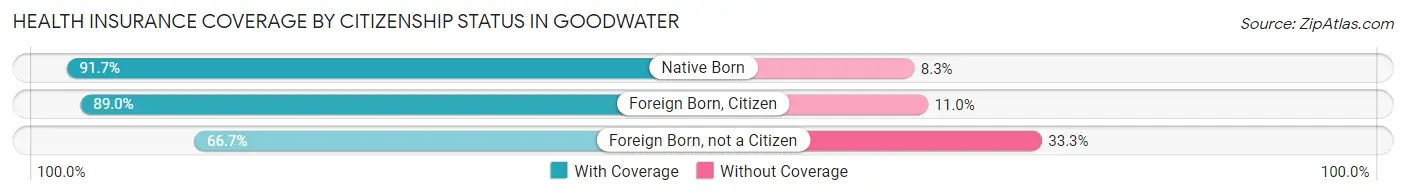
| Citizenship Status | With Coverage | Without Coverage |
| Native Born | 122 (91.7%) | 11 (8.3%) |
| Foreign Born, Citizen | 138 (89.0%) | 17 (11.0%) |
| Foreign Born, not a Citizen | 38 (66.7%) | 19 (33.3%) |
Health Insurance Coverage by Household Income in Goodwater
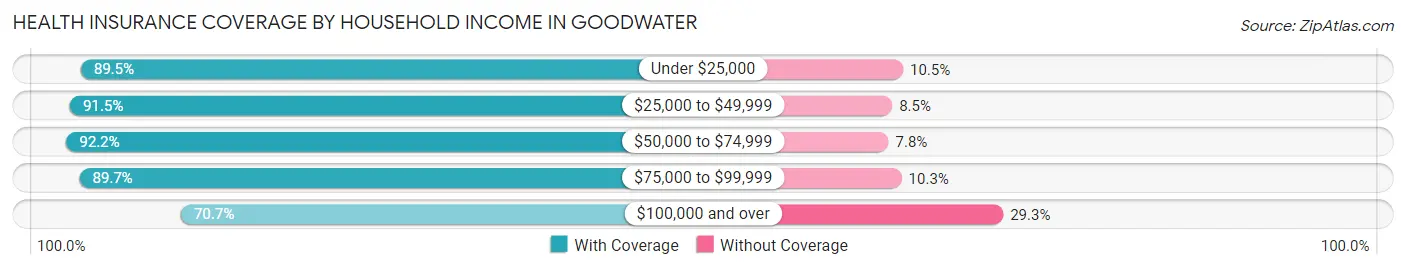
| Household Income | With Coverage | Without Coverage |
| Under $25,000 | 382 (89.5%) | 45 (10.5%) |
| $25,000 to $49,999 | 258 (91.5%) | 24 (8.5%) |
| $50,000 to $74,999 | 153 (92.2%) | 13 (7.8%) |
| $75,000 to $99,999 | 96 (89.7%) | 11 (10.3%) |
| $100,000 and over | 41 (70.7%) | 17 (29.3%) |
Public vs Private Health Insurance Coverage by Age in Goodwater
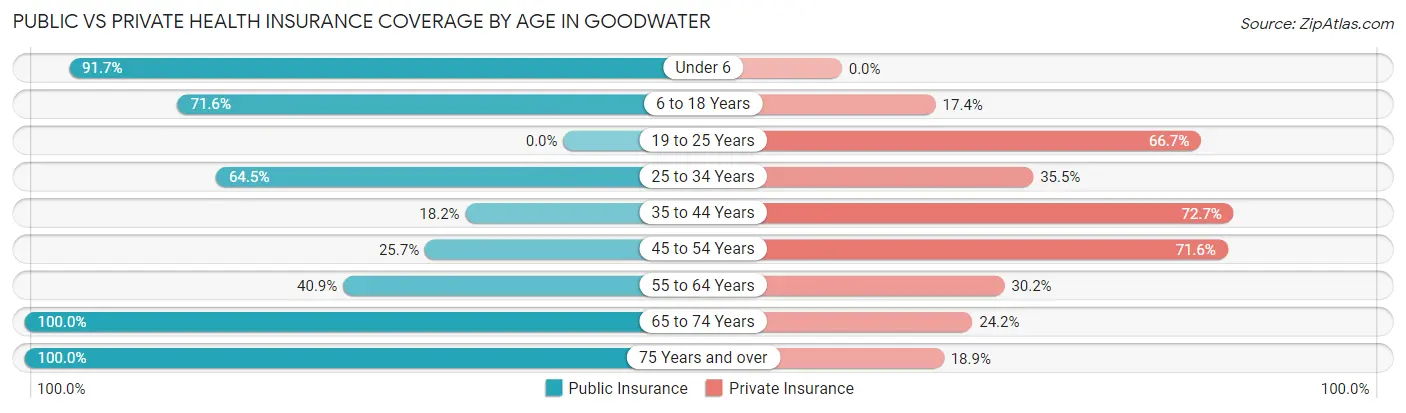
| Age Bracket | Public Insurance | Private Insurance |
| Under 6 | 122 (91.7%) | 0 (0.0%) |
| 6 to 18 Years | 111 (71.6%) | 27 (17.4%) |
| 19 to 25 Years | 0 (0.0%) | 38 (66.7%) |
| 25 to 34 Years | 49 (64.5%) | 27 (35.5%) |
| 35 to 44 Years | 8 (18.2%) | 32 (72.7%) |
| 45 to 54 Years | 38 (25.7%) | 106 (71.6%) |
| 55 to 64 Years | 65 (40.9%) | 48 (30.2%) |
| 65 to 74 Years | 194 (100.0%) | 47 (24.2%) |
| 75 Years and over | 74 (100.0%) | 14 (18.9%) |
| Total | 661 (63.6%) | 339 (32.6%) |
Disability Status by Sex by Age in Goodwater
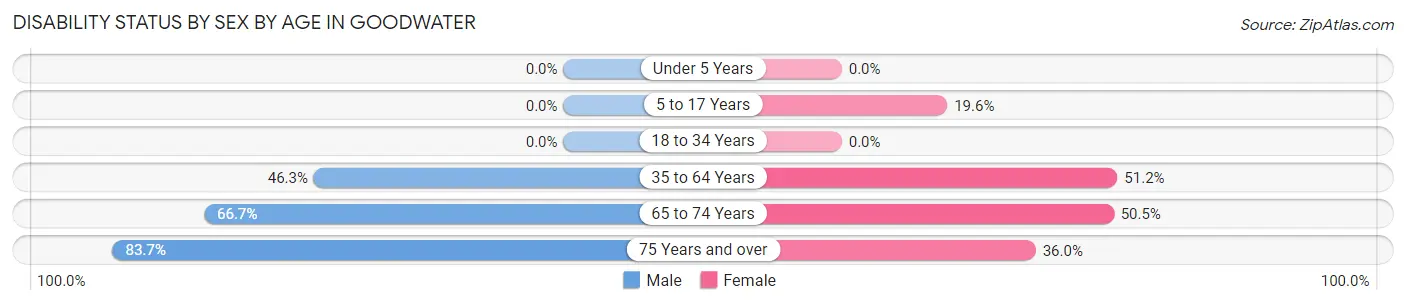
| Age Bracket | Male | Female |
| Under 5 Years | 0 (0.0%) | 0 (0.0%) |
| 5 to 17 Years | 0 (0.0%) | 18 (19.6%) |
| 18 to 34 Years | 0 (0.0%) | 0 (0.0%) |
| 35 to 64 Years | 63 (46.3%) | 110 (51.2%) |
| 65 to 74 Years | 58 (66.7%) | 54 (50.5%) |
| 75 Years and over | 41 (83.7%) | 9 (36.0%) |
Disability Class by Sex by Age in Goodwater
Disability Class: Hearing Difficulty
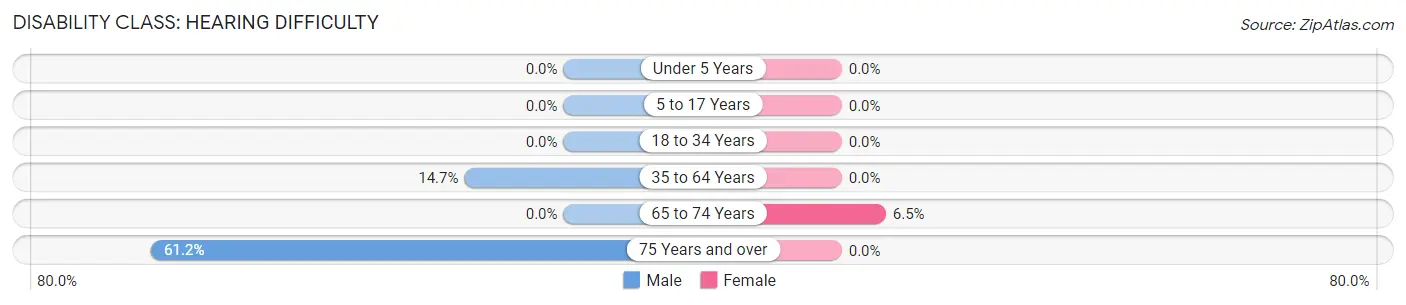
| Age Bracket | Male | Female |
| Under 5 Years | 0 (0.0%) | 0 (0.0%) |
| 5 to 17 Years | 0 (0.0%) | 0 (0.0%) |
| 18 to 34 Years | 0 (0.0%) | 0 (0.0%) |
| 35 to 64 Years | 20 (14.7%) | 0 (0.0%) |
| 65 to 74 Years | 0 (0.0%) | 7 (6.5%) |
| 75 Years and over | 30 (61.2%) | 0 (0.0%) |
Disability Class: Vision Difficulty
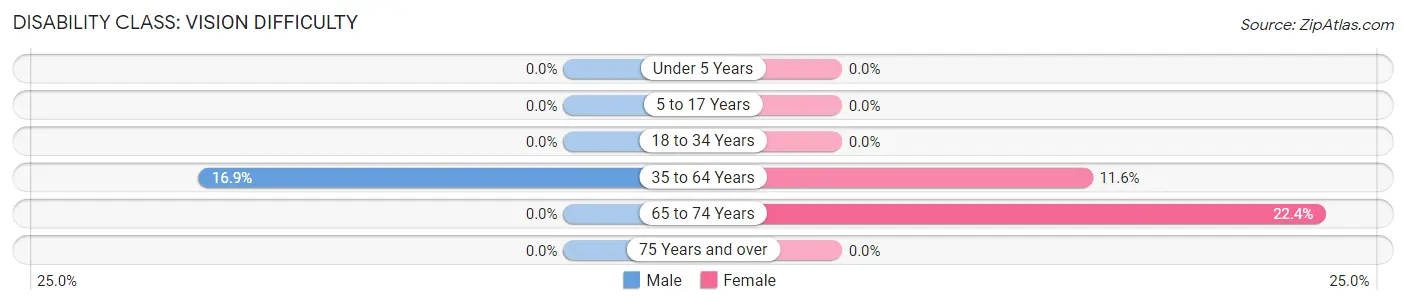
| Age Bracket | Male | Female |
| Under 5 Years | 0 (0.0%) | 0 (0.0%) |
| 5 to 17 Years | 0 (0.0%) | 0 (0.0%) |
| 18 to 34 Years | 0 (0.0%) | 0 (0.0%) |
| 35 to 64 Years | 23 (16.9%) | 25 (11.6%) |
| 65 to 74 Years | 0 (0.0%) | 24 (22.4%) |
| 75 Years and over | 0 (0.0%) | 0 (0.0%) |
Disability Class: Cognitive Difficulty
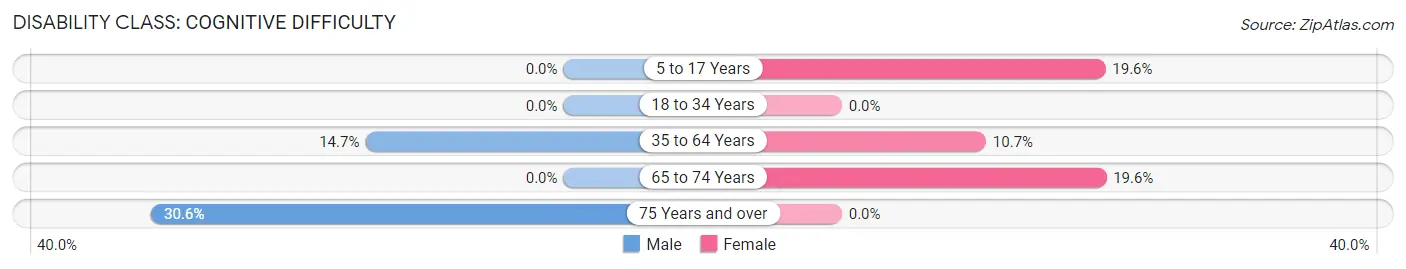
| Age Bracket | Male | Female |
| 5 to 17 Years | 0 (0.0%) | 18 (19.6%) |
| 18 to 34 Years | 0 (0.0%) | 0 (0.0%) |
| 35 to 64 Years | 20 (14.7%) | 23 (10.7%) |
| 65 to 74 Years | 0 (0.0%) | 21 (19.6%) |
| 75 Years and over | 15 (30.6%) | 0 (0.0%) |
Disability Class: Ambulatory Difficulty
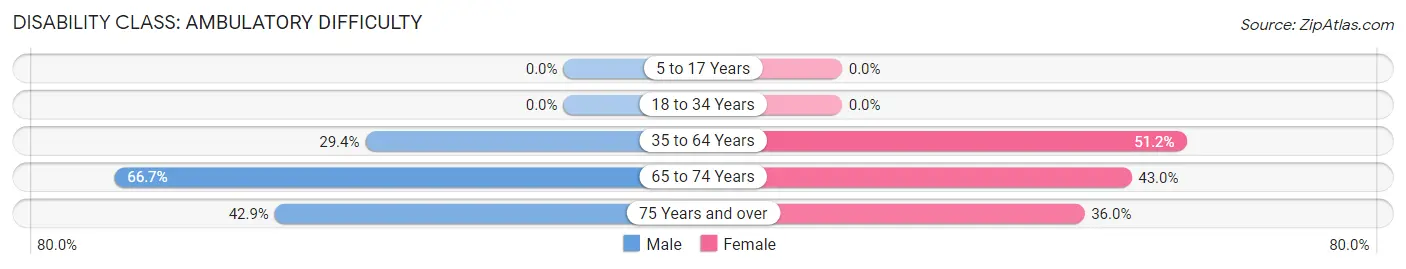
| Age Bracket | Male | Female |
| 5 to 17 Years | 0 (0.0%) | 0 (0.0%) |
| 18 to 34 Years | 0 (0.0%) | 0 (0.0%) |
| 35 to 64 Years | 40 (29.4%) | 110 (51.2%) |
| 65 to 74 Years | 58 (66.7%) | 46 (43.0%) |
| 75 Years and over | 21 (42.9%) | 9 (36.0%) |
Disability Class: Self-Care Difficulty
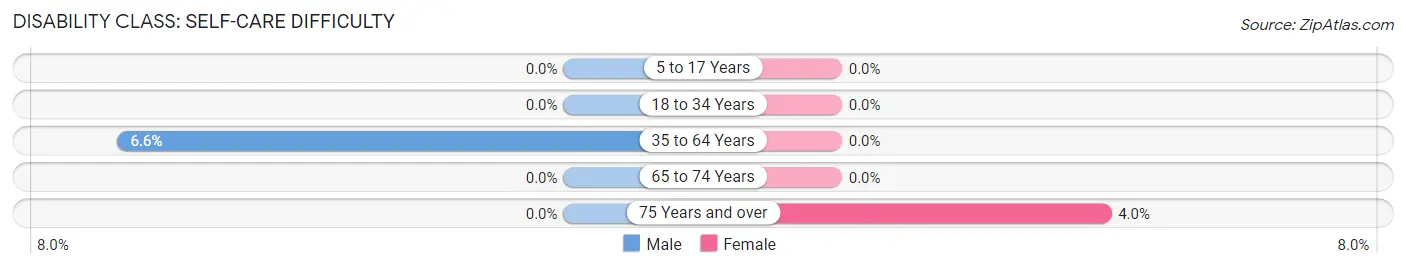
| Age Bracket | Male | Female |
| 5 to 17 Years | 0 (0.0%) | 0 (0.0%) |
| 18 to 34 Years | 0 (0.0%) | 0 (0.0%) |
| 35 to 64 Years | 9 (6.6%) | 0 (0.0%) |
| 65 to 74 Years | 0 (0.0%) | 0 (0.0%) |
| 75 Years and over | 0 (0.0%) | 1 (4.0%) |
Technology Access in Goodwater
Computing Device Access in Goodwater
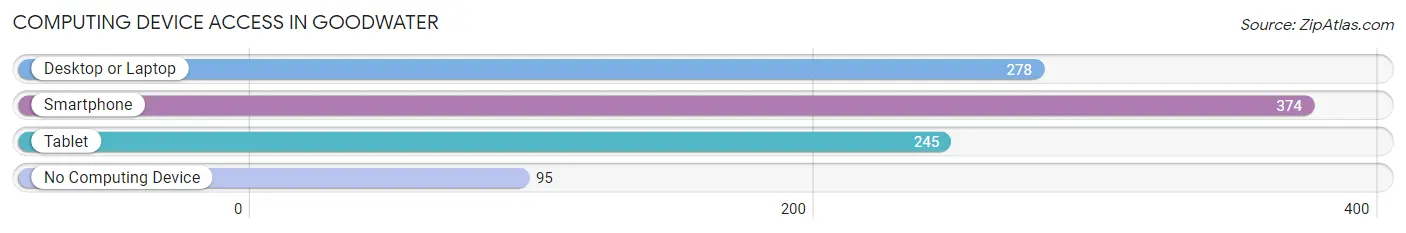
| Device Type | # Households | % Households |
| Desktop or Laptop | 278 | 57.8% |
| Smartphone | 374 | 77.7% |
| Tablet | 245 | 50.9% |
| No Computing Device | 95 | 19.8% |
| Total | 481 | 100.0% |
Internet Access in Goodwater
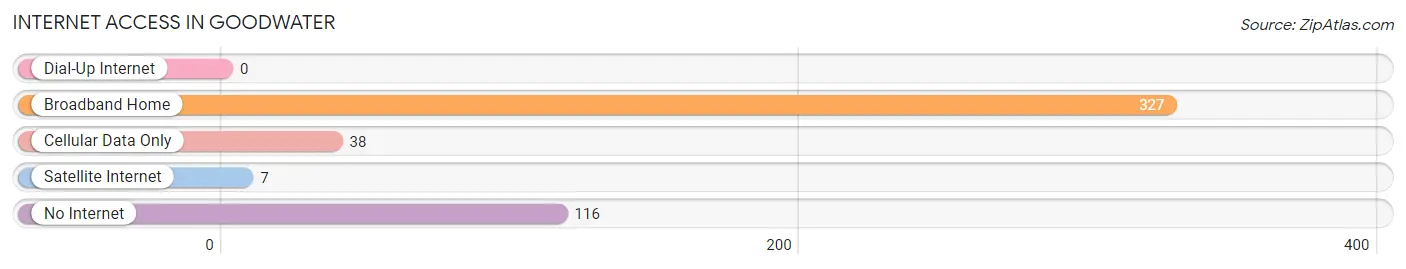
| Internet Type | # Households | % Households |
| Dial-Up Internet | 0 | 0.0% |
| Broadband Home | 327 | 68.0% |
| Cellular Data Only | 38 | 7.9% |
| Satellite Internet | 7 | 1.5% |
| No Internet | 116 | 24.1% |
| Total | 481 | 100.0% |
Goodwater Summary
Goodwater, Alabama is a small town located in Coosa County, Alabama. It is situated on the banks of the Coosa River, and is part of the Montgomery Metropolitan Statistical Area. The town has a population of 1,717 people, according to the 2010 census.
History
Goodwater was founded in 1832 by a group of settlers from Georgia. The town was originally known as "Goodwater Creek," and was named after the nearby creek of the same name. The town was incorporated in 1837, and the first post office was established in 1838.
Goodwater was an important stop on the stagecoach route between Montgomery and Columbus, Georgia. The town was also a major trading center for the surrounding area. In the late 19th century, the town was home to several cotton gins, sawmills, and gristmills.
Geography
Goodwater is located in the foothills of the Appalachian Mountains, and is situated on the banks of the Coosa River. The town is located at an elevation of 545 feet above sea level. The climate is humid subtropical, with hot summers and mild winters.
Economy
Goodwater's economy is largely based on agriculture and tourism. The town is home to several farms, which produce a variety of crops, including cotton, corn, soybeans, and peanuts. The town is also home to several tourist attractions, including the Coosa River Wildlife Management Area, the Coosa River Canoe Trail, and the Goodwater Country Club.
Demographics
According to the 2010 census, Goodwater has a population of 1,717 people. The racial makeup of the town is 79.2% White, 17.7% African American, 0.5% Native American, 0.3% Asian, 0.1% Pacific Islander, 0.7% from other races, and 1.5% from two or more races. The median household income is $30,938, and the median family income is $37,813.
Goodwater is a small town with a rich history and a vibrant economy. The town is home to a diverse population, and offers a variety of attractions and activities for visitors and residents alike. Goodwater is a great place to live, work, and play.
Common Questions
What is Per Capita Income in Goodwater?
Per Capita income in Goodwater is $23,412.
What is the Median Family Income in Goodwater?
Median Family Income in Goodwater is $43,750.
What is the Median Household income in Goodwater?
Median Household Income in Goodwater is $35,724.
What is Income or Wage Gap in Goodwater?
Income or Wage Gap in Goodwater is 43.0%.
Women in Goodwater earn 57.0 cents for every dollar earned by a man.
What is Inequality or Gini Index in Goodwater?
Inequality or Gini Index in Goodwater is 0.39.
What is the Total Population of Goodwater?
Total Population of Goodwater is 1,117.
What is the Total Male Population of Goodwater?
Total Male Population of Goodwater is 562.
What is the Total Female Population of Goodwater?
Total Female Population of Goodwater is 555.
What is the Ratio of Males per 100 Females in Goodwater?
There are 101.26 Males per 100 Females in Goodwater.
What is the Ratio of Females per 100 Males in Goodwater?
There are 98.75 Females per 100 Males in Goodwater.
What is the Median Population Age in Goodwater?
Median Population Age in Goodwater is 50.7 Years.
What is the Average Family Size in Goodwater
Average Family Size in Goodwater is 2.8 People.
What is the Average Household Size in Goodwater
Average Household Size in Goodwater is 2.2 People.
How Large is the Labor Force in Goodwater?
There are 321 People in the Labor Forcein in Goodwater.
What is the Percentage of People in the Labor Force in Goodwater?
37.2% of People are in the Labor Force in Goodwater.
What is the Unemployment Rate in Goodwater?
Unemployment Rate in Goodwater is 2.9%.