Fyffe, AL Map & Demographics
Fyffe Map
Fyffe Overview
$22,806
PER CAPITA INCOME
$42,847
AVG FAMILY INCOME
$36,964
AVG HOUSEHOLD INCOME
23.7%
WAGE / INCOME GAP [ % ]
76.3¢/ $1
WAGE / INCOME GAP [ $ ]
0.42
INEQUALITY / GINI INDEX
1,232
TOTAL POPULATION
621
MALE POPULATION
611
FEMALE POPULATION
101.64
MALES / 100 FEMALES
98.39
FEMALES / 100 MALES
46.7
MEDIAN AGE
3.0
AVG FAMILY SIZE
2.6
AVG HOUSEHOLD SIZE
476
LABOR FORCE [ PEOPLE ]
46.3%
PERCENT IN LABOR FORCE
5.7%
UNEMPLOYMENT RATE
Fyffe Zip Codes
Fyffe Area Codes
Income in Fyffe
Income Overview in Fyffe
Per Capita Income in Fyffe is $22,806, while median incomes of families and households are $42,847 and $36,964 respectively.
| Characteristic | Number | Measure |
| Per Capita Income | 1,232 | $22,806 |
| Median Family Income | 369 | $42,847 |
| Mean Family Income | 369 | $62,147 |
| Median Household Income | 459 | $36,964 |
| Mean Household Income | 459 | $56,520 |
| Income Deficit | 369 | $0 |
| Wage / Income Gap (%) | 1,232 | 23.75% |
| Wage / Income Gap ($) | 1,232 | 76.25¢ per $1 |
| Gini / Inequality Index | 1,232 | 0.42 |
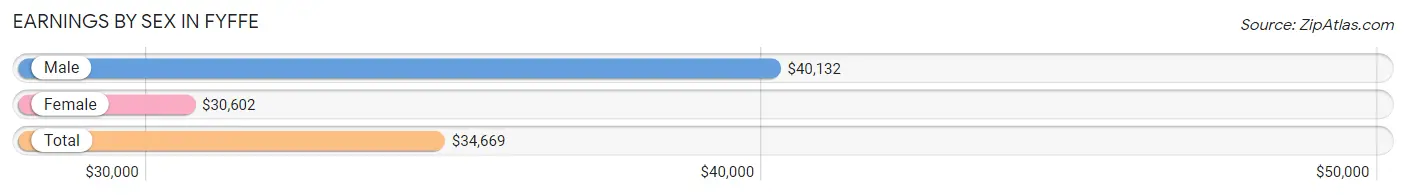
Earnings by Sex in Fyffe
Average Earnings in Fyffe are $34,669, $40,132 for men and $30,602 for women, a difference of 23.7%.
| Sex | Number | Average Earnings |
| Male | 276 (59.6%) | $40,132 |
| Female | 187 (40.4%) | $30,602 |
| Total | 463 (100.0%) | $34,669 |
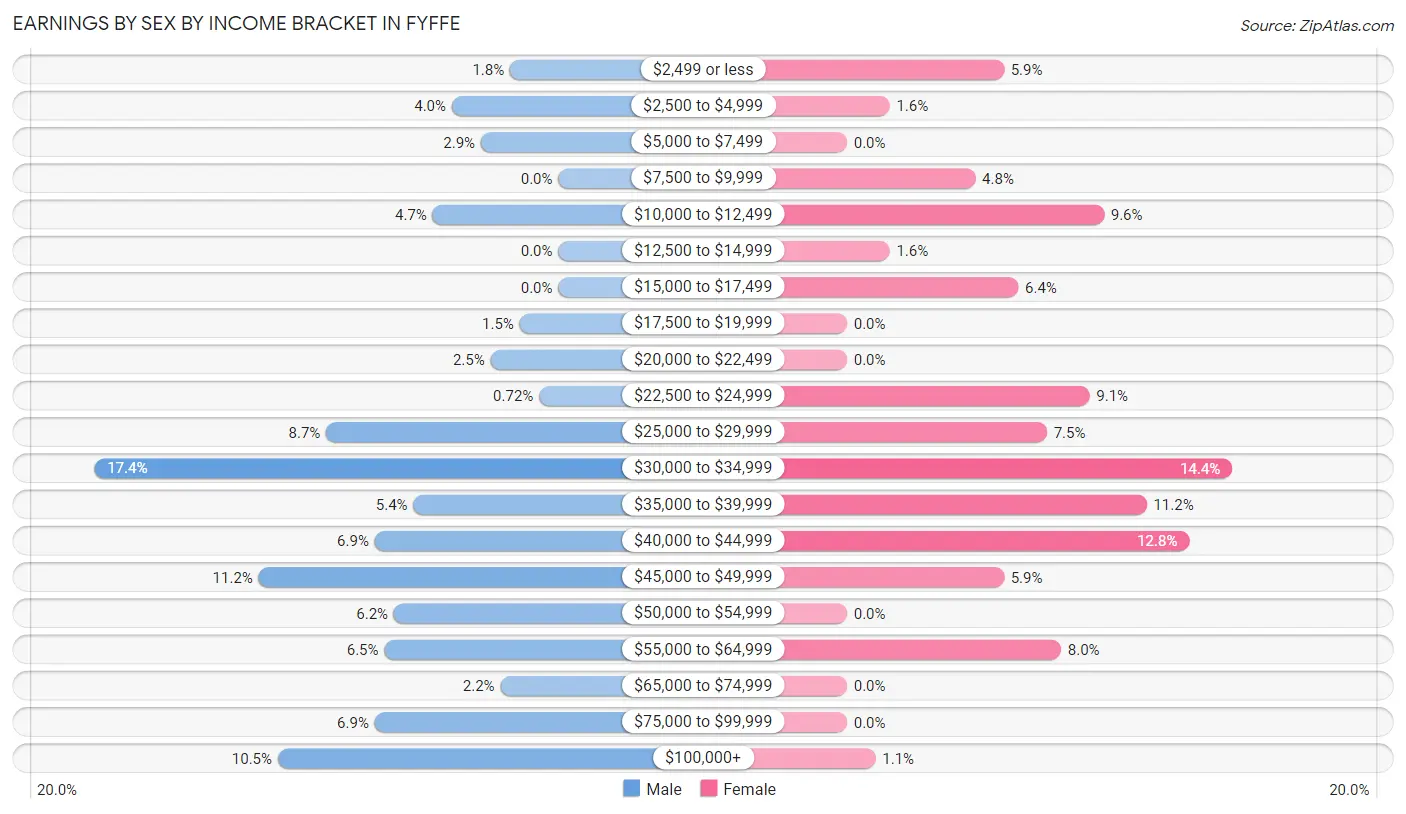
Earnings by Sex by Income Bracket in Fyffe
The most common earnings brackets in Fyffe are $30,000 to $34,999 for men (48 | 17.4%) and $30,000 to $34,999 for women (27 | 14.4%).
| Income | Male | Female |
| $2,499 or less | 5 (1.8%) | 11 (5.9%) |
| $2,500 to $4,999 | 11 (4.0%) | 3 (1.6%) |
| $5,000 to $7,499 | 8 (2.9%) | 0 (0.0%) |
| $7,500 to $9,999 | 0 (0.0%) | 9 (4.8%) |
| $10,000 to $12,499 | 13 (4.7%) | 18 (9.6%) |
| $12,500 to $14,999 | 0 (0.0%) | 3 (1.6%) |
| $15,000 to $17,499 | 0 (0.0%) | 12 (6.4%) |
| $17,500 to $19,999 | 4 (1.5%) | 0 (0.0%) |
| $20,000 to $22,499 | 7 (2.5%) | 0 (0.0%) |
| $22,500 to $24,999 | 2 (0.7%) | 17 (9.1%) |
| $25,000 to $29,999 | 24 (8.7%) | 14 (7.5%) |
| $30,000 to $34,999 | 48 (17.4%) | 27 (14.4%) |
| $35,000 to $39,999 | 15 (5.4%) | 21 (11.2%) |
| $40,000 to $44,999 | 19 (6.9%) | 24 (12.8%) |
| $45,000 to $49,999 | 31 (11.2%) | 11 (5.9%) |
| $50,000 to $54,999 | 17 (6.2%) | 0 (0.0%) |
| $55,000 to $64,999 | 18 (6.5%) | 15 (8.0%) |
| $65,000 to $74,999 | 6 (2.2%) | 0 (0.0%) |
| $75,000 to $99,999 | 19 (6.9%) | 0 (0.0%) |
| $100,000+ | 29 (10.5%) | 2 (1.1%) |
| Total | 276 (100.0%) | 187 (100.0%) |
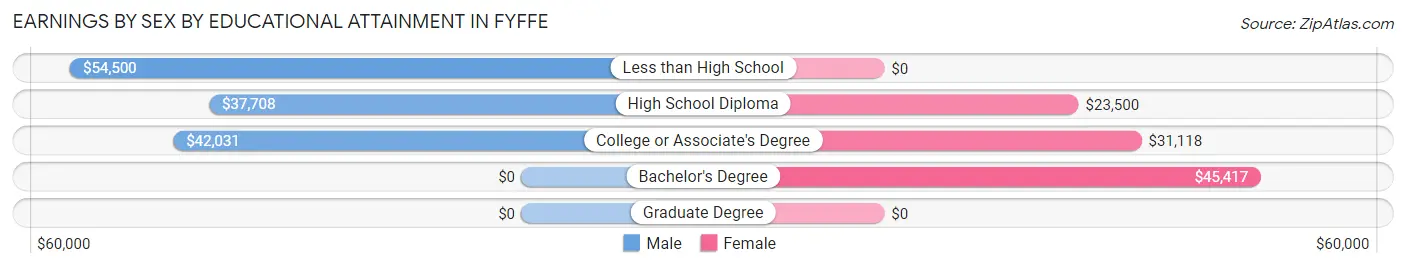
Earnings by Sex by Educational Attainment in Fyffe
Average earnings in Fyffe are $46,354 for men and $31,204 for women, a difference of 32.7%. Men with an educational attainment of less than high school enjoy the highest average annual earnings of $54,500, while those with high school diploma education earn the least with $37,708. Women with an educational attainment of bachelor's degree earn the most with the average annual earnings of $45,417, while those with high school diploma education have the smallest earnings of $23,500.
| Educational Attainment | Male Income | Female Income |
| Less than High School | $54,500 | $0 |
| High School Diploma | $37,708 | $23,500 |
| College or Associate's Degree | $42,031 | $31,118 |
| Bachelor's Degree | - | - |
| Graduate Degree | - | - |
| Total | $46,354 | $31,204 |
Family Income in Fyffe
Family Income Brackets in Fyffe
According to the Fyffe family income data, there are 130 families falling into the $25,000 to $34,999 income range, which is the most common income bracket and makes up 35.2% of all families.
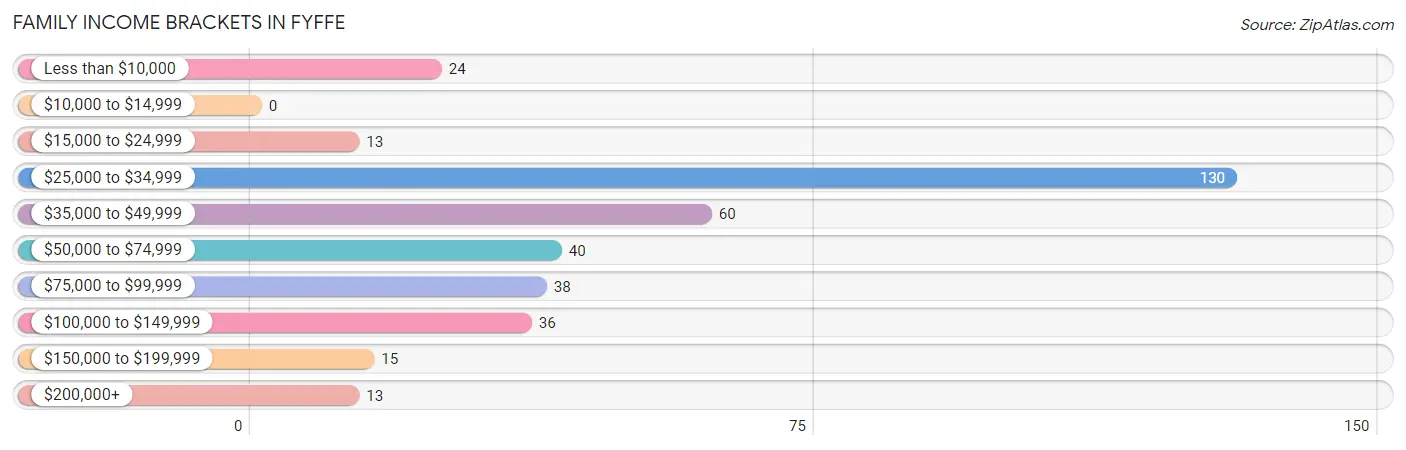
| Income Bracket | # Families | % Families |
| Less than $10,000 | 24 | 6.5% |
| $10,000 to $14,999 | 0 | 0.0% |
| $15,000 to $24,999 | 13 | 3.5% |
| $25,000 to $34,999 | 130 | 35.2% |
| $35,000 to $49,999 | 60 | 16.3% |
| $50,000 to $74,999 | 40 | 10.8% |
| $75,000 to $99,999 | 38 | 10.3% |
| $100,000 to $149,999 | 36 | 9.8% |
| $150,000 to $199,999 | 15 | 4.1% |
| $200,000+ | 13 | 3.5% |
Family Income by Famaliy Size in Fyffe
4-person families (64 | 17.3%) account for the highest median family income in Fyffe with $105,208 per family, while 3-person families (49 | 13.3%) have the highest median income of $28,698 per family member.
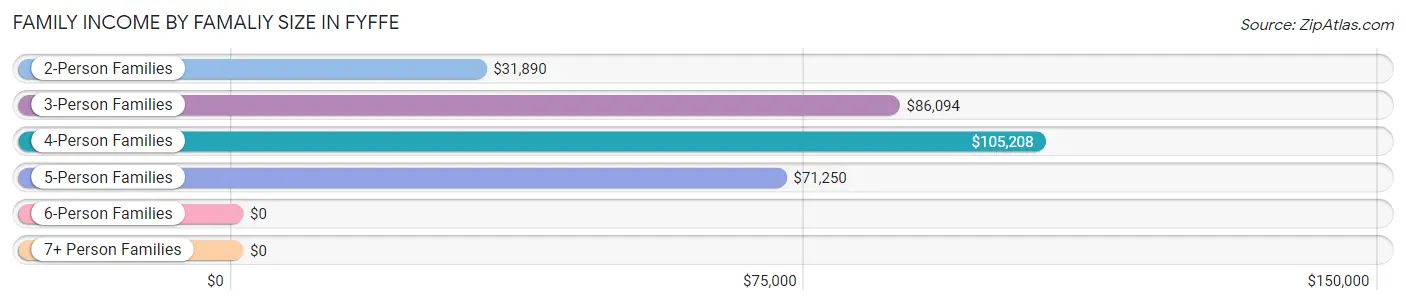
| Income Bracket | # Families | Median Income |
| 2-Person Families | 244 (66.1%) | $31,890 |
| 3-Person Families | 49 (13.3%) | $86,094 |
| 4-Person Families | 64 (17.3%) | $105,208 |
| 5-Person Families | 12 (3.3%) | $71,250 |
| 6-Person Families | 0 (0.0%) | $0 |
| 7+ Person Families | 0 (0.0%) | $0 |
| Total | 369 (100.0%) | $42,847 |
Family Income by Number of Earners in Fyffe
The median family income in Fyffe is $42,847, with families comprising 3+ earners (27) having the highest median family income of $170,750, while families with no earners (169) have the lowest median family income of $31,108, accounting for 7.3% and 45.8% of families, respectively.
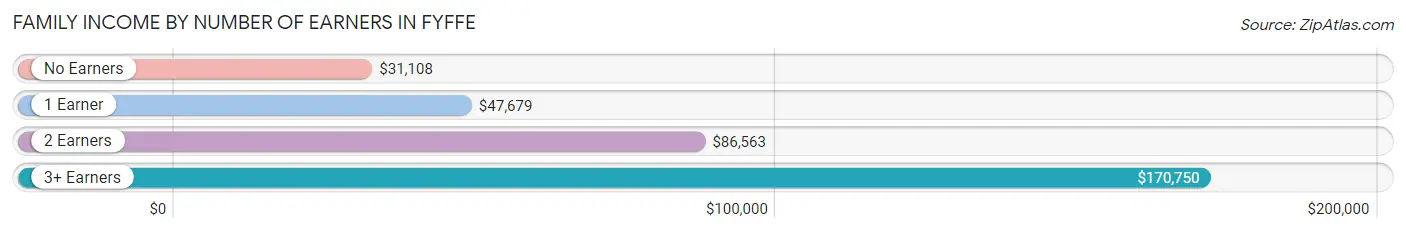
| Number of Earners | # Families | Median Income |
| No Earners | 169 (45.8%) | $31,108 |
| 1 Earner | 67 (18.2%) | $47,679 |
| 2 Earners | 106 (28.7%) | $86,563 |
| 3+ Earners | 27 (7.3%) | $170,750 |
| Total | 369 (100.0%) | $42,847 |
Household Income in Fyffe
Household Income Brackets in Fyffe
With 153 households falling in the category, the $25,000 to $34,999 income range is the most frequent in Fyffe, accounting for 33.3% of all households. In contrast, only 13 households (2.8%) fall into the $200,000+ income bracket, making it the least populous group.
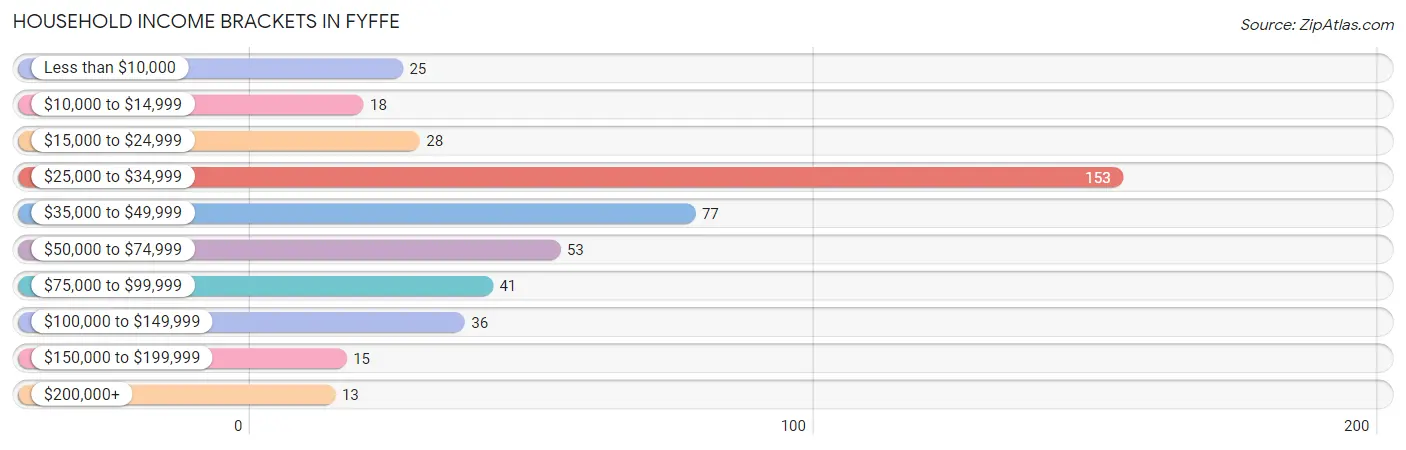
| Income Bracket | # Households | % Households |
| Less than $10,000 | 25 | 5.4% |
| $10,000 to $14,999 | 18 | 3.9% |
| $15,000 to $24,999 | 28 | 6.1% |
| $25,000 to $34,999 | 153 | 33.3% |
| $35,000 to $49,999 | 77 | 16.8% |
| $50,000 to $74,999 | 53 | 11.5% |
| $75,000 to $99,999 | 41 | 8.9% |
| $100,000 to $149,999 | 36 | 7.8% |
| $150,000 to $199,999 | 15 | 3.3% |
| $200,000+ | 13 | 2.8% |
Household Income by Householder Age in Fyffe
The median household income in Fyffe is $36,964, with the highest median household income of $73,250 found in the 25 to 44 years age bracket for the primary householder. A total of 115 households (25.1%) fall into this category. Meanwhile, the 15 to 24 years age bracket for the primary householder has the lowest median household income of $0, with 10 households (2.2%) in this group.
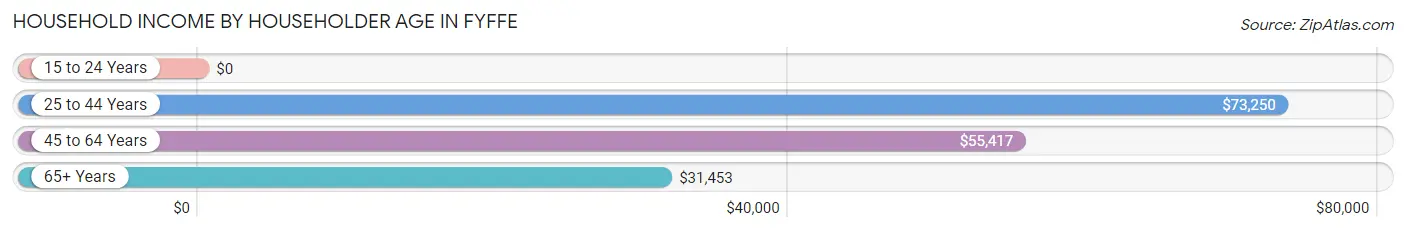
| Income Bracket | # Households | Median Income |
| 15 to 24 Years | 10 (2.2%) | $0 |
| 25 to 44 Years | 115 (25.1%) | $73,250 |
| 45 to 64 Years | 111 (24.2%) | $55,417 |
| 65+ Years | 223 (48.6%) | $31,453 |
| Total | 459 (100.0%) | $36,964 |
Poverty in Fyffe
Income Below Poverty by Sex and Age in Fyffe
With 11.9% poverty level for males and 13.6% for females among the residents of Fyffe, under 5 year old males and 5 year old females are the most vulnerable to poverty, with 15 males (31.9%) and 6 females (100.0%) in their respective age groups living below the poverty level.
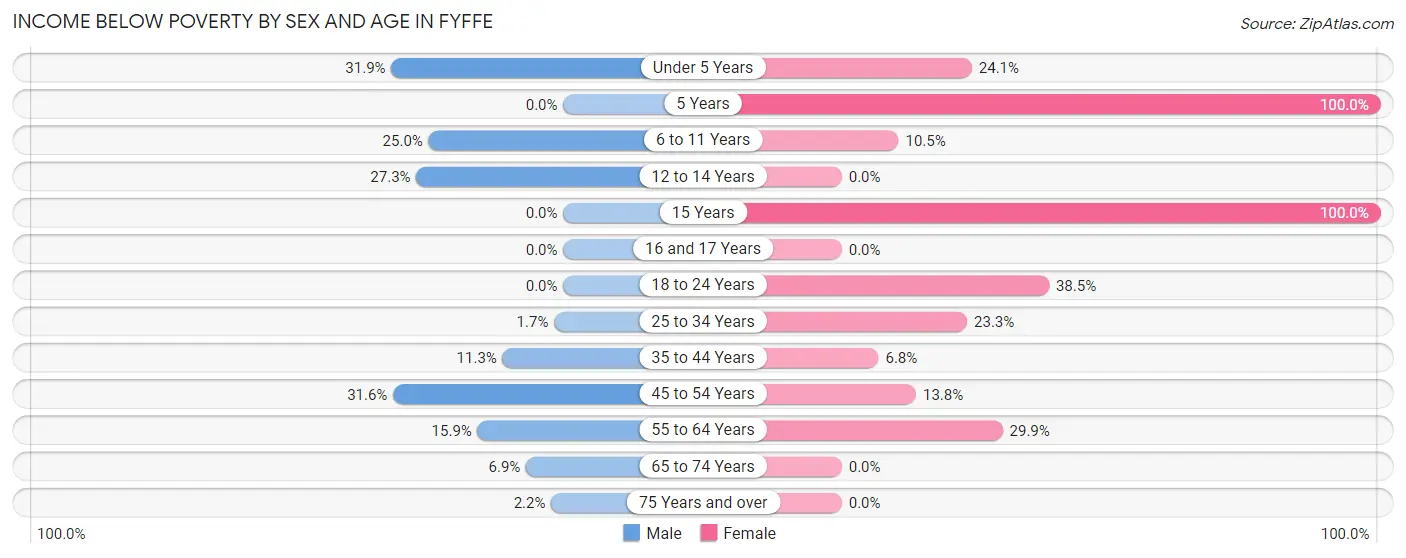
| Age Bracket | Male | Female |
| Under 5 Years | 15 (31.9%) | 14 (24.1%) |
| 5 Years | 0 (0.0%) | 6 (100.0%) |
| 6 to 11 Years | 3 (25.0%) | 4 (10.5%) |
| 12 to 14 Years | 3 (27.3%) | 0 (0.0%) |
| 15 Years | 0 (0.0%) | 5 (100.0%) |
| 16 and 17 Years | 0 (0.0%) | 0 (0.0%) |
| 18 to 24 Years | 0 (0.0%) | 10 (38.5%) |
| 25 to 34 Years | 1 (1.7%) | 10 (23.3%) |
| 35 to 44 Years | 8 (11.3%) | 6 (6.8%) |
| 45 to 54 Years | 30 (31.6%) | 8 (13.8%) |
| 55 to 64 Years | 7 (15.9%) | 20 (29.8%) |
| 65 to 74 Years | 4 (6.9%) | 0 (0.0%) |
| 75 Years and over | 3 (2.2%) | 0 (0.0%) |
| Total | 74 (11.9%) | 83 (13.6%) |
Income Above Poverty by Sex and Age in Fyffe
According to the poverty statistics in Fyffe, males aged 16 and 17 years and females aged 12 to 14 years are the age groups that are most secure financially, with 100.0% of males and 100.0% of females in these age groups living above the poverty line.
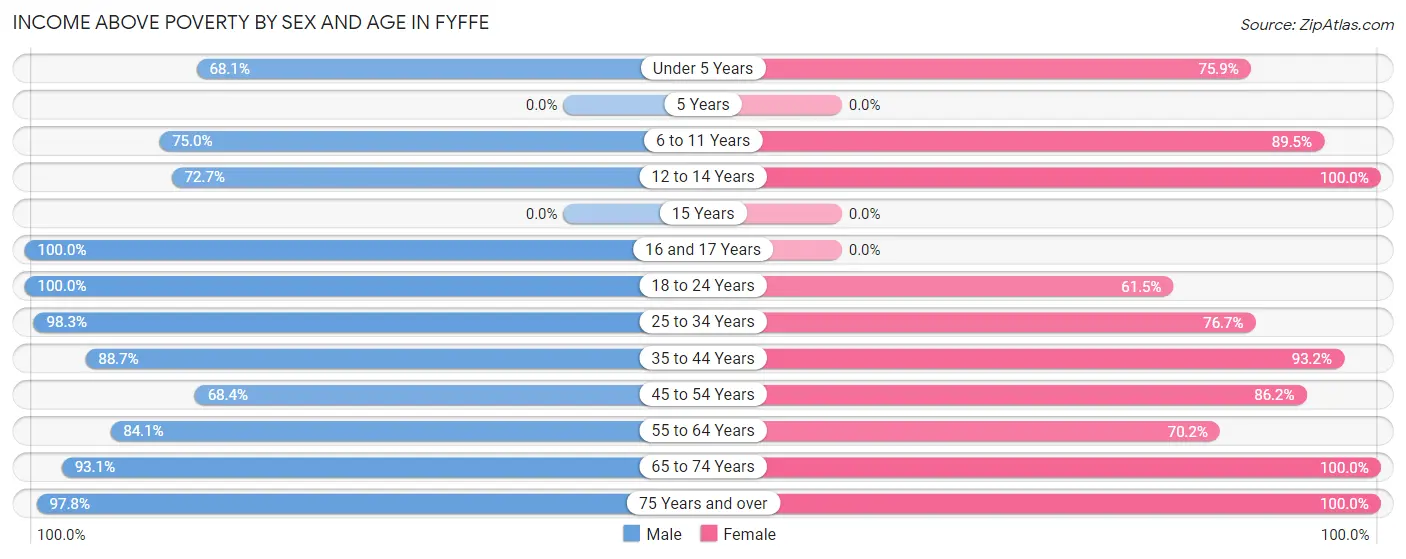
| Age Bracket | Male | Female |
| Under 5 Years | 32 (68.1%) | 44 (75.9%) |
| 5 Years | 0 (0.0%) | 0 (0.0%) |
| 6 to 11 Years | 9 (75.0%) | 34 (89.5%) |
| 12 to 14 Years | 8 (72.7%) | 28 (100.0%) |
| 15 Years | 0 (0.0%) | 0 (0.0%) |
| 16 and 17 Years | 23 (100.0%) | 0 (0.0%) |
| 18 to 24 Years | 67 (100.0%) | 16 (61.5%) |
| 25 to 34 Years | 58 (98.3%) | 33 (76.7%) |
| 35 to 44 Years | 63 (88.7%) | 82 (93.2%) |
| 45 to 54 Years | 65 (68.4%) | 50 (86.2%) |
| 55 to 64 Years | 37 (84.1%) | 47 (70.2%) |
| 65 to 74 Years | 54 (93.1%) | 156 (100.0%) |
| 75 Years and over | 131 (97.8%) | 38 (100.0%) |
| Total | 547 (88.1%) | 528 (86.4%) |
Income Below Poverty Among Married-Couple Families in Fyffe
The poverty statistics for married-couple families in Fyffe show that 3.9% or 12 of the total 305 families live below the poverty line. Families with 1 or 2 children have the highest poverty rate of 4.2%, comprising of 3 families. On the other hand, families with no children have the lowest poverty rate of 3.8%, which includes 9 families.
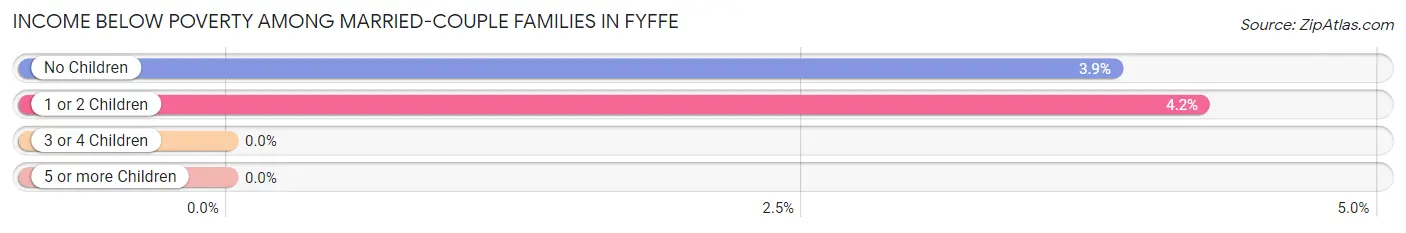
| Children | Above Poverty | Below Poverty |
| No Children | 225 (96.2%) | 9 (3.8%) |
| 1 or 2 Children | 68 (95.8%) | 3 (4.2%) |
| 3 or 4 Children | 0 (0.0%) | 0 (0.0%) |
| 5 or more Children | 0 (0.0%) | 0 (0.0%) |
| Total | 293 (96.1%) | 12 (3.9%) |
Income Below Poverty Among Single-Parent Households in Fyffe
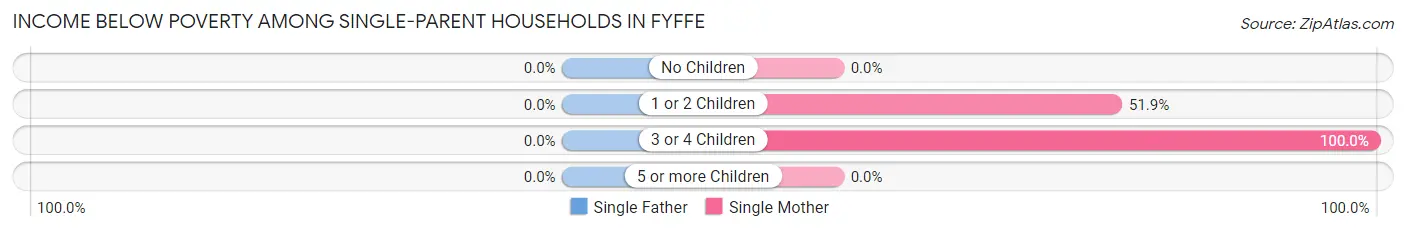
| Children | Single Father | Single Mother |
| No Children | 0 (0.0%) | 0 (0.0%) |
| 1 or 2 Children | 0 (0.0%) | 14 (51.8%) |
| 3 or 4 Children | 0 (0.0%) | 5 (100.0%) |
| 5 or more Children | 0 (0.0%) | 0 (0.0%) |
| Total | 0 (0.0%) | 19 (42.2%) |
Income Below Poverty Among Married-Couple vs Single-Parent Households in Fyffe
The poverty data for Fyffe shows that 12 of the married-couple family households (3.9%) and 19 of the single-parent households (29.7%) are living below the poverty level. Within the married-couple family households, those with 1 or 2 children have the highest poverty rate, with 3 households (4.2%) falling below the poverty line. Among the single-parent households, those with 1 or 2 children have the highest poverty rate, with 14 household (51.8%) living below poverty.
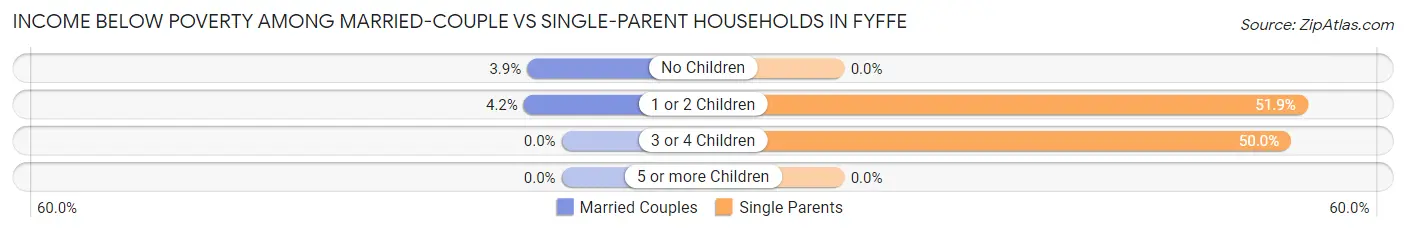
| Children | Married-Couple Families | Single-Parent Households |
| No Children | 9 (3.8%) | 0 (0.0%) |
| 1 or 2 Children | 3 (4.2%) | 14 (51.8%) |
| 3 or 4 Children | 0 (0.0%) | 5 (50.0%) |
| 5 or more Children | 0 (0.0%) | 0 (0.0%) |
| Total | 12 (3.9%) | 19 (29.7%) |
Race in Fyffe
The most populous races in Fyffe are White / Caucasian (1,163 | 94.4%), Native / Alaskan (29 | 2.4%), and Two or more Races (25 | 2.0%).
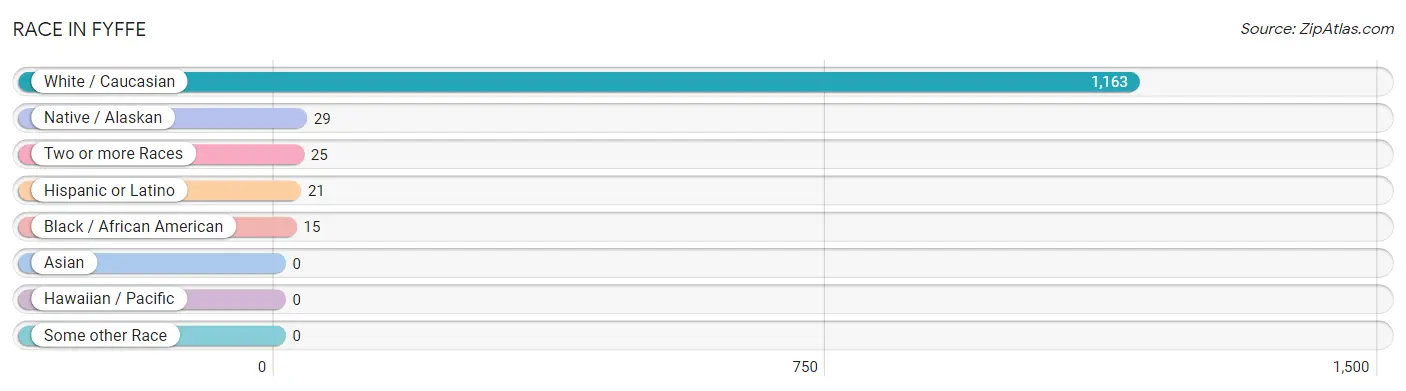
| Race | # Population | % Population |
| Asian | 0 | 0.0% |
| Black / African American | 15 | 1.2% |
| Hawaiian / Pacific | 0 | 0.0% |
| Hispanic or Latino | 21 | 1.7% |
| Native / Alaskan | 29 | 2.4% |
| White / Caucasian | 1,163 | 94.4% |
| Two or more Races | 25 | 2.0% |
| Some other Race | 0 | 0.0% |
| Total | 1,232 | 100.0% |
Ancestry in Fyffe
The most populous ancestries reported in Fyffe are English (383 | 31.1%), American (110 | 8.9%), German (74 | 6.0%), Irish (67 | 5.4%), and Cherokee (34 | 2.8%), together accounting for 54.2% of all Fyffe residents.
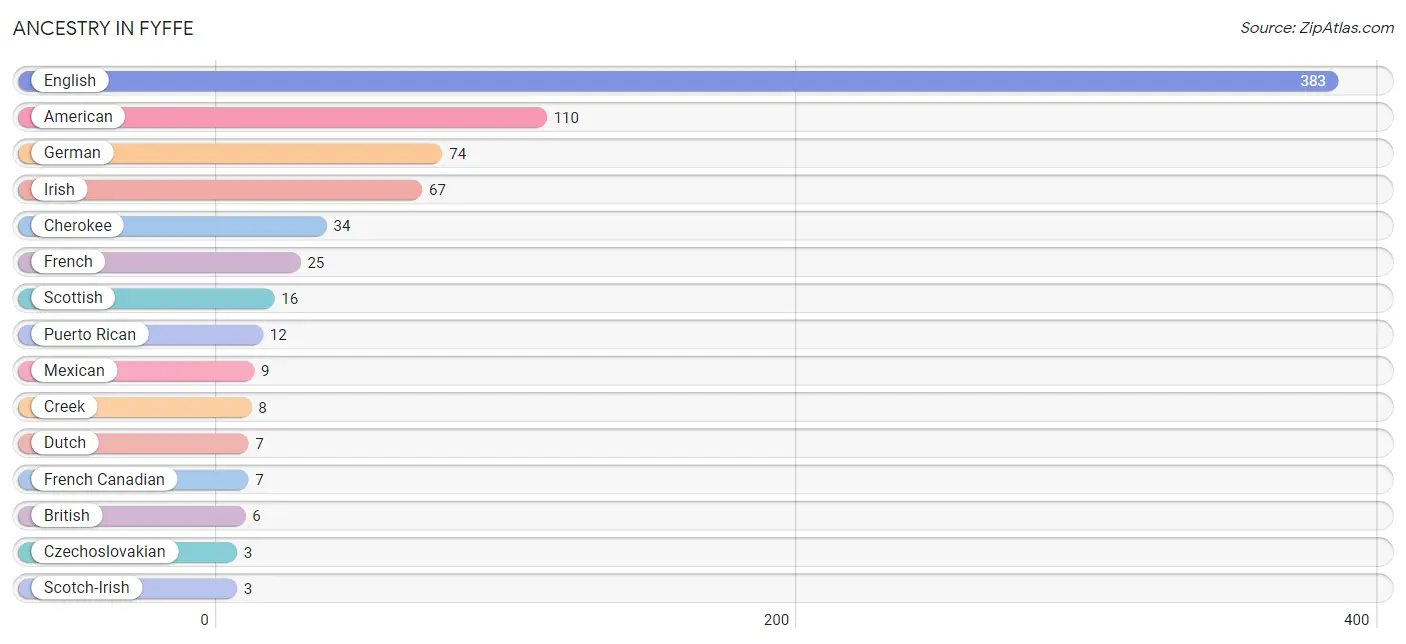
| Ancestry | # Population | % Population |
| American | 110 | 8.9% |
| Bhutanese | 2 | 0.2% |
| British | 6 | 0.5% |
| Cherokee | 34 | 2.8% |
| Creek | 8 | 0.6% |
| Czechoslovakian | 3 | 0.2% |
| Dutch | 7 | 0.6% |
| English | 383 | 31.1% |
| French | 25 | 2.0% |
| French Canadian | 7 | 0.6% |
| German | 74 | 6.0% |
| Irish | 67 | 5.4% |
| Mexican | 9 | 0.7% |
| Puerto Rican | 12 | 1.0% |
| Scotch-Irish | 3 | 0.2% |
| Scottish | 16 | 1.3% | View All 16 Rows |
Immigrants in Fyffe
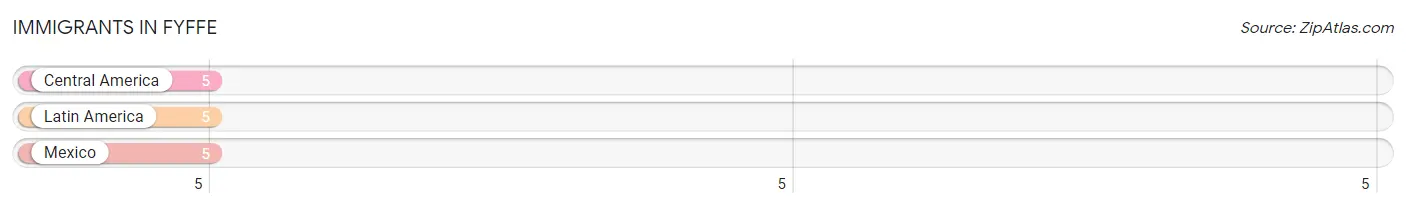
The most numerous immigrant groups reported in Fyffe came from Central America (5 | 0.4%), Latin America (5 | 0.4%), and Mexico (5 | 0.4%), together accounting for 1.2% of all Fyffe residents.
| Immigration Origin | # Population | % Population |
| Central America | 5 | 0.4% |
| Latin America | 5 | 0.4% |
| Mexico | 5 | 0.4% | View All 3 Rows |
Sex and Age in Fyffe
Sex and Age in Fyffe
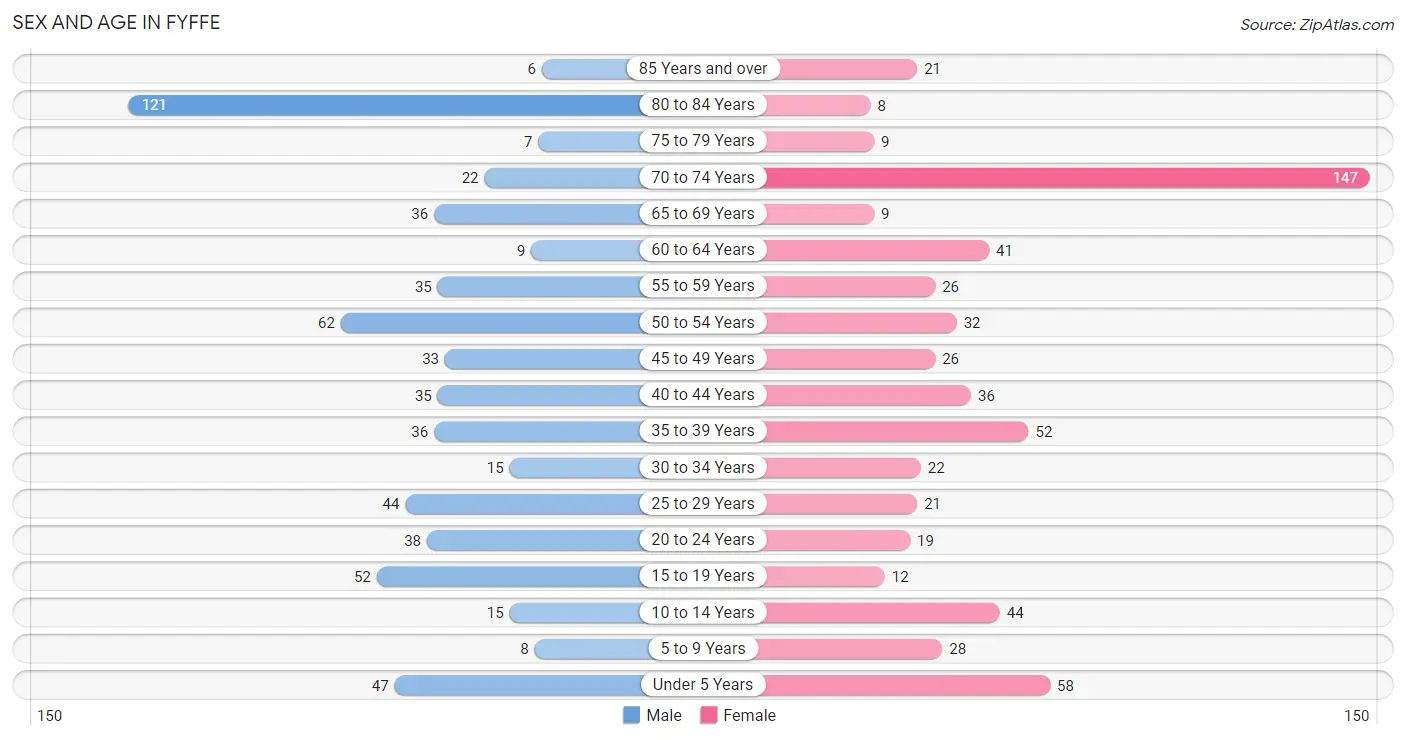
The most populous age groups in Fyffe are 80 to 84 Years (121 | 19.5%) for men and 70 to 74 Years (147 | 24.1%) for women.
| Age Bracket | Male | Female |
| Under 5 Years | 47 (7.6%) | 58 (9.5%) |
| 5 to 9 Years | 8 (1.3%) | 28 (4.6%) |
| 10 to 14 Years | 15 (2.4%) | 44 (7.2%) |
| 15 to 19 Years | 52 (8.4%) | 12 (2.0%) |
| 20 to 24 Years | 38 (6.1%) | 19 (3.1%) |
| 25 to 29 Years | 44 (7.1%) | 21 (3.4%) |
| 30 to 34 Years | 15 (2.4%) | 22 (3.6%) |
| 35 to 39 Years | 36 (5.8%) | 52 (8.5%) |
| 40 to 44 Years | 35 (5.6%) | 36 (5.9%) |
| 45 to 49 Years | 33 (5.3%) | 26 (4.3%) |
| 50 to 54 Years | 62 (10.0%) | 32 (5.2%) |
| 55 to 59 Years | 35 (5.6%) | 26 (4.3%) |
| 60 to 64 Years | 9 (1.5%) | 41 (6.7%) |
| 65 to 69 Years | 36 (5.8%) | 9 (1.5%) |
| 70 to 74 Years | 22 (3.5%) | 147 (24.1%) |
| 75 to 79 Years | 7 (1.1%) | 9 (1.5%) |
| 80 to 84 Years | 121 (19.5%) | 8 (1.3%) |
| 85 Years and over | 6 (1.0%) | 21 (3.4%) |
| Total | 621 (100.0%) | 611 (100.0%) |
Families and Households in Fyffe
Median Family Size in Fyffe
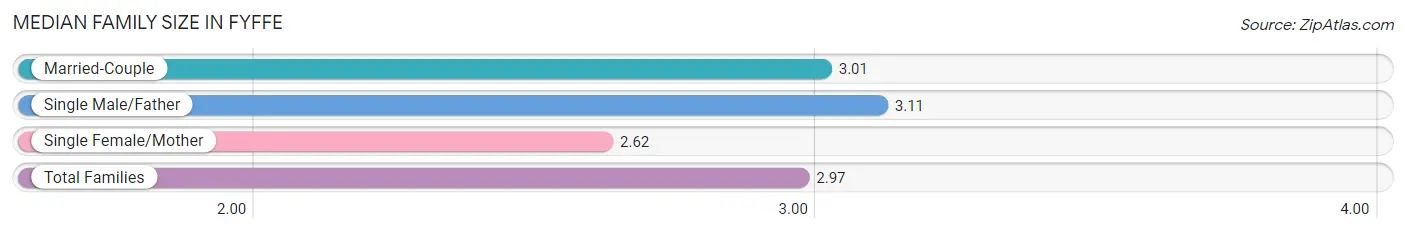
The median family size in Fyffe is 2.97 persons per family, with single male/father families (19 | 5.1%) accounting for the largest median family size of 3.11 persons per family. On the other hand, single female/mother families (45 | 12.2%) represent the smallest median family size with 2.62 persons per family.
| Family Type | # Families | Family Size |
| Married-Couple | 305 (82.7%) | 3.01 |
| Single Male/Father | 19 (5.1%) | 3.11 |
| Single Female/Mother | 45 (12.2%) | 2.62 |
| Total Families | 369 (100.0%) | 2.97 |
Median Household Size in Fyffe
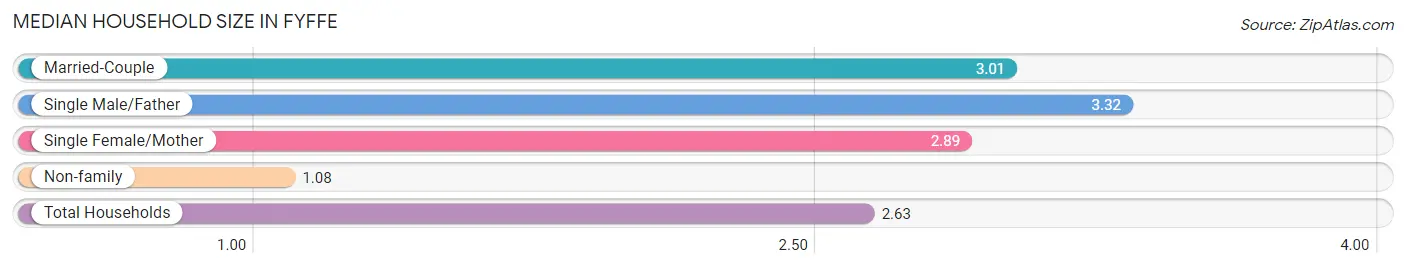
The median household size in Fyffe is 2.63 persons per household, with single male/father households (19 | 4.1%) accounting for the largest median household size of 3.32 persons per household. non-family households (90 | 19.6%) represent the smallest median household size with 1.08 persons per household.
| Household Type | # Households | Household Size |
| Married-Couple | 305 (66.4%) | 3.01 |
| Single Male/Father | 19 (4.1%) | 3.32 |
| Single Female/Mother | 45 (9.8%) | 2.89 |
| Non-family | 90 (19.6%) | 1.08 |
| Total Households | 459 (100.0%) | 2.63 |
Household Size by Marriage Status in Fyffe
Out of a total of 459 households in Fyffe, 369 (80.4%) are family households, while 90 (19.6%) are nonfamily households. The most numerous type of family households are 2-person households, comprising 241, and the most common type of nonfamily households are 1-person households, comprising 87.
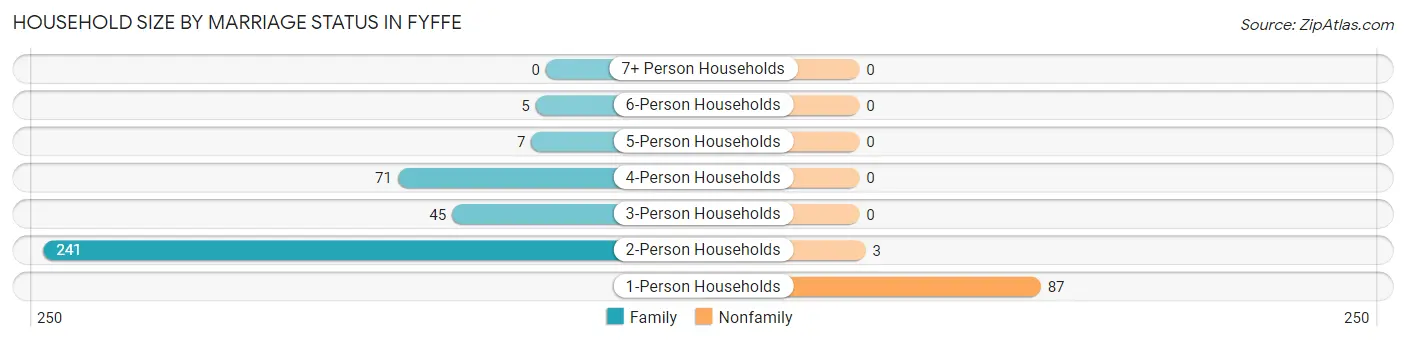
| Household Size | Family Households | Nonfamily Households |
| 1-Person Households | - | 87 (19.0%) |
| 2-Person Households | 241 (52.5%) | 3 (0.6%) |
| 3-Person Households | 45 (9.8%) | 0 (0.0%) |
| 4-Person Households | 71 (15.5%) | 0 (0.0%) |
| 5-Person Households | 7 (1.5%) | 0 (0.0%) |
| 6-Person Households | 5 (1.1%) | 0 (0.0%) |
| 7+ Person Households | 0 (0.0%) | 0 (0.0%) |
| Total | 369 (80.4%) | 90 (19.6%) |
Female Fertility in Fyffe
Fertility by Age in Fyffe
Average fertility rate in Fyffe is 118.0 births per 1,000 women. Women in the age bracket of 20 to 34 years have the highest fertility rate with 339.0 births per 1,000 women. Women in the age bracket of 20 to 34 years acount for 87.5% of all women with births.
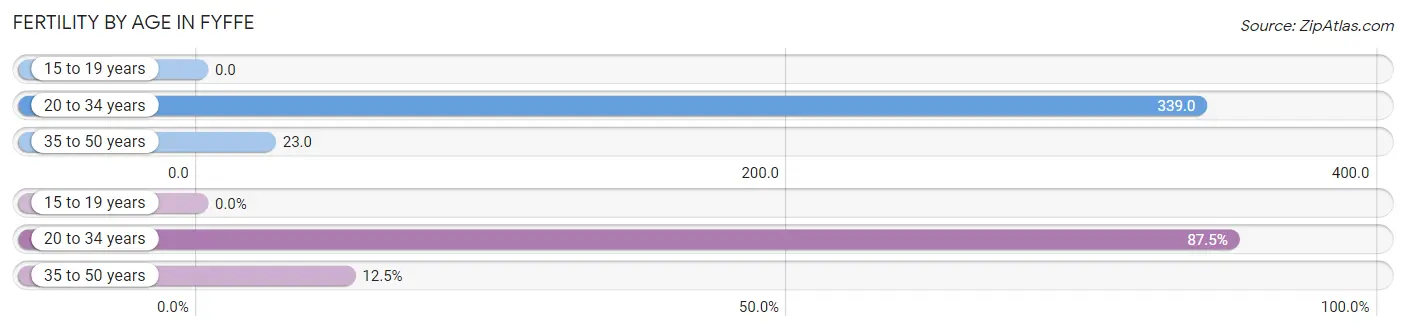
| Age Bracket | Women with Births | Births / 1,000 Women |
| 15 to 19 years | 0 (0.0%) | 0.0 |
| 20 to 34 years | 21 (87.5%) | 339.0 |
| 35 to 50 years | 3 (12.5%) | 23.0 |
| Total | 24 (100.0%) | 118.0 |
Fertility by Age by Marriage Status in Fyffe
58.3% of women with births (24) in Fyffe are married. The highest percentage of unmarried women with births falls into 20 to 34 years age bracket with 47.6% of them unmarried at the time of birth, while the lowest percentage of unmarried women with births belong to 35 to 50 years age bracket with 0.0% of them unmarried.
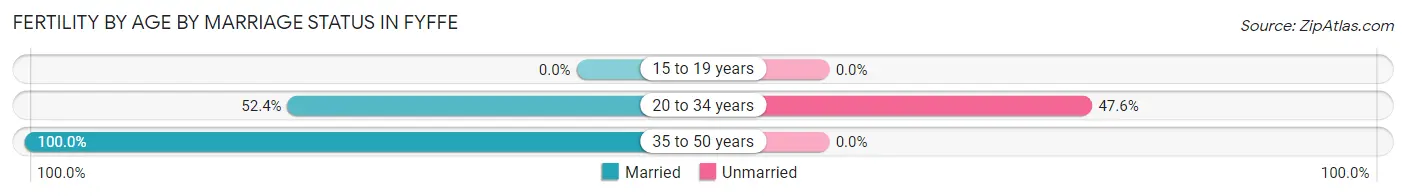
| Age Bracket | Married | Unmarried |
| 15 to 19 years | 0 (0.0%) | 0 (0.0%) |
| 20 to 34 years | 11 (52.4%) | 10 (47.6%) |
| 35 to 50 years | 3 (100.0%) | 0 (0.0%) |
| Total | 14 (58.3%) | 10 (41.7%) |
Fertility by Education in Fyffe
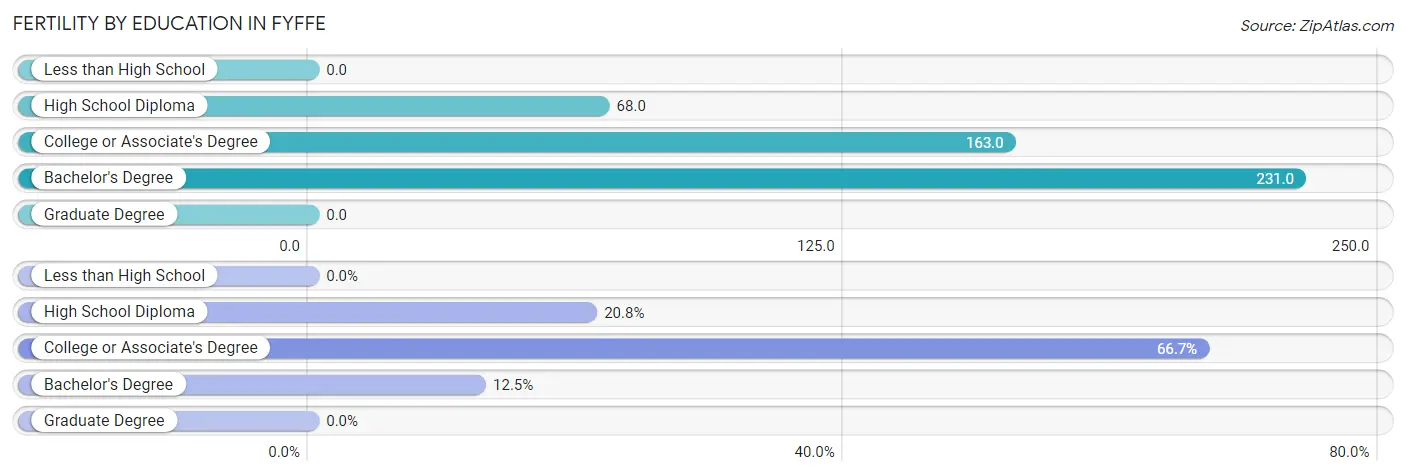
| Educational Attainment | Women with Births | Births / 1,000 Women |
| Less than High School | 0 (0.0%) | 0.0 |
| High School Diploma | 5 (20.8%) | 68.0 |
| College or Associate's Degree | 16 (66.7%) | 163.0 |
| Bachelor's Degree | 3 (12.5%) | 231.0 |
| Graduate Degree | 0 (0.0%) | 0.0 |
| Total | 24 (100.0%) | 118.0 |
Fertility by Education by Marriage Status in Fyffe
41.7% of women with births in Fyffe are unmarried. Women with the educational attainment of bachelor's degree are most likely to be married with 100.0% of them married at childbirth, while women with the educational attainment of high school diploma are least likely to be married with 100.0% of them unmarried at childbirth.
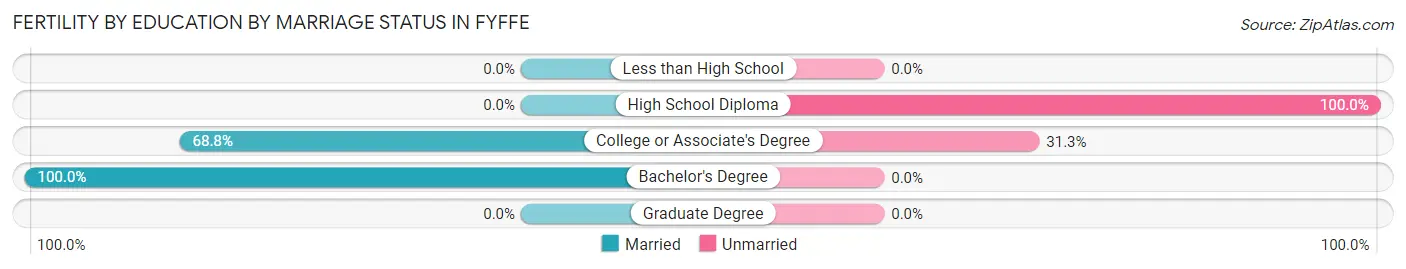
| Educational Attainment | Married | Unmarried |
| Less than High School | 0 (0.0%) | 0 (0.0%) |
| High School Diploma | 0 (0.0%) | 5 (100.0%) |
| College or Associate's Degree | 11 (68.8%) | 5 (31.2%) |
| Bachelor's Degree | 3 (100.0%) | 0 (0.0%) |
| Graduate Degree | 0 (0.0%) | 0 (0.0%) |
| Total | 14 (58.3%) | 10 (41.7%) |
Employment Characteristics in Fyffe
Employment by Class of Employer in Fyffe
Among the 449 employed individuals in Fyffe, private company employees (343 | 76.4%), local government employees (38 | 8.5%), and state government employees (26 | 5.8%) make up the most common classes of employment.
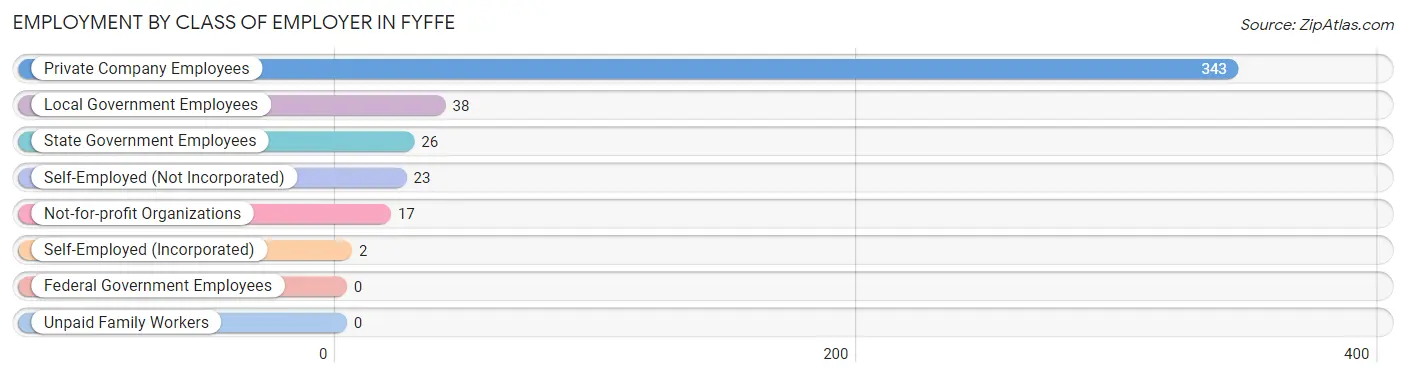
| Employer Class | # Employees | % Employees |
| Private Company Employees | 343 | 76.4% |
| Self-Employed (Incorporated) | 2 | 0.4% |
| Self-Employed (Not Incorporated) | 23 | 5.1% |
| Not-for-profit Organizations | 17 | 3.8% |
| Local Government Employees | 38 | 8.5% |
| State Government Employees | 26 | 5.8% |
| Federal Government Employees | 0 | 0.0% |
| Unpaid Family Workers | 0 | 0.0% |
| Total | 449 | 100.0% |
Employment Status by Age in Fyffe
According to the labor force statistics for Fyffe, out of the total population over 16 years of age (1,027), 46.3% or 476 individuals are in the labor force, with 5.7% or 27 of them unemployed. The age group with the highest labor force participation rate is 25 to 29 years, with 92.3% or 60 individuals in the labor force. Within the labor force, the 55 to 59 years age range has the highest percentage of unemployed individuals, with 20.4% or 10 of them being unemployed.
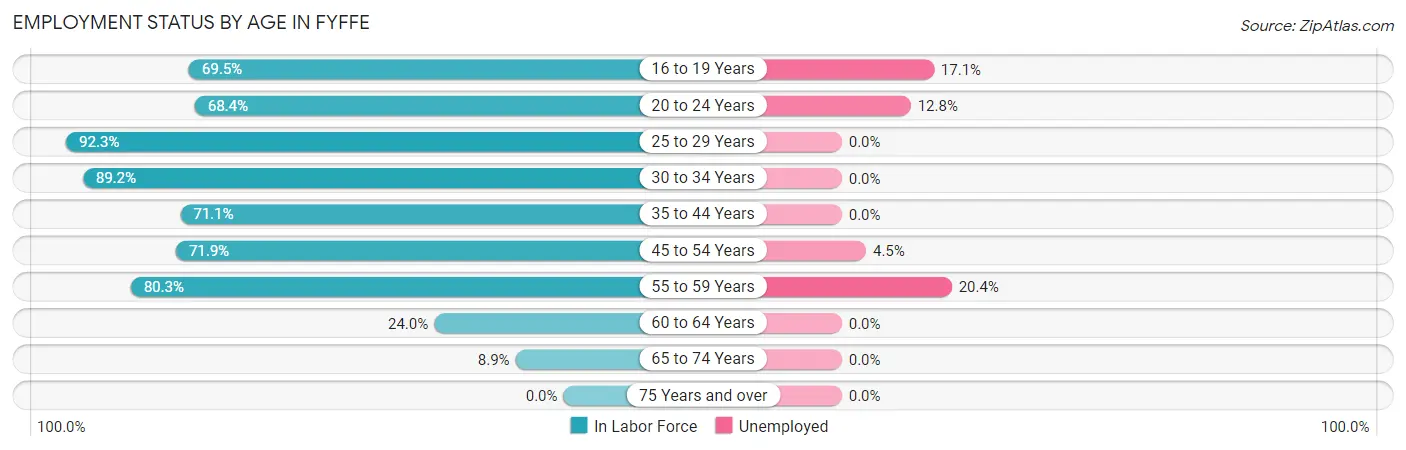
| Age Bracket | In Labor Force | Unemployed |
| 16 to 19 Years | 41 (69.5%) | 7 (17.1%) |
| 20 to 24 Years | 39 (68.4%) | 5 (12.8%) |
| 25 to 29 Years | 60 (92.3%) | 0 (0.0%) |
| 30 to 34 Years | 33 (89.2%) | 0 (0.0%) |
| 35 to 44 Years | 113 (71.1%) | 0 (0.0%) |
| 45 to 54 Years | 110 (71.9%) | 5 (4.5%) |
| 55 to 59 Years | 49 (80.3%) | 10 (20.4%) |
| 60 to 64 Years | 12 (24.0%) | 0 (0.0%) |
| 65 to 74 Years | 19 (8.9%) | 0 (0.0%) |
| 75 Years and over | 0 (0.0%) | 0 (0.0%) |
| Total | 476 (46.3%) | 27 (5.7%) |
Employment Status by Educational Attainment in Fyffe
According to labor force statistics for Fyffe, 71.8% of individuals (377) out of the total population between 25 and 64 years of age (525) are in the labor force, with 4.0% or 15 of them being unemployed. The group with the highest labor force participation rate are those with the educational attainment of bachelor's degree or higher, with 100.0% or 44 individuals in the labor force. Within the labor force, individuals with less than high school education have the highest percentage of unemployment, with 24.6% or 15 of them being unemployed.
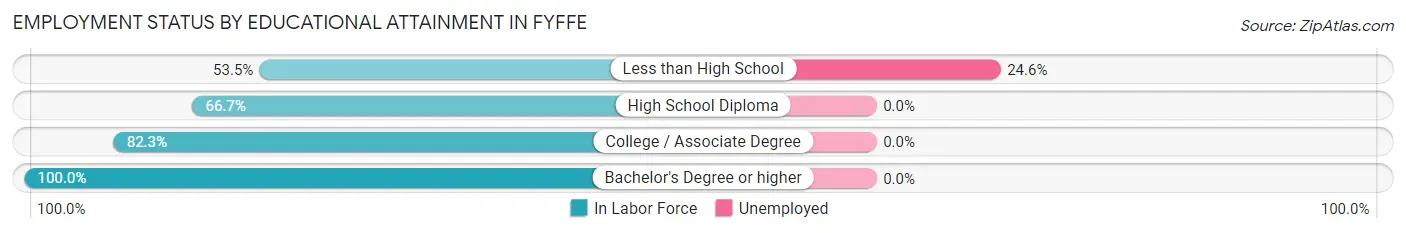
| Educational Attainment | In Labor Force | Unemployed |
| Less than High School | 61 (53.5%) | 28 (24.6%) |
| High School Diploma | 128 (66.7%) | 0 (0.0%) |
| College / Associate Degree | 144 (82.3%) | 0 (0.0%) |
| Bachelor's Degree or higher | 44 (100.0%) | 0 (0.0%) |
| Total | 377 (71.8%) | 21 (4.0%) |
Employment Occupations by Sex in Fyffe
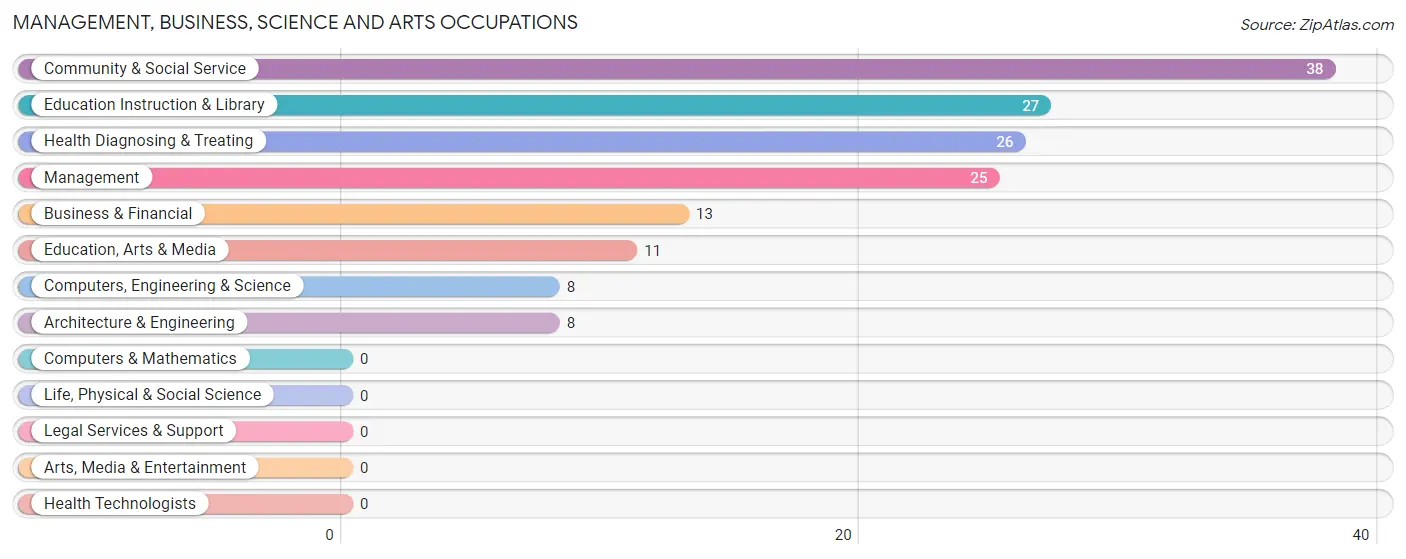
Management, Business, Science and Arts Occupations
The most common Management, Business, Science and Arts occupations in Fyffe are Community & Social Service (38 | 8.5%), Education Instruction & Library (27 | 6.0%), Health Diagnosing & Treating (26 | 5.8%), Management (25 | 5.6%), and Business & Financial (13 | 2.9%).
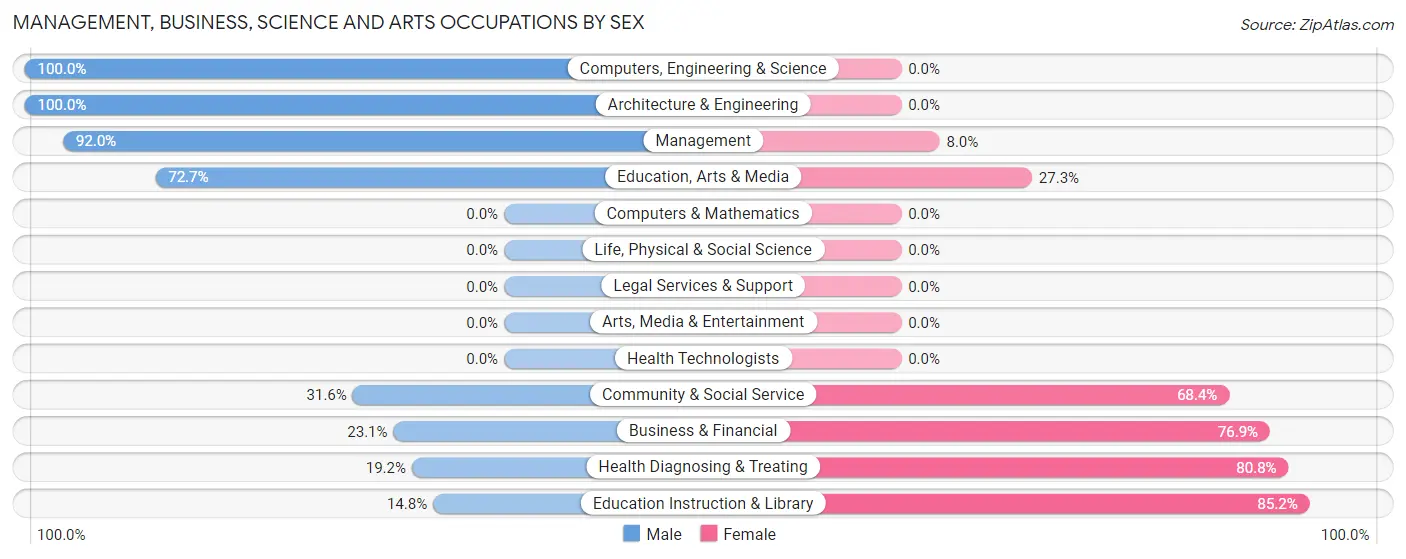
Management, Business, Science and Arts Occupations by Sex
Within the Management, Business, Science and Arts occupations in Fyffe, the most male-oriented occupations are Computers, Engineering & Science (100.0%), Architecture & Engineering (100.0%), and Management (92.0%), while the most female-oriented occupations are Education Instruction & Library (85.2%), Health Diagnosing & Treating (80.8%), and Business & Financial (76.9%).
| Occupation | Male | Female |
| Management | 23 (92.0%) | 2 (8.0%) |
| Business & Financial | 3 (23.1%) | 10 (76.9%) |
| Computers, Engineering & Science | 8 (100.0%) | 0 (0.0%) |
| Computers & Mathematics | 0 (0.0%) | 0 (0.0%) |
| Architecture & Engineering | 8 (100.0%) | 0 (0.0%) |
| Life, Physical & Social Science | 0 (0.0%) | 0 (0.0%) |
| Community & Social Service | 12 (31.6%) | 26 (68.4%) |
| Education, Arts & Media | 8 (72.7%) | 3 (27.3%) |
| Legal Services & Support | 0 (0.0%) | 0 (0.0%) |
| Education Instruction & Library | 4 (14.8%) | 23 (85.2%) |
| Arts, Media & Entertainment | 0 (0.0%) | 0 (0.0%) |
| Health Diagnosing & Treating | 5 (19.2%) | 21 (80.8%) |
| Health Technologists | 0 (0.0%) | 0 (0.0%) |
| Total (Category) | 51 (46.4%) | 59 (53.6%) |
| Total (Overall) | 276 (61.5%) | 173 (38.5%) |
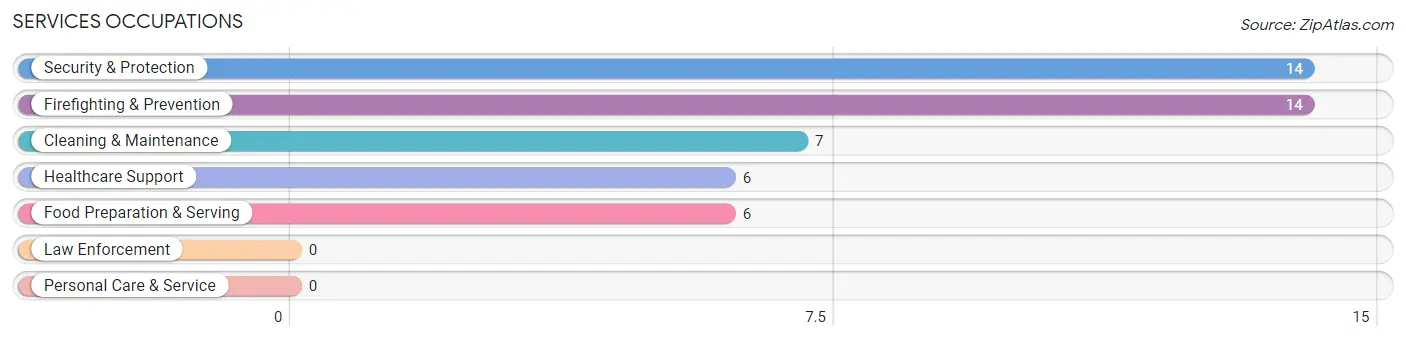
Services Occupations
The most common Services occupations in Fyffe are Security & Protection (14 | 3.1%), Firefighting & Prevention (14 | 3.1%), Cleaning & Maintenance (7 | 1.6%), Healthcare Support (6 | 1.3%), and Food Preparation & Serving (6 | 1.3%).
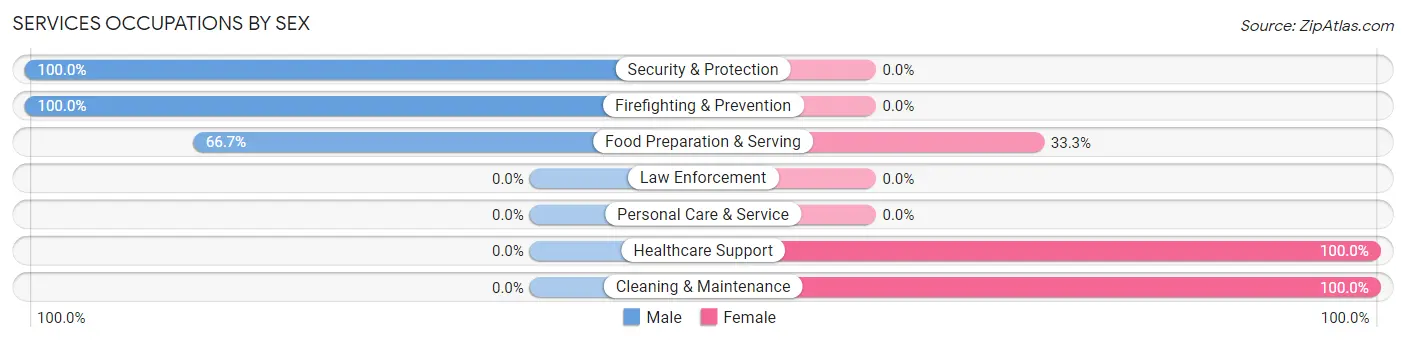
Services Occupations by Sex
Within the Services occupations in Fyffe, the most male-oriented occupations are Security & Protection (100.0%), Firefighting & Prevention (100.0%), and Food Preparation & Serving (66.7%), while the most female-oriented occupations are Healthcare Support (100.0%), Cleaning & Maintenance (100.0%), and Food Preparation & Serving (33.3%).
| Occupation | Male | Female |
| Healthcare Support | 0 (0.0%) | 6 (100.0%) |
| Security & Protection | 14 (100.0%) | 0 (0.0%) |
| Firefighting & Prevention | 14 (100.0%) | 0 (0.0%) |
| Law Enforcement | 0 (0.0%) | 0 (0.0%) |
| Food Preparation & Serving | 4 (66.7%) | 2 (33.3%) |
| Cleaning & Maintenance | 0 (0.0%) | 7 (100.0%) |
| Personal Care & Service | 0 (0.0%) | 0 (0.0%) |
| Total (Category) | 18 (54.5%) | 15 (45.5%) |
| Total (Overall) | 276 (61.5%) | 173 (38.5%) |
Sales and Office Occupations
The most common Sales and Office occupations in Fyffe are Office & Administration (44 | 9.8%), and Sales & Related (43 | 9.6%).
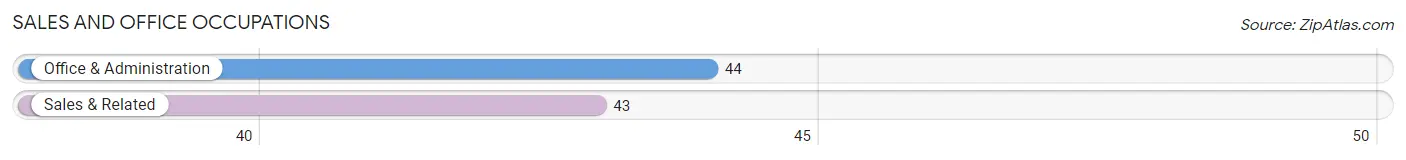
Sales and Office Occupations by Sex
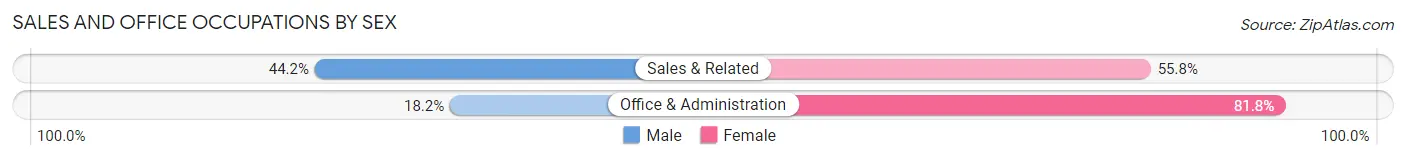
| Occupation | Male | Female |
| Sales & Related | 19 (44.2%) | 24 (55.8%) |
| Office & Administration | 8 (18.2%) | 36 (81.8%) |
| Total (Category) | 27 (31.0%) | 60 (69.0%) |
| Total (Overall) | 276 (61.5%) | 173 (38.5%) |
Natural Resources, Construction and Maintenance Occupations
The most common Natural Resources, Construction and Maintenance occupations in Fyffe are Installation, Maintenance & Repair (33 | 7.3%), and Construction & Extraction (24 | 5.3%).
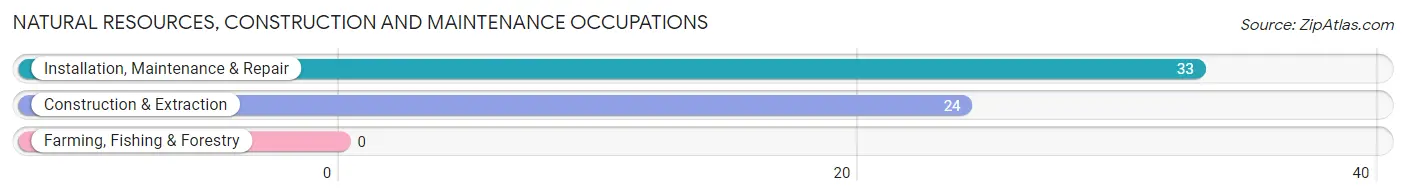
Natural Resources, Construction and Maintenance Occupations by Sex
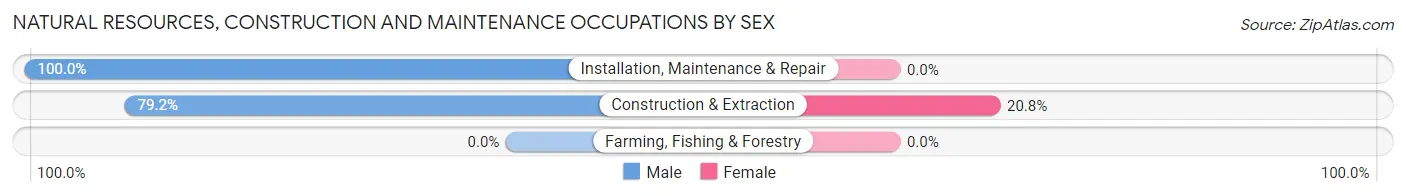
| Occupation | Male | Female |
| Farming, Fishing & Forestry | 0 (0.0%) | 0 (0.0%) |
| Construction & Extraction | 19 (79.2%) | 5 (20.8%) |
| Installation, Maintenance & Repair | 33 (100.0%) | 0 (0.0%) |
| Total (Category) | 52 (91.2%) | 5 (8.8%) |
| Total (Overall) | 276 (61.5%) | 173 (38.5%) |
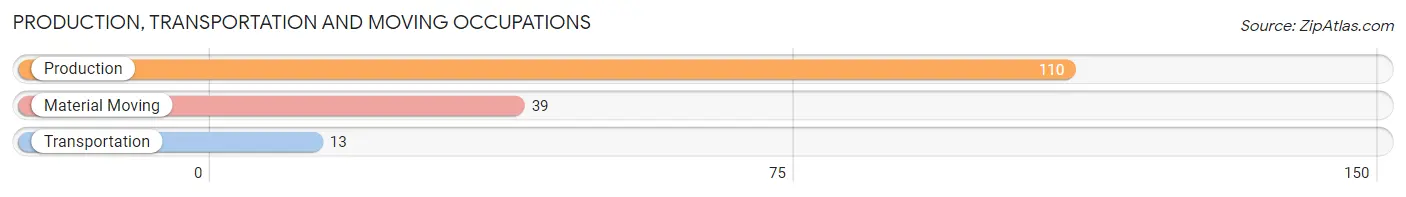
Production, Transportation and Moving Occupations
The most common Production, Transportation and Moving occupations in Fyffe are Production (110 | 24.5%), Material Moving (39 | 8.7%), and Transportation (13 | 2.9%).
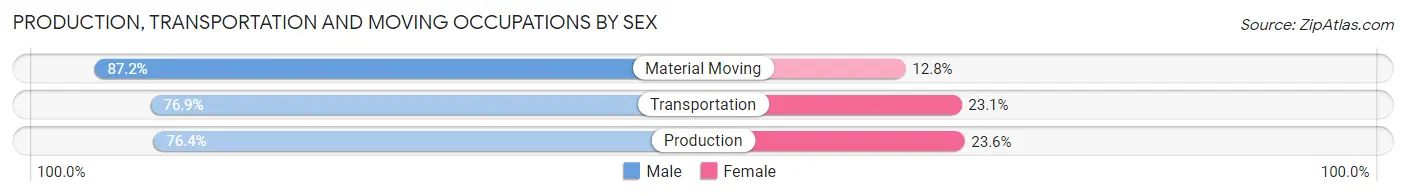
Production, Transportation and Moving Occupations by Sex
| Occupation | Male | Female |
| Production | 84 (76.4%) | 26 (23.6%) |
| Transportation | 10 (76.9%) | 3 (23.1%) |
| Material Moving | 34 (87.2%) | 5 (12.8%) |
| Total (Category) | 128 (79.0%) | 34 (21.0%) |
| Total (Overall) | 276 (61.5%) | 173 (38.5%) |
Employment Industries by Sex in Fyffe
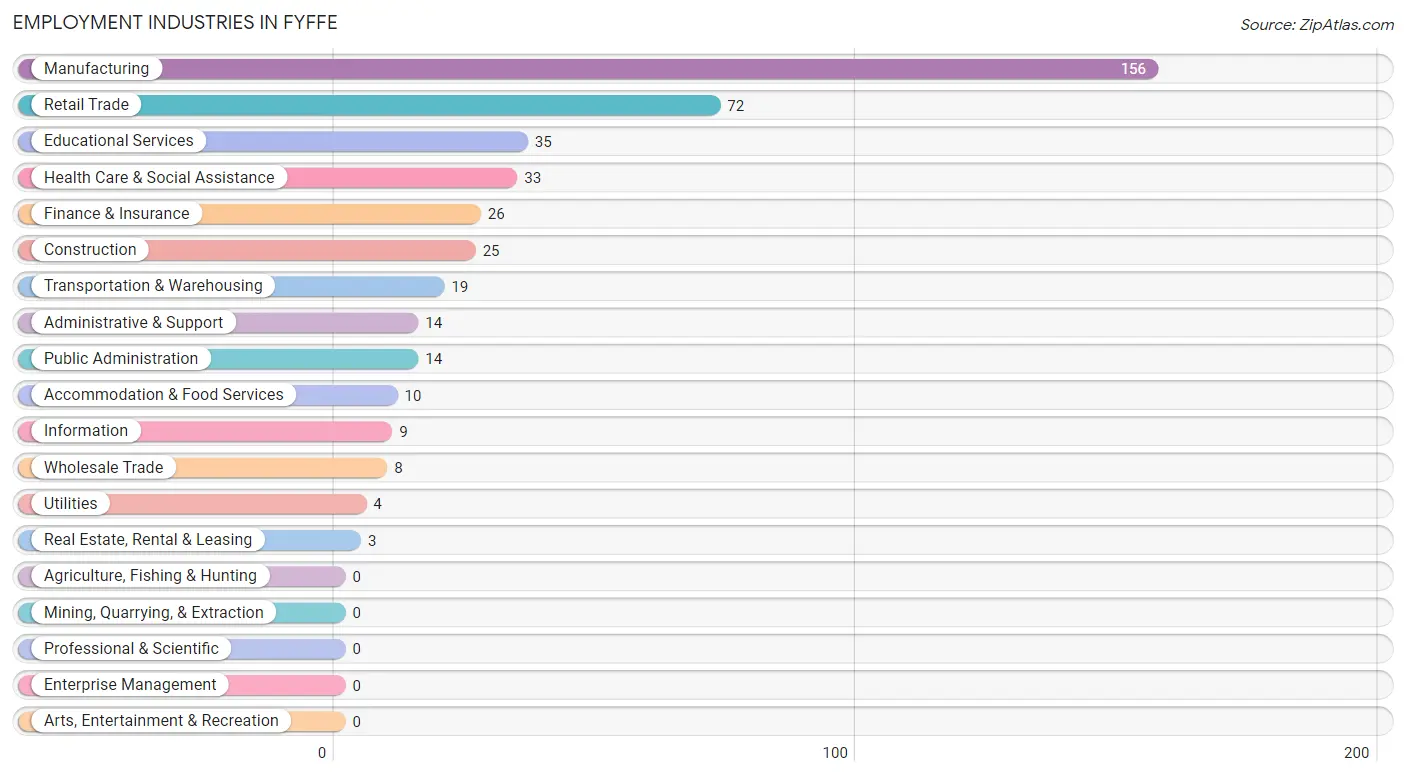
Employment Industries in Fyffe
The major employment industries in Fyffe include Manufacturing (156 | 34.7%), Retail Trade (72 | 16.0%), Educational Services (35 | 7.8%), Health Care & Social Assistance (33 | 7.3%), and Finance & Insurance (26 | 5.8%).
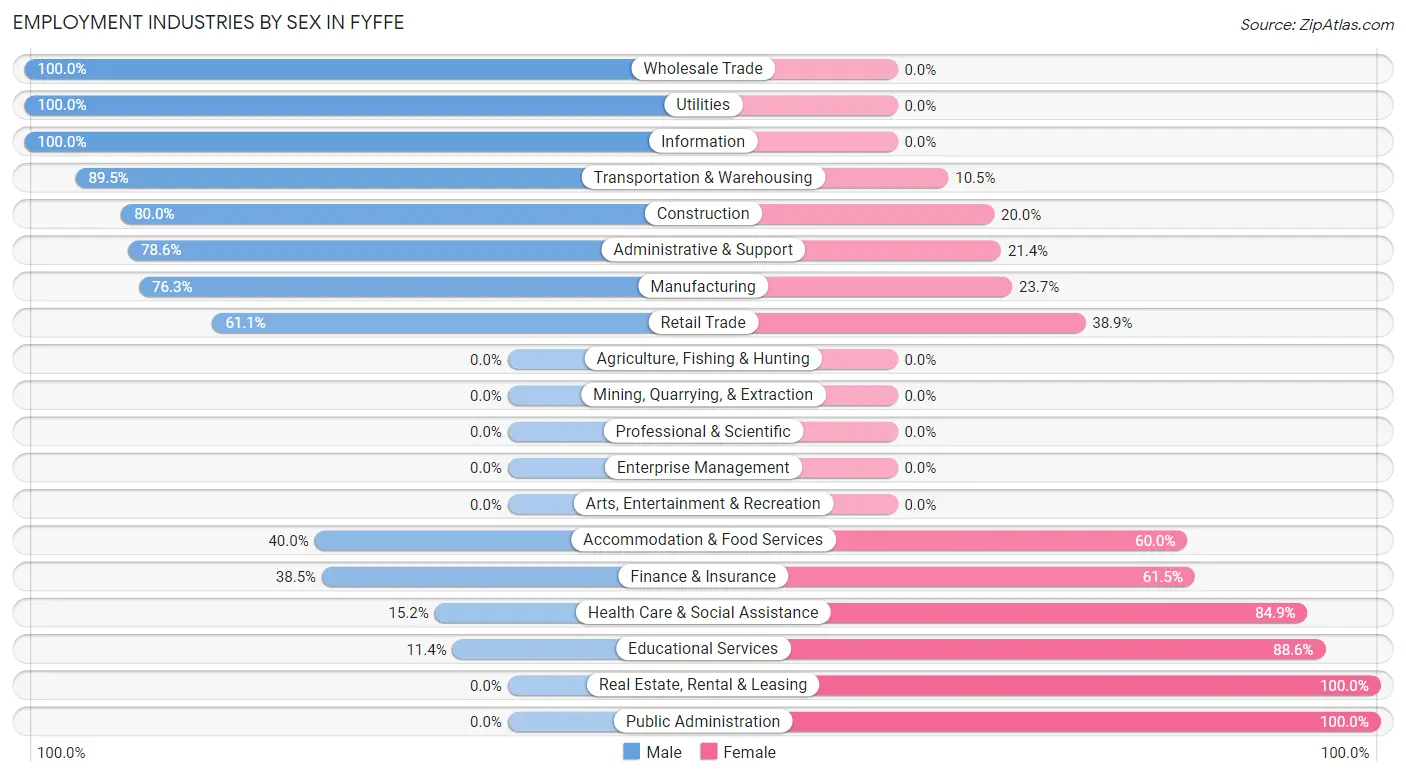
Employment Industries by Sex in Fyffe
The Fyffe industries that see more men than women are Wholesale Trade (100.0%), Utilities (100.0%), and Information (100.0%), whereas the industries that tend to have a higher number of women are Real Estate, Rental & Leasing (100.0%), Public Administration (100.0%), and Educational Services (88.6%).
| Industry | Male | Female |
| Agriculture, Fishing & Hunting | 0 (0.0%) | 0 (0.0%) |
| Mining, Quarrying, & Extraction | 0 (0.0%) | 0 (0.0%) |
| Construction | 20 (80.0%) | 5 (20.0%) |
| Manufacturing | 119 (76.3%) | 37 (23.7%) |
| Wholesale Trade | 8 (100.0%) | 0 (0.0%) |
| Retail Trade | 44 (61.1%) | 28 (38.9%) |
| Transportation & Warehousing | 17 (89.5%) | 2 (10.5%) |
| Utilities | 4 (100.0%) | 0 (0.0%) |
| Information | 9 (100.0%) | 0 (0.0%) |
| Finance & Insurance | 10 (38.5%) | 16 (61.5%) |
| Real Estate, Rental & Leasing | 0 (0.0%) | 3 (100.0%) |
| Professional & Scientific | 0 (0.0%) | 0 (0.0%) |
| Enterprise Management | 0 (0.0%) | 0 (0.0%) |
| Administrative & Support | 11 (78.6%) | 3 (21.4%) |
| Educational Services | 4 (11.4%) | 31 (88.6%) |
| Health Care & Social Assistance | 5 (15.1%) | 28 (84.9%) |
| Arts, Entertainment & Recreation | 0 (0.0%) | 0 (0.0%) |
| Accommodation & Food Services | 4 (40.0%) | 6 (60.0%) |
| Public Administration | 0 (0.0%) | 14 (100.0%) |
| Total | 276 (61.5%) | 173 (38.5%) |
Education in Fyffe
School Enrollment in Fyffe
The most common levels of schooling among the 181 students in Fyffe are middle school (45 | 24.9%), high school (37 | 20.4%), and elementary school (36 | 19.9%).
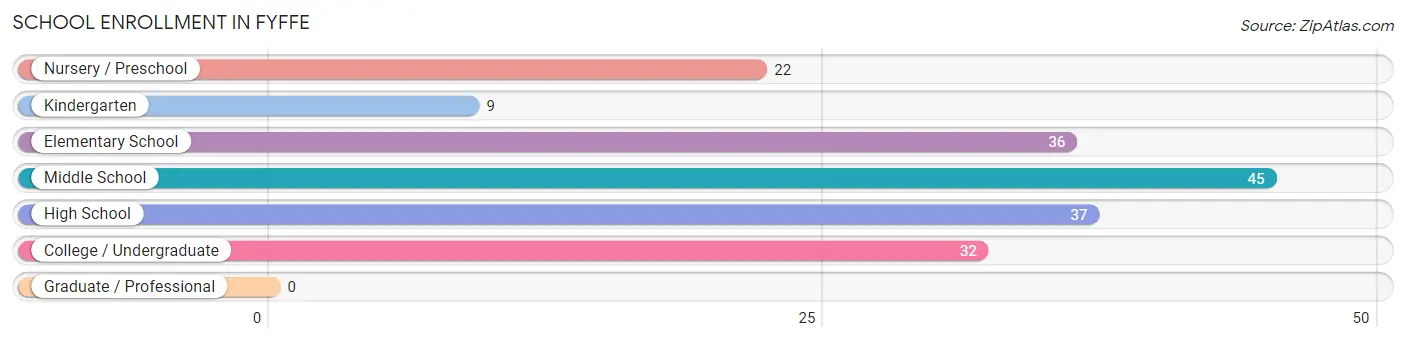
| School Level | # Students | % Students |
| Nursery / Preschool | 22 | 12.1% |
| Kindergarten | 9 | 5.0% |
| Elementary School | 36 | 19.9% |
| Middle School | 45 | 24.9% |
| High School | 37 | 20.4% |
| College / Undergraduate | 32 | 17.7% |
| Graduate / Professional | 0 | 0.0% |
| Total | 181 | 100.0% |
School Enrollment by Age by Funding Source in Fyffe
Out of a total of 181 students who are enrolled in schools in Fyffe, 16 (8.8%) attend a private institution, while the remaining 165 (91.2%) are enrolled in public schools. The age group of 25 to 34 year olds has the highest likelihood of being enrolled in private schools, with 5 (62.5% in the age bracket) enrolled. Conversely, the age group of 3 to 4 year olds has the lowest likelihood of being enrolled in a private school, with 22 (100.0% in the age bracket) attending a public institution.
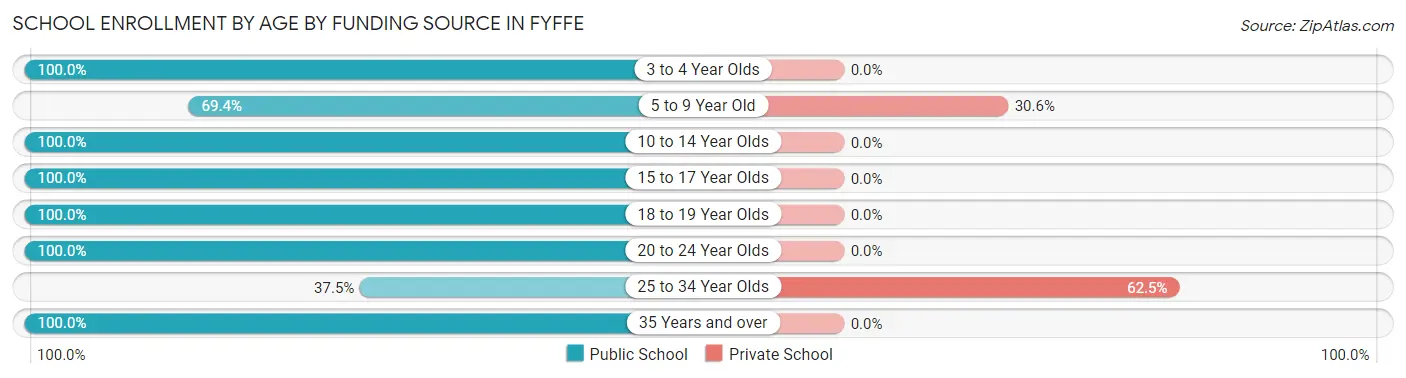
| Age Bracket | Public School | Private School |
| 3 to 4 Year Olds | 22 (100.0%) | 0 (0.0%) |
| 5 to 9 Year Old | 25 (69.4%) | 11 (30.6%) |
| 10 to 14 Year Olds | 59 (100.0%) | 0 (0.0%) |
| 15 to 17 Year Olds | 28 (100.0%) | 0 (0.0%) |
| 18 to 19 Year Olds | 7 (100.0%) | 0 (0.0%) |
| 20 to 24 Year Olds | 12 (100.0%) | 0 (0.0%) |
| 25 to 34 Year Olds | 3 (37.5%) | 5 (62.5%) |
| 35 Years and over | 9 (100.0%) | 0 (0.0%) |
| Total | 165 (91.2%) | 16 (8.8%) |
Educational Attainment by Field of Study in Fyffe
Education (23 | 46.0%), multidisciplinary studies (6 | 12.0%), liberal arts & history (6 | 12.0%), physical & health sciences (5 | 10.0%), and business (5 | 10.0%) are the most common fields of study among 50 individuals in Fyffe who have obtained a bachelor's degree or higher.
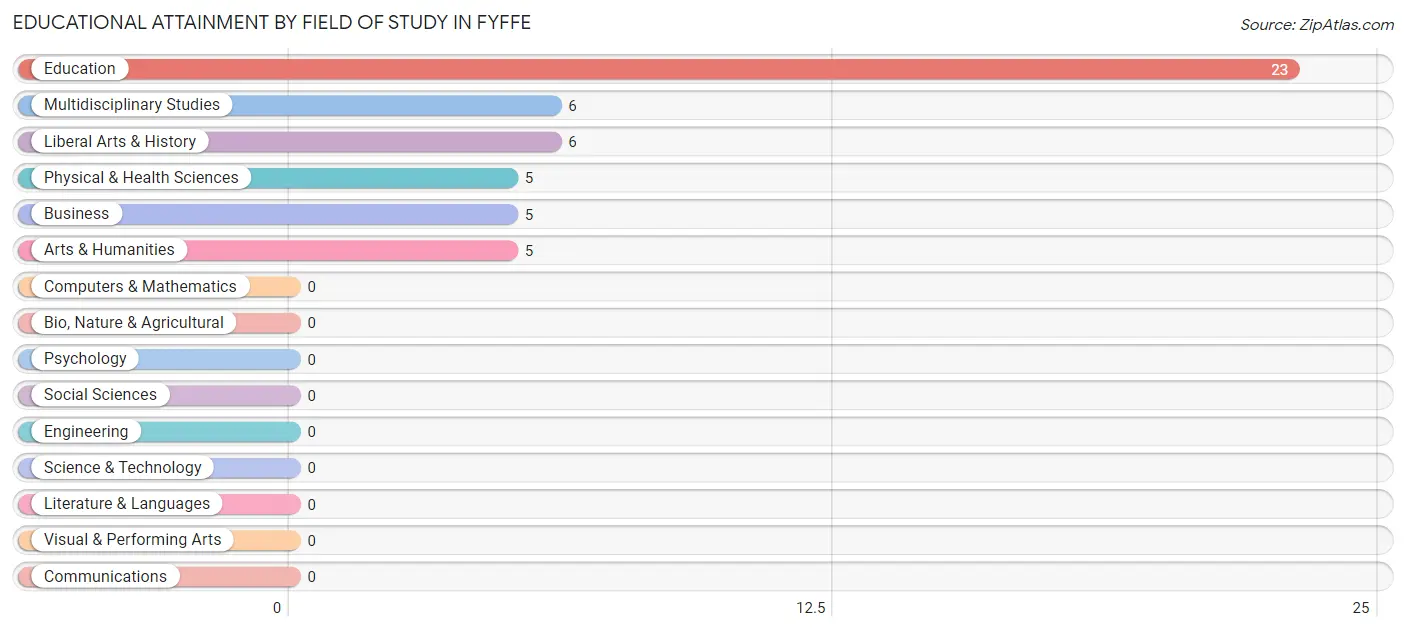
| Field of Study | # Graduates | % Graduates |
| Computers & Mathematics | 0 | 0.0% |
| Bio, Nature & Agricultural | 0 | 0.0% |
| Physical & Health Sciences | 5 | 10.0% |
| Psychology | 0 | 0.0% |
| Social Sciences | 0 | 0.0% |
| Engineering | 0 | 0.0% |
| Multidisciplinary Studies | 6 | 12.0% |
| Science & Technology | 0 | 0.0% |
| Business | 5 | 10.0% |
| Education | 23 | 46.0% |
| Literature & Languages | 0 | 0.0% |
| Liberal Arts & History | 6 | 12.0% |
| Visual & Performing Arts | 0 | 0.0% |
| Communications | 0 | 0.0% |
| Arts & Humanities | 5 | 10.0% |
| Total | 50 | 100.0% |
Transportation & Commute in Fyffe
Vehicle Availability by Sex in Fyffe
The most prevalent vehicle ownership categories in Fyffe are males with 2 vehicles (93, accounting for 34.1%) and females with 2 vehicles (87, making up 53.8%).
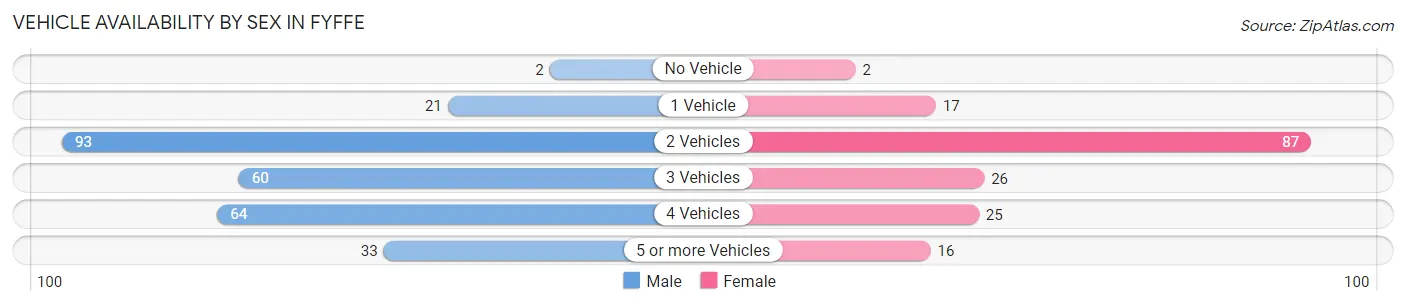
| Vehicles Available | Male | Female |
| No Vehicle | 2 (0.7%) | 2 (1.2%) |
| 1 Vehicle | 21 (7.7%) | 17 (9.8%) |
| 2 Vehicles | 93 (34.1%) | 87 (50.3%) |
| 3 Vehicles | 60 (22.0%) | 26 (15.0%) |
| 4 Vehicles | 64 (23.4%) | 25 (14.4%) |
| 5 or more Vehicles | 33 (12.1%) | 16 (9.2%) |
| Total | 273 (100.0%) | 173 (100.0%) |
Commute Time in Fyffe
The most frequently occuring commute durations in Fyffe are 20 to 24 minutes (93 commuters, 20.9%), 5 to 9 minutes (67 commuters, 15.1%), and 30 to 34 minutes (61 commuters, 13.7%).
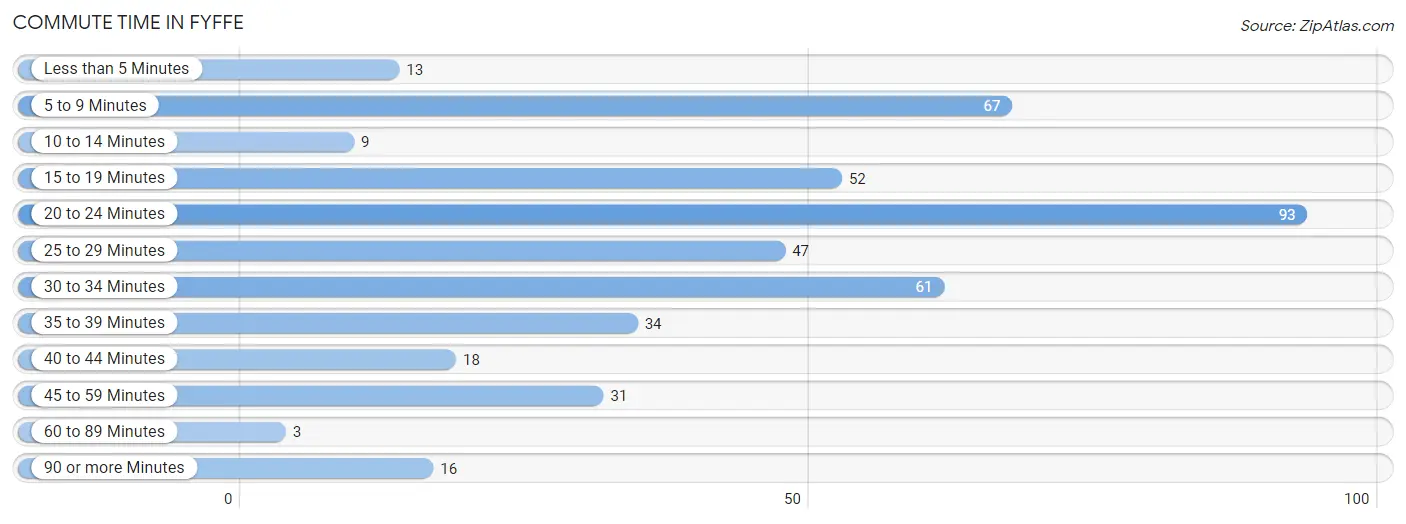
| Commute Time | # Commuters | % Commuters |
| Less than 5 Minutes | 13 | 2.9% |
| 5 to 9 Minutes | 67 | 15.1% |
| 10 to 14 Minutes | 9 | 2.0% |
| 15 to 19 Minutes | 52 | 11.7% |
| 20 to 24 Minutes | 93 | 20.9% |
| 25 to 29 Minutes | 47 | 10.6% |
| 30 to 34 Minutes | 61 | 13.7% |
| 35 to 39 Minutes | 34 | 7.7% |
| 40 to 44 Minutes | 18 | 4.1% |
| 45 to 59 Minutes | 31 | 7.0% |
| 60 to 89 Minutes | 3 | 0.7% |
| 90 or more Minutes | 16 | 3.6% |
Commute Time by Sex in Fyffe
The most common commute times in Fyffe are 20 to 24 minutes (67 commuters, 24.3%) for males and 5 to 9 minutes (48 commuters, 28.6%) for females.
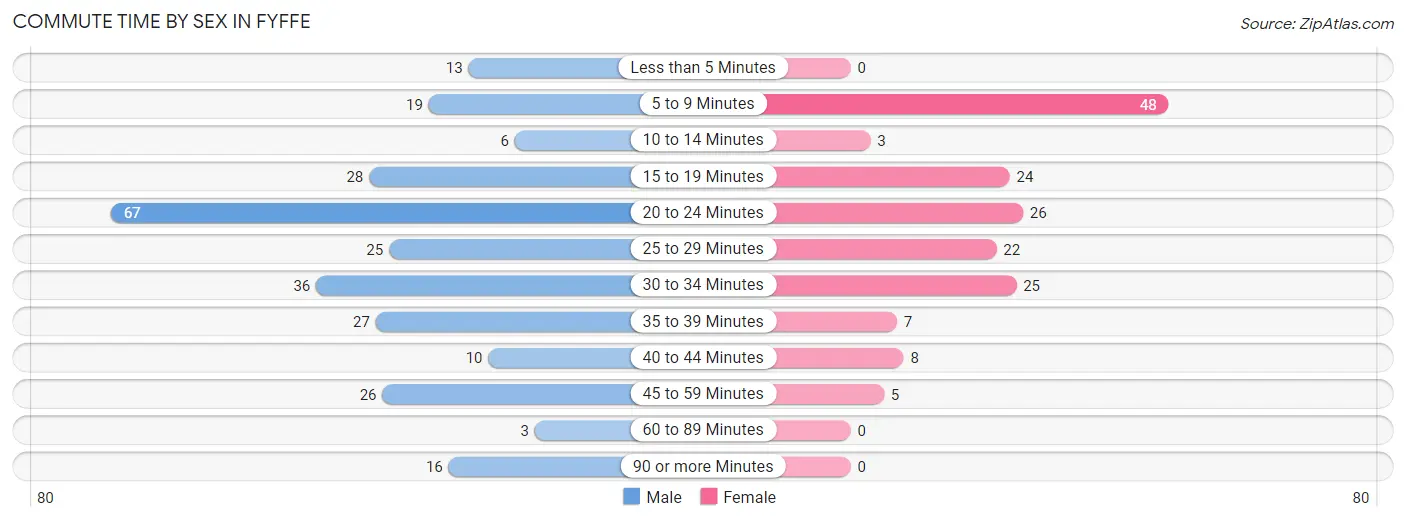
| Commute Time | Male | Female |
| Less than 5 Minutes | 13 (4.7%) | 0 (0.0%) |
| 5 to 9 Minutes | 19 (6.9%) | 48 (28.6%) |
| 10 to 14 Minutes | 6 (2.2%) | 3 (1.8%) |
| 15 to 19 Minutes | 28 (10.1%) | 24 (14.3%) |
| 20 to 24 Minutes | 67 (24.3%) | 26 (15.5%) |
| 25 to 29 Minutes | 25 (9.1%) | 22 (13.1%) |
| 30 to 34 Minutes | 36 (13.0%) | 25 (14.9%) |
| 35 to 39 Minutes | 27 (9.8%) | 7 (4.2%) |
| 40 to 44 Minutes | 10 (3.6%) | 8 (4.8%) |
| 45 to 59 Minutes | 26 (9.4%) | 5 (3.0%) |
| 60 to 89 Minutes | 3 (1.1%) | 0 (0.0%) |
| 90 or more Minutes | 16 (5.8%) | 0 (0.0%) |
Time of Departure to Work by Sex in Fyffe
The most frequent times of departure to work in Fyffe are 7:00 AM to 7:29 AM (60, 21.7%) for males and 7:30 AM to 7:59 AM (51, 30.4%) for females.
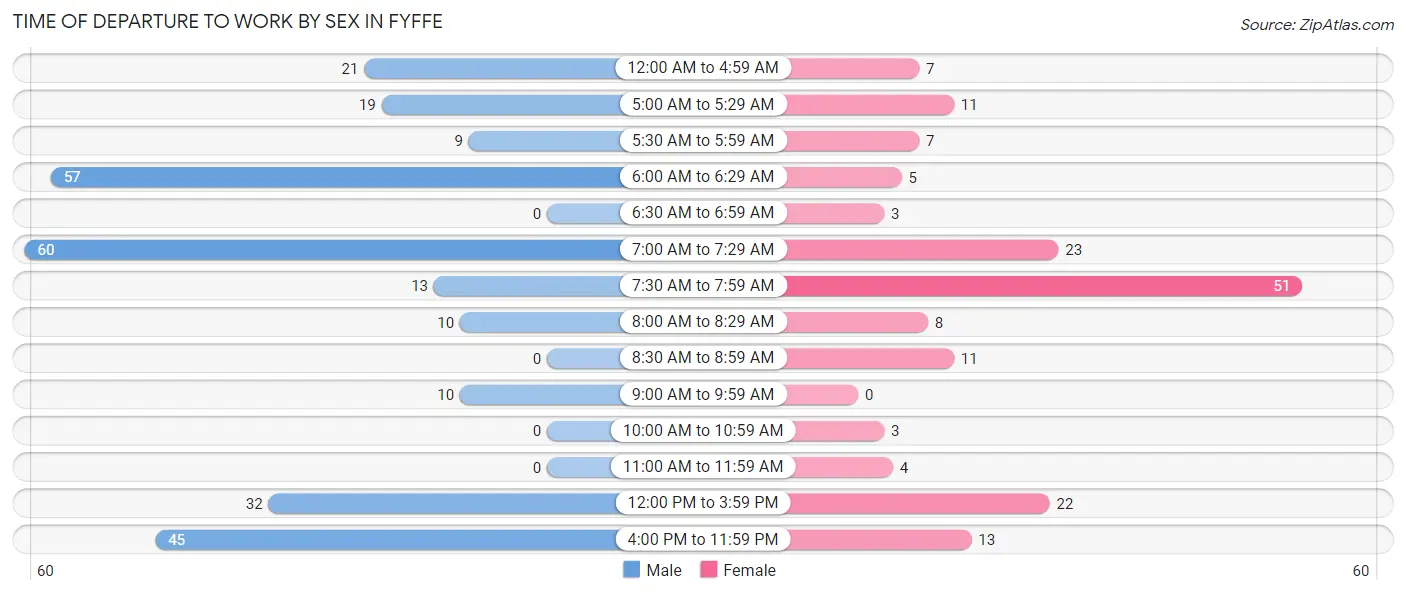
| Time of Departure | Male | Female |
| 12:00 AM to 4:59 AM | 21 (7.6%) | 7 (4.2%) |
| 5:00 AM to 5:29 AM | 19 (6.9%) | 11 (6.6%) |
| 5:30 AM to 5:59 AM | 9 (3.3%) | 7 (4.2%) |
| 6:00 AM to 6:29 AM | 57 (20.6%) | 5 (3.0%) |
| 6:30 AM to 6:59 AM | 0 (0.0%) | 3 (1.8%) |
| 7:00 AM to 7:29 AM | 60 (21.7%) | 23 (13.7%) |
| 7:30 AM to 7:59 AM | 13 (4.7%) | 51 (30.4%) |
| 8:00 AM to 8:29 AM | 10 (3.6%) | 8 (4.8%) |
| 8:30 AM to 8:59 AM | 0 (0.0%) | 11 (6.6%) |
| 9:00 AM to 9:59 AM | 10 (3.6%) | 0 (0.0%) |
| 10:00 AM to 10:59 AM | 0 (0.0%) | 3 (1.8%) |
| 11:00 AM to 11:59 AM | 0 (0.0%) | 4 (2.4%) |
| 12:00 PM to 3:59 PM | 32 (11.6%) | 22 (13.1%) |
| 4:00 PM to 11:59 PM | 45 (16.3%) | 13 (7.7%) |
| Total | 276 (100.0%) | 168 (100.0%) |
Housing Occupancy in Fyffe
Occupancy by Ownership in Fyffe
Of the total 459 dwellings in Fyffe, owner-occupied units account for 351 (76.5%), while renter-occupied units make up 108 (23.5%).
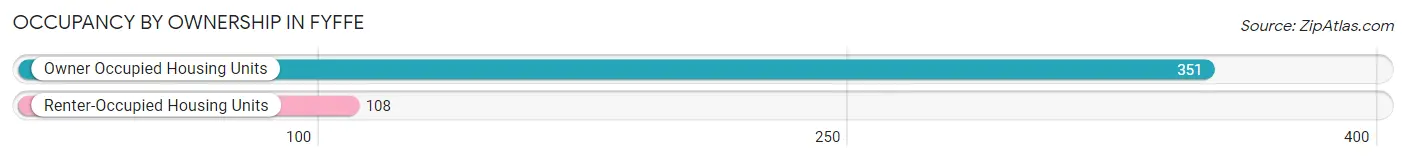
| Occupancy | # Housing Units | % Housing Units |
| Owner Occupied Housing Units | 351 | 76.5% |
| Renter-Occupied Housing Units | 108 | 23.5% |
| Total Occupied Housing Units | 459 | 100.0% |
Occupancy by Household Size in Fyffe
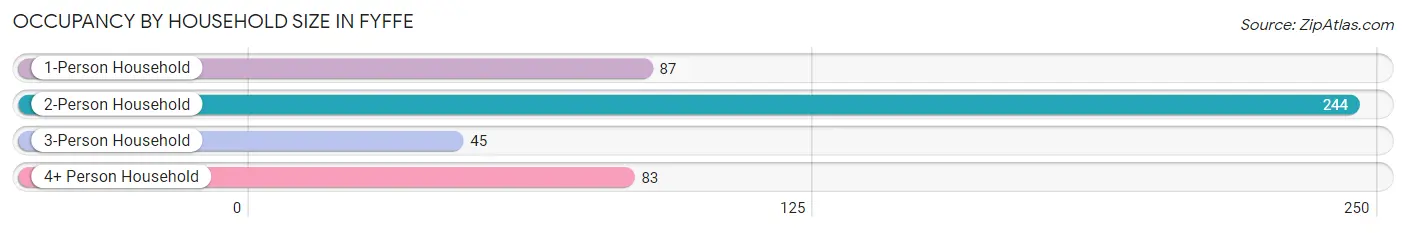
| Household Size | # Housing Units | % Housing Units |
| 1-Person Household | 87 | 19.0% |
| 2-Person Household | 244 | 53.2% |
| 3-Person Household | 45 | 9.8% |
| 4+ Person Household | 83 | 18.1% |
| Total Housing Units | 459 | 100.0% |
Occupancy by Ownership by Household Size in Fyffe
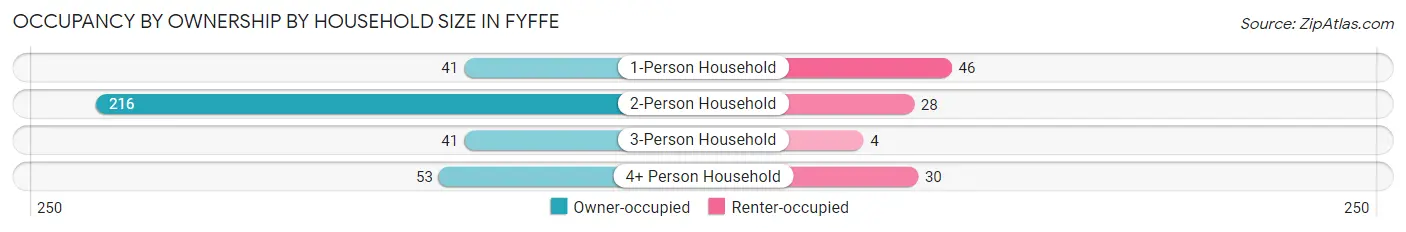
| Household Size | Owner-occupied | Renter-occupied |
| 1-Person Household | 41 (47.1%) | 46 (52.9%) |
| 2-Person Household | 216 (88.5%) | 28 (11.5%) |
| 3-Person Household | 41 (91.1%) | 4 (8.9%) |
| 4+ Person Household | 53 (63.9%) | 30 (36.1%) |
| Total Housing Units | 351 (76.5%) | 108 (23.5%) |
Occupancy by Educational Attainment in Fyffe
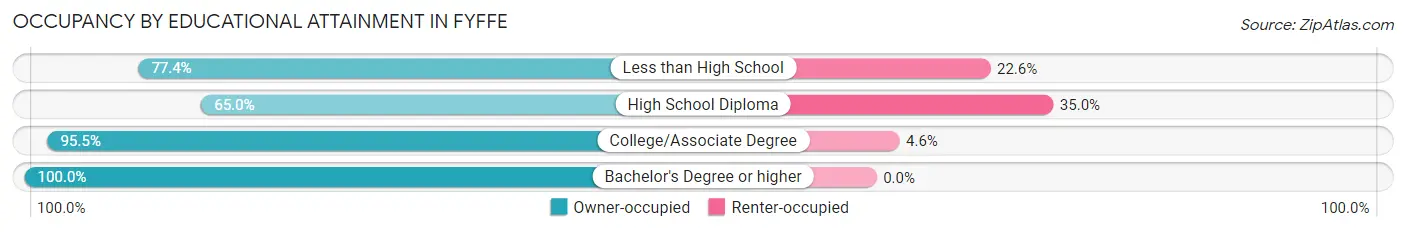
| Household Size | Owner-occupied | Renter-occupied |
| Less than High School | 48 (77.4%) | 14 (22.6%) |
| High School Diploma | 165 (65.0%) | 89 (35.0%) |
| College/Associate Degree | 105 (95.5%) | 5 (4.5%) |
| Bachelor's Degree or higher | 33 (100.0%) | 0 (0.0%) |
Occupancy by Age of Householder in Fyffe
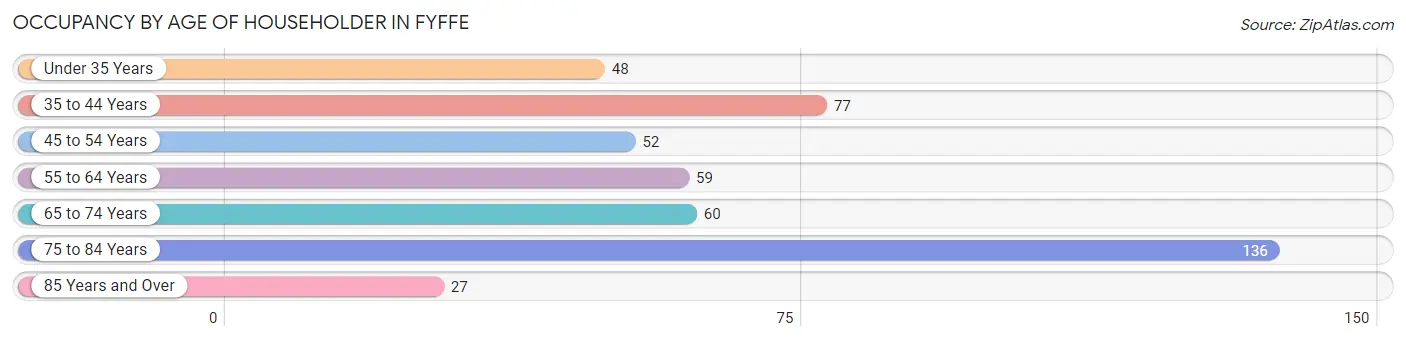
| Age Bracket | # Households | % Households |
| Under 35 Years | 48 | 10.5% |
| 35 to 44 Years | 77 | 16.8% |
| 45 to 54 Years | 52 | 11.3% |
| 55 to 64 Years | 59 | 12.9% |
| 65 to 74 Years | 60 | 13.1% |
| 75 to 84 Years | 136 | 29.6% |
| 85 Years and Over | 27 | 5.9% |
| Total | 459 | 100.0% |
Housing Finances in Fyffe
Median Income by Occupancy in Fyffe
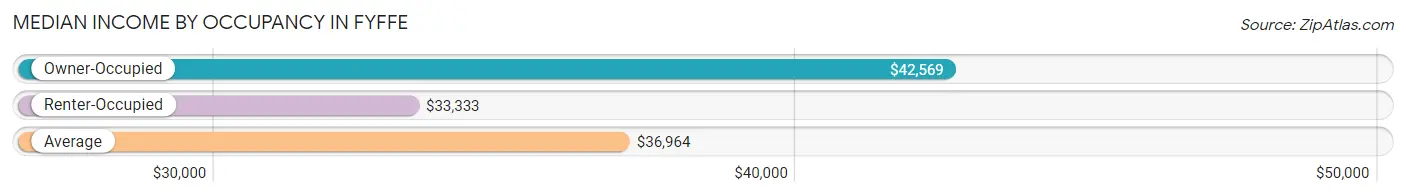
| Occupancy Type | # Households | Median Income |
| Owner-Occupied | 351 (76.5%) | $42,569 |
| Renter-Occupied | 108 (23.5%) | $33,333 |
| Average | 459 (100.0%) | $36,964 |
Occupancy by Householder Income Bracket in Fyffe
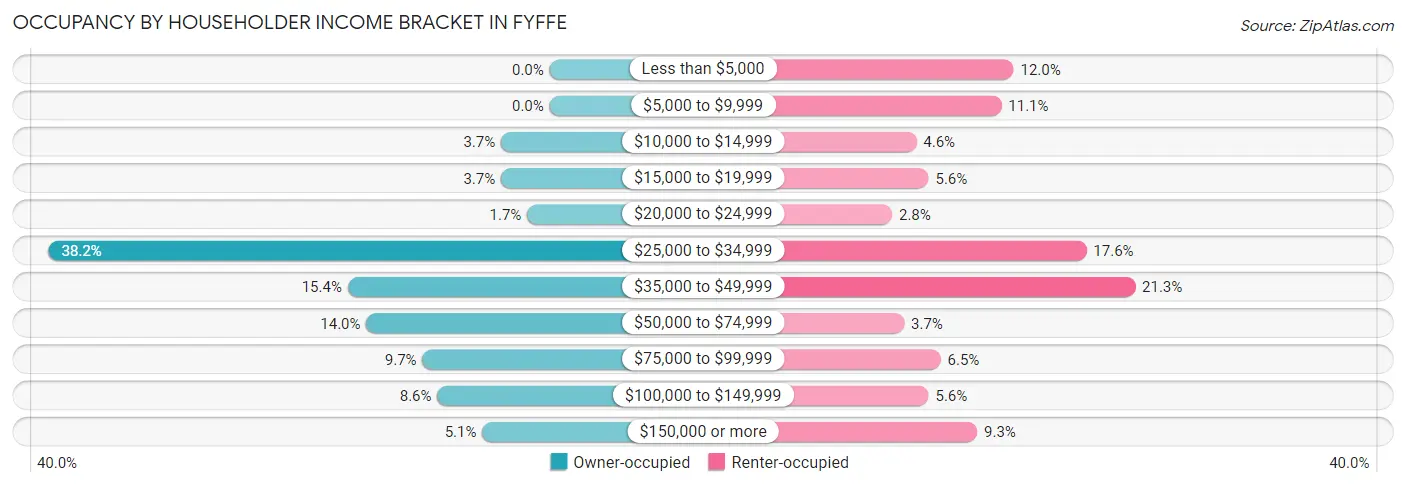
| Income Bracket | Owner-occupied | Renter-occupied |
| Less than $5,000 | 0 (0.0%) | 13 (12.0%) |
| $5,000 to $9,999 | 0 (0.0%) | 12 (11.1%) |
| $10,000 to $14,999 | 13 (3.7%) | 5 (4.6%) |
| $15,000 to $19,999 | 13 (3.7%) | 6 (5.6%) |
| $20,000 to $24,999 | 6 (1.7%) | 3 (2.8%) |
| $25,000 to $34,999 | 134 (38.2%) | 19 (17.6%) |
| $35,000 to $49,999 | 54 (15.4%) | 23 (21.3%) |
| $50,000 to $74,999 | 49 (14.0%) | 4 (3.7%) |
| $75,000 to $99,999 | 34 (9.7%) | 7 (6.5%) |
| $100,000 to $149,999 | 30 (8.6%) | 6 (5.6%) |
| $150,000 or more | 18 (5.1%) | 10 (9.3%) |
| Total | 351 (100.0%) | 108 (100.0%) |
Monthly Housing Cost Tiers in Fyffe
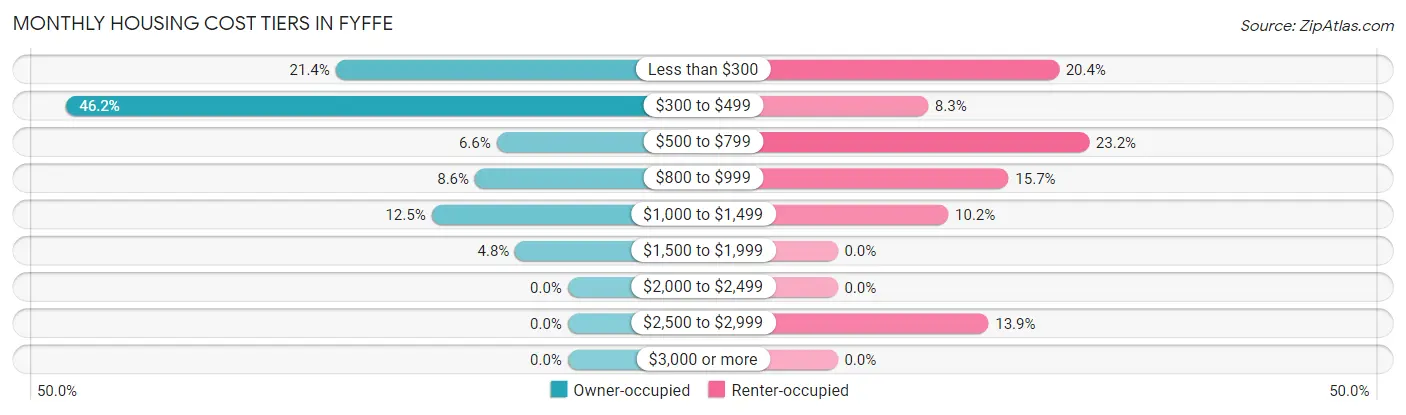
| Monthly Cost | Owner-occupied | Renter-occupied |
| Less than $300 | 75 (21.4%) | 22 (20.4%) |
| $300 to $499 | 162 (46.2%) | 9 (8.3%) |
| $500 to $799 | 23 (6.6%) | 25 (23.2%) |
| $800 to $999 | 30 (8.6%) | 17 (15.7%) |
| $1,000 to $1,499 | 44 (12.5%) | 11 (10.2%) |
| $1,500 to $1,999 | 17 (4.8%) | 0 (0.0%) |
| $2,000 to $2,499 | 0 (0.0%) | 0 (0.0%) |
| $2,500 to $2,999 | 0 (0.0%) | 15 (13.9%) |
| $3,000 or more | 0 (0.0%) | 0 (0.0%) |
| Total | 351 (100.0%) | 108 (100.0%) |
Physical Housing Characteristics in Fyffe
Housing Structures in Fyffe
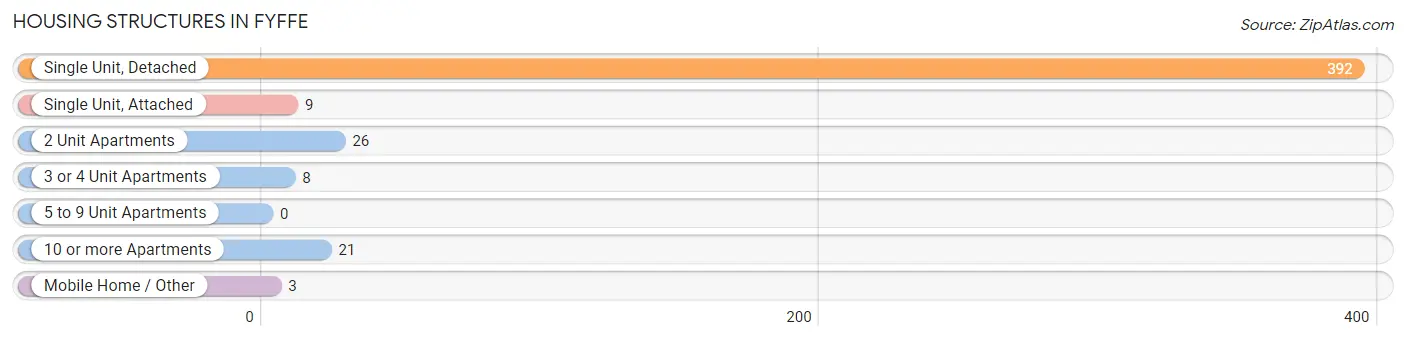
| Structure Type | # Housing Units | % Housing Units |
| Single Unit, Detached | 392 | 85.4% |
| Single Unit, Attached | 9 | 2.0% |
| 2 Unit Apartments | 26 | 5.7% |
| 3 or 4 Unit Apartments | 8 | 1.7% |
| 5 to 9 Unit Apartments | 0 | 0.0% |
| 10 or more Apartments | 21 | 4.6% |
| Mobile Home / Other | 3 | 0.6% |
| Total | 459 | 100.0% |
Housing Structures by Occupancy in Fyffe
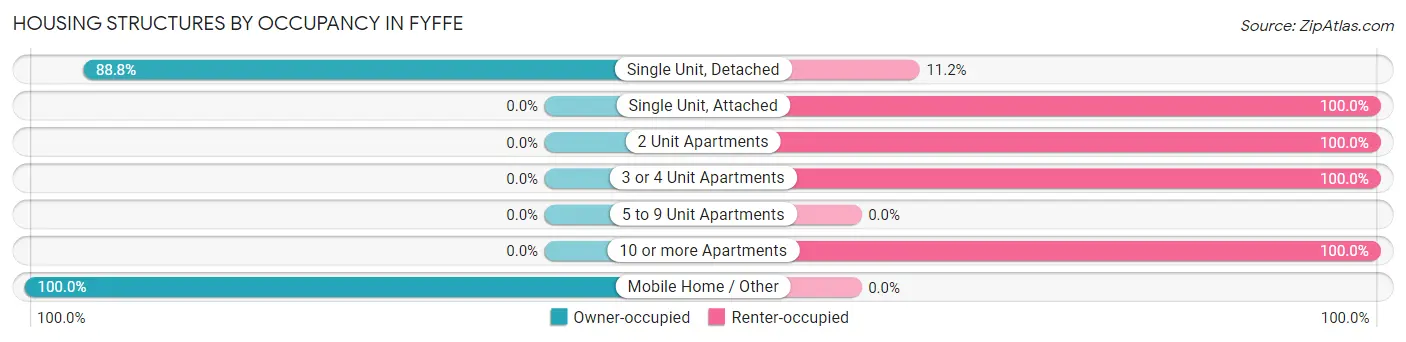
| Structure Type | Owner-occupied | Renter-occupied |
| Single Unit, Detached | 348 (88.8%) | 44 (11.2%) |
| Single Unit, Attached | 0 (0.0%) | 9 (100.0%) |
| 2 Unit Apartments | 0 (0.0%) | 26 (100.0%) |
| 3 or 4 Unit Apartments | 0 (0.0%) | 8 (100.0%) |
| 5 to 9 Unit Apartments | 0 (0.0%) | 0 (0.0%) |
| 10 or more Apartments | 0 (0.0%) | 21 (100.0%) |
| Mobile Home / Other | 3 (100.0%) | 0 (0.0%) |
| Total | 351 (76.5%) | 108 (23.5%) |
Housing Structures by Number of Rooms in Fyffe
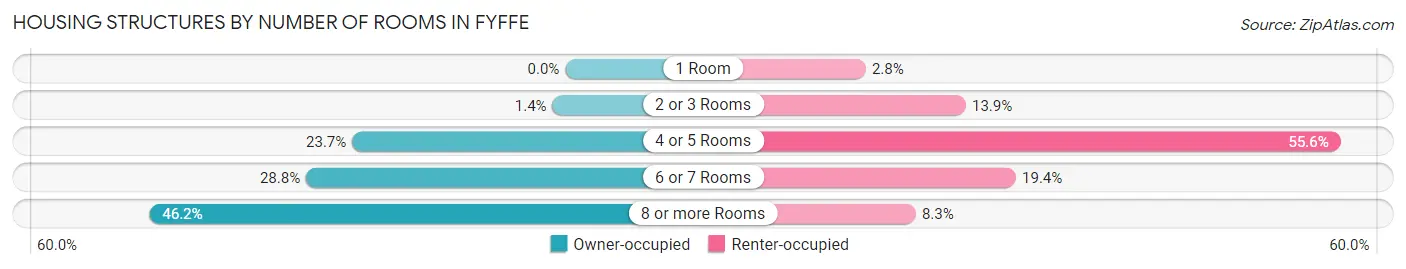
| Number of Rooms | Owner-occupied | Renter-occupied |
| 1 Room | 0 (0.0%) | 3 (2.8%) |
| 2 or 3 Rooms | 5 (1.4%) | 15 (13.9%) |
| 4 or 5 Rooms | 83 (23.6%) | 60 (55.6%) |
| 6 or 7 Rooms | 101 (28.8%) | 21 (19.4%) |
| 8 or more Rooms | 162 (46.2%) | 9 (8.3%) |
| Total | 351 (100.0%) | 108 (100.0%) |
Housing Structure by Heating Type in Fyffe
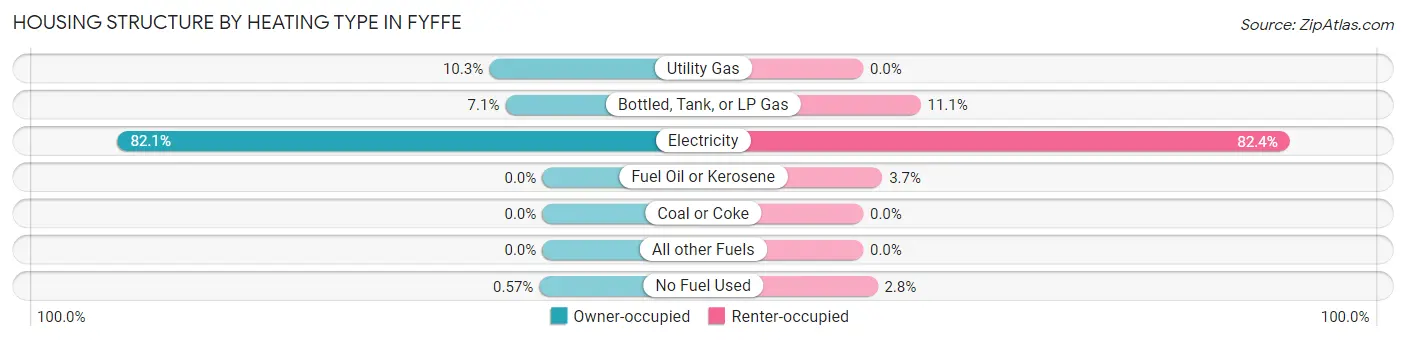
| Heating Type | Owner-occupied | Renter-occupied |
| Utility Gas | 36 (10.3%) | 0 (0.0%) |
| Bottled, Tank, or LP Gas | 25 (7.1%) | 12 (11.1%) |
| Electricity | 288 (82.1%) | 89 (82.4%) |
| Fuel Oil or Kerosene | 0 (0.0%) | 4 (3.7%) |
| Coal or Coke | 0 (0.0%) | 0 (0.0%) |
| All other Fuels | 0 (0.0%) | 0 (0.0%) |
| No Fuel Used | 2 (0.6%) | 3 (2.8%) |
| Total | 351 (100.0%) | 108 (100.0%) |
Household Vehicle Usage in Fyffe
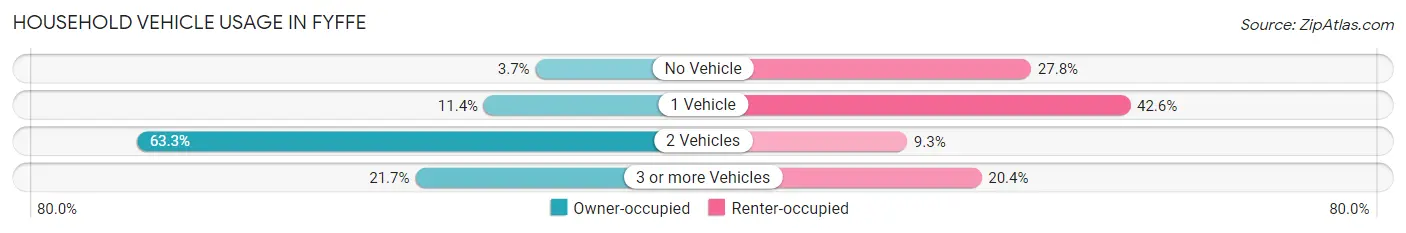
| Vehicles per Household | Owner-occupied | Renter-occupied |
| No Vehicle | 13 (3.7%) | 30 (27.8%) |
| 1 Vehicle | 40 (11.4%) | 46 (42.6%) |
| 2 Vehicles | 222 (63.2%) | 10 (9.3%) |
| 3 or more Vehicles | 76 (21.6%) | 22 (20.4%) |
| Total | 351 (100.0%) | 108 (100.0%) |
Real Estate & Mortgages in Fyffe
Real Estate and Mortgage Overview in Fyffe
| Characteristic | Without Mortgage | With Mortgage |
| Housing Units | 254 | 97 |
| Median Property Value | $107,000 | $140,600 |
| Median Household Income | $31,890 | $7 |
| Monthly Housing Costs | $320 | $0 |
| Real Estate Taxes | $467 | $0 |
Property Value by Mortgage Status in Fyffe
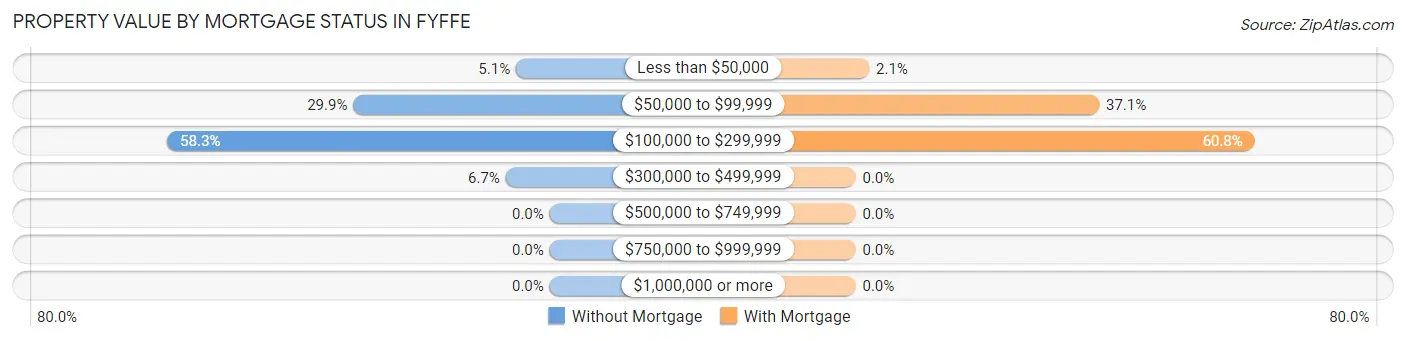
| Property Value | Without Mortgage | With Mortgage |
| Less than $50,000 | 13 (5.1%) | 2 (2.1%) |
| $50,000 to $99,999 | 76 (29.9%) | 36 (37.1%) |
| $100,000 to $299,999 | 148 (58.3%) | 59 (60.8%) |
| $300,000 to $499,999 | 17 (6.7%) | 0 (0.0%) |
| $500,000 to $749,999 | 0 (0.0%) | 0 (0.0%) |
| $750,000 to $999,999 | 0 (0.0%) | 0 (0.0%) |
| $1,000,000 or more | 0 (0.0%) | 0 (0.0%) |
| Total | 254 (100.0%) | 97 (100.0%) |
Household Income by Mortgage Status in Fyffe
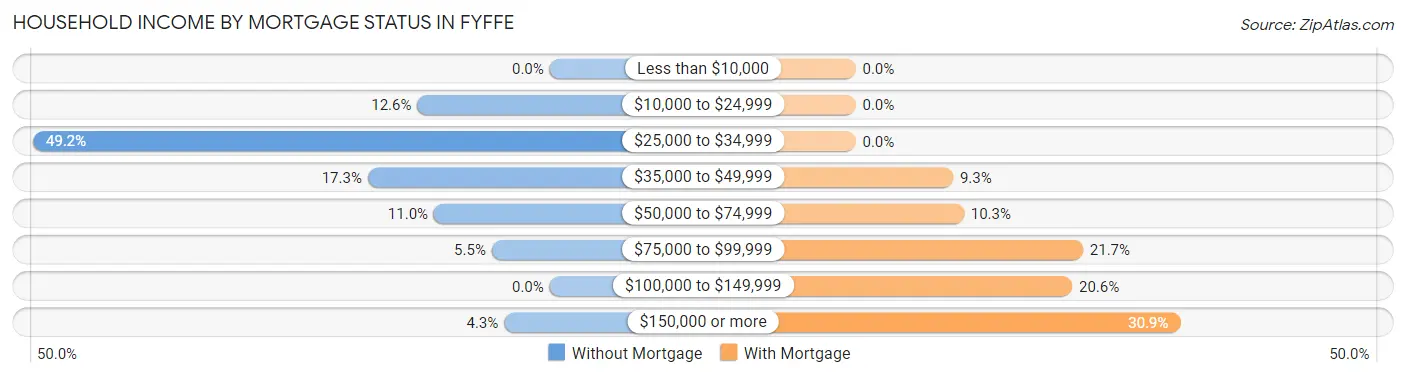
| Household Income | Without Mortgage | With Mortgage |
| Less than $10,000 | 0 (0.0%) | 0 (0.0%) |
| $10,000 to $24,999 | 32 (12.6%) | 0 (0.0%) |
| $25,000 to $34,999 | 125 (49.2%) | 0 (0.0%) |
| $35,000 to $49,999 | 44 (17.3%) | 9 (9.3%) |
| $50,000 to $74,999 | 28 (11.0%) | 10 (10.3%) |
| $75,000 to $99,999 | 14 (5.5%) | 21 (21.6%) |
| $100,000 to $149,999 | 0 (0.0%) | 20 (20.6%) |
| $150,000 or more | 11 (4.3%) | 30 (30.9%) |
| Total | 254 (100.0%) | 97 (100.0%) |
Property Value to Household Income Ratio in Fyffe
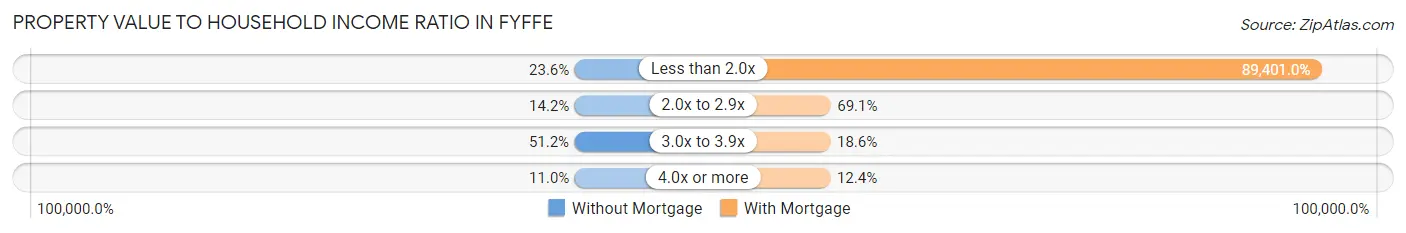
| Value-to-Income Ratio | Without Mortgage | With Mortgage |
| Less than 2.0x | 60 (23.6%) | 86,719 (89,401.0%) |
| 2.0x to 2.9x | 36 (14.2%) | 67 (69.1%) |
| 3.0x to 3.9x | 130 (51.2%) | 18 (18.6%) |
| 4.0x or more | 28 (11.0%) | 12 (12.4%) |
| Total | 254 (100.0%) | 97 (100.0%) |
Real Estate Taxes by Mortgage Status in Fyffe
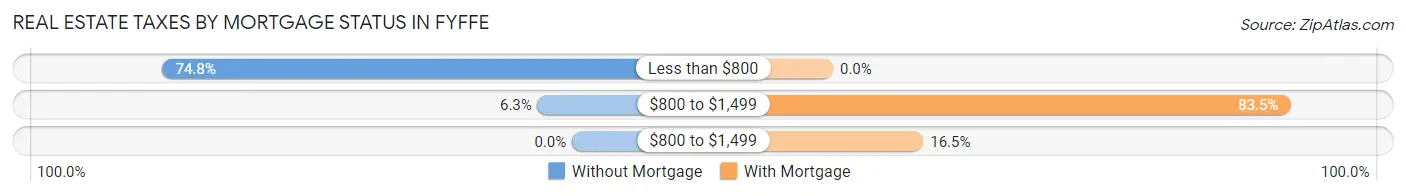
| Property Taxes | Without Mortgage | With Mortgage |
| Less than $800 | 190 (74.8%) | 0 (0.0%) |
| $800 to $1,499 | 16 (6.3%) | 81 (83.5%) |
| $800 to $1,499 | 0 (0.0%) | 16 (16.5%) |
| Total | 254 (100.0%) | 97 (100.0%) |
Health & Disability in Fyffe
Health Insurance Coverage by Age in Fyffe
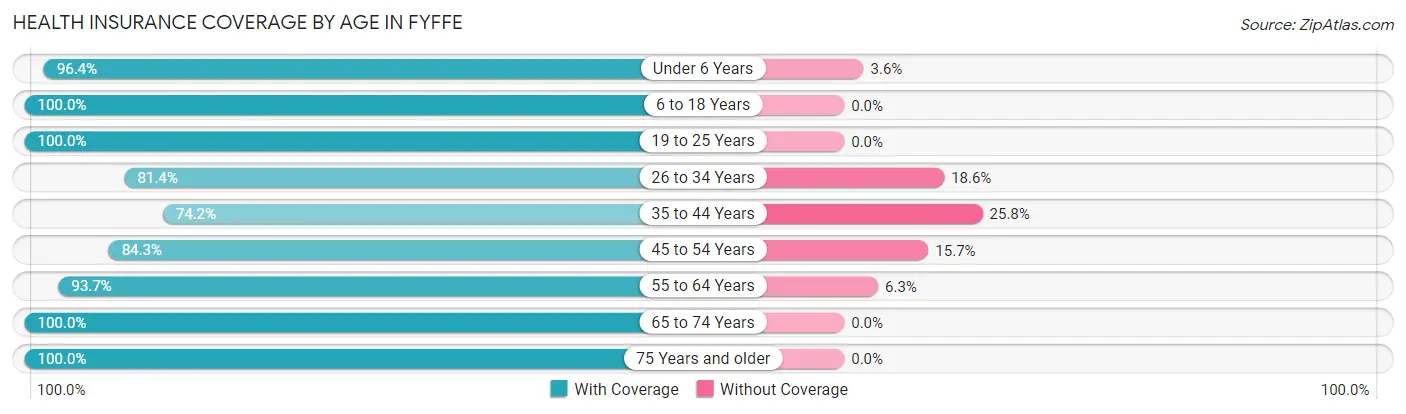
| Age Bracket | With Coverage | Without Coverage |
| Under 6 Years | 107 (96.4%) | 4 (3.6%) |
| 6 to 18 Years | 145 (100.0%) | 0 (0.0%) |
| 19 to 25 Years | 65 (100.0%) | 0 (0.0%) |
| 26 to 34 Years | 83 (81.4%) | 19 (18.6%) |
| 35 to 44 Years | 118 (74.2%) | 41 (25.8%) |
| 45 to 54 Years | 129 (84.3%) | 24 (15.7%) |
| 55 to 64 Years | 104 (93.7%) | 7 (6.3%) |
| 65 to 74 Years | 214 (100.0%) | 0 (0.0%) |
| 75 Years and older | 172 (100.0%) | 0 (0.0%) |
| Total | 1,137 (92.3%) | 95 (7.7%) |
Health Insurance Coverage by Citizenship Status in Fyffe
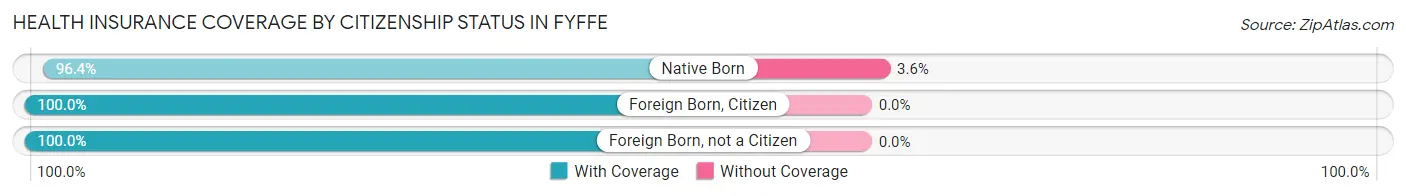
| Citizenship Status | With Coverage | Without Coverage |
| Native Born | 107 (96.4%) | 4 (3.6%) |
| Foreign Born, Citizen | 145 (100.0%) | 0 (0.0%) |
| Foreign Born, not a Citizen | 65 (100.0%) | 0 (0.0%) |
Health Insurance Coverage by Household Income in Fyffe
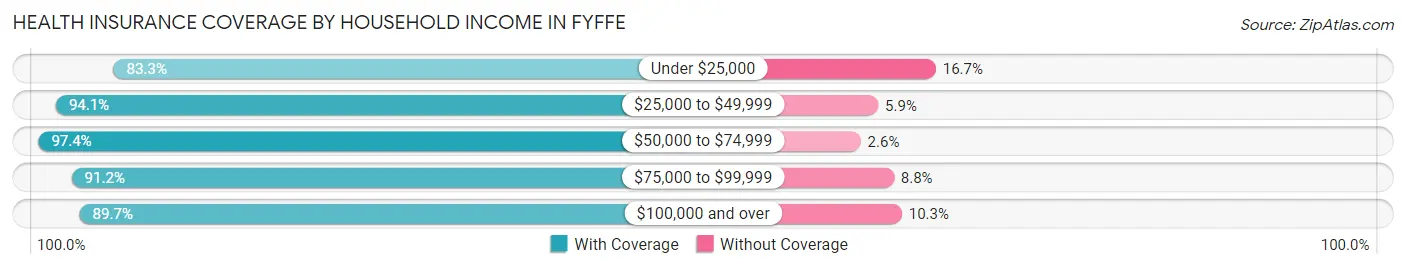
| Household Income | With Coverage | Without Coverage |
| Under $25,000 | 105 (83.3%) | 21 (16.7%) |
| $25,000 to $49,999 | 464 (94.1%) | 29 (5.9%) |
| $50,000 to $74,999 | 187 (97.4%) | 5 (2.6%) |
| $75,000 to $99,999 | 124 (91.2%) | 12 (8.8%) |
| $100,000 and over | 235 (89.7%) | 27 (10.3%) |
Public vs Private Health Insurance Coverage by Age in Fyffe
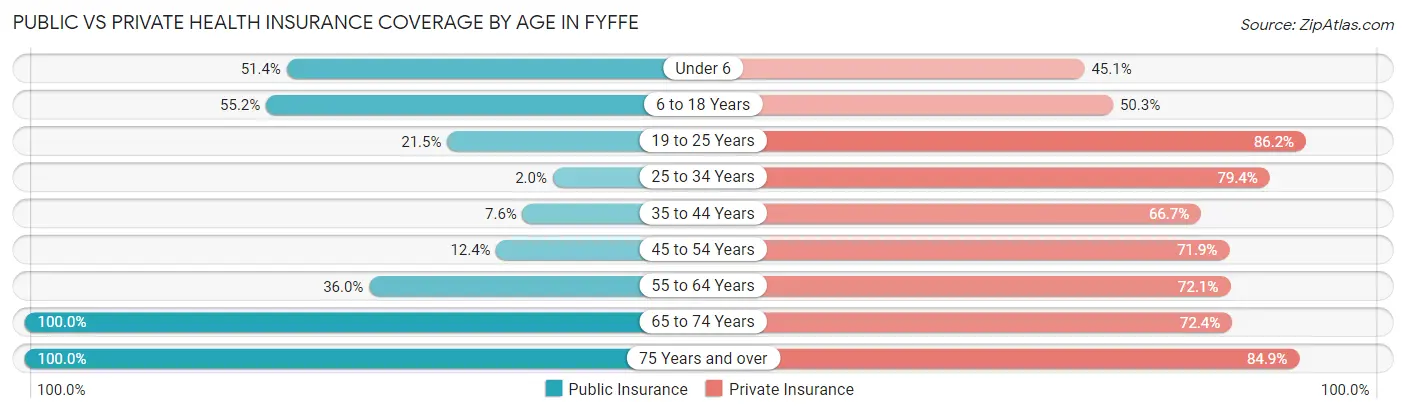
| Age Bracket | Public Insurance | Private Insurance |
| Under 6 | 57 (51.3%) | 50 (45.1%) |
| 6 to 18 Years | 80 (55.2%) | 73 (50.3%) |
| 19 to 25 Years | 14 (21.5%) | 56 (86.2%) |
| 25 to 34 Years | 2 (2.0%) | 81 (79.4%) |
| 35 to 44 Years | 12 (7.5%) | 106 (66.7%) |
| 45 to 54 Years | 19 (12.4%) | 110 (71.9%) |
| 55 to 64 Years | 40 (36.0%) | 80 (72.1%) |
| 65 to 74 Years | 214 (100.0%) | 155 (72.4%) |
| 75 Years and over | 172 (100.0%) | 146 (84.9%) |
| Total | 610 (49.5%) | 857 (69.6%) |
Disability Status by Sex by Age in Fyffe
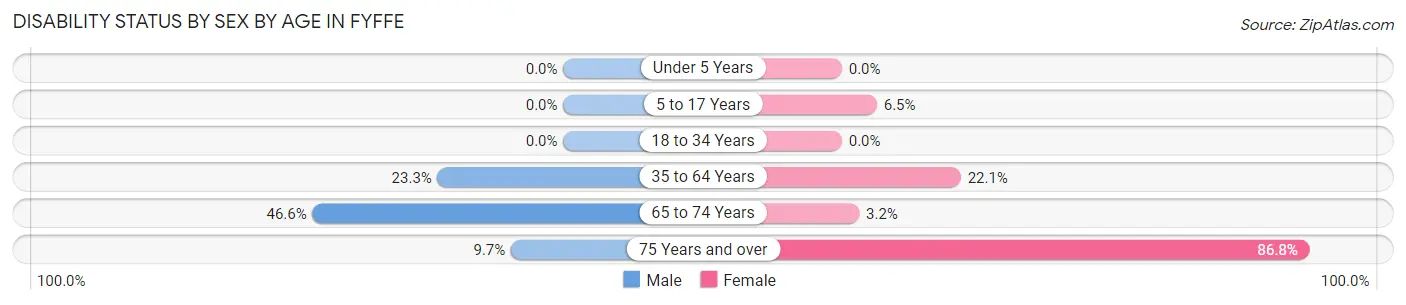
| Age Bracket | Male | Female |
| Under 5 Years | 0 (0.0%) | 0 (0.0%) |
| 5 to 17 Years | 0 (0.0%) | 5 (6.5%) |
| 18 to 34 Years | 0 (0.0%) | 0 (0.0%) |
| 35 to 64 Years | 49 (23.3%) | 47 (22.1%) |
| 65 to 74 Years | 27 (46.6%) | 5 (3.2%) |
| 75 Years and over | 13 (9.7%) | 33 (86.8%) |
Disability Class by Sex by Age in Fyffe
Disability Class: Hearing Difficulty
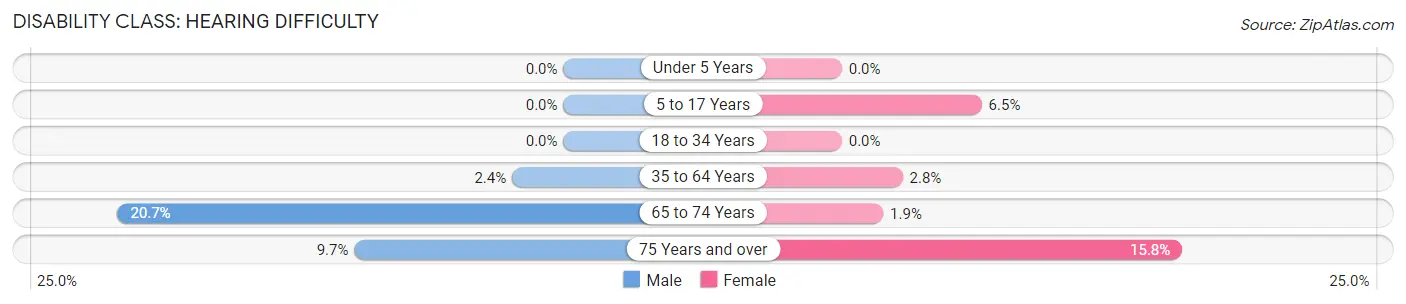
| Age Bracket | Male | Female |
| Under 5 Years | 0 (0.0%) | 0 (0.0%) |
| 5 to 17 Years | 0 (0.0%) | 5 (6.5%) |
| 18 to 34 Years | 0 (0.0%) | 0 (0.0%) |
| 35 to 64 Years | 5 (2.4%) | 6 (2.8%) |
| 65 to 74 Years | 12 (20.7%) | 3 (1.9%) |
| 75 Years and over | 13 (9.7%) | 6 (15.8%) |
Disability Class: Vision Difficulty
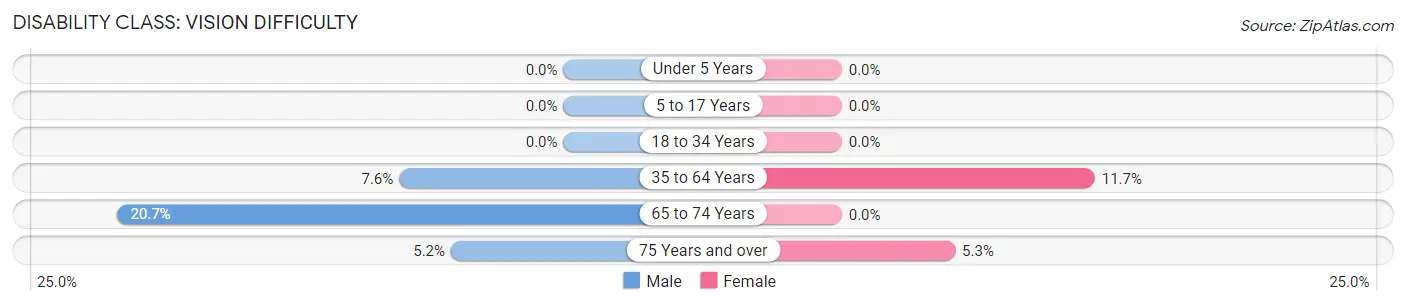
| Age Bracket | Male | Female |
| Under 5 Years | 0 (0.0%) | 0 (0.0%) |
| 5 to 17 Years | 0 (0.0%) | 0 (0.0%) |
| 18 to 34 Years | 0 (0.0%) | 0 (0.0%) |
| 35 to 64 Years | 16 (7.6%) | 25 (11.7%) |
| 65 to 74 Years | 12 (20.7%) | 0 (0.0%) |
| 75 Years and over | 7 (5.2%) | 2 (5.3%) |
Disability Class: Cognitive Difficulty
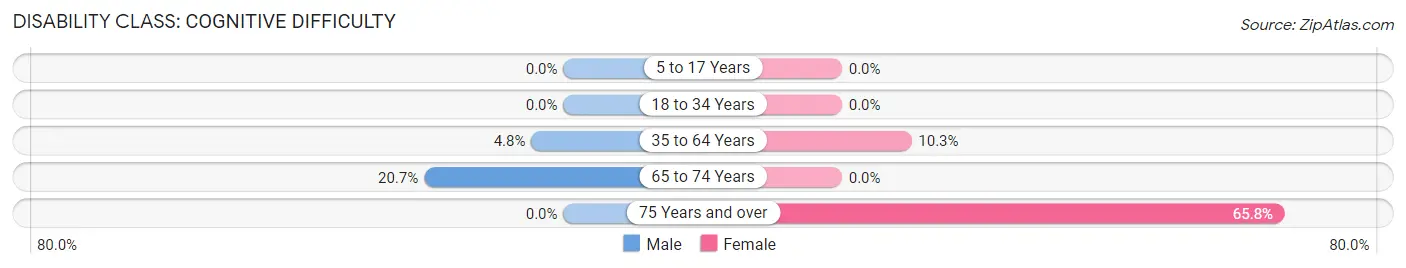
| Age Bracket | Male | Female |
| 5 to 17 Years | 0 (0.0%) | 0 (0.0%) |
| 18 to 34 Years | 0 (0.0%) | 0 (0.0%) |
| 35 to 64 Years | 10 (4.8%) | 22 (10.3%) |
| 65 to 74 Years | 12 (20.7%) | 0 (0.0%) |
| 75 Years and over | 0 (0.0%) | 25 (65.8%) |
Disability Class: Ambulatory Difficulty
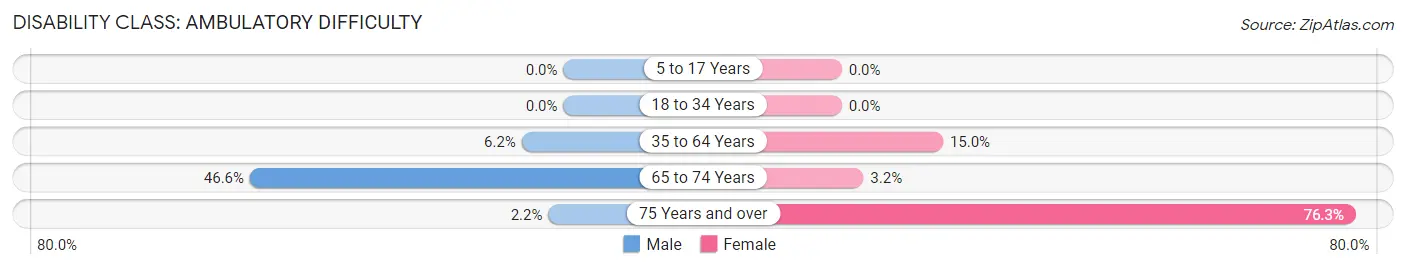
| Age Bracket | Male | Female |
| 5 to 17 Years | 0 (0.0%) | 0 (0.0%) |
| 18 to 34 Years | 0 (0.0%) | 0 (0.0%) |
| 35 to 64 Years | 13 (6.2%) | 32 (15.0%) |
| 65 to 74 Years | 27 (46.6%) | 5 (3.2%) |
| 75 Years and over | 3 (2.2%) | 29 (76.3%) |
Disability Class: Self-Care Difficulty
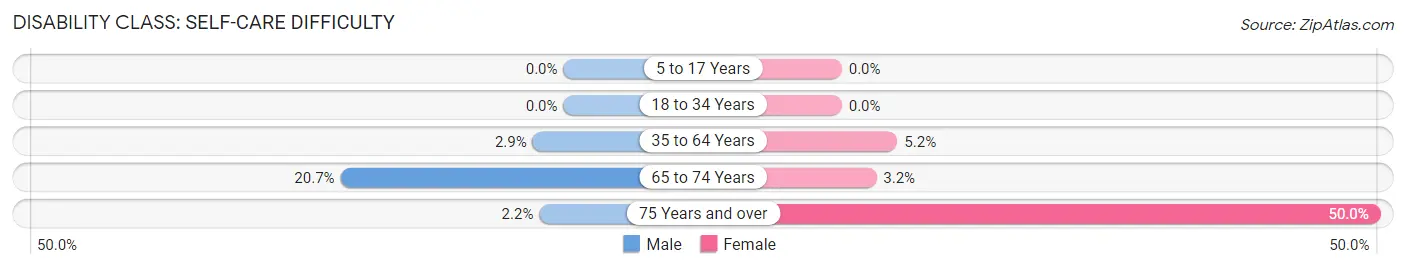
| Age Bracket | Male | Female |
| 5 to 17 Years | 0 (0.0%) | 0 (0.0%) |
| 18 to 34 Years | 0 (0.0%) | 0 (0.0%) |
| 35 to 64 Years | 6 (2.9%) | 11 (5.2%) |
| 65 to 74 Years | 12 (20.7%) | 5 (3.2%) |
| 75 Years and over | 3 (2.2%) | 19 (50.0%) |
Technology Access in Fyffe
Computing Device Access in Fyffe
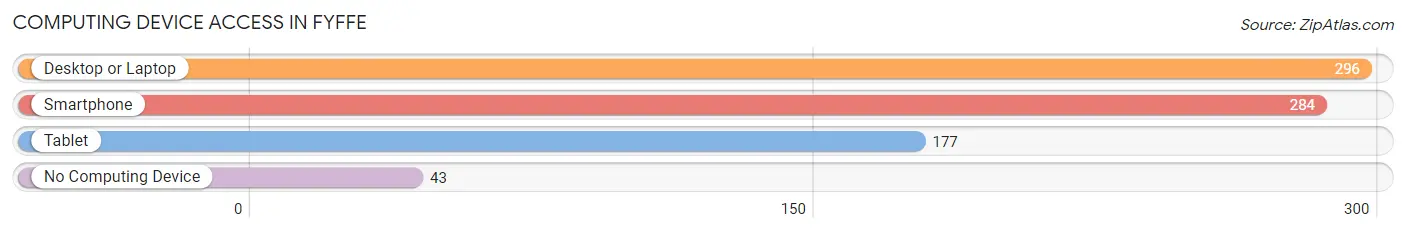
| Device Type | # Households | % Households |
| Desktop or Laptop | 296 | 64.5% |
| Smartphone | 284 | 61.9% |
| Tablet | 177 | 38.6% |
| No Computing Device | 43 | 9.4% |
| Total | 459 | 100.0% |
Internet Access in Fyffe
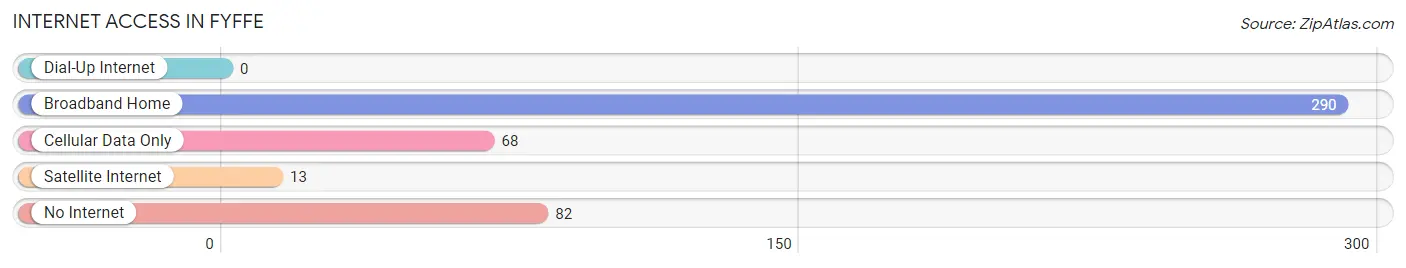
| Internet Type | # Households | % Households |
| Dial-Up Internet | 0 | 0.0% |
| Broadband Home | 290 | 63.2% |
| Cellular Data Only | 68 | 14.8% |
| Satellite Internet | 13 | 2.8% |
| No Internet | 82 | 17.9% |
| Total | 459 | 100.0% |
Fyffe Summary
Fyffe, Alabama is a small town located in DeKalb County in the northeastern part of the state. It is situated in the foothills of the Appalachian Mountains and is home to a population of approximately 1,000 people. The town was founded in 1887 and has a rich history of farming, logging, and coal mining.
Geography
Fyffe is located in the foothills of the Appalachian Mountains in northeastern Alabama. It is situated in DeKalb County, approximately 30 miles from the Tennessee border. The town is surrounded by the Little River, which flows through the area and provides a source of water for the town. The terrain is mostly hilly and forested, with some flat areas in the valleys. The climate is humid subtropical, with hot summers and mild winters.
Economy
Fyffe’s economy is largely based on agriculture and forestry. The town is home to several farms, which produce a variety of crops, including corn, soybeans, and cotton. The town also has a thriving timber industry, with several sawmills and lumber companies in the area. In addition, Fyffe is home to several coal mines, which provide jobs for many of the town’s residents.
Demographics
As of the 2010 census, Fyffe had a population of 1,000 people. The racial makeup of the town was 97.2% White, 0.7% African American, 0.3% Native American, 0.2% Asian, 0.1% Pacific Islander, and 1.6% from other races. The median household income was $30,000, and the median family income was $35,000. The per capita income was $14,000.
Education
Fyffe is served by the DeKalb County School System. The town has one elementary school, one middle school, and one high school. The town also has a public library and a community college.
Conclusion
Fyffe, Alabama is a small town located in DeKalb County in the northeastern part of the state. It is situated in the foothills of the Appalachian Mountains and is home to a population of approximately 1,000 people. The town was founded in 1887 and has a rich history of farming, logging, and coal mining. The economy is largely based on agriculture and forestry, and the town is served by the DeKalb County School System. Fyffe is a small, rural town with a unique history and culture.
Common Questions
What is Per Capita Income in Fyffe?
Per Capita income in Fyffe is $22,806.
What is the Median Family Income in Fyffe?
Median Family Income in Fyffe is $42,847.
What is the Median Household income in Fyffe?
Median Household Income in Fyffe is $36,964.
What is Income or Wage Gap in Fyffe?
Income or Wage Gap in Fyffe is 23.7%.
Women in Fyffe earn 76.3 cents for every dollar earned by a man.
What is Inequality or Gini Index in Fyffe?
Inequality or Gini Index in Fyffe is 0.42.
What is the Total Population of Fyffe?
Total Population of Fyffe is 1,232.
What is the Total Male Population of Fyffe?
Total Male Population of Fyffe is 621.
What is the Total Female Population of Fyffe?
Total Female Population of Fyffe is 611.
What is the Ratio of Males per 100 Females in Fyffe?
There are 101.64 Males per 100 Females in Fyffe.
What is the Ratio of Females per 100 Males in Fyffe?
There are 98.39 Females per 100 Males in Fyffe.
What is the Median Population Age in Fyffe?
Median Population Age in Fyffe is 46.7 Years.
What is the Average Family Size in Fyffe
Average Family Size in Fyffe is 3.0 People.
What is the Average Household Size in Fyffe
Average Household Size in Fyffe is 2.6 People.
How Large is the Labor Force in Fyffe?
There are 476 People in the Labor Forcein in Fyffe.
What is the Percentage of People in the Labor Force in Fyffe?
46.3% of People are in the Labor Force in Fyffe.
What is the Unemployment Rate in Fyffe?
Unemployment Rate in Fyffe is 5.7%.