Florence, AL Map & Demographics
Florence Map
Florence Overview
$28,399
PER CAPITA INCOME
$62,953
AVG FAMILY INCOME
$47,048
AVG HOUSEHOLD INCOME
32.0%
WAGE / INCOME GAP [ % ]
68.0¢/ $1
WAGE / INCOME GAP [ $ ]
$11,055
FAMILY INCOME DEFICIT
0.49
INEQUALITY / GINI INDEX
40,781
TOTAL POPULATION
18,585
MALE POPULATION
22,196
FEMALE POPULATION
83.73
MALES / 100 FEMALES
119.43
FEMALES / 100 MALES
34.9
MEDIAN AGE
3.0
AVG FAMILY SIZE
2.3
AVG HOUSEHOLD SIZE
18,883
LABOR FORCE [ PEOPLE ]
56.1%
PERCENT IN LABOR FORCE
5.7%
UNEMPLOYMENT RATE
Florence Area Codes
Income in Florence
Income Overview in Florence
Per Capita Income in Florence is $28,399, while median incomes of families and households are $62,953 and $47,048 respectively.
| Characteristic | Number | Measure |
| Per Capita Income | 40,781 | $28,399 |
| Median Family Income | 9,476 | $62,953 |
| Mean Family Income | 9,476 | $82,505 |
| Median Household Income | 17,020 | $47,048 |
| Mean Household Income | 17,020 | $64,801 |
| Income Deficit | 9,476 | $11,055 |
| Wage / Income Gap (%) | 40,781 | 32.01% |
| Wage / Income Gap ($) | 40,781 | 67.99¢ per $1 |
| Gini / Inequality Index | 40,781 | 0.49 |
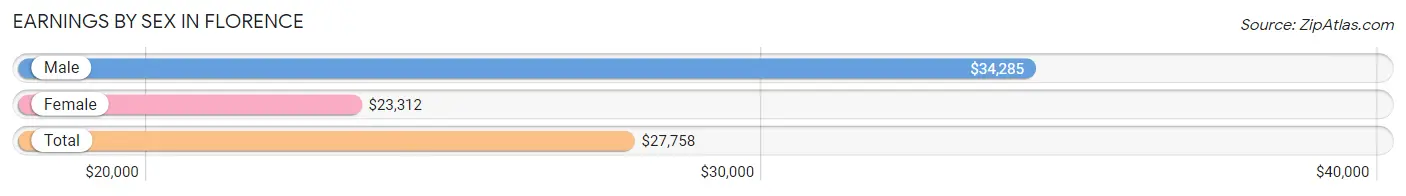
Earnings by Sex in Florence
Average Earnings in Florence are $27,758, $34,285 for men and $23,312 for women, a difference of 32.0%.
| Sex | Number | Average Earnings |
| Male | 9,949 (48.7%) | $34,285 |
| Female | 10,479 (51.3%) | $23,312 |
| Total | 20,428 (100.0%) | $27,758 |
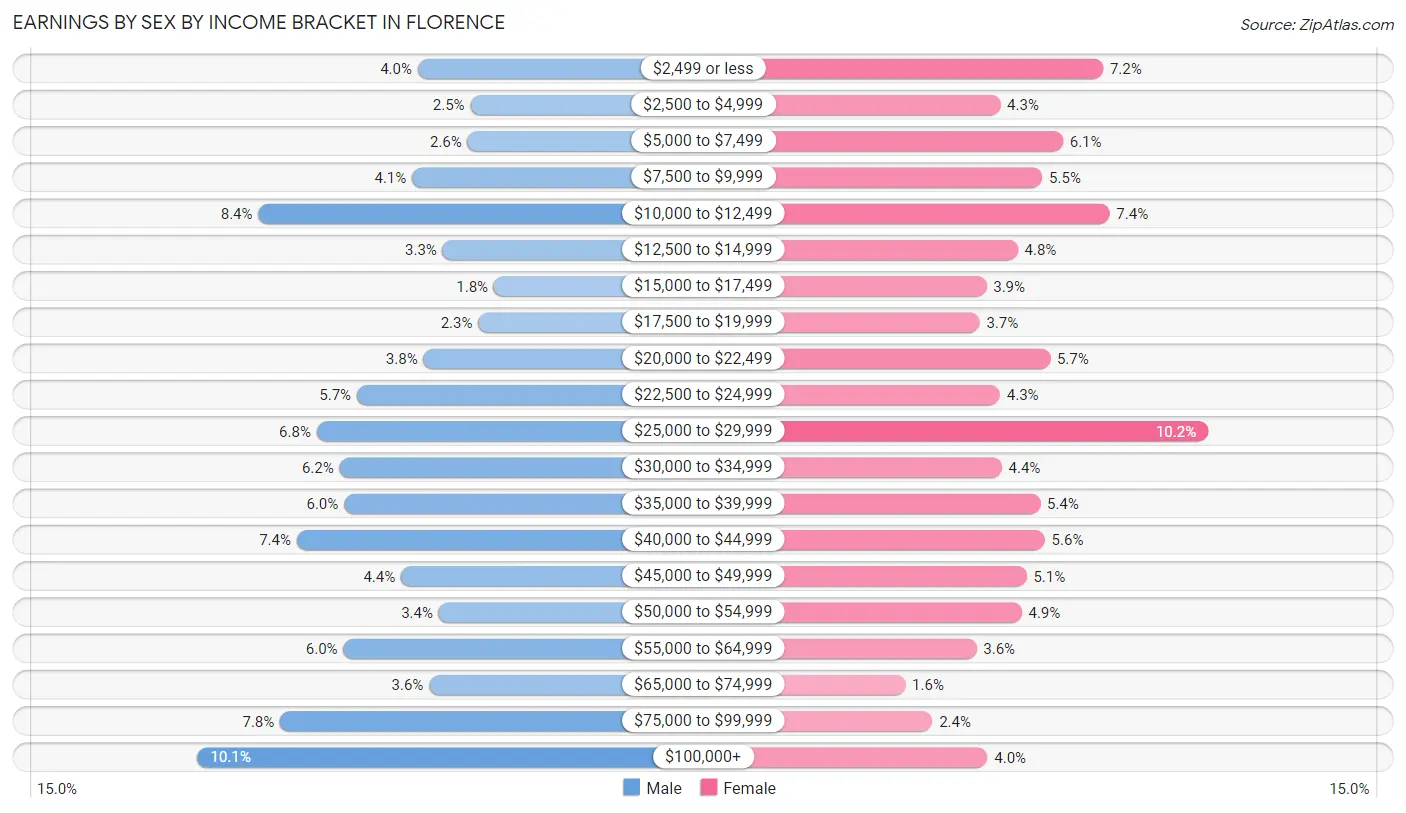
Earnings by Sex by Income Bracket in Florence
The most common earnings brackets in Florence are $100,000+ for men (1,009 | 10.1%) and $25,000 to $29,999 for women (1,064 | 10.2%).
| Income | Male | Female |
| $2,499 or less | 393 (4.0%) | 754 (7.2%) |
| $2,500 to $4,999 | 246 (2.5%) | 452 (4.3%) |
| $5,000 to $7,499 | 254 (2.5%) | 636 (6.1%) |
| $7,500 to $9,999 | 409 (4.1%) | 575 (5.5%) |
| $10,000 to $12,499 | 839 (8.4%) | 773 (7.4%) |
| $12,500 to $14,999 | 323 (3.3%) | 503 (4.8%) |
| $15,000 to $17,499 | 180 (1.8%) | 411 (3.9%) |
| $17,500 to $19,999 | 224 (2.2%) | 391 (3.7%) |
| $20,000 to $22,499 | 377 (3.8%) | 598 (5.7%) |
| $22,500 to $24,999 | 563 (5.7%) | 451 (4.3%) |
| $25,000 to $29,999 | 676 (6.8%) | 1,064 (10.2%) |
| $30,000 to $34,999 | 612 (6.1%) | 456 (4.3%) |
| $35,000 to $39,999 | 599 (6.0%) | 569 (5.4%) |
| $40,000 to $44,999 | 731 (7.3%) | 583 (5.6%) |
| $45,000 to $49,999 | 440 (4.4%) | 529 (5.1%) |
| $50,000 to $54,999 | 334 (3.4%) | 515 (4.9%) |
| $55,000 to $64,999 | 601 (6.0%) | 381 (3.6%) |
| $65,000 to $74,999 | 361 (3.6%) | 172 (1.6%) |
| $75,000 to $99,999 | 778 (7.8%) | 252 (2.4%) |
| $100,000+ | 1,009 (10.1%) | 414 (4.0%) |
| Total | 9,949 (100.0%) | 10,479 (100.0%) |
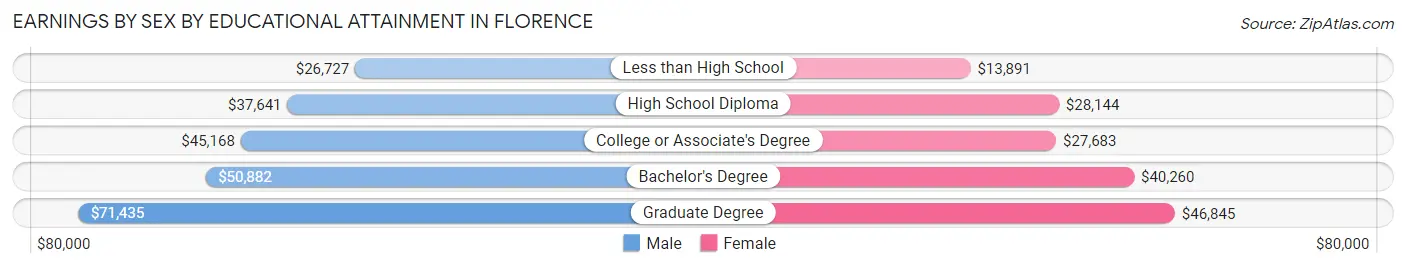
Earnings by Sex by Educational Attainment in Florence
Average earnings in Florence are $42,496 for men and $29,693 for women, a difference of 30.1%. Men with an educational attainment of graduate degree enjoy the highest average annual earnings of $71,435, while those with less than high school education earn the least with $26,727. Women with an educational attainment of graduate degree earn the most with the average annual earnings of $46,845, while those with less than high school education have the smallest earnings of $13,891.
| Educational Attainment | Male Income | Female Income |
| Less than High School | $26,727 | $13,891 |
| High School Diploma | $37,641 | $28,144 |
| College or Associate's Degree | $45,168 | $27,683 |
| Bachelor's Degree | $50,882 | $40,260 |
| Graduate Degree | $71,435 | $46,845 |
| Total | $42,496 | $29,693 |
Family Income in Florence
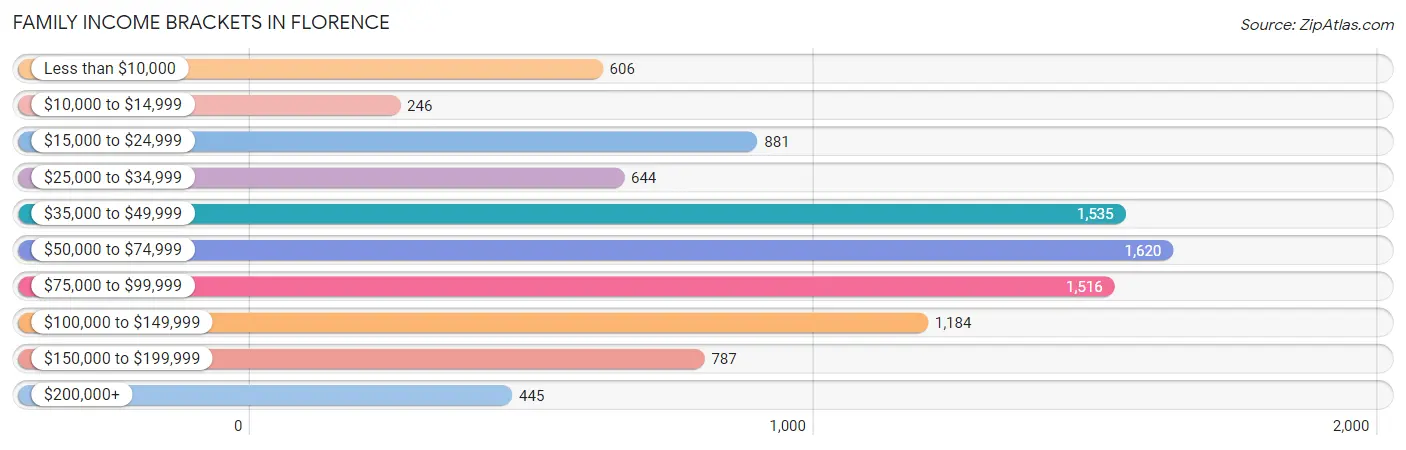
Family Income Brackets in Florence
According to the Florence family income data, there are 1,620 families falling into the $50,000 to $74,999 income range, which is the most common income bracket and makes up 17.1% of all families. Conversely, the $10,000 to $14,999 income bracket is the least frequent group with only 246 families (2.6%) belonging to this category.
| Income Bracket | # Families | % Families |
| Less than $10,000 | 606 | 6.4% |
| $10,000 to $14,999 | 246 | 2.6% |
| $15,000 to $24,999 | 881 | 9.3% |
| $25,000 to $34,999 | 644 | 6.8% |
| $35,000 to $49,999 | 1,535 | 16.2% |
| $50,000 to $74,999 | 1,620 | 17.1% |
| $75,000 to $99,999 | 1,516 | 16.0% |
| $100,000 to $149,999 | 1,184 | 12.5% |
| $150,000 to $199,999 | 787 | 8.3% |
| $200,000+ | 445 | 4.7% |
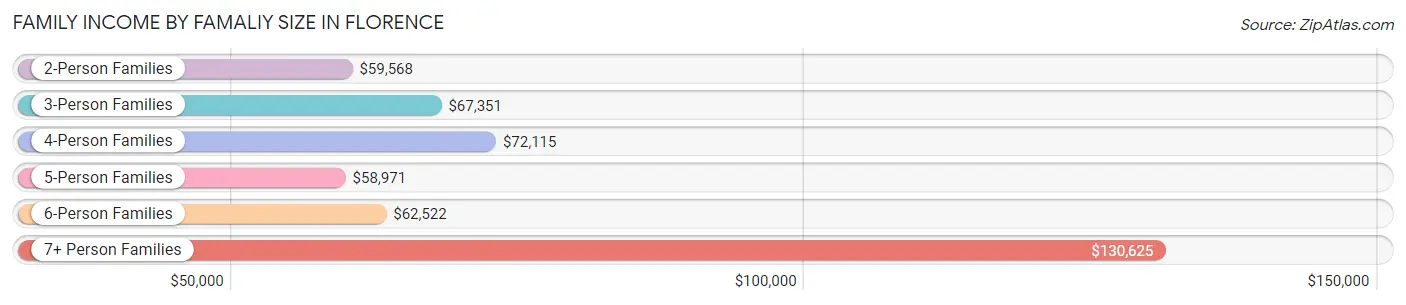
Family Income by Famaliy Size in Florence
7+ person families (75 | 0.8%) account for the highest median family income in Florence with $130,625 per family, while 2-person families (4,735 | 50.0%) have the highest median income of $29,784 per family member.
| Income Bracket | # Families | Median Income |
| 2-Person Families | 4,735 (50.0%) | $59,568 |
| 3-Person Families | 2,287 (24.1%) | $67,351 |
| 4-Person Families | 1,670 (17.6%) | $72,115 |
| 5-Person Families | 554 (5.9%) | $58,971 |
| 6-Person Families | 155 (1.6%) | $62,522 |
| 7+ Person Families | 75 (0.8%) | $130,625 |
| Total | 9,476 (100.0%) | $62,953 |
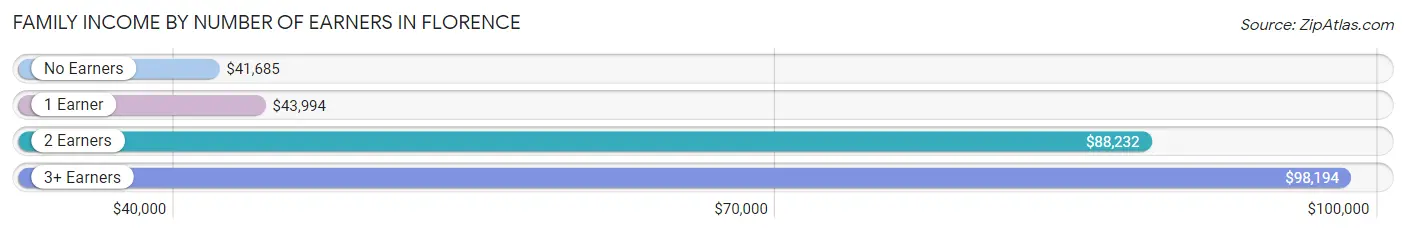
Family Income by Number of Earners in Florence
The median family income in Florence is $62,953, with families comprising 3+ earners (745) having the highest median family income of $98,194, while families with no earners (1,938) have the lowest median family income of $41,685, accounting for 7.9% and 20.4% of families, respectively.
| Number of Earners | # Families | Median Income |
| No Earners | 1,938 (20.4%) | $41,685 |
| 1 Earner | 3,603 (38.0%) | $43,994 |
| 2 Earners | 3,190 (33.7%) | $88,232 |
| 3+ Earners | 745 (7.9%) | $98,194 |
| Total | 9,476 (100.0%) | $62,953 |
Household Income in Florence
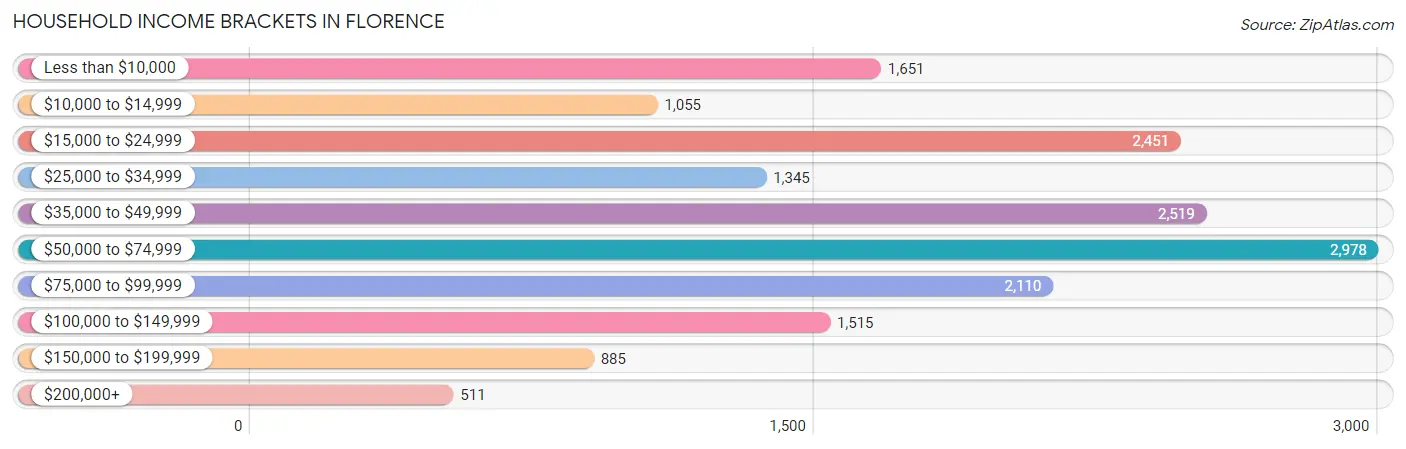
Household Income Brackets in Florence
With 2,978 households falling in the category, the $50,000 to $74,999 income range is the most frequent in Florence, accounting for 17.5% of all households. In contrast, only 511 households (3.0%) fall into the $200,000+ income bracket, making it the least populous group.
| Income Bracket | # Households | % Households |
| Less than $10,000 | 1,651 | 9.7% |
| $10,000 to $14,999 | 1,055 | 6.2% |
| $15,000 to $24,999 | 2,451 | 14.4% |
| $25,000 to $34,999 | 1,345 | 7.9% |
| $35,000 to $49,999 | 2,519 | 14.8% |
| $50,000 to $74,999 | 2,978 | 17.5% |
| $75,000 to $99,999 | 2,110 | 12.4% |
| $100,000 to $149,999 | 1,515 | 8.9% |
| $150,000 to $199,999 | 885 | 5.2% |
| $200,000+ | 511 | 3.0% |
Household Income by Householder Age in Florence
The median household income in Florence is $47,048, with the highest median household income of $59,508 found in the 45 to 64 years age bracket for the primary householder. A total of 4,967 households (29.2%) fall into this category. Meanwhile, the 15 to 24 years age bracket for the primary householder has the lowest median household income of $22,373, with 2,012 households (11.8%) in this group.
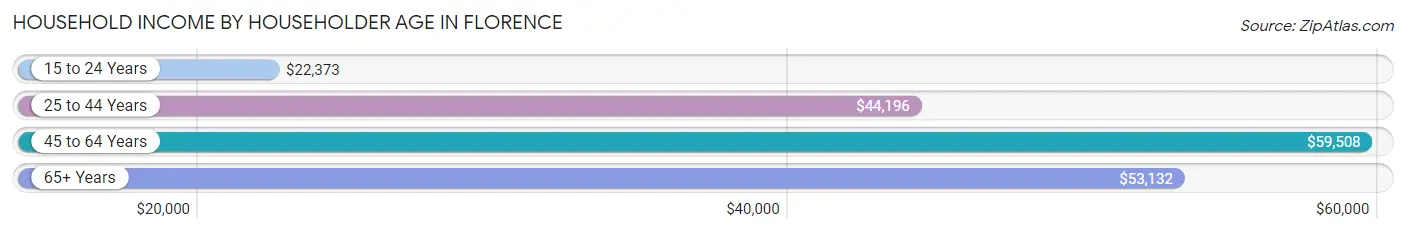
| Income Bracket | # Households | Median Income |
| 15 to 24 Years | 2,012 (11.8%) | $22,373 |
| 25 to 44 Years | 5,475 (32.2%) | $44,196 |
| 45 to 64 Years | 4,967 (29.2%) | $59,508 |
| 65+ Years | 4,566 (26.8%) | $53,132 |
| Total | 17,020 (100.0%) | $47,048 |
Poverty in Florence
Income Below Poverty by Sex and Age in Florence
With 16.5% poverty level for males and 22.8% for females among the residents of Florence, 5 year old males and 18 to 24 year old females are the most vulnerable to poverty, with 67 males (38.1%) and 1,523 females (49.7%) in their respective age groups living below the poverty level.
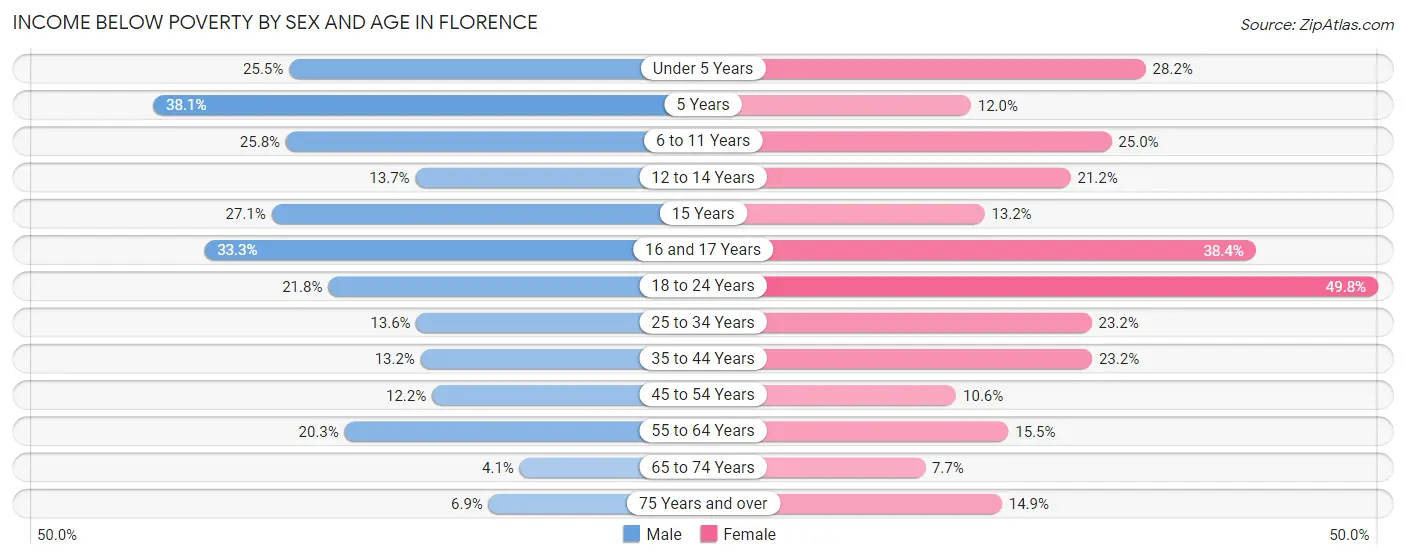
| Age Bracket | Male | Female |
| Under 5 Years | 268 (25.5%) | 302 (28.2%) |
| 5 Years | 67 (38.1%) | 45 (12.0%) |
| 6 to 11 Years | 362 (25.8%) | 269 (25.0%) |
| 12 to 14 Years | 102 (13.7%) | 149 (21.2%) |
| 15 Years | 78 (27.1%) | 27 (13.2%) |
| 16 and 17 Years | 124 (33.3%) | 111 (38.4%) |
| 18 to 24 Years | 552 (21.8%) | 1,523 (49.7%) |
| 25 to 34 Years | 352 (13.6%) | 669 (23.2%) |
| 35 to 44 Years | 283 (13.2%) | 592 (23.2%) |
| 45 to 54 Years | 198 (12.2%) | 210 (10.6%) |
| 55 to 64 Years | 396 (20.3%) | 392 (15.4%) |
| 65 to 74 Years | 78 (4.1%) | 165 (7.7%) |
| 75 Years and over | 69 (6.9%) | 280 (14.8%) |
| Total | 2,929 (16.5%) | 4,734 (22.8%) |
Income Above Poverty by Sex and Age in Florence
According to the poverty statistics in Florence, males aged 65 to 74 years and females aged 65 to 74 years are the age groups that are most secure financially, with 96.0% of males and 92.3% of females in these age groups living above the poverty line.
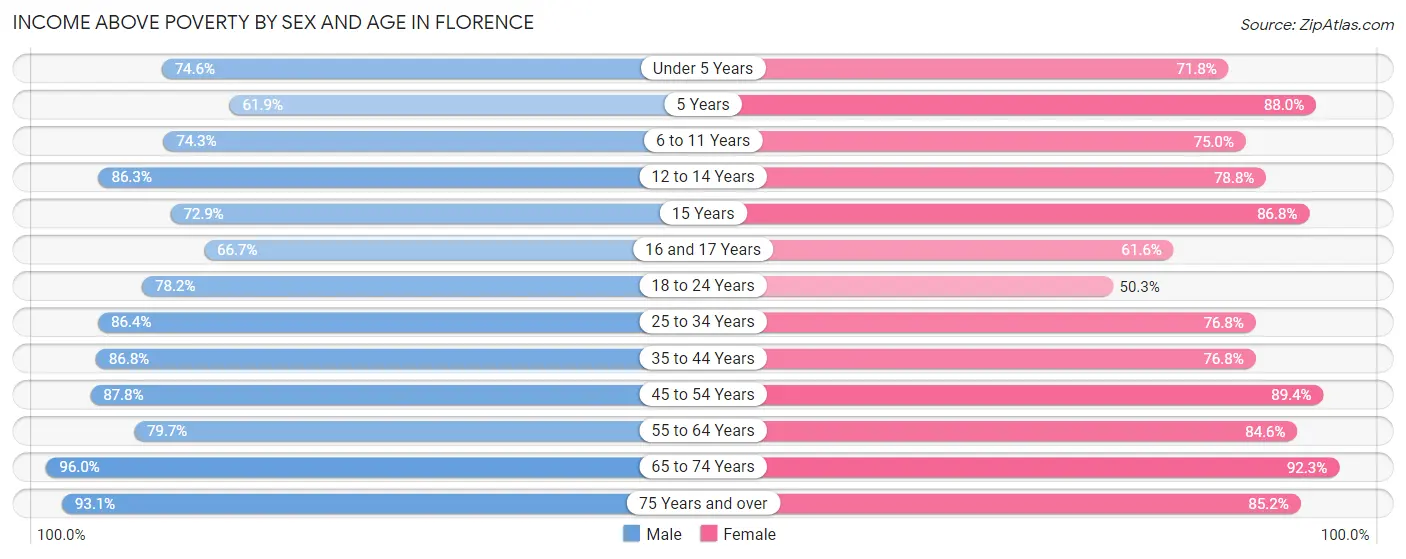
| Age Bracket | Male | Female |
| Under 5 Years | 785 (74.6%) | 769 (71.8%) |
| 5 Years | 109 (61.9%) | 331 (88.0%) |
| 6 to 11 Years | 1,044 (74.3%) | 806 (75.0%) |
| 12 to 14 Years | 641 (86.3%) | 553 (78.8%) |
| 15 Years | 210 (72.9%) | 177 (86.8%) |
| 16 and 17 Years | 248 (66.7%) | 178 (61.6%) |
| 18 to 24 Years | 1,978 (78.2%) | 1,538 (50.2%) |
| 25 to 34 Years | 2,228 (86.4%) | 2,217 (76.8%) |
| 35 to 44 Years | 1,854 (86.8%) | 1,957 (76.8%) |
| 45 to 54 Years | 1,426 (87.8%) | 1,770 (89.4%) |
| 55 to 64 Years | 1,555 (79.7%) | 2,146 (84.6%) |
| 65 to 74 Years | 1,849 (96.0%) | 1,971 (92.3%) |
| 75 Years and over | 926 (93.1%) | 1,606 (85.2%) |
| Total | 14,853 (83.5%) | 16,019 (77.2%) |
Income Below Poverty Among Married-Couple Families in Florence
The poverty statistics for married-couple families in Florence show that 6.5% or 397 of the total 6,154 families live below the poverty line. Families with 5 or more children have the highest poverty rate of 44.4%, comprising of 16 families. On the other hand, families with no children have the lowest poverty rate of 4.8%, which includes 181 families.
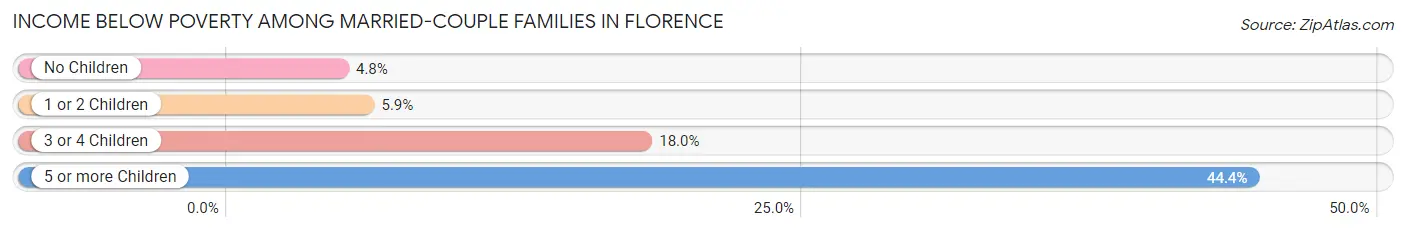
| Children | Above Poverty | Below Poverty |
| No Children | 3,564 (95.2%) | 181 (4.8%) |
| 1 or 2 Children | 1,773 (94.1%) | 112 (5.9%) |
| 3 or 4 Children | 400 (82.0%) | 88 (18.0%) |
| 5 or more Children | 20 (55.6%) | 16 (44.4%) |
| Total | 5,757 (93.5%) | 397 (6.5%) |
Income Below Poverty Among Single-Parent Households in Florence
According to the poverty data in Florence, 17.8% or 91 single-father households and 34.4% or 966 single-mother households are living below the poverty line. Among single-father households, those with 1 or 2 children have the highest poverty rate, with 77 households (23.7%) experiencing poverty. Likewise, among single-mother households, those with 3 or 4 children have the highest poverty rate, with 306 households (76.9%) falling below the poverty line.
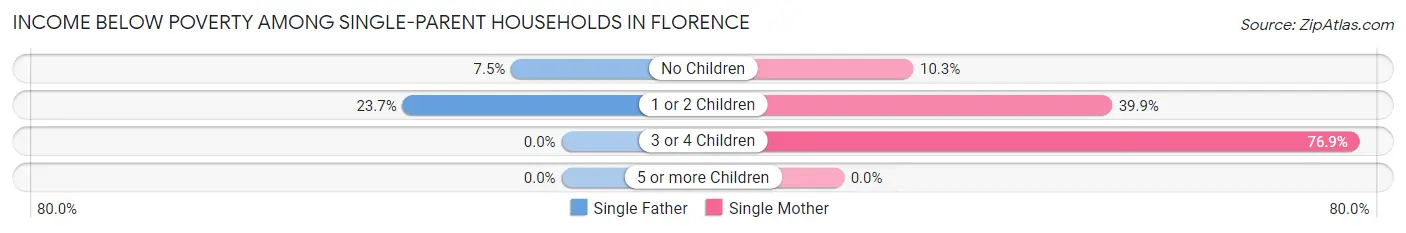
| Children | Single Father | Single Mother |
| No Children | 14 (7.5%) | 106 (10.3%) |
| 1 or 2 Children | 77 (23.7%) | 554 (39.9%) |
| 3 or 4 Children | 0 (0.0%) | 306 (76.9%) |
| 5 or more Children | 0 (0.0%) | 0 (0.0%) |
| Total | 91 (17.8%) | 966 (34.4%) |
Income Below Poverty Among Married-Couple vs Single-Parent Households in Florence
The poverty data for Florence shows that 397 of the married-couple family households (6.5%) and 1,057 of the single-parent households (31.8%) are living below the poverty level. Within the married-couple family households, those with 5 or more children have the highest poverty rate, with 16 households (44.4%) falling below the poverty line. Among the single-parent households, those with 3 or 4 children have the highest poverty rate, with 306 household (76.9%) living below poverty.
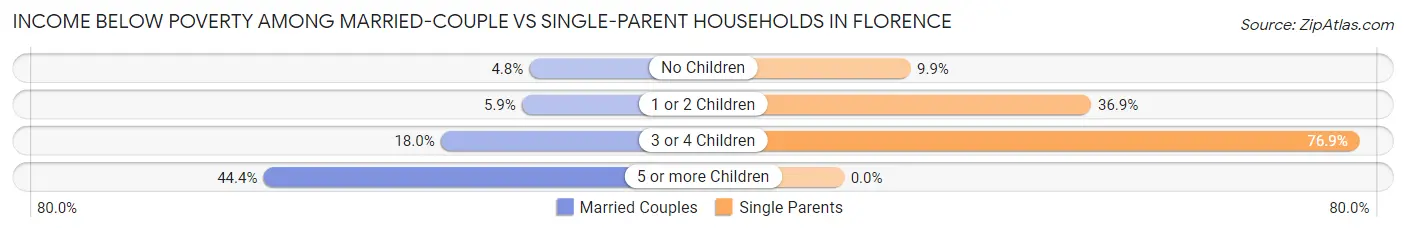
| Children | Married-Couple Families | Single-Parent Households |
| No Children | 181 (4.8%) | 120 (9.9%) |
| 1 or 2 Children | 112 (5.9%) | 631 (36.9%) |
| 3 or 4 Children | 88 (18.0%) | 306 (76.9%) |
| 5 or more Children | 16 (44.4%) | 0 (0.0%) |
| Total | 397 (6.5%) | 1,057 (31.8%) |
Race in Florence
The most populous races in Florence are White / Caucasian (29,606 | 72.6%), Black / African American (7,609 | 18.7%), and Two or more Races (2,273 | 5.6%).
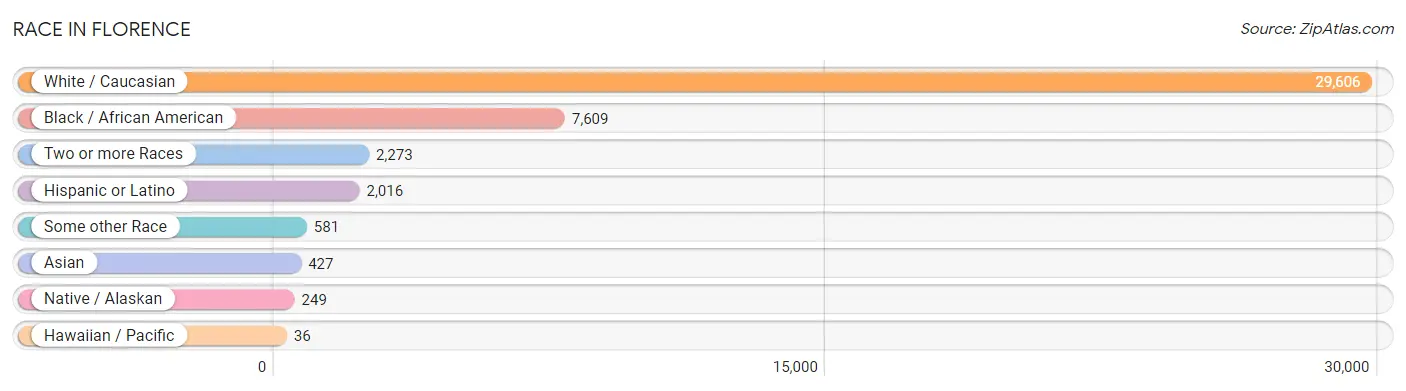
| Race | # Population | % Population |
| Asian | 427 | 1.1% |
| Black / African American | 7,609 | 18.7% |
| Hawaiian / Pacific | 36 | 0.1% |
| Hispanic or Latino | 2,016 | 4.9% |
| Native / Alaskan | 249 | 0.6% |
| White / Caucasian | 29,606 | 72.6% |
| Two or more Races | 2,273 | 5.6% |
| Some other Race | 581 | 1.4% |
| Total | 40,781 | 100.0% |
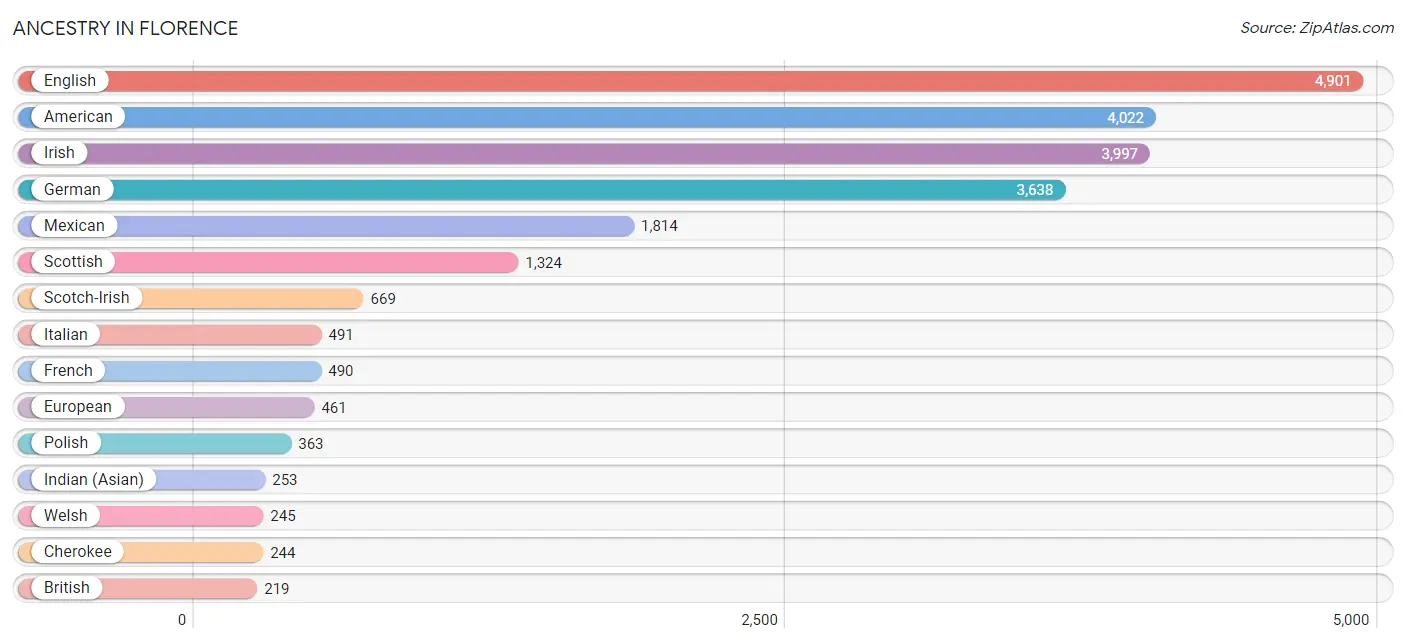
Ancestry in Florence
The most populous ancestries reported in Florence are English (4,901 | 12.0%), American (4,022 | 9.9%), Irish (3,997 | 9.8%), German (3,638 | 8.9%), and Mexican (1,814 | 4.4%), together accounting for 45.0% of all Florence residents.
| Ancestry | # Population | % Population |
| African | 125 | 0.3% |
| American | 4,022 | 9.9% |
| Arab | 91 | 0.2% |
| Austrian | 15 | 0.0% |
| Belgian | 8 | 0.0% |
| Bhutanese | 148 | 0.4% |
| British | 219 | 0.5% |
| Burmese | 32 | 0.1% |
| Canadian | 92 | 0.2% |
| Celtic | 6 | 0.0% |
| Central American | 121 | 0.3% |
| Central American Indian | 44 | 0.1% |
| Cherokee | 244 | 0.6% |
| Choctaw | 14 | 0.0% |
| Colombian | 18 | 0.0% |
| Croatian | 8 | 0.0% |
| Czech | 75 | 0.2% |
| Czechoslovakian | 53 | 0.1% |
| Danish | 66 | 0.2% |
| Dutch | 176 | 0.4% |
| Eastern European | 74 | 0.2% |
| English | 4,901 | 12.0% |
| European | 461 | 1.1% |
| Finnish | 151 | 0.4% |
| French | 490 | 1.2% |
| French Canadian | 26 | 0.1% |
| German | 3,638 | 8.9% |
| Greek | 118 | 0.3% |
| Guatemalan | 121 | 0.3% |
| Haitian | 25 | 0.1% |
| Hungarian | 37 | 0.1% |
| Indian (Asian) | 253 | 0.6% |
| Irish | 3,997 | 9.8% |
| Italian | 491 | 1.2% |
| Jamaican | 27 | 0.1% |
| Japanese | 13 | 0.0% |
| Korean | 112 | 0.3% |
| Lebanese | 20 | 0.1% |
| Lumbee | 14 | 0.0% |
| Mexican | 1,814 | 4.4% |
| Mexican American Indian | 53 | 0.1% |
| Moroccan | 11 | 0.0% |
| Native Hawaiian | 52 | 0.1% |
| Nigerian | 19 | 0.1% |
| Northern European | 79 | 0.2% |
| Norwegian | 104 | 0.3% |
| Polish | 363 | 0.9% |
| Portuguese | 40 | 0.1% |
| Pueblo | 53 | 0.1% |
| Puerto Rican | 57 | 0.1% |
| Russian | 66 | 0.2% |
| Scandinavian | 67 | 0.2% |
| Scotch-Irish | 669 | 1.6% |
| Scottish | 1,324 | 3.3% |
| Seminole | 7 | 0.0% |
| Sioux | 17 | 0.0% |
| South American | 18 | 0.0% |
| Sri Lankan | 77 | 0.2% |
| Subsaharan African | 196 | 0.5% |
| Swedish | 47 | 0.1% |
| Swiss | 117 | 0.3% |
| Thai | 48 | 0.1% |
| Turkish | 9 | 0.0% |
| Ukrainian | 6 | 0.0% |
| Welsh | 245 | 0.6% |
| Yugoslavian | 28 | 0.1% | View All 66 Rows |
Immigrants in Florence
The most numerous immigrant groups reported in Florence came from Latin America (773 | 1.9%), Central America (730 | 1.8%), Asia (552 | 1.3%), Mexico (289 | 0.7%), and Guatemala (256 | 0.6%), together accounting for 6.4% of all Florence residents.
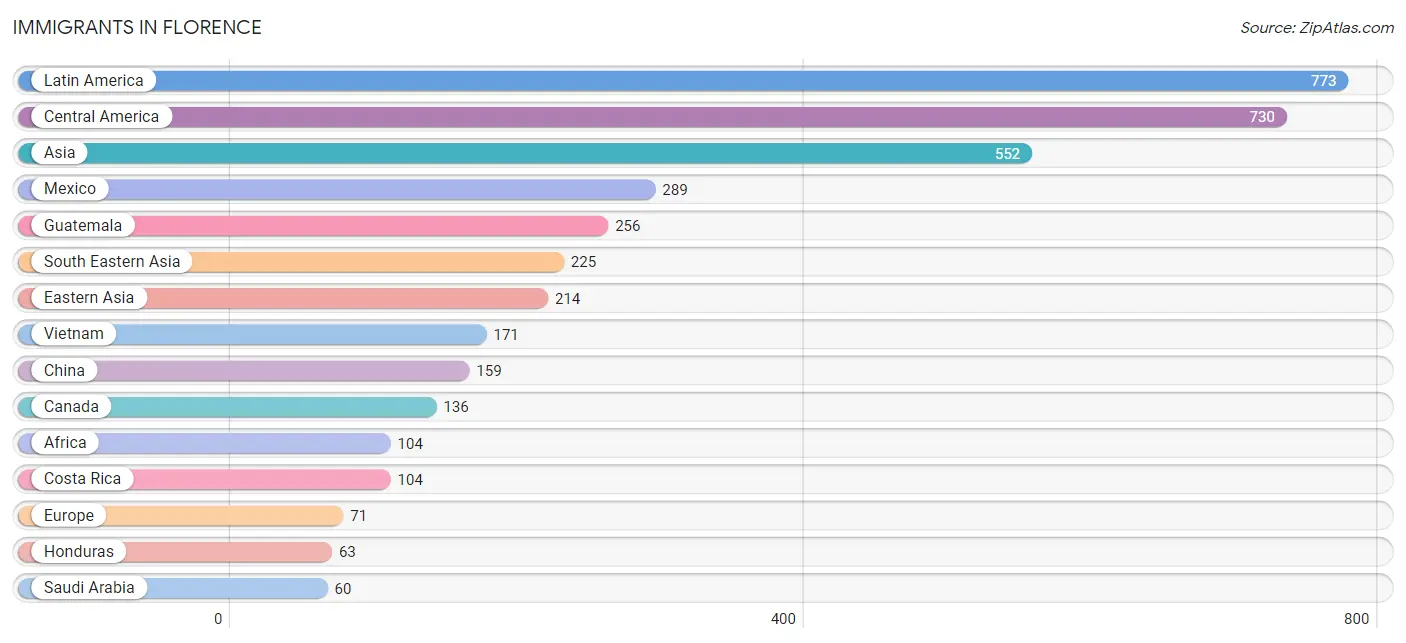
| Immigration Origin | # Population | % Population |
| Africa | 104 | 0.3% |
| Asia | 552 | 1.3% |
| Belgium | 8 | 0.0% |
| Canada | 136 | 0.3% |
| Caribbean | 25 | 0.1% |
| Central America | 730 | 1.8% |
| China | 159 | 0.4% |
| Colombia | 18 | 0.0% |
| Congo | 52 | 0.1% |
| Costa Rica | 104 | 0.3% |
| Eastern Asia | 214 | 0.5% |
| Eastern Europe | 19 | 0.1% |
| El Salvador | 18 | 0.0% |
| England | 9 | 0.0% |
| Europe | 71 | 0.2% |
| Germany | 23 | 0.1% |
| Guatemala | 256 | 0.6% |
| Haiti | 11 | 0.0% |
| Honduras | 63 | 0.2% |
| India | 53 | 0.1% |
| Jamaica | 10 | 0.0% |
| Japan | 27 | 0.1% |
| Korea | 28 | 0.1% |
| Latin America | 773 | 1.9% |
| Mexico | 289 | 0.7% |
| Middle Africa | 52 | 0.1% |
| Nigeria | 16 | 0.0% |
| Northern Europe | 21 | 0.1% |
| Philippines | 54 | 0.1% |
| Russia | 19 | 0.1% |
| Saudi Arabia | 60 | 0.2% |
| South America | 18 | 0.0% |
| South Central Asia | 53 | 0.1% |
| South Eastern Asia | 225 | 0.5% |
| Trinidad and Tobago | 4 | 0.0% |
| Vietnam | 171 | 0.4% |
| Western Africa | 16 | 0.0% |
| Western Asia | 60 | 0.2% |
| Western Europe | 31 | 0.1% | View All 39 Rows |
Sex and Age in Florence
Sex and Age in Florence
The most populous age groups in Florence are 20 to 24 Years (2,330 | 12.5%) for men and 20 to 24 Years (2,889 | 13.0%) for women.
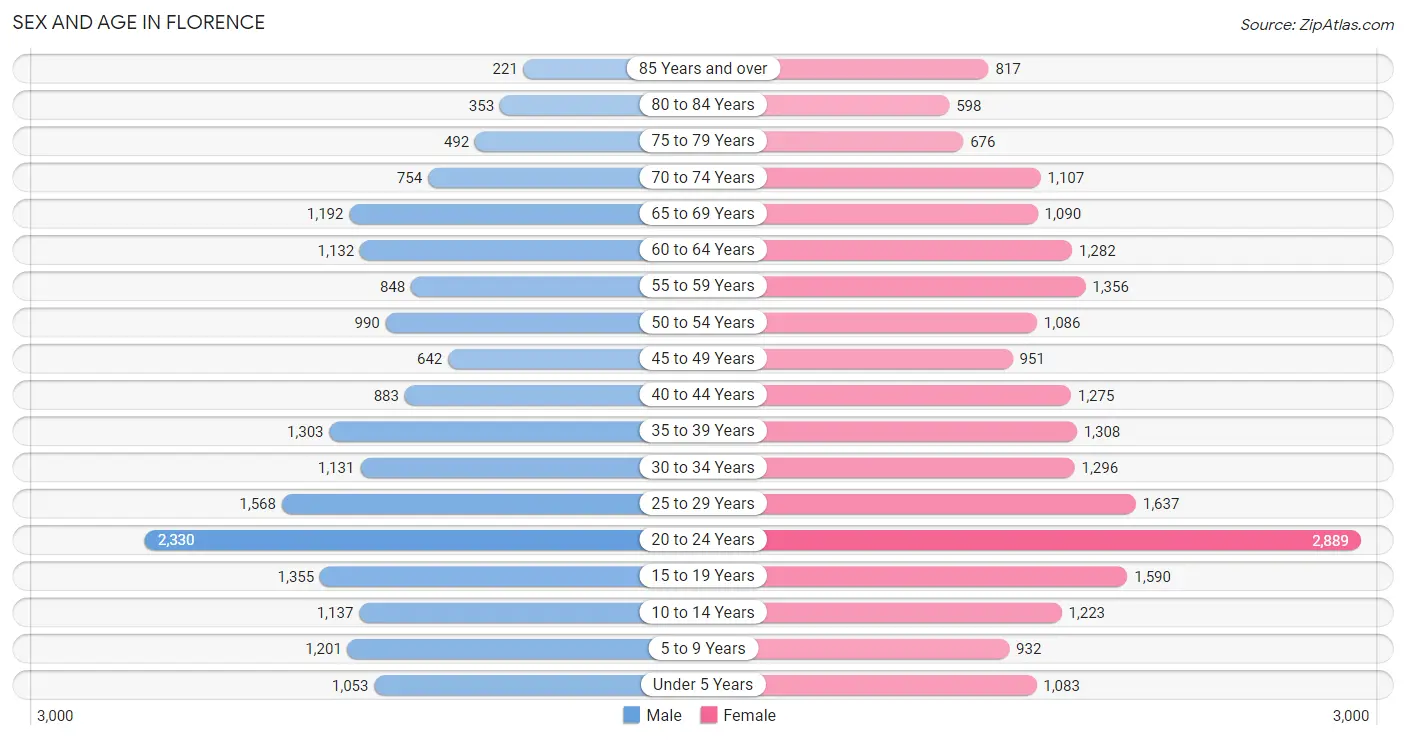
| Age Bracket | Male | Female |
| Under 5 Years | 1,053 (5.7%) | 1,083 (4.9%) |
| 5 to 9 Years | 1,201 (6.5%) | 932 (4.2%) |
| 10 to 14 Years | 1,137 (6.1%) | 1,223 (5.5%) |
| 15 to 19 Years | 1,355 (7.3%) | 1,590 (7.2%) |
| 20 to 24 Years | 2,330 (12.5%) | 2,889 (13.0%) |
| 25 to 29 Years | 1,568 (8.4%) | 1,637 (7.4%) |
| 30 to 34 Years | 1,131 (6.1%) | 1,296 (5.8%) |
| 35 to 39 Years | 1,303 (7.0%) | 1,308 (5.9%) |
| 40 to 44 Years | 883 (4.8%) | 1,275 (5.7%) |
| 45 to 49 Years | 642 (3.5%) | 951 (4.3%) |
| 50 to 54 Years | 990 (5.3%) | 1,086 (4.9%) |
| 55 to 59 Years | 848 (4.6%) | 1,356 (6.1%) |
| 60 to 64 Years | 1,132 (6.1%) | 1,282 (5.8%) |
| 65 to 69 Years | 1,192 (6.4%) | 1,090 (4.9%) |
| 70 to 74 Years | 754 (4.1%) | 1,107 (5.0%) |
| 75 to 79 Years | 492 (2.6%) | 676 (3.0%) |
| 80 to 84 Years | 353 (1.9%) | 598 (2.7%) |
| 85 Years and over | 221 (1.2%) | 817 (3.7%) |
| Total | 18,585 (100.0%) | 22,196 (100.0%) |
Families and Households in Florence
Median Family Size in Florence
The median family size in Florence is 2.99 persons per family, with married-couple families (6,154 | 64.9%) accounting for the largest median family size of 3.03 persons per family. On the other hand, single male/father families (512 | 5.4%) represent the smallest median family size with 2.84 persons per family.
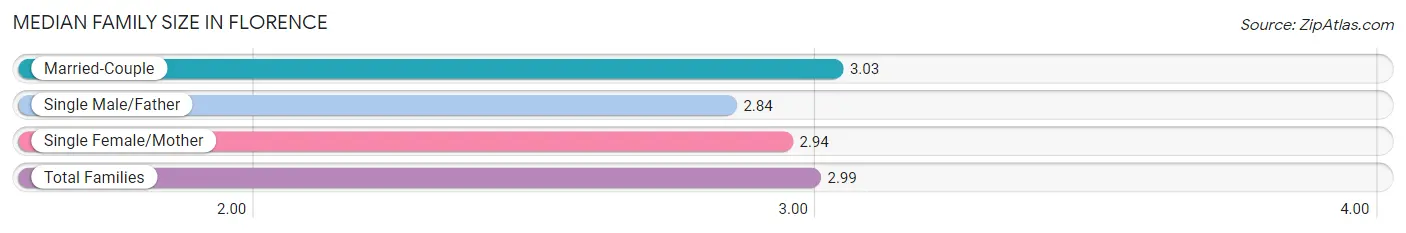
| Family Type | # Families | Family Size |
| Married-Couple | 6,154 (64.9%) | 3.03 |
| Single Male/Father | 512 (5.4%) | 2.84 |
| Single Female/Mother | 2,810 (29.6%) | 2.94 |
| Total Families | 9,476 (100.0%) | 2.99 |
Median Household Size in Florence
The median household size in Florence is 2.26 persons per household, with single male/father households (512 | 3.0%) accounting for the largest median household size of 3.26 persons per household. non-family households (7,544 | 44.3%) represent the smallest median household size with 1.26 persons per household.
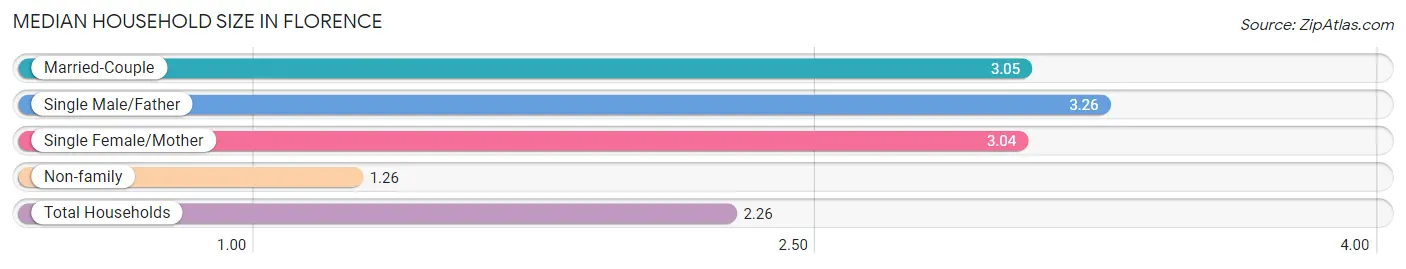
| Household Type | # Households | Household Size |
| Married-Couple | 6,154 (36.2%) | 3.05 |
| Single Male/Father | 512 (3.0%) | 3.26 |
| Single Female/Mother | 2,810 (16.5%) | 3.04 |
| Non-family | 7,544 (44.3%) | 1.26 |
| Total Households | 17,020 (100.0%) | 2.26 |
Household Size by Marriage Status in Florence
Out of a total of 17,020 households in Florence, 9,476 (55.7%) are family households, while 7,544 (44.3%) are nonfamily households. The most numerous type of family households are 2-person households, comprising 4,411, and the most common type of nonfamily households are 1-person households, comprising 6,084.
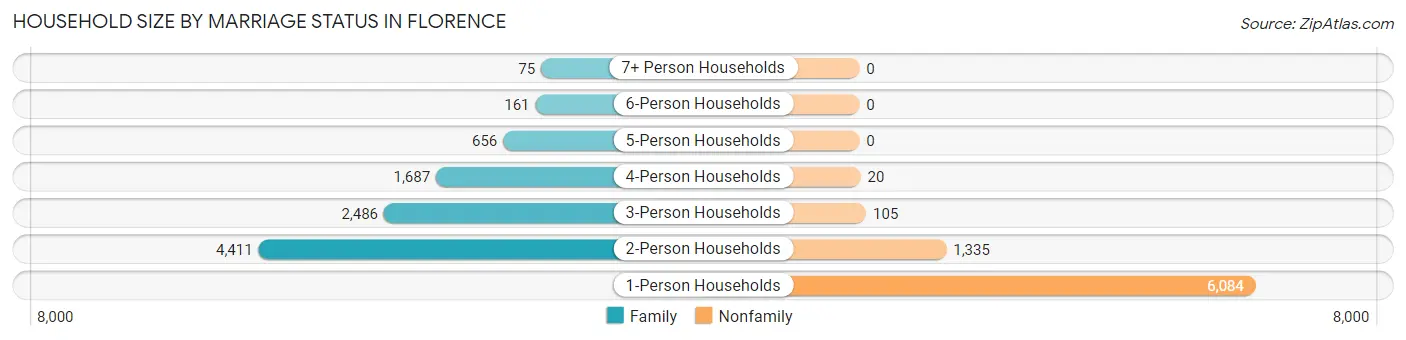
| Household Size | Family Households | Nonfamily Households |
| 1-Person Households | - | 6,084 (35.7%) |
| 2-Person Households | 4,411 (25.9%) | 1,335 (7.8%) |
| 3-Person Households | 2,486 (14.6%) | 105 (0.6%) |
| 4-Person Households | 1,687 (9.9%) | 20 (0.1%) |
| 5-Person Households | 656 (3.8%) | 0 (0.0%) |
| 6-Person Households | 161 (0.9%) | 0 (0.0%) |
| 7+ Person Households | 75 (0.4%) | 0 (0.0%) |
| Total | 9,476 (55.7%) | 7,544 (44.3%) |
Female Fertility in Florence
Fertility by Age in Florence
Average fertility rate in Florence is 46.0 births per 1,000 women. Women in the age bracket of 20 to 34 years have the highest fertility rate with 77.0 births per 1,000 women. Women in the age bracket of 20 to 34 years acount for 86.5% of all women with births.
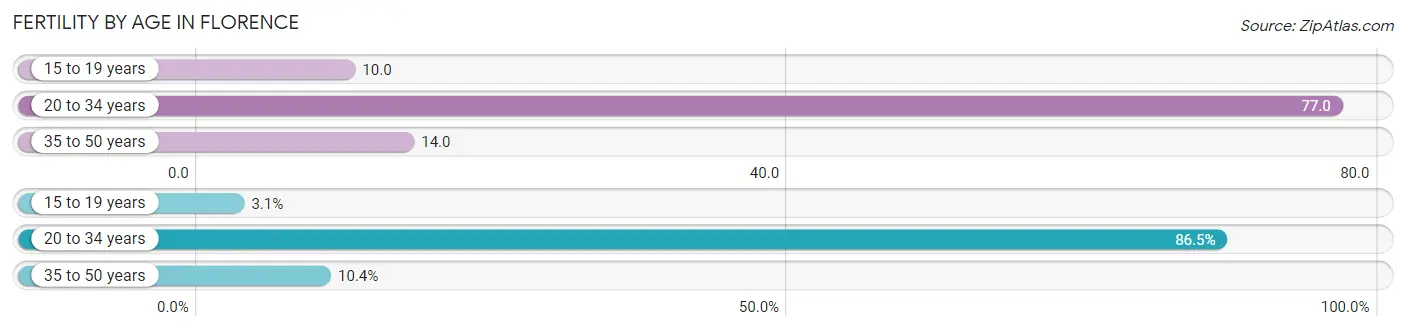
| Age Bracket | Women with Births | Births / 1,000 Women |
| 15 to 19 years | 16 (3.1%) | 10.0 |
| 20 to 34 years | 447 (86.5%) | 77.0 |
| 35 to 50 years | 54 (10.4%) | 14.0 |
| Total | 517 (100.0%) | 46.0 |
Fertility by Age by Marriage Status in Florence
45.3% of women with births (517) in Florence are married. The highest percentage of unmarried women with births falls into 35 to 50 years age bracket with 81.5% of them unmarried at the time of birth, while the lowest percentage of unmarried women with births belong to 15 to 19 years age bracket with 0.0% of them unmarried.
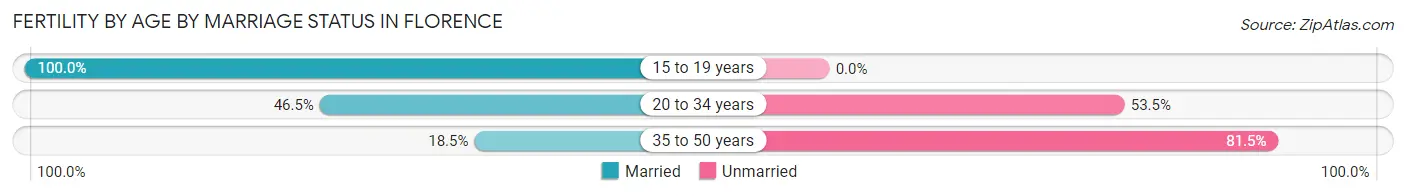
| Age Bracket | Married | Unmarried |
| 15 to 19 years | 16 (100.0%) | 0 (0.0%) |
| 20 to 34 years | 208 (46.5%) | 239 (53.5%) |
| 35 to 50 years | 10 (18.5%) | 44 (81.5%) |
| Total | 234 (45.3%) | 283 (54.7%) |
Fertility by Education in Florence
Average fertility rate in Florence is 46.0 births per 1,000 women. Women with the education attainment of high school diploma have the highest fertility rate of 92.0 births per 1,000 women, while women with the education attainment of graduate degree have the lowest fertility at 18.0 births per 1,000 women. Women with the education attainment of high school diploma represent 46.8% of all women with births.
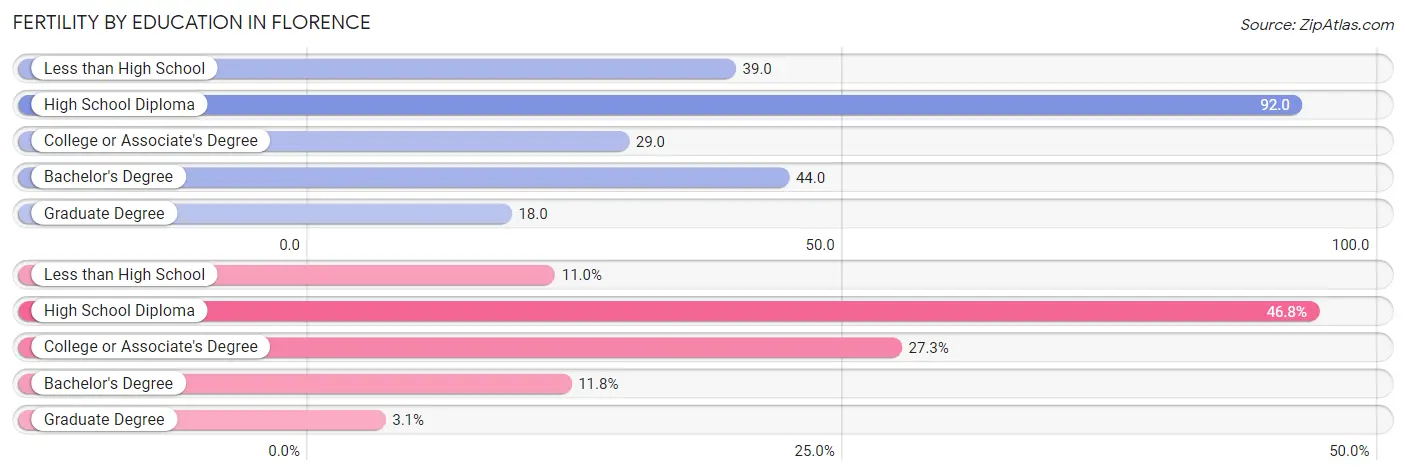
| Educational Attainment | Women with Births | Births / 1,000 Women |
| Less than High School | 57 (11.0%) | 39.0 |
| High School Diploma | 242 (46.8%) | 92.0 |
| College or Associate's Degree | 141 (27.3%) | 29.0 |
| Bachelor's Degree | 61 (11.8%) | 44.0 |
| Graduate Degree | 16 (3.1%) | 18.0 |
| Total | 517 (100.0%) | 46.0 |
Fertility by Education by Marriage Status in Florence
54.7% of women with births in Florence are unmarried. Women with the educational attainment of graduate degree are most likely to be married with 100.0% of them married at childbirth, while women with the educational attainment of high school diploma are least likely to be married with 74.4% of them unmarried at childbirth.
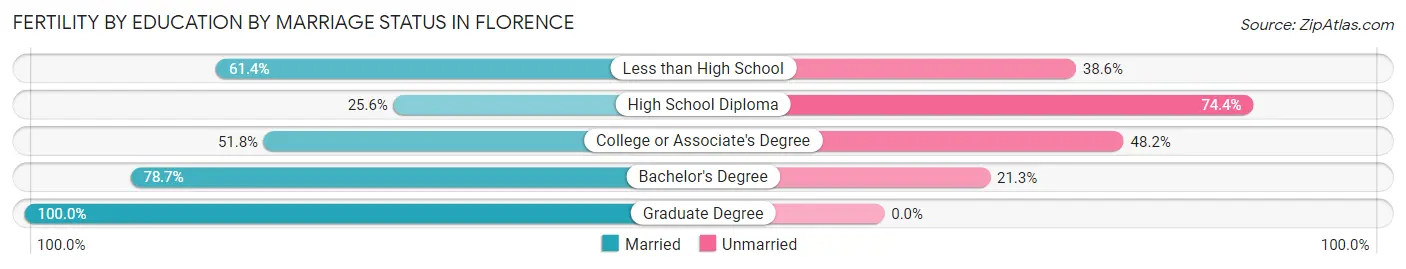
| Educational Attainment | Married | Unmarried |
| Less than High School | 35 (61.4%) | 22 (38.6%) |
| High School Diploma | 62 (25.6%) | 180 (74.4%) |
| College or Associate's Degree | 73 (51.8%) | 68 (48.2%) |
| Bachelor's Degree | 48 (78.7%) | 13 (21.3%) |
| Graduate Degree | 16 (100.0%) | 0 (0.0%) |
| Total | 234 (45.3%) | 283 (54.7%) |
Employment Characteristics in Florence
Employment by Class of Employer in Florence
Among the 17,693 employed individuals in Florence, private company employees (13,124 | 74.2%), local government employees (1,043 | 5.9%), and state government employees (961 | 5.4%) make up the most common classes of employment.
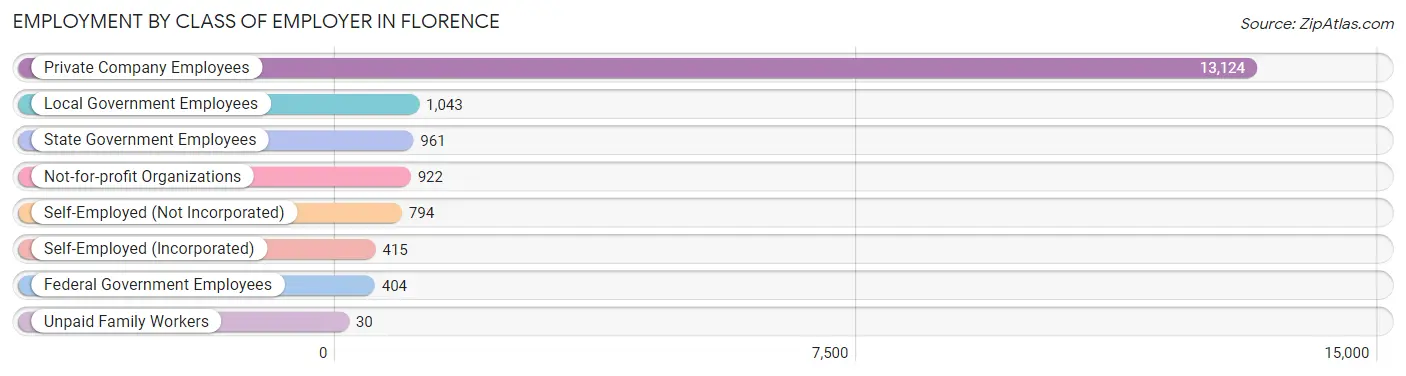
| Employer Class | # Employees | % Employees |
| Private Company Employees | 13,124 | 74.2% |
| Self-Employed (Incorporated) | 415 | 2.4% |
| Self-Employed (Not Incorporated) | 794 | 4.5% |
| Not-for-profit Organizations | 922 | 5.2% |
| Local Government Employees | 1,043 | 5.9% |
| State Government Employees | 961 | 5.4% |
| Federal Government Employees | 404 | 2.3% |
| Unpaid Family Workers | 30 | 0.2% |
| Total | 17,693 | 100.0% |
Employment Status by Age in Florence
According to the labor force statistics for Florence, out of the total population over 16 years of age (33,660), 56.1% or 18,883 individuals are in the labor force, with 5.7% or 1,076 of them unemployed. The age group with the highest labor force participation rate is 45 to 54 years, with 77.0% or 2,825 individuals in the labor force. Within the labor force, the 35 to 44 years age range has the highest percentage of unemployed individuals, with 11.0% or 372 of them being unemployed.
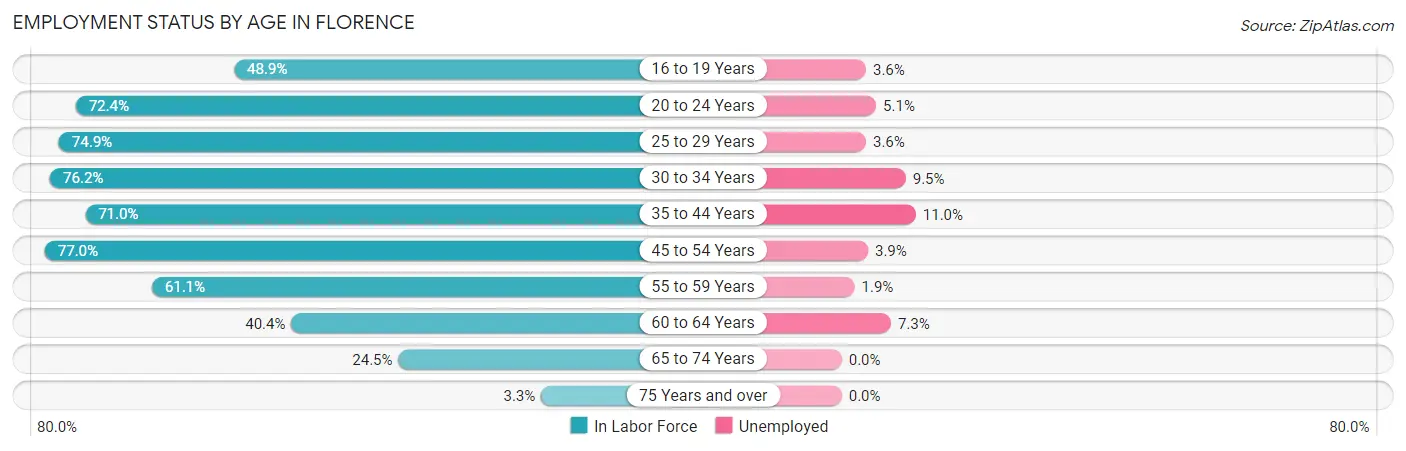
| Age Bracket | In Labor Force | Unemployed |
| 16 to 19 Years | 1,200 (48.9%) | 43 (3.6%) |
| 20 to 24 Years | 3,779 (72.4%) | 193 (5.1%) |
| 25 to 29 Years | 2,401 (74.9%) | 86 (3.6%) |
| 30 to 34 Years | 1,849 (76.2%) | 176 (9.5%) |
| 35 to 44 Years | 3,386 (71.0%) | 372 (11.0%) |
| 45 to 54 Years | 2,825 (77.0%) | 110 (3.9%) |
| 55 to 59 Years | 1,347 (61.1%) | 26 (1.9%) |
| 60 to 64 Years | 975 (40.4%) | 71 (7.3%) |
| 65 to 74 Years | 1,015 (24.5%) | 0 (0.0%) |
| 75 Years and over | 104 (3.3%) | 0 (0.0%) |
| Total | 18,883 (56.1%) | 1,076 (5.7%) |
Employment Status by Educational Attainment in Florence
According to labor force statistics for Florence, 68.4% of individuals (12,783) out of the total population between 25 and 64 years of age (18,688) are in the labor force, with 6.5% or 831 of them being unemployed. The group with the highest labor force participation rate are those with the educational attainment of bachelor's degree or higher, with 82.4% or 4,262 individuals in the labor force. Within the labor force, individuals with college / associate degree education have the highest percentage of unemployment, with 13.7% or 516 of them being unemployed.
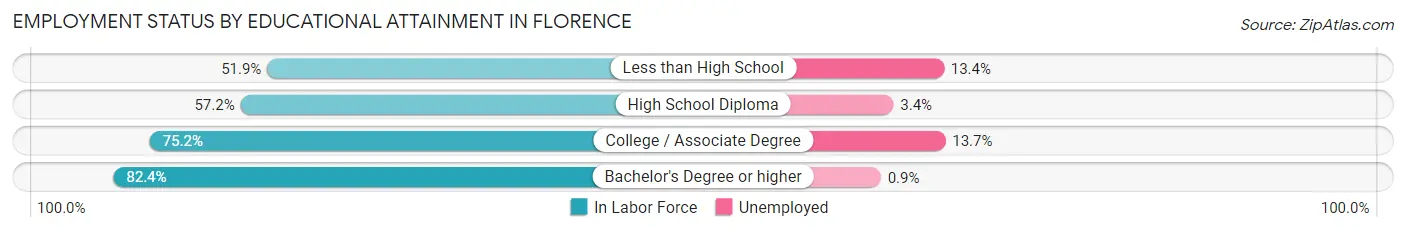
| Educational Attainment | In Labor Force | Unemployed |
| Less than High School | 1,148 (51.9%) | 296 (13.4%) |
| High School Diploma | 3,601 (57.2%) | 214 (3.4%) |
| College / Associate Degree | 3,767 (75.2%) | 686 (13.7%) |
| Bachelor's Degree or higher | 4,262 (82.4%) | 47 (0.9%) |
| Total | 12,783 (68.4%) | 1,215 (6.5%) |
Employment Occupations by Sex in Florence
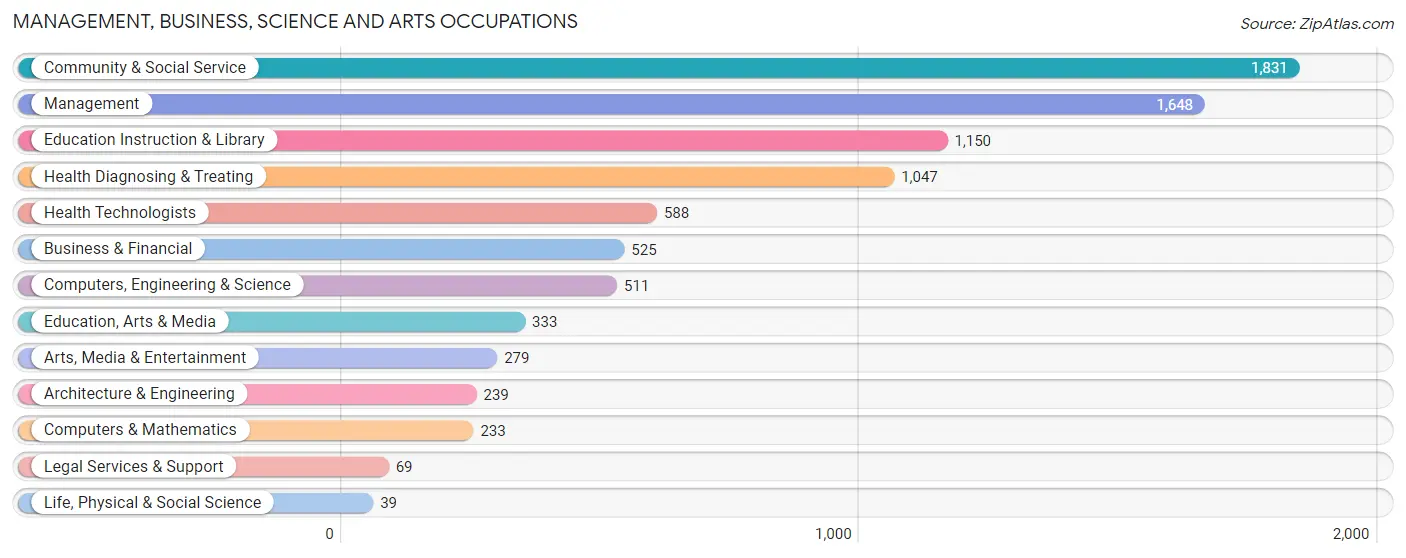
Management, Business, Science and Arts Occupations
The most common Management, Business, Science and Arts occupations in Florence are Community & Social Service (1,831 | 10.3%), Management (1,648 | 9.3%), Education Instruction & Library (1,150 | 6.5%), Health Diagnosing & Treating (1,047 | 5.9%), and Health Technologists (588 | 3.3%).
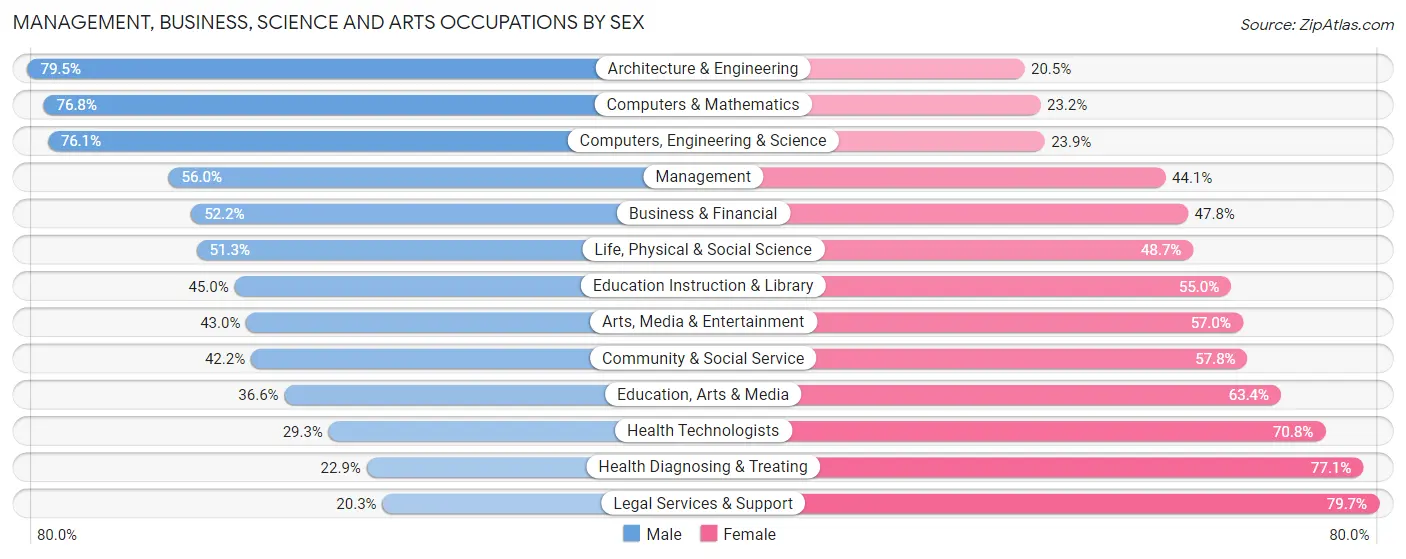
Management, Business, Science and Arts Occupations by Sex
Within the Management, Business, Science and Arts occupations in Florence, the most male-oriented occupations are Architecture & Engineering (79.5%), Computers & Mathematics (76.8%), and Computers, Engineering & Science (76.1%), while the most female-oriented occupations are Legal Services & Support (79.7%), Health Diagnosing & Treating (77.1%), and Health Technologists (70.8%).
| Occupation | Male | Female |
| Management | 922 (55.9%) | 726 (44.1%) |
| Business & Financial | 274 (52.2%) | 251 (47.8%) |
| Computers, Engineering & Science | 389 (76.1%) | 122 (23.9%) |
| Computers & Mathematics | 179 (76.8%) | 54 (23.2%) |
| Architecture & Engineering | 190 (79.5%) | 49 (20.5%) |
| Life, Physical & Social Science | 20 (51.3%) | 19 (48.7%) |
| Community & Social Service | 773 (42.2%) | 1,058 (57.8%) |
| Education, Arts & Media | 122 (36.6%) | 211 (63.4%) |
| Legal Services & Support | 14 (20.3%) | 55 (79.7%) |
| Education Instruction & Library | 517 (45.0%) | 633 (55.0%) |
| Arts, Media & Entertainment | 120 (43.0%) | 159 (57.0%) |
| Health Diagnosing & Treating | 240 (22.9%) | 807 (77.1%) |
| Health Technologists | 172 (29.2%) | 416 (70.8%) |
| Total (Category) | 2,598 (46.7%) | 2,964 (53.3%) |
| Total (Overall) | 9,050 (51.0%) | 8,702 (49.0%) |
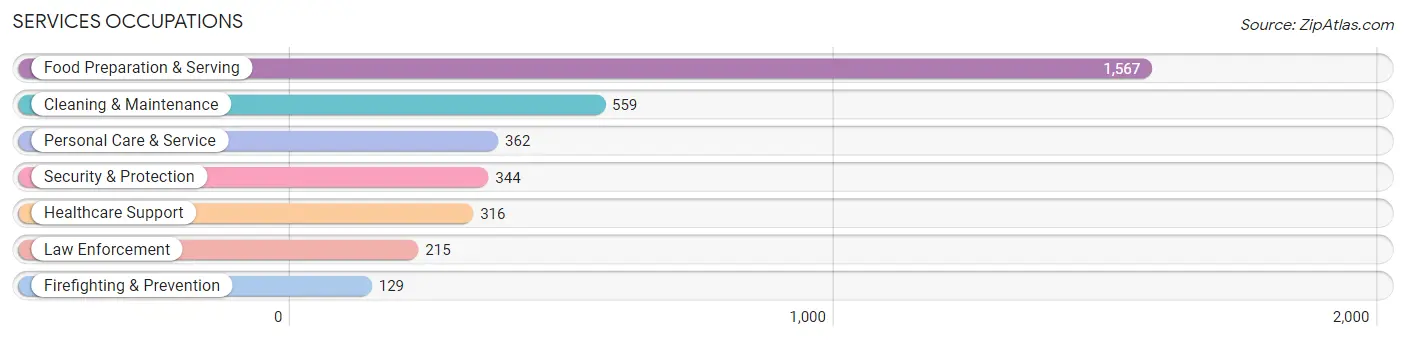
Services Occupations
The most common Services occupations in Florence are Food Preparation & Serving (1,567 | 8.8%), Cleaning & Maintenance (559 | 3.2%), Personal Care & Service (362 | 2.0%), Security & Protection (344 | 1.9%), and Healthcare Support (316 | 1.8%).
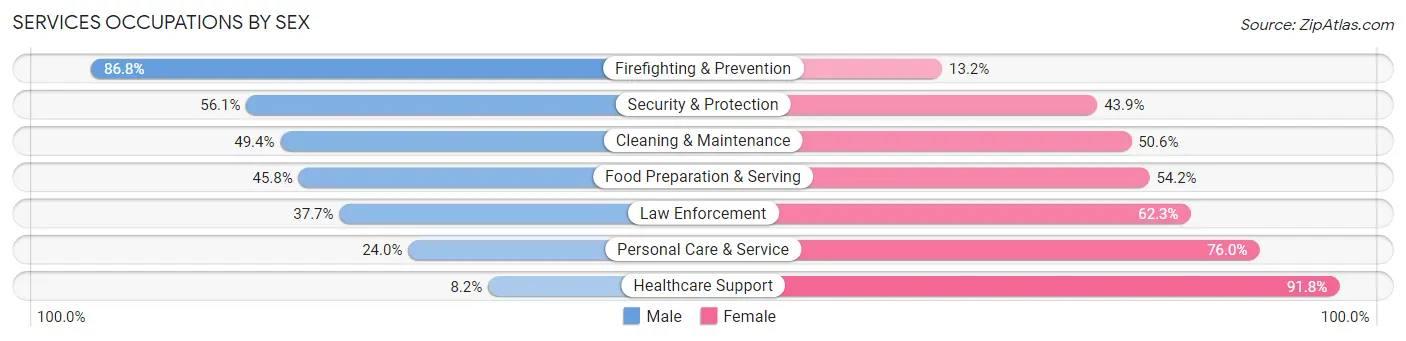
Services Occupations by Sex
Within the Services occupations in Florence, the most male-oriented occupations are Firefighting & Prevention (86.8%), Security & Protection (56.1%), and Cleaning & Maintenance (49.4%), while the most female-oriented occupations are Healthcare Support (91.8%), Personal Care & Service (76.0%), and Law Enforcement (62.3%).
| Occupation | Male | Female |
| Healthcare Support | 26 (8.2%) | 290 (91.8%) |
| Security & Protection | 193 (56.1%) | 151 (43.9%) |
| Firefighting & Prevention | 112 (86.8%) | 17 (13.2%) |
| Law Enforcement | 81 (37.7%) | 134 (62.3%) |
| Food Preparation & Serving | 717 (45.8%) | 850 (54.2%) |
| Cleaning & Maintenance | 276 (49.4%) | 283 (50.6%) |
| Personal Care & Service | 87 (24.0%) | 275 (76.0%) |
| Total (Category) | 1,299 (41.3%) | 1,849 (58.7%) |
| Total (Overall) | 9,050 (51.0%) | 8,702 (49.0%) |
Sales and Office Occupations
The most common Sales and Office occupations in Florence are Sales & Related (2,852 | 16.1%), and Office & Administration (1,962 | 11.1%).

Sales and Office Occupations by Sex
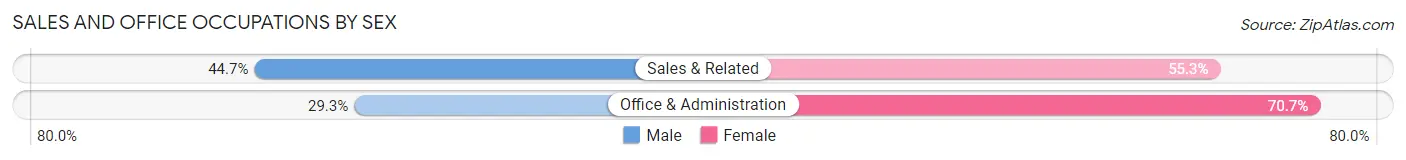
| Occupation | Male | Female |
| Sales & Related | 1,274 (44.7%) | 1,578 (55.3%) |
| Office & Administration | 575 (29.3%) | 1,387 (70.7%) |
| Total (Category) | 1,849 (38.4%) | 2,965 (61.6%) |
| Total (Overall) | 9,050 (51.0%) | 8,702 (49.0%) |
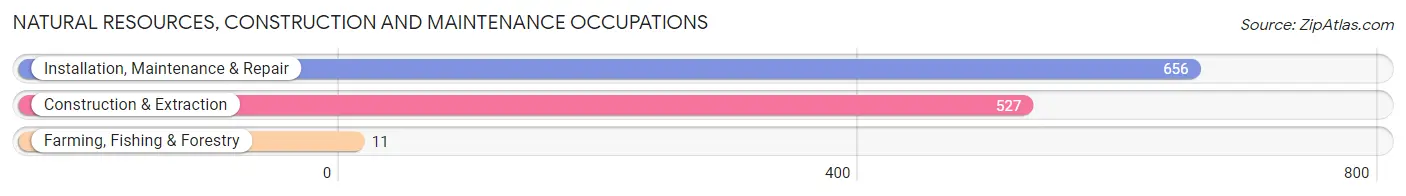
Natural Resources, Construction and Maintenance Occupations
The most common Natural Resources, Construction and Maintenance occupations in Florence are Installation, Maintenance & Repair (656 | 3.7%), Construction & Extraction (527 | 3.0%), and Farming, Fishing & Forestry (11 | 0.1%).
Natural Resources, Construction and Maintenance Occupations by Sex
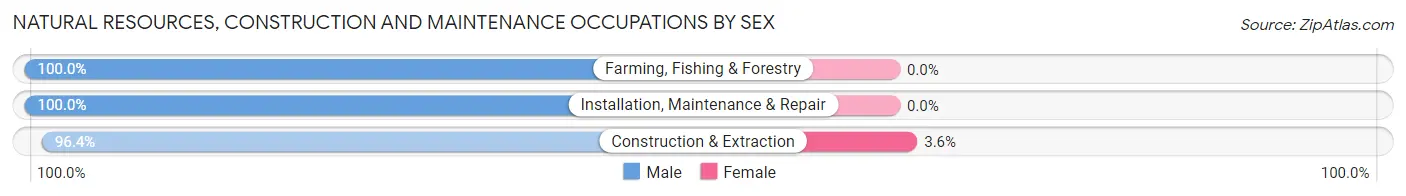
| Occupation | Male | Female |
| Farming, Fishing & Forestry | 11 (100.0%) | 0 (0.0%) |
| Construction & Extraction | 508 (96.4%) | 19 (3.6%) |
| Installation, Maintenance & Repair | 656 (100.0%) | 0 (0.0%) |
| Total (Category) | 1,175 (98.4%) | 19 (1.6%) |
| Total (Overall) | 9,050 (51.0%) | 8,702 (49.0%) |
Production, Transportation and Moving Occupations
The most common Production, Transportation and Moving occupations in Florence are Production (1,810 | 10.2%), Material Moving (754 | 4.3%), and Transportation (470 | 2.6%).
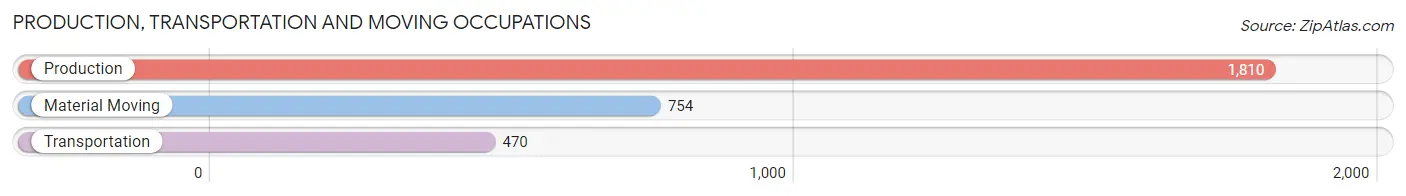
Production, Transportation and Moving Occupations by Sex
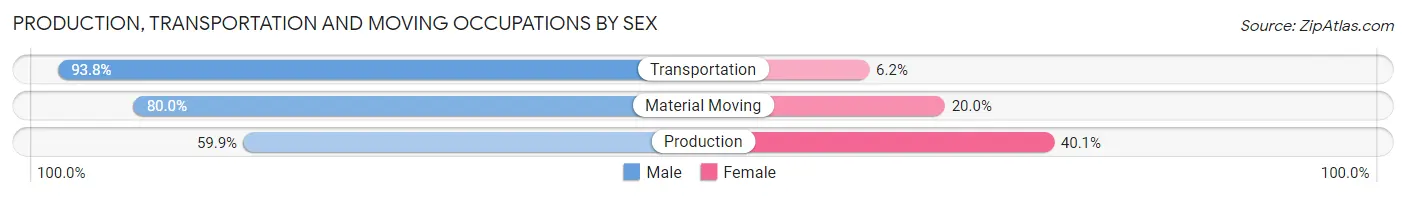
| Occupation | Male | Female |
| Production | 1,085 (59.9%) | 725 (40.1%) |
| Transportation | 441 (93.8%) | 29 (6.2%) |
| Material Moving | 603 (80.0%) | 151 (20.0%) |
| Total (Category) | 2,129 (70.2%) | 905 (29.8%) |
| Total (Overall) | 9,050 (51.0%) | 8,702 (49.0%) |
Employment Industries by Sex in Florence
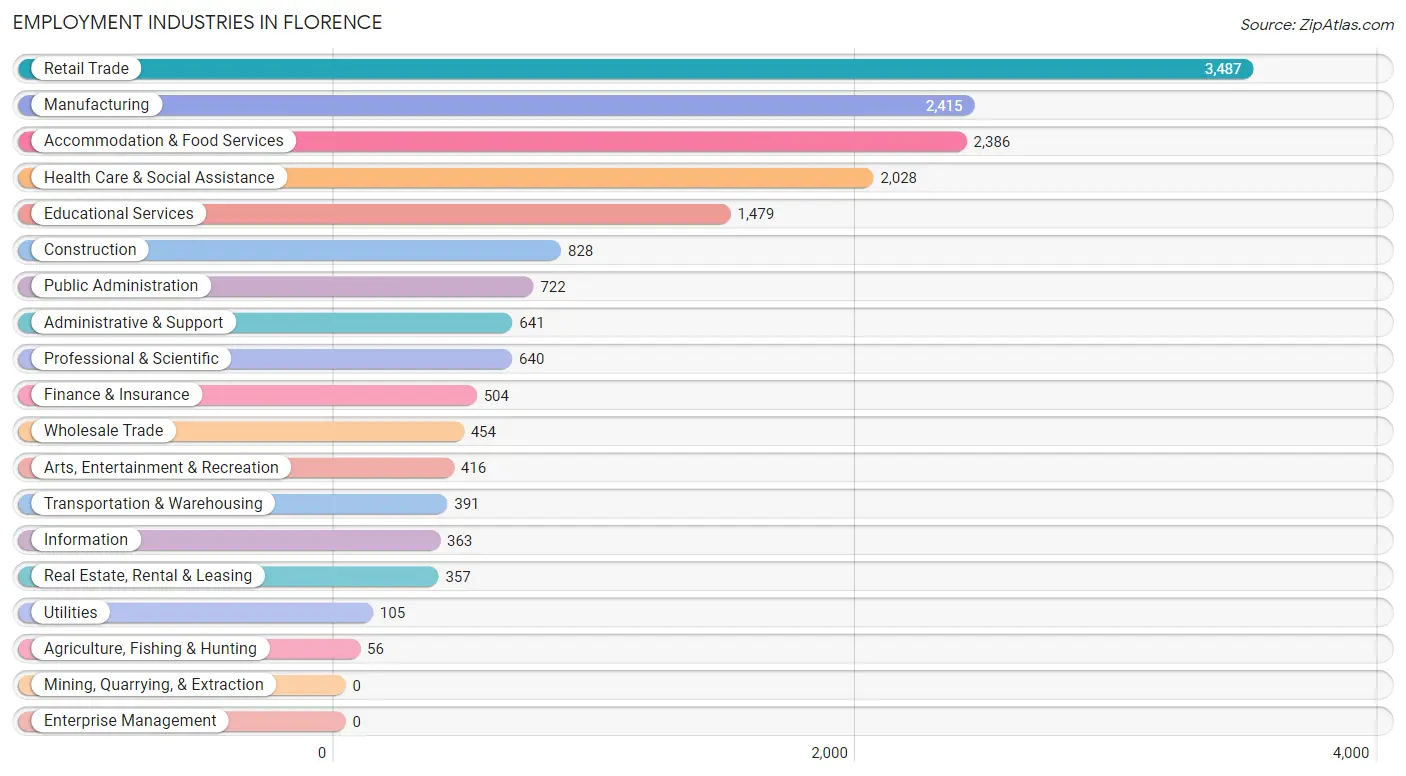
Employment Industries in Florence
The major employment industries in Florence include Retail Trade (3,487 | 19.6%), Manufacturing (2,415 | 13.6%), Accommodation & Food Services (2,386 | 13.4%), Health Care & Social Assistance (2,028 | 11.4%), and Educational Services (1,479 | 8.3%).
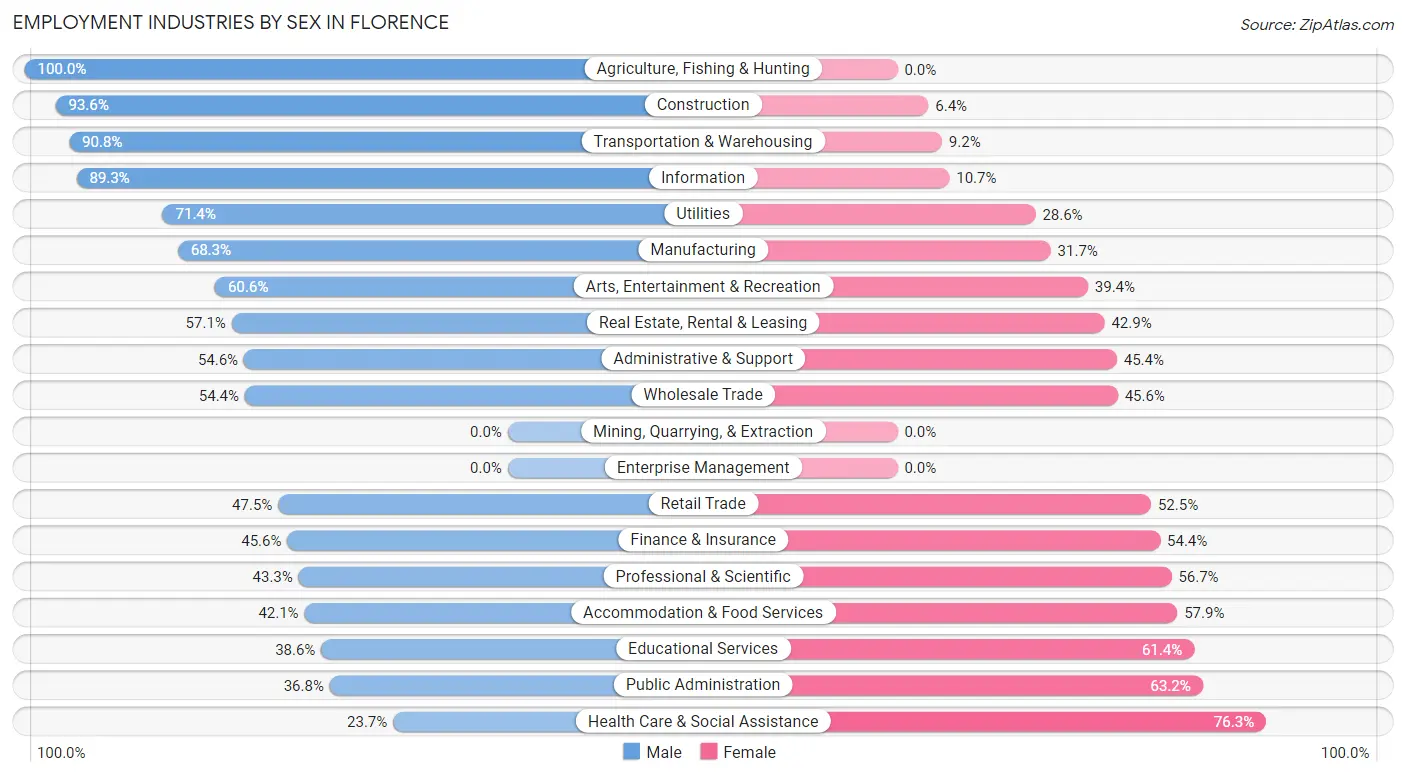
Employment Industries by Sex in Florence
The Florence industries that see more men than women are Agriculture, Fishing & Hunting (100.0%), Construction (93.6%), and Transportation & Warehousing (90.8%), whereas the industries that tend to have a higher number of women are Health Care & Social Assistance (76.3%), Public Administration (63.2%), and Educational Services (61.4%).
| Industry | Male | Female |
| Agriculture, Fishing & Hunting | 56 (100.0%) | 0 (0.0%) |
| Mining, Quarrying, & Extraction | 0 (0.0%) | 0 (0.0%) |
| Construction | 775 (93.6%) | 53 (6.4%) |
| Manufacturing | 1,649 (68.3%) | 766 (31.7%) |
| Wholesale Trade | 247 (54.4%) | 207 (45.6%) |
| Retail Trade | 1,657 (47.5%) | 1,830 (52.5%) |
| Transportation & Warehousing | 355 (90.8%) | 36 (9.2%) |
| Utilities | 75 (71.4%) | 30 (28.6%) |
| Information | 324 (89.3%) | 39 (10.7%) |
| Finance & Insurance | 230 (45.6%) | 274 (54.4%) |
| Real Estate, Rental & Leasing | 204 (57.1%) | 153 (42.9%) |
| Professional & Scientific | 277 (43.3%) | 363 (56.7%) |
| Enterprise Management | 0 (0.0%) | 0 (0.0%) |
| Administrative & Support | 350 (54.6%) | 291 (45.4%) |
| Educational Services | 571 (38.6%) | 908 (61.4%) |
| Health Care & Social Assistance | 481 (23.7%) | 1,547 (76.3%) |
| Arts, Entertainment & Recreation | 252 (60.6%) | 164 (39.4%) |
| Accommodation & Food Services | 1,004 (42.1%) | 1,382 (57.9%) |
| Public Administration | 266 (36.8%) | 456 (63.2%) |
| Total | 9,050 (51.0%) | 8,702 (49.0%) |
Education in Florence
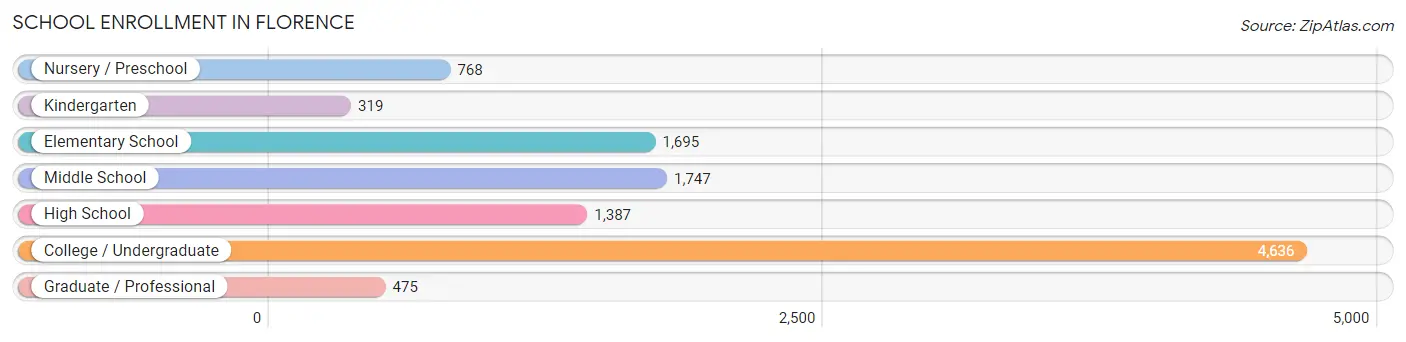
School Enrollment in Florence
The most common levels of schooling among the 11,027 students in Florence are college / undergraduate (4,636 | 42.0%), middle school (1,747 | 15.8%), and elementary school (1,695 | 15.4%).
| School Level | # Students | % Students |
| Nursery / Preschool | 768 | 7.0% |
| Kindergarten | 319 | 2.9% |
| Elementary School | 1,695 | 15.4% |
| Middle School | 1,747 | 15.8% |
| High School | 1,387 | 12.6% |
| College / Undergraduate | 4,636 | 42.0% |
| Graduate / Professional | 475 | 4.3% |
| Total | 11,027 | 100.0% |
School Enrollment by Age by Funding Source in Florence
Out of a total of 11,027 students who are enrolled in schools in Florence, 1,235 (11.2%) attend a private institution, while the remaining 9,792 (88.8%) are enrolled in public schools. The age group of 3 to 4 year olds has the highest likelihood of being enrolled in private schools, with 100 (22.1% in the age bracket) enrolled. Conversely, the age group of 20 to 24 year olds has the lowest likelihood of being enrolled in a private school, with 2,903 (97.8% in the age bracket) attending a public institution.
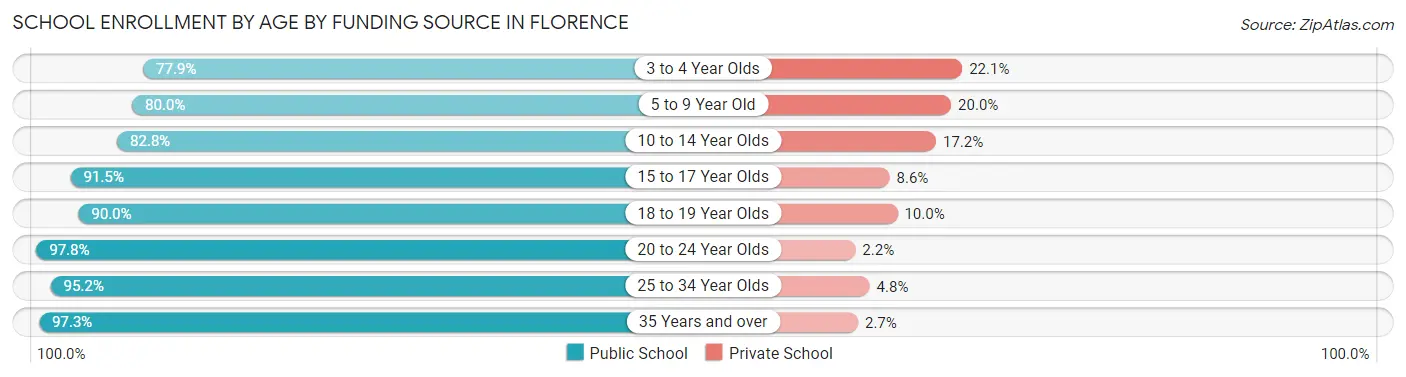
| Age Bracket | Public School | Private School |
| 3 to 4 Year Olds | 353 (77.9%) | 100 (22.1%) |
| 5 to 9 Year Old | 1,586 (80.0%) | 397 (20.0%) |
| 10 to 14 Year Olds | 1,895 (82.8%) | 394 (17.2%) |
| 15 to 17 Year Olds | 1,005 (91.4%) | 94 (8.6%) |
| 18 to 19 Year Olds | 1,356 (90.0%) | 151 (10.0%) |
| 20 to 24 Year Olds | 2,903 (97.8%) | 65 (2.2%) |
| 25 to 34 Year Olds | 551 (95.2%) | 28 (4.8%) |
| 35 Years and over | 145 (97.3%) | 4 (2.7%) |
| Total | 9,792 (88.8%) | 1,235 (11.2%) |
Educational Attainment by Field of Study in Florence
Business (1,938 | 23.7%), education (1,235 | 15.1%), science & technology (1,023 | 12.5%), arts & humanities (957 | 11.7%), and social sciences (449 | 5.5%) are the most common fields of study among 8,167 individuals in Florence who have obtained a bachelor's degree or higher.
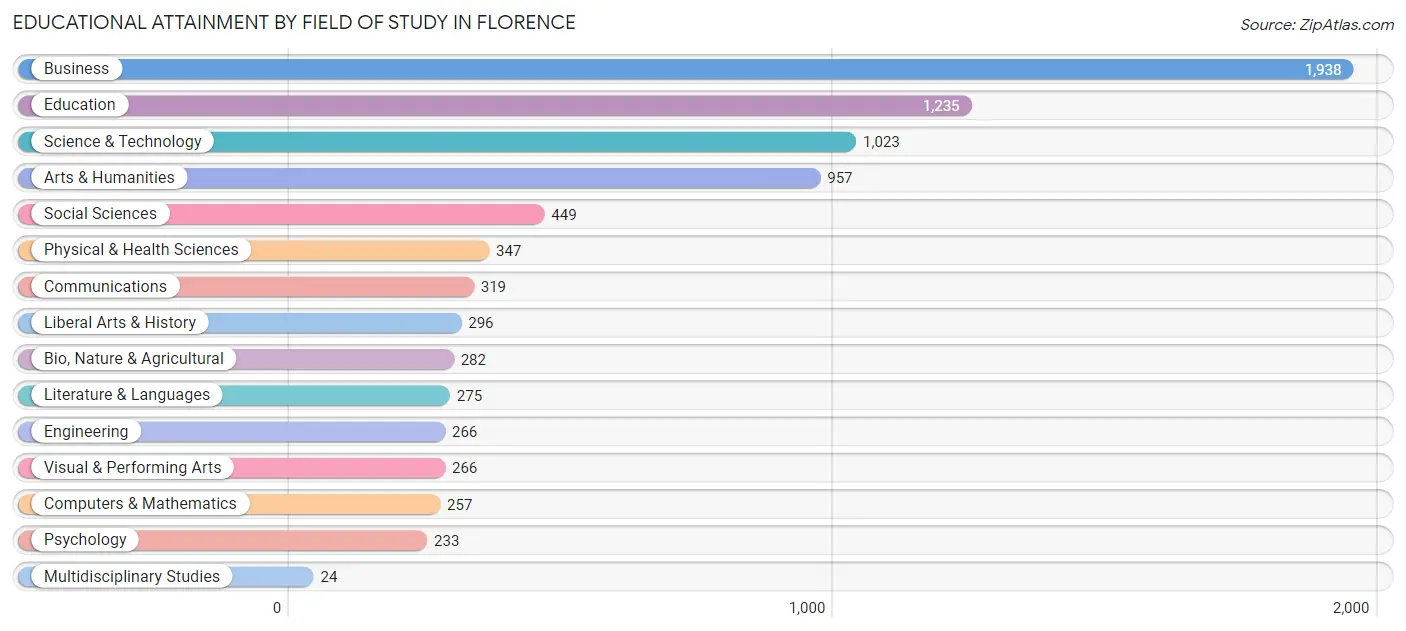
| Field of Study | # Graduates | % Graduates |
| Computers & Mathematics | 257 | 3.2% |
| Bio, Nature & Agricultural | 282 | 3.5% |
| Physical & Health Sciences | 347 | 4.3% |
| Psychology | 233 | 2.9% |
| Social Sciences | 449 | 5.5% |
| Engineering | 266 | 3.3% |
| Multidisciplinary Studies | 24 | 0.3% |
| Science & Technology | 1,023 | 12.5% |
| Business | 1,938 | 23.7% |
| Education | 1,235 | 15.1% |
| Literature & Languages | 275 | 3.4% |
| Liberal Arts & History | 296 | 3.6% |
| Visual & Performing Arts | 266 | 3.3% |
| Communications | 319 | 3.9% |
| Arts & Humanities | 957 | 11.7% |
| Total | 8,167 | 100.0% |
Transportation & Commute in Florence
Vehicle Availability by Sex in Florence
The most prevalent vehicle ownership categories in Florence are males with 2 vehicles (3,684, accounting for 41.6%) and females with 2 vehicles (3,202, making up 44.5%).
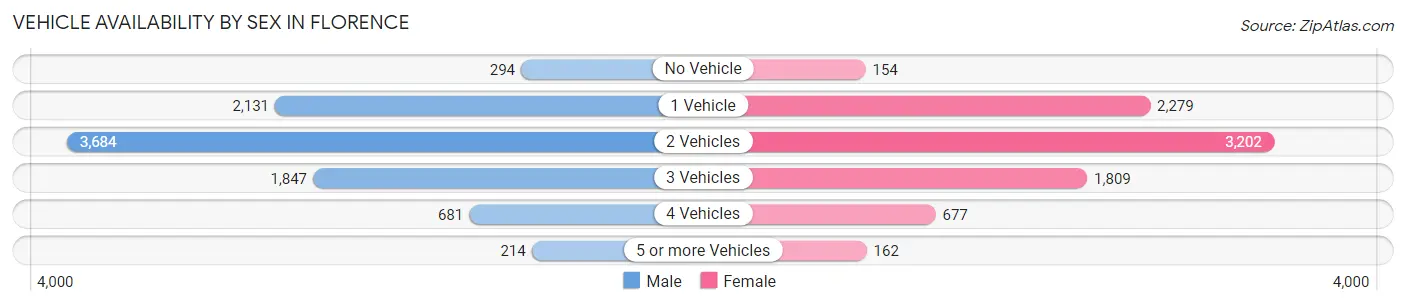
| Vehicles Available | Male | Female |
| No Vehicle | 294 (3.3%) | 154 (1.9%) |
| 1 Vehicle | 2,131 (24.1%) | 2,279 (27.5%) |
| 2 Vehicles | 3,684 (41.6%) | 3,202 (38.7%) |
| 3 Vehicles | 1,847 (20.9%) | 1,809 (21.8%) |
| 4 Vehicles | 681 (7.7%) | 677 (8.2%) |
| 5 or more Vehicles | 214 (2.4%) | 162 (2.0%) |
| Total | 8,851 (100.0%) | 8,283 (100.0%) |
Commute Time in Florence
The most frequently occuring commute durations in Florence are 15 to 19 minutes (4,489 commuters, 26.8%), 10 to 14 minutes (3,678 commuters, 21.9%), and 5 to 9 minutes (3,347 commuters, 20.0%).
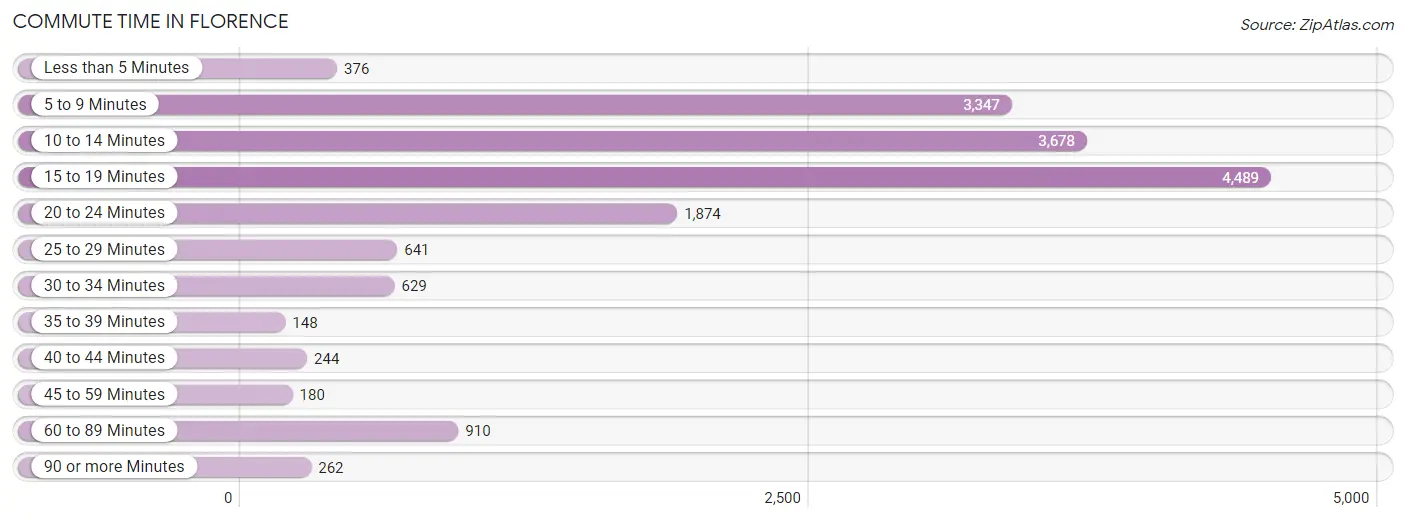
| Commute Time | # Commuters | % Commuters |
| Less than 5 Minutes | 376 | 2.2% |
| 5 to 9 Minutes | 3,347 | 20.0% |
| 10 to 14 Minutes | 3,678 | 21.9% |
| 15 to 19 Minutes | 4,489 | 26.8% |
| 20 to 24 Minutes | 1,874 | 11.2% |
| 25 to 29 Minutes | 641 | 3.8% |
| 30 to 34 Minutes | 629 | 3.7% |
| 35 to 39 Minutes | 148 | 0.9% |
| 40 to 44 Minutes | 244 | 1.5% |
| 45 to 59 Minutes | 180 | 1.1% |
| 60 to 89 Minutes | 910 | 5.4% |
| 90 or more Minutes | 262 | 1.6% |
Commute Time by Sex in Florence
The most common commute times in Florence are 15 to 19 minutes (2,383 commuters, 27.2%) for males and 15 to 19 minutes (2,106 commuters, 26.2%) for females.
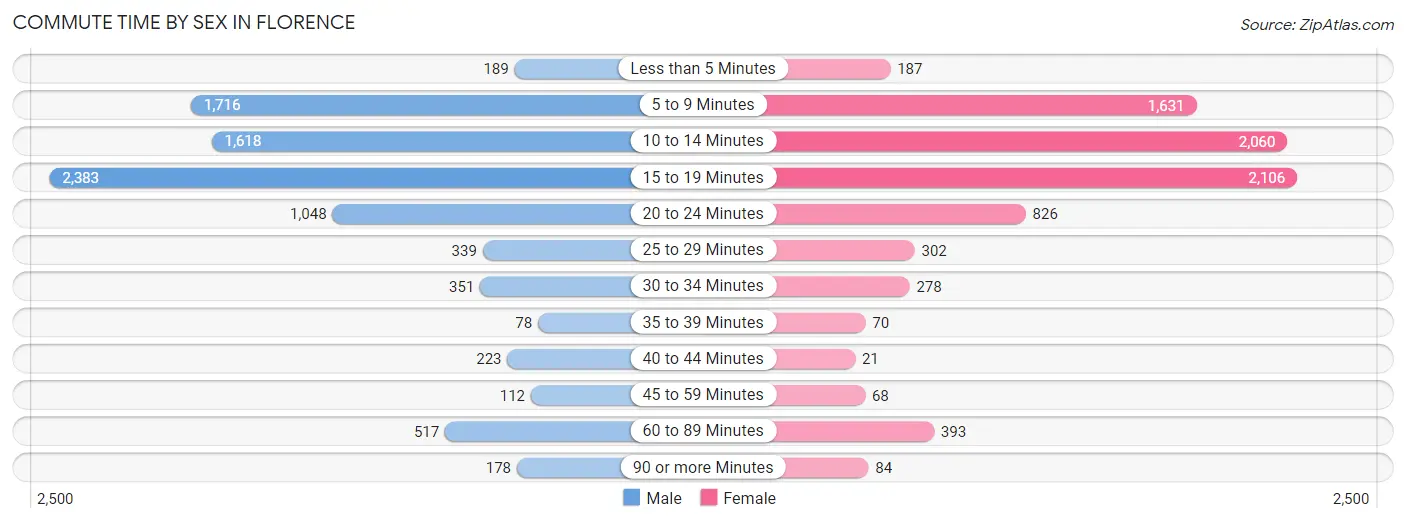
| Commute Time | Male | Female |
| Less than 5 Minutes | 189 (2.2%) | 187 (2.3%) |
| 5 to 9 Minutes | 1,716 (19.6%) | 1,631 (20.3%) |
| 10 to 14 Minutes | 1,618 (18.5%) | 2,060 (25.7%) |
| 15 to 19 Minutes | 2,383 (27.2%) | 2,106 (26.2%) |
| 20 to 24 Minutes | 1,048 (12.0%) | 826 (10.3%) |
| 25 to 29 Minutes | 339 (3.9%) | 302 (3.8%) |
| 30 to 34 Minutes | 351 (4.0%) | 278 (3.5%) |
| 35 to 39 Minutes | 78 (0.9%) | 70 (0.9%) |
| 40 to 44 Minutes | 223 (2.5%) | 21 (0.3%) |
| 45 to 59 Minutes | 112 (1.3%) | 68 (0.9%) |
| 60 to 89 Minutes | 517 (5.9%) | 393 (4.9%) |
| 90 or more Minutes | 178 (2.0%) | 84 (1.1%) |
Time of Departure to Work by Sex in Florence
The most frequent times of departure to work in Florence are 7:30 AM to 7:59 AM (1,337, 15.3%) for males and 7:00 AM to 7:29 AM (1,222, 15.2%) for females.
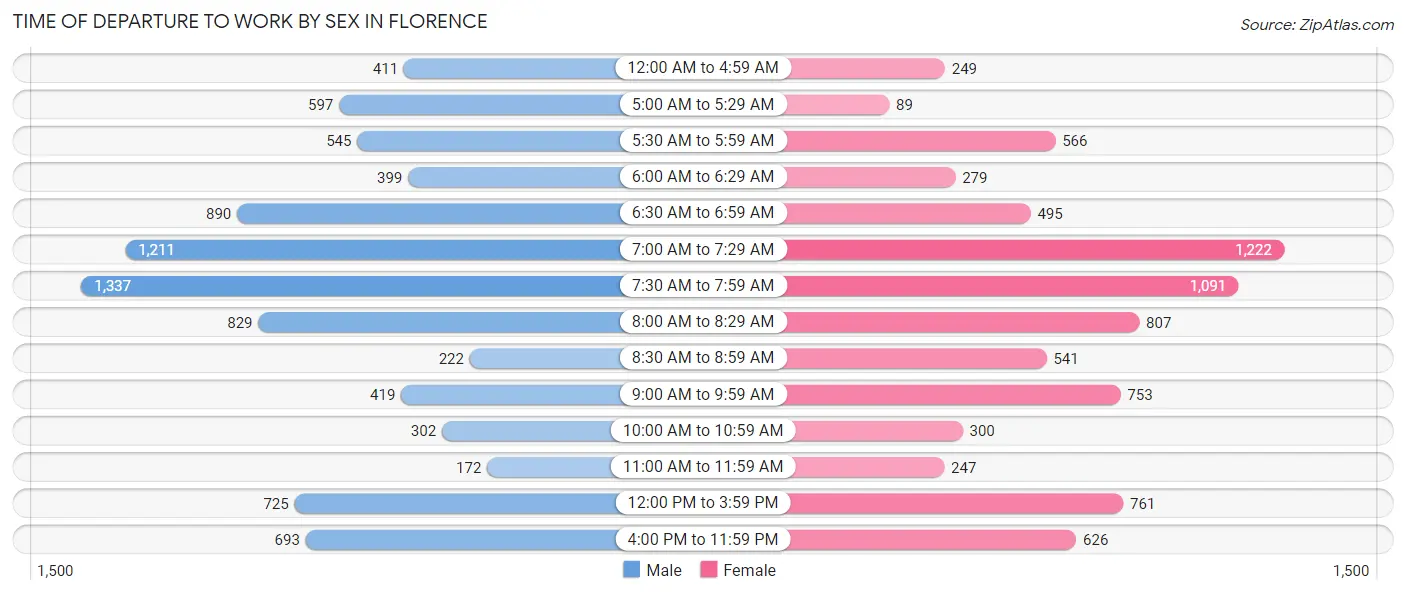
| Time of Departure | Male | Female |
| 12:00 AM to 4:59 AM | 411 (4.7%) | 249 (3.1%) |
| 5:00 AM to 5:29 AM | 597 (6.8%) | 89 (1.1%) |
| 5:30 AM to 5:59 AM | 545 (6.2%) | 566 (7.0%) |
| 6:00 AM to 6:29 AM | 399 (4.6%) | 279 (3.5%) |
| 6:30 AM to 6:59 AM | 890 (10.2%) | 495 (6.2%) |
| 7:00 AM to 7:29 AM | 1,211 (13.8%) | 1,222 (15.2%) |
| 7:30 AM to 7:59 AM | 1,337 (15.3%) | 1,091 (13.6%) |
| 8:00 AM to 8:29 AM | 829 (9.5%) | 807 (10.1%) |
| 8:30 AM to 8:59 AM | 222 (2.5%) | 541 (6.7%) |
| 9:00 AM to 9:59 AM | 419 (4.8%) | 753 (9.4%) |
| 10:00 AM to 10:59 AM | 302 (3.5%) | 300 (3.7%) |
| 11:00 AM to 11:59 AM | 172 (2.0%) | 247 (3.1%) |
| 12:00 PM to 3:59 PM | 725 (8.3%) | 761 (9.5%) |
| 4:00 PM to 11:59 PM | 693 (7.9%) | 626 (7.8%) |
| Total | 8,752 (100.0%) | 8,026 (100.0%) |
Housing Occupancy in Florence
Occupancy by Ownership in Florence
Of the total 17,020 dwellings in Florence, owner-occupied units account for 8,488 (49.9%), while renter-occupied units make up 8,532 (50.1%).
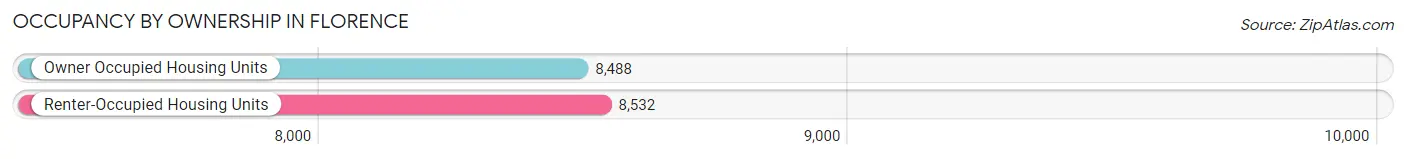
| Occupancy | # Housing Units | % Housing Units |
| Owner Occupied Housing Units | 8,488 | 49.9% |
| Renter-Occupied Housing Units | 8,532 | 50.1% |
| Total Occupied Housing Units | 17,020 | 100.0% |
Occupancy by Household Size in Florence
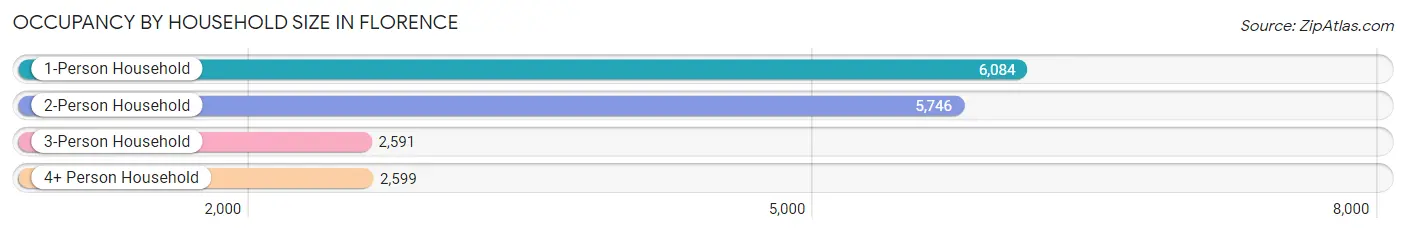
| Household Size | # Housing Units | % Housing Units |
| 1-Person Household | 6,084 | 35.7% |
| 2-Person Household | 5,746 | 33.8% |
| 3-Person Household | 2,591 | 15.2% |
| 4+ Person Household | 2,599 | 15.3% |
| Total Housing Units | 17,020 | 100.0% |
Occupancy by Ownership by Household Size in Florence
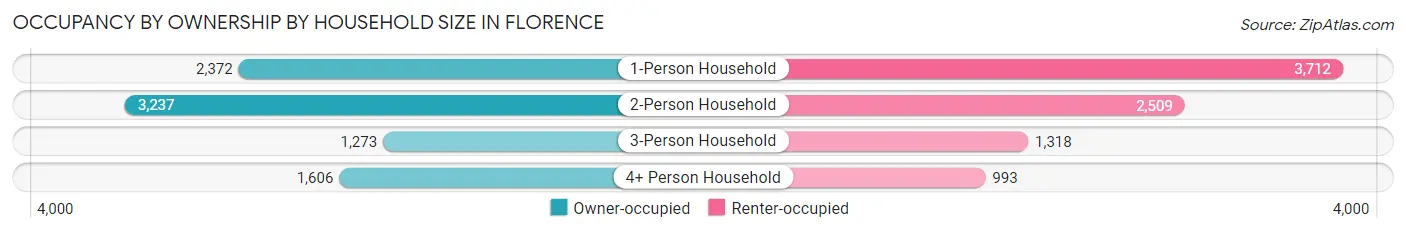
| Household Size | Owner-occupied | Renter-occupied |
| 1-Person Household | 2,372 (39.0%) | 3,712 (61.0%) |
| 2-Person Household | 3,237 (56.3%) | 2,509 (43.7%) |
| 3-Person Household | 1,273 (49.1%) | 1,318 (50.9%) |
| 4+ Person Household | 1,606 (61.8%) | 993 (38.2%) |
| Total Housing Units | 8,488 (49.9%) | 8,532 (50.1%) |
Occupancy by Educational Attainment in Florence
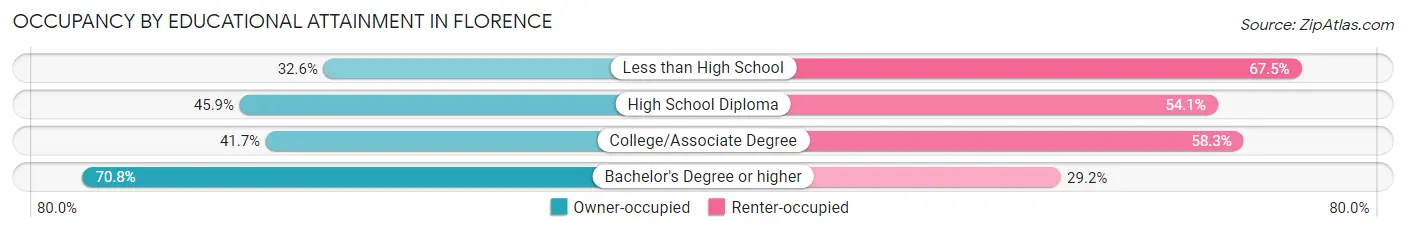
| Household Size | Owner-occupied | Renter-occupied |
| Less than High School | 529 (32.6%) | 1,096 (67.4%) |
| High School Diploma | 2,489 (45.9%) | 2,938 (54.1%) |
| College/Associate Degree | 2,279 (41.7%) | 3,183 (58.3%) |
| Bachelor's Degree or higher | 3,191 (70.8%) | 1,315 (29.2%) |
Occupancy by Age of Householder in Florence
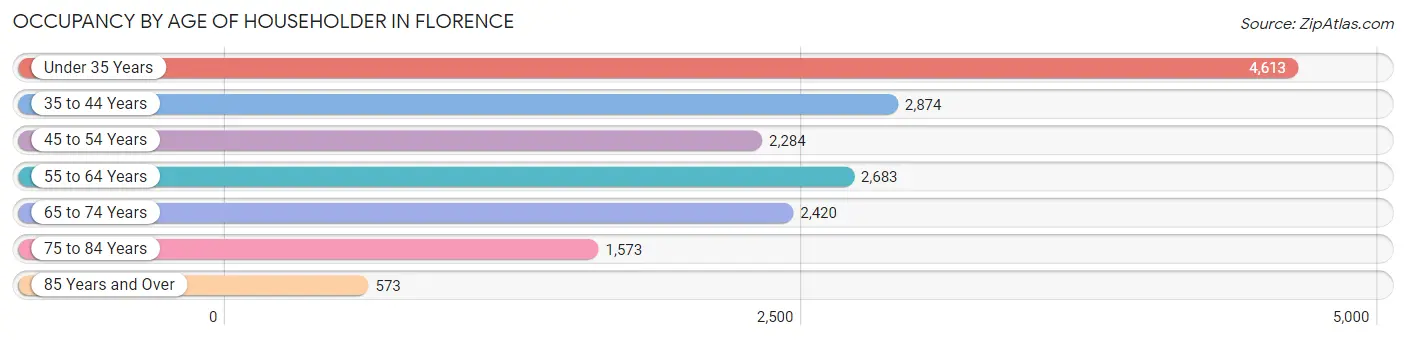
| Age Bracket | # Households | % Households |
| Under 35 Years | 4,613 | 27.1% |
| 35 to 44 Years | 2,874 | 16.9% |
| 45 to 54 Years | 2,284 | 13.4% |
| 55 to 64 Years | 2,683 | 15.8% |
| 65 to 74 Years | 2,420 | 14.2% |
| 75 to 84 Years | 1,573 | 9.2% |
| 85 Years and Over | 573 | 3.4% |
| Total | 17,020 | 100.0% |
Housing Finances in Florence
Median Income by Occupancy in Florence
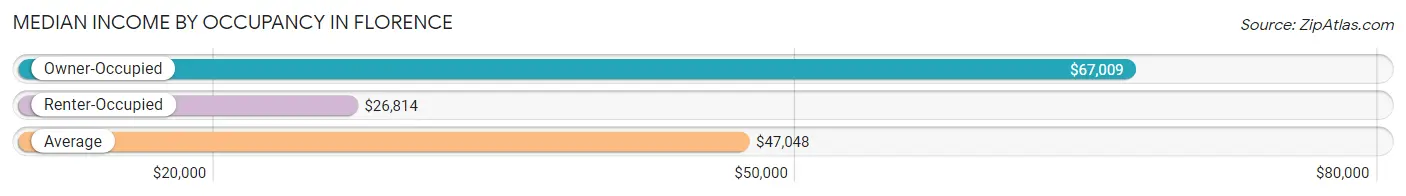
| Occupancy Type | # Households | Median Income |
| Owner-Occupied | 8,488 (49.9%) | $67,009 |
| Renter-Occupied | 8,532 (50.1%) | $26,814 |
| Average | 17,020 (100.0%) | $47,048 |
Occupancy by Householder Income Bracket in Florence
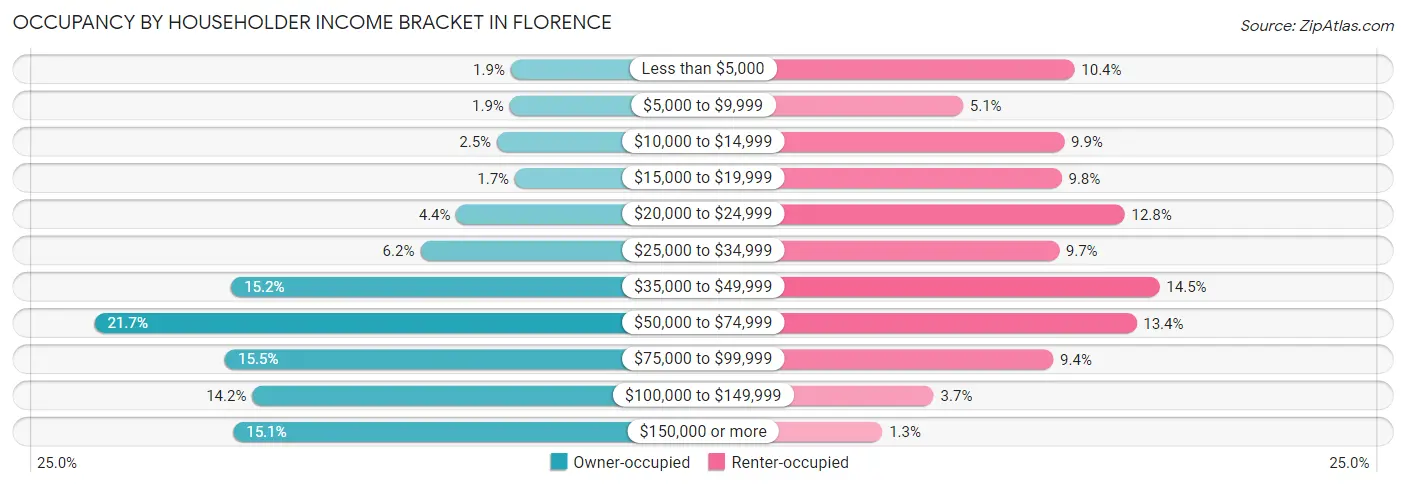
| Income Bracket | Owner-occupied | Renter-occupied |
| Less than $5,000 | 157 (1.8%) | 889 (10.4%) |
| $5,000 to $9,999 | 161 (1.9%) | 436 (5.1%) |
| $10,000 to $14,999 | 213 (2.5%) | 847 (9.9%) |
| $15,000 to $19,999 | 140 (1.7%) | 837 (9.8%) |
| $20,000 to $24,999 | 377 (4.4%) | 1,093 (12.8%) |
| $25,000 to $34,999 | 523 (6.2%) | 826 (9.7%) |
| $35,000 to $49,999 | 1,287 (15.2%) | 1,235 (14.5%) |
| $50,000 to $74,999 | 1,839 (21.7%) | 1,141 (13.4%) |
| $75,000 to $99,999 | 1,311 (15.4%) | 803 (9.4%) |
| $100,000 to $149,999 | 1,202 (14.2%) | 317 (3.7%) |
| $150,000 or more | 1,278 (15.1%) | 108 (1.3%) |
| Total | 8,488 (100.0%) | 8,532 (100.0%) |
Monthly Housing Cost Tiers in Florence
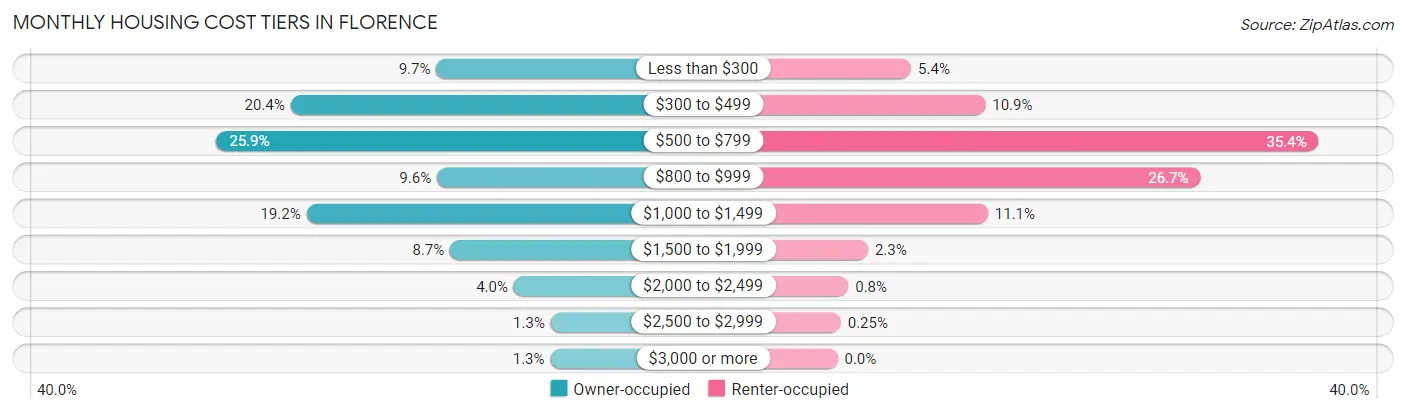
| Monthly Cost | Owner-occupied | Renter-occupied |
| Less than $300 | 822 (9.7%) | 463 (5.4%) |
| $300 to $499 | 1,732 (20.4%) | 929 (10.9%) |
| $500 to $799 | 2,197 (25.9%) | 3,023 (35.4%) |
| $800 to $999 | 817 (9.6%) | 2,281 (26.7%) |
| $1,000 to $1,499 | 1,633 (19.2%) | 945 (11.1%) |
| $1,500 to $1,999 | 735 (8.7%) | 192 (2.2%) |
| $2,000 to $2,499 | 337 (4.0%) | 68 (0.8%) |
| $2,500 to $2,999 | 106 (1.3%) | 21 (0.3%) |
| $3,000 or more | 109 (1.3%) | 0 (0.0%) |
| Total | 8,488 (100.0%) | 8,532 (100.0%) |
Physical Housing Characteristics in Florence
Housing Structures in Florence
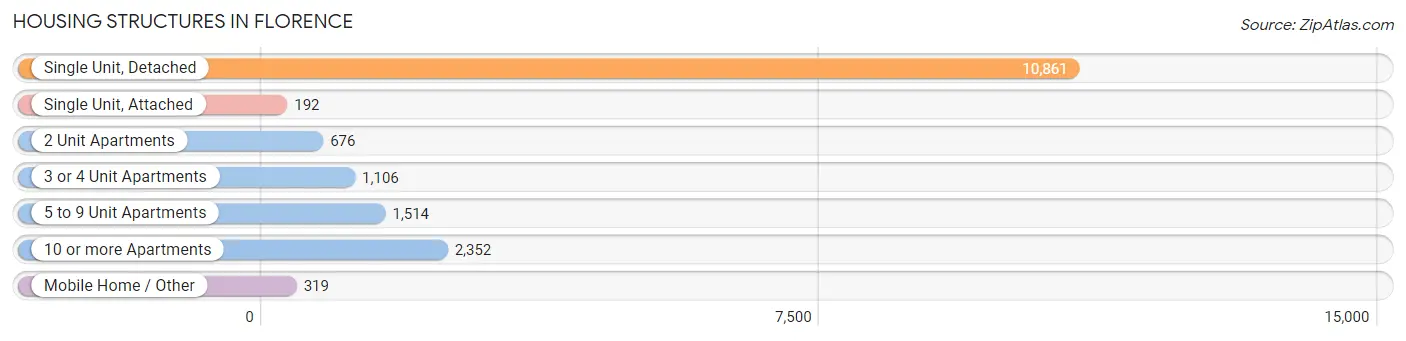
| Structure Type | # Housing Units | % Housing Units |
| Single Unit, Detached | 10,861 | 63.8% |
| Single Unit, Attached | 192 | 1.1% |
| 2 Unit Apartments | 676 | 4.0% |
| 3 or 4 Unit Apartments | 1,106 | 6.5% |
| 5 to 9 Unit Apartments | 1,514 | 8.9% |
| 10 or more Apartments | 2,352 | 13.8% |
| Mobile Home / Other | 319 | 1.9% |
| Total | 17,020 | 100.0% |
Housing Structures by Occupancy in Florence
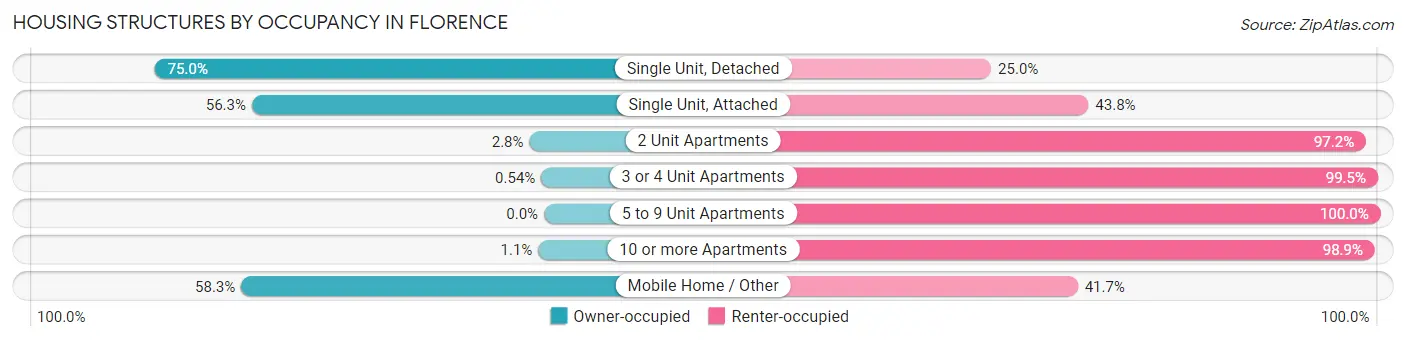
| Structure Type | Owner-occupied | Renter-occupied |
| Single Unit, Detached | 8,143 (75.0%) | 2,718 (25.0%) |
| Single Unit, Attached | 108 (56.2%) | 84 (43.8%) |
| 2 Unit Apartments | 19 (2.8%) | 657 (97.2%) |
| 3 or 4 Unit Apartments | 6 (0.5%) | 1,100 (99.5%) |
| 5 to 9 Unit Apartments | 0 (0.0%) | 1,514 (100.0%) |
| 10 or more Apartments | 26 (1.1%) | 2,326 (98.9%) |
| Mobile Home / Other | 186 (58.3%) | 133 (41.7%) |
| Total | 8,488 (49.9%) | 8,532 (50.1%) |
Housing Structures by Number of Rooms in Florence
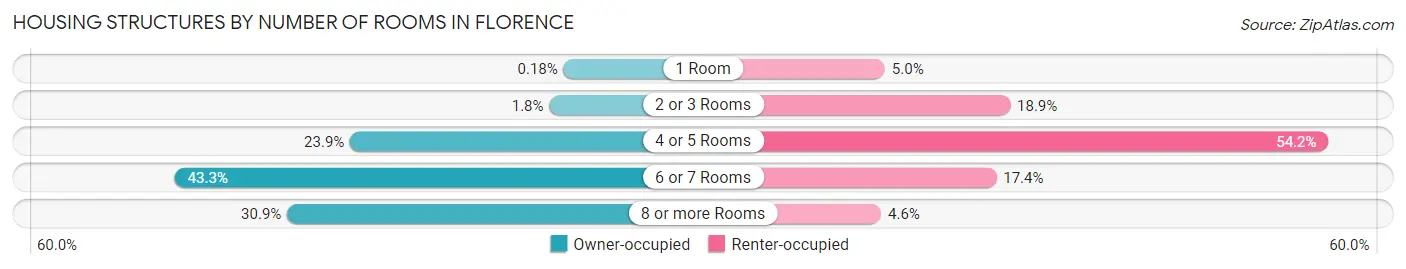
| Number of Rooms | Owner-occupied | Renter-occupied |
| 1 Room | 15 (0.2%) | 426 (5.0%) |
| 2 or 3 Rooms | 149 (1.8%) | 1,612 (18.9%) |
| 4 or 5 Rooms | 2,026 (23.9%) | 4,624 (54.2%) |
| 6 or 7 Rooms | 3,679 (43.3%) | 1,480 (17.3%) |
| 8 or more Rooms | 2,619 (30.9%) | 390 (4.6%) |
| Total | 8,488 (100.0%) | 8,532 (100.0%) |
Housing Structure by Heating Type in Florence
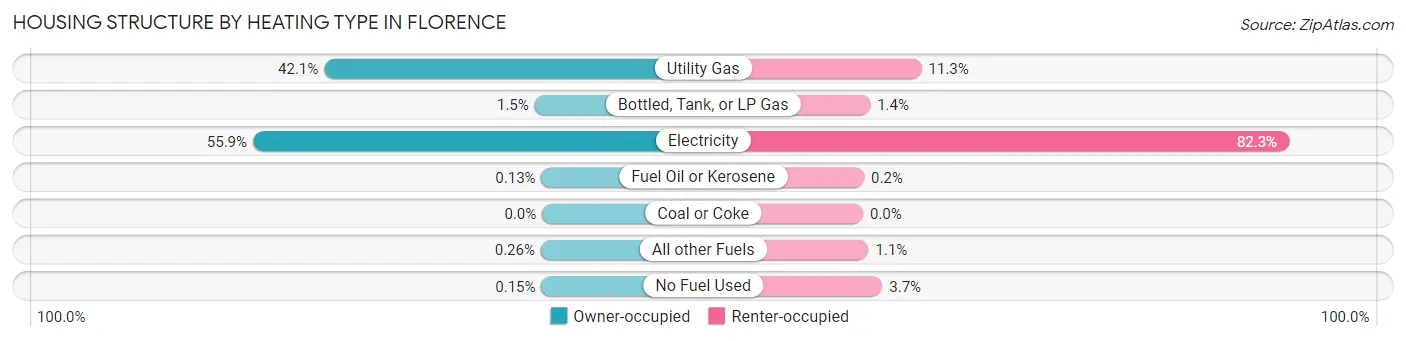
| Heating Type | Owner-occupied | Renter-occupied |
| Utility Gas | 3,575 (42.1%) | 966 (11.3%) |
| Bottled, Tank, or LP Gas | 123 (1.5%) | 119 (1.4%) |
| Electricity | 4,744 (55.9%) | 7,021 (82.3%) |
| Fuel Oil or Kerosene | 11 (0.1%) | 17 (0.2%) |
| Coal or Coke | 0 (0.0%) | 0 (0.0%) |
| All other Fuels | 22 (0.3%) | 91 (1.1%) |
| No Fuel Used | 13 (0.2%) | 318 (3.7%) |
| Total | 8,488 (100.0%) | 8,532 (100.0%) |
Household Vehicle Usage in Florence
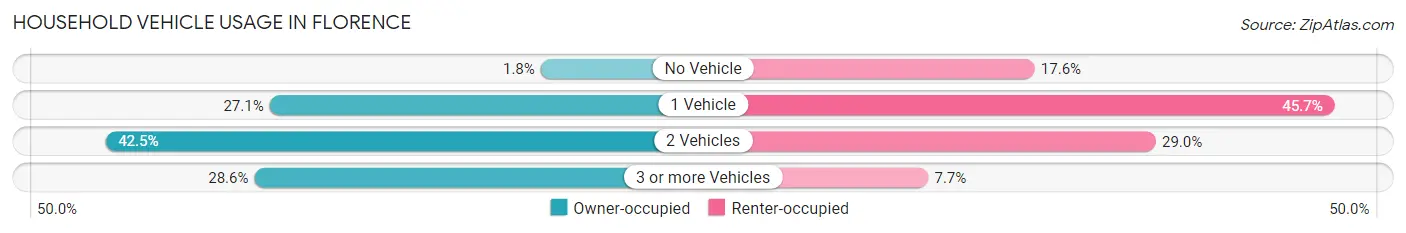
| Vehicles per Household | Owner-occupied | Renter-occupied |
| No Vehicle | 155 (1.8%) | 1,505 (17.6%) |
| 1 Vehicle | 2,304 (27.1%) | 3,899 (45.7%) |
| 2 Vehicles | 3,605 (42.5%) | 2,470 (28.9%) |
| 3 or more Vehicles | 2,424 (28.6%) | 658 (7.7%) |
| Total | 8,488 (100.0%) | 8,532 (100.0%) |
Real Estate & Mortgages in Florence
Real Estate and Mortgage Overview in Florence
| Characteristic | Without Mortgage | With Mortgage |
| Housing Units | 4,122 | 4,366 |
| Median Property Value | $154,700 | $179,700 |
| Median Household Income | $61,465 | $699 |
| Monthly Housing Costs | $463 | $109 |
| Real Estate Taxes | $724 | $765 |
Property Value by Mortgage Status in Florence
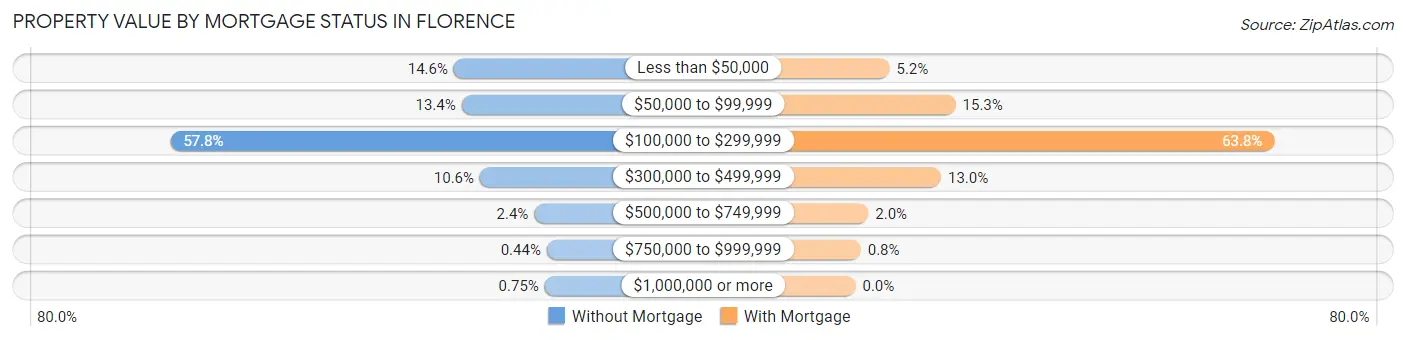
| Property Value | Without Mortgage | With Mortgage |
| Less than $50,000 | 602 (14.6%) | 226 (5.2%) |
| $50,000 to $99,999 | 553 (13.4%) | 666 (15.2%) |
| $100,000 to $299,999 | 2,383 (57.8%) | 2,785 (63.8%) |
| $300,000 to $499,999 | 438 (10.6%) | 569 (13.0%) |
| $500,000 to $749,999 | 97 (2.4%) | 85 (1.9%) |
| $750,000 to $999,999 | 18 (0.4%) | 35 (0.8%) |
| $1,000,000 or more | 31 (0.7%) | 0 (0.0%) |
| Total | 4,122 (100.0%) | 4,366 (100.0%) |
Household Income by Mortgage Status in Florence
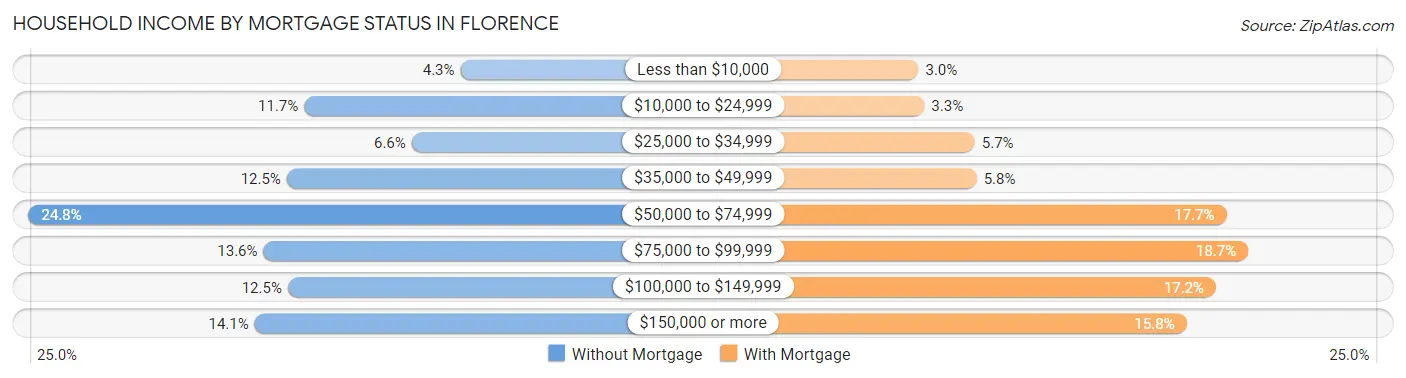
| Household Income | Without Mortgage | With Mortgage |
| Less than $10,000 | 175 (4.3%) | 131 (3.0%) |
| $10,000 to $24,999 | 482 (11.7%) | 143 (3.3%) |
| $25,000 to $34,999 | 271 (6.6%) | 248 (5.7%) |
| $35,000 to $49,999 | 516 (12.5%) | 252 (5.8%) |
| $50,000 to $74,999 | 1,023 (24.8%) | 771 (17.7%) |
| $75,000 to $99,999 | 562 (13.6%) | 816 (18.7%) |
| $100,000 to $149,999 | 514 (12.5%) | 749 (17.2%) |
| $150,000 or more | 579 (14.1%) | 688 (15.8%) |
| Total | 4,122 (100.0%) | 4,366 (100.0%) |
Property Value to Household Income Ratio in Florence
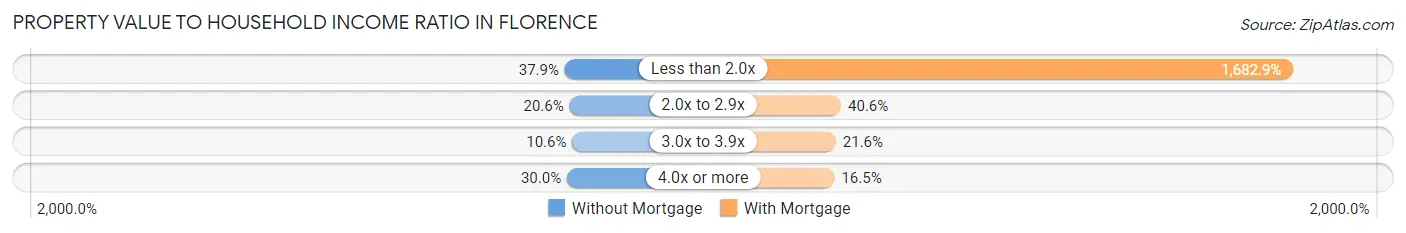
| Value-to-Income Ratio | Without Mortgage | With Mortgage |
| Less than 2.0x | 1,563 (37.9%) | 73,474 (1,682.9%) |
| 2.0x to 2.9x | 847 (20.5%) | 1,774 (40.6%) |
| 3.0x to 3.9x | 437 (10.6%) | 944 (21.6%) |
| 4.0x or more | 1,235 (30.0%) | 722 (16.5%) |
| Total | 4,122 (100.0%) | 4,366 (100.0%) |
Real Estate Taxes by Mortgage Status in Florence
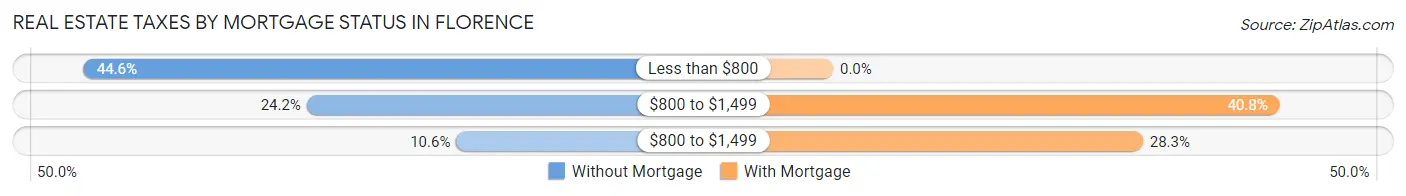
| Property Taxes | Without Mortgage | With Mortgage |
| Less than $800 | 1,838 (44.6%) | 0 (0.0%) |
| $800 to $1,499 | 999 (24.2%) | 1,781 (40.8%) |
| $800 to $1,499 | 436 (10.6%) | 1,235 (28.3%) |
| Total | 4,122 (100.0%) | 4,366 (100.0%) |
Health & Disability in Florence
Health Insurance Coverage by Age in Florence
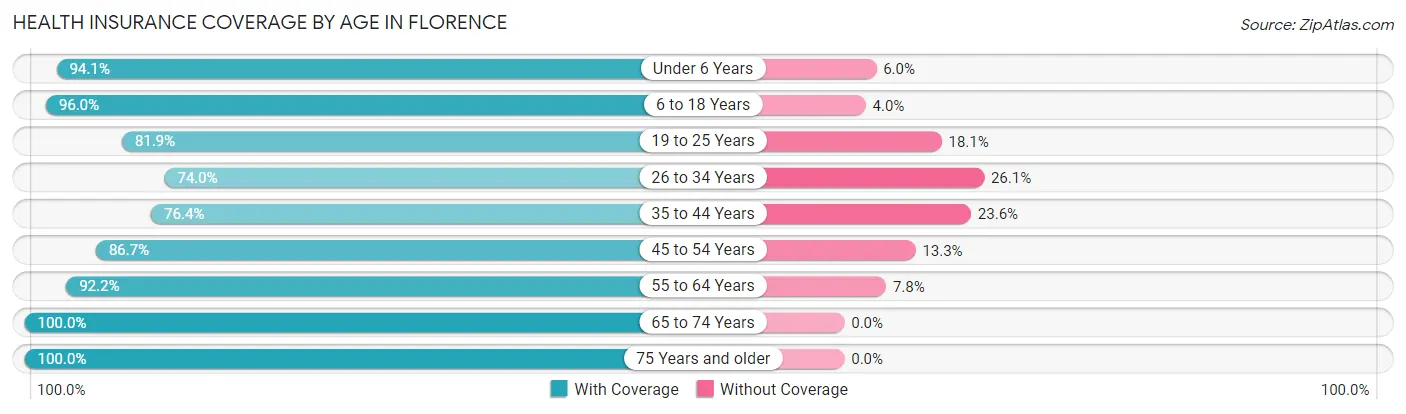
| Age Bracket | With Coverage | Without Coverage |
| Under 6 Years | 2,527 (94.1%) | 160 (5.9%) |
| 6 to 18 Years | 5,512 (96.0%) | 228 (4.0%) |
| 19 to 25 Years | 5,674 (81.9%) | 1,257 (18.1%) |
| 26 to 34 Years | 3,630 (74.0%) | 1,279 (26.1%) |
| 35 to 44 Years | 3,543 (76.4%) | 1,095 (23.6%) |
| 45 to 54 Years | 3,118 (86.7%) | 477 (13.3%) |
| 55 to 64 Years | 4,140 (92.2%) | 349 (7.8%) |
| 65 to 74 Years | 4,063 (100.0%) | 0 (0.0%) |
| 75 Years and older | 2,881 (100.0%) | 0 (0.0%) |
| Total | 35,088 (87.9%) | 4,845 (12.1%) |
Health Insurance Coverage by Citizenship Status in Florence
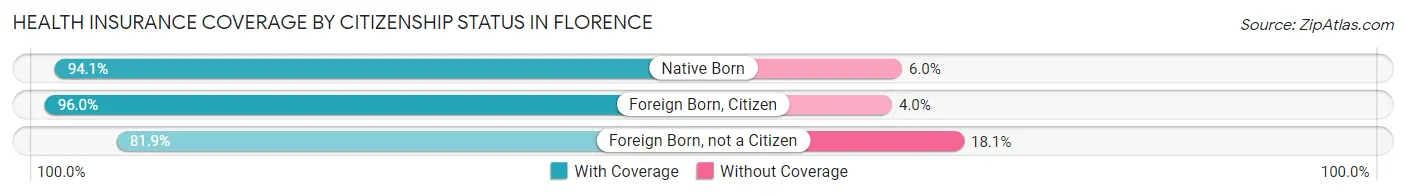
| Citizenship Status | With Coverage | Without Coverage |
| Native Born | 2,527 (94.1%) | 160 (5.9%) |
| Foreign Born, Citizen | 5,512 (96.0%) | 228 (4.0%) |
| Foreign Born, not a Citizen | 5,674 (81.9%) | 1,257 (18.1%) |
Health Insurance Coverage by Household Income in Florence
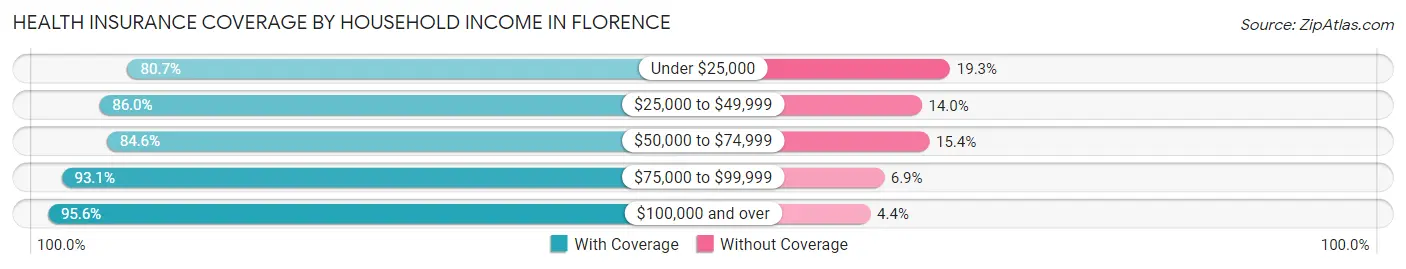
| Household Income | With Coverage | Without Coverage |
| Under $25,000 | 7,016 (80.7%) | 1,679 (19.3%) |
| $25,000 to $49,999 | 7,399 (86.0%) | 1,204 (14.0%) |
| $50,000 to $74,999 | 5,621 (84.6%) | 1,024 (15.4%) |
| $75,000 to $99,999 | 5,318 (93.1%) | 396 (6.9%) |
| $100,000 and over | 8,356 (95.6%) | 383 (4.4%) |
Public vs Private Health Insurance Coverage by Age in Florence
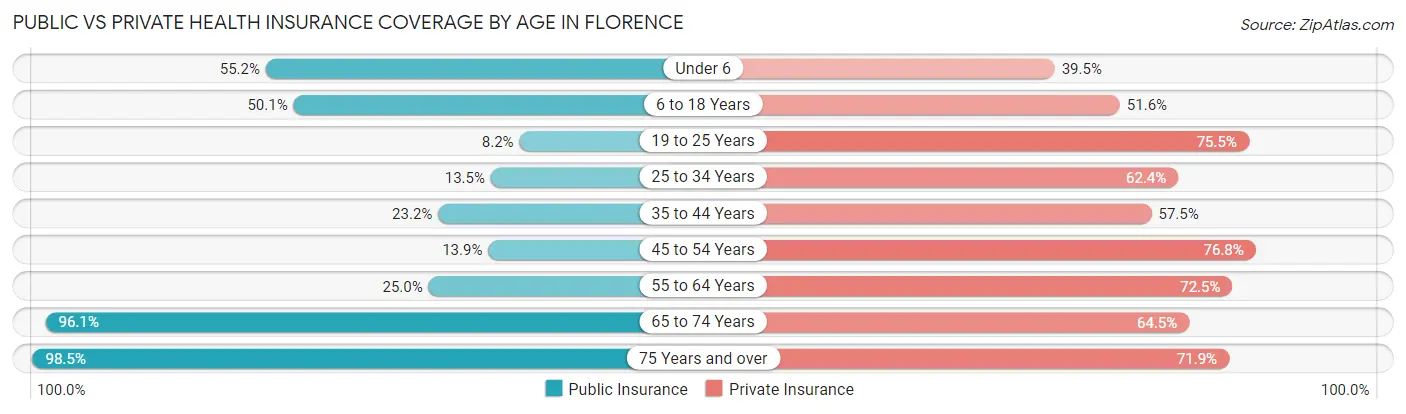
| Age Bracket | Public Insurance | Private Insurance |
| Under 6 | 1,484 (55.2%) | 1,062 (39.5%) |
| 6 to 18 Years | 2,875 (50.1%) | 2,963 (51.6%) |
| 19 to 25 Years | 565 (8.2%) | 5,235 (75.5%) |
| 25 to 34 Years | 661 (13.5%) | 3,064 (62.4%) |
| 35 to 44 Years | 1,078 (23.2%) | 2,667 (57.5%) |
| 45 to 54 Years | 501 (13.9%) | 2,761 (76.8%) |
| 55 to 64 Years | 1,123 (25.0%) | 3,253 (72.5%) |
| 65 to 74 Years | 3,905 (96.1%) | 2,619 (64.5%) |
| 75 Years and over | 2,838 (98.5%) | 2,070 (71.9%) |
| Total | 15,030 (37.6%) | 25,694 (64.3%) |
Disability Status by Sex by Age in Florence
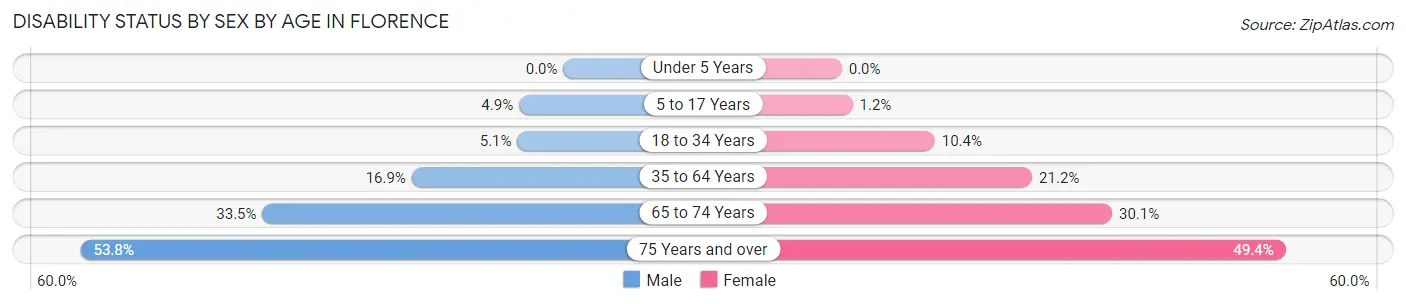
| Age Bracket | Male | Female |
| Under 5 Years | 0 (0.0%) | 0 (0.0%) |
| 5 to 17 Years | 148 (4.9%) | 32 (1.2%) |
| 18 to 34 Years | 288 (5.1%) | 708 (10.4%) |
| 35 to 64 Years | 955 (16.9%) | 1,498 (21.2%) |
| 65 to 74 Years | 646 (33.5%) | 643 (30.1%) |
| 75 Years and over | 535 (53.8%) | 932 (49.4%) |
Disability Class by Sex by Age in Florence
Disability Class: Hearing Difficulty
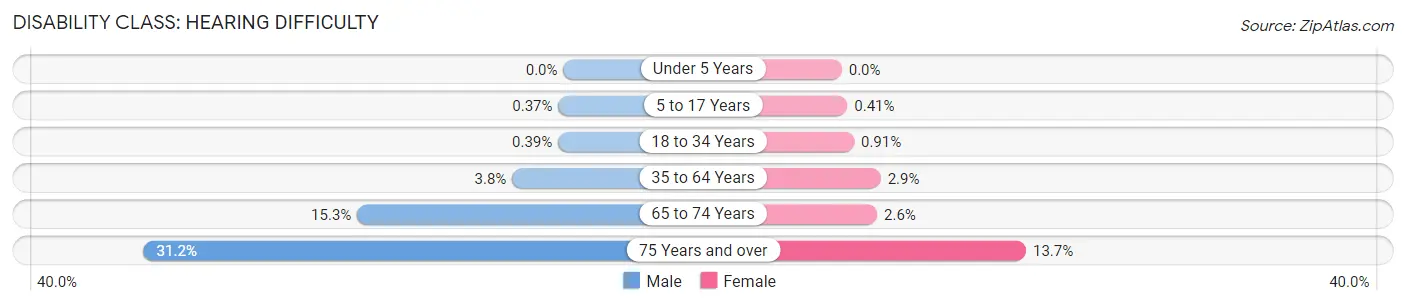
| Age Bracket | Male | Female |
| Under 5 Years | 0 (0.0%) | 0 (0.0%) |
| 5 to 17 Years | 11 (0.4%) | 11 (0.4%) |
| 18 to 34 Years | 22 (0.4%) | 62 (0.9%) |
| 35 to 64 Years | 215 (3.8%) | 204 (2.9%) |
| 65 to 74 Years | 295 (15.3%) | 56 (2.6%) |
| 75 Years and over | 310 (31.2%) | 258 (13.7%) |
Disability Class: Vision Difficulty
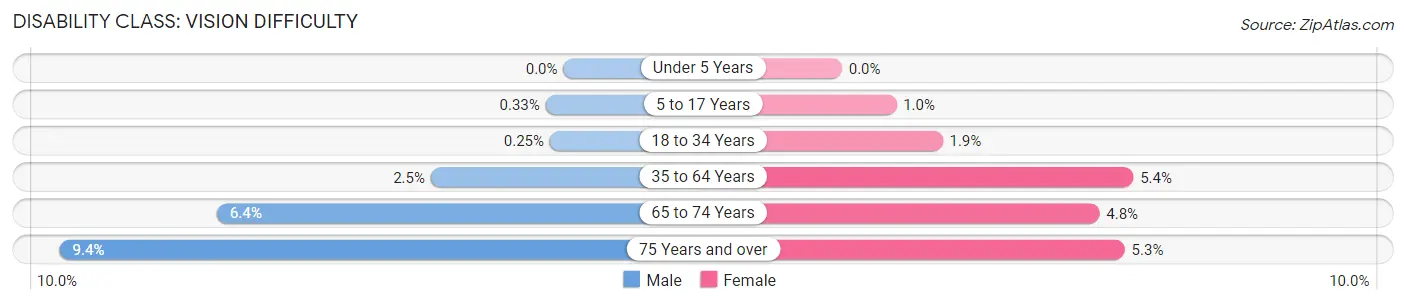
| Age Bracket | Male | Female |
| Under 5 Years | 0 (0.0%) | 0 (0.0%) |
| 5 to 17 Years | 10 (0.3%) | 27 (1.0%) |
| 18 to 34 Years | 14 (0.3%) | 128 (1.9%) |
| 35 to 64 Years | 139 (2.5%) | 382 (5.4%) |
| 65 to 74 Years | 124 (6.4%) | 102 (4.8%) |
| 75 Years and over | 93 (9.3%) | 99 (5.2%) |
Disability Class: Cognitive Difficulty
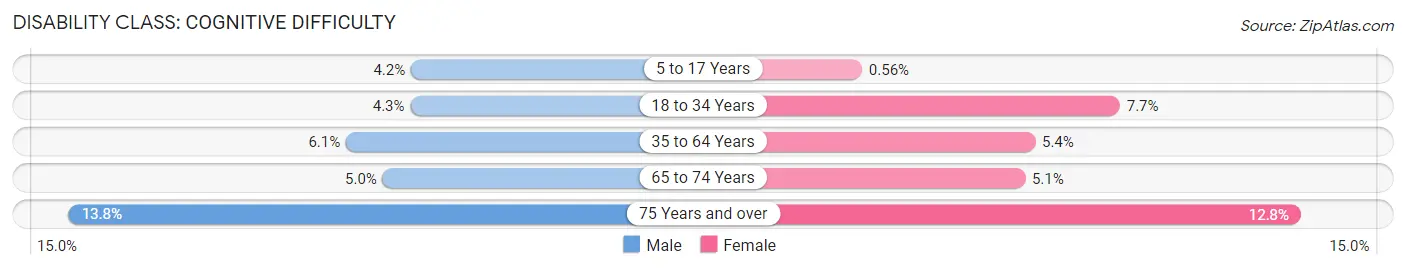
| Age Bracket | Male | Female |
| 5 to 17 Years | 127 (4.2%) | 15 (0.6%) |
| 18 to 34 Years | 240 (4.3%) | 529 (7.7%) |
| 35 to 64 Years | 342 (6.0%) | 380 (5.4%) |
| 65 to 74 Years | 97 (5.0%) | 109 (5.1%) |
| 75 Years and over | 137 (13.8%) | 241 (12.8%) |
Disability Class: Ambulatory Difficulty
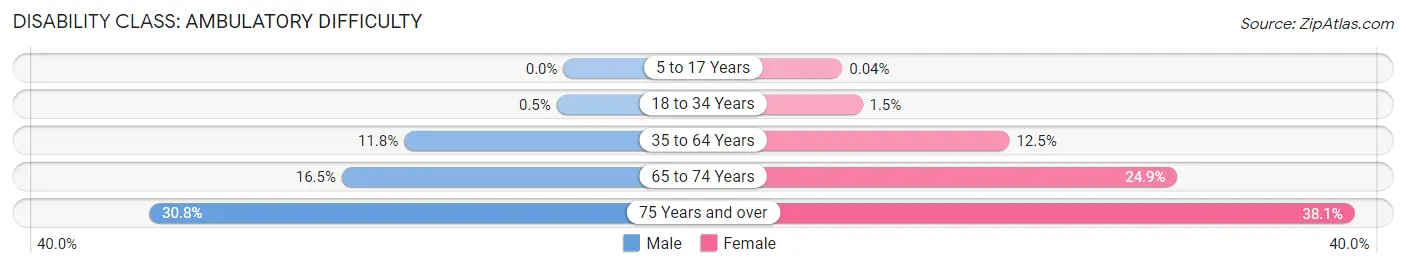
| Age Bracket | Male | Female |
| 5 to 17 Years | 0 (0.0%) | 1 (0.0%) |
| 18 to 34 Years | 28 (0.5%) | 105 (1.5%) |
| 35 to 64 Years | 669 (11.8%) | 880 (12.4%) |
| 65 to 74 Years | 317 (16.5%) | 532 (24.9%) |
| 75 Years and over | 306 (30.7%) | 718 (38.1%) |
Disability Class: Self-Care Difficulty
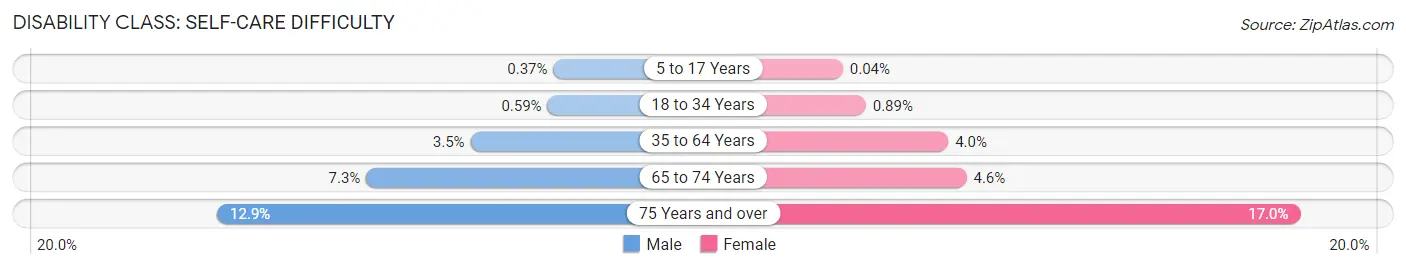
| Age Bracket | Male | Female |
| 5 to 17 Years | 11 (0.4%) | 1 (0.0%) |
| 18 to 34 Years | 33 (0.6%) | 61 (0.9%) |
| 35 to 64 Years | 195 (3.5%) | 279 (4.0%) |
| 65 to 74 Years | 141 (7.3%) | 99 (4.6%) |
| 75 Years and over | 128 (12.9%) | 321 (17.0%) |
Technology Access in Florence
Computing Device Access in Florence
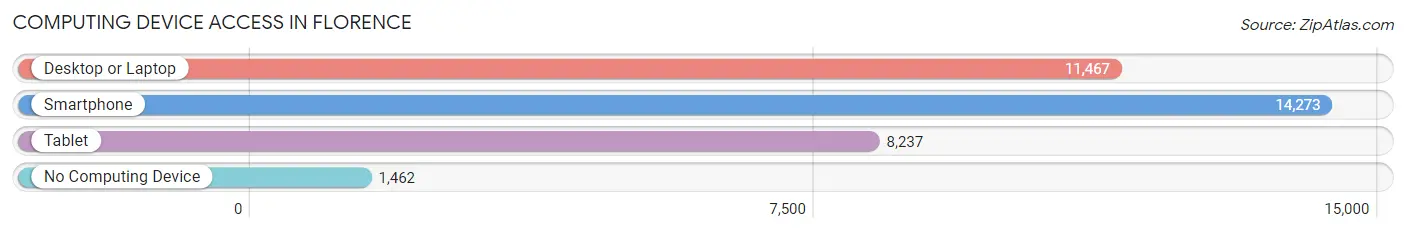
| Device Type | # Households | % Households |
| Desktop or Laptop | 11,467 | 67.4% |
| Smartphone | 14,273 | 83.9% |
| Tablet | 8,237 | 48.4% |
| No Computing Device | 1,462 | 8.6% |
| Total | 17,020 | 100.0% |
Internet Access in Florence
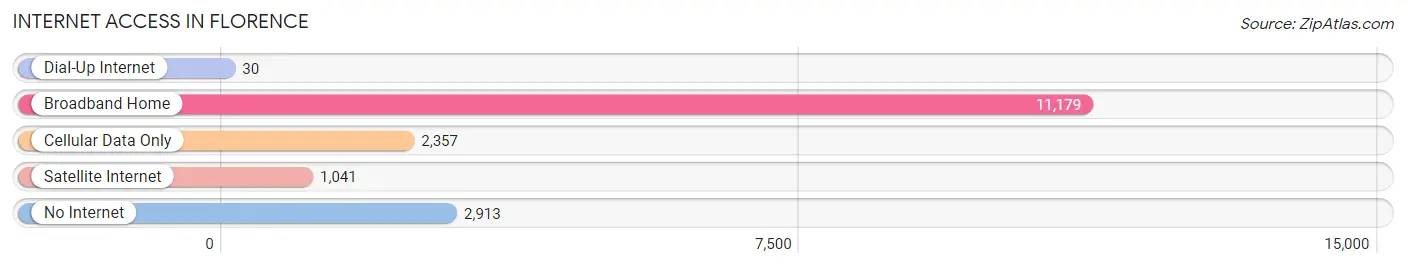
| Internet Type | # Households | % Households |
| Dial-Up Internet | 30 | 0.2% |
| Broadband Home | 11,179 | 65.7% |
| Cellular Data Only | 2,357 | 13.9% |
| Satellite Internet | 1,041 | 6.1% |
| No Internet | 2,913 | 17.1% |
| Total | 17,020 | 100.0% |
Florence Summary
Florence, Alabama is a city located in the northwestern corner of the state, in Lauderdale County. It is the county seat and the largest city in the county. The city is situated along the Tennessee River and is part of the Florence-Muscle Shoals Metropolitan Statistical Area. As of the 2010 census, the population of Florence was 39,319.
History
Florence was founded in 1818 by John Coffee, a veteran of the War of 1812. He named the city after his daughter, Florence. The city was incorporated in 1826 and became the county seat of Lauderdale County in 1837.
Florence was an important center for the cotton industry in the 19th century. The city was also a major railroad hub, with several lines running through it. During the Civil War, Florence was a major supply center for the Confederate Army.
In the early 20th century, Florence was a major center for the steel industry. The city was also home to several large manufacturing plants, including the Florence Iron Works and the Florence Steel Mill.
Geography
Florence is located in the northwestern corner of Alabama, in Lauderdale County. The city is situated along the Tennessee River, about 25 miles east of the Mississippi River. The city has a total area of 28.2 square miles, of which 27.9 square miles is land and 0.3 square miles is water.
The city is located in the foothills of the Appalachian Mountains and is part of the Tennessee Valley. The climate is humid subtropical, with hot, humid summers and mild winters.
Economy
Florence is a major center for manufacturing and industry. The city is home to several large manufacturing plants, including the Florence Iron Works and the Florence Steel Mill. The city is also home to several large retail stores, including Walmart, Target, and Lowe's.
The city is also home to several large healthcare facilities, including Eliza Coffee Memorial Hospital and the Shoals Hospital. The city is also home to several colleges and universities, including the University of North Alabama and the University of Alabama in Huntsville.
Demographics
As of the 2010 census, the population of Florence was 39,319. The racial makeup of the city was 73.3% White, 22.2% African American, 0.4% Native American, 1.2% Asian, 0.1% Pacific Islander, 1.3% from other races, and 1.5% from two or more races. Hispanic or Latino of any race were 3.2% of the population.
The median income for a household in Florence was $35,945, and the median income for a family was $45,945. The per capita income for the city was $20,945. About 16.2% of families and 20.3% of the population were below the poverty line, including 28.2% of those under age 18 and 11.2% of those age 65 or over.
Common Questions
What is Per Capita Income in Florence?
Per Capita income in Florence is $28,399.
What is the Median Family Income in Florence?
Median Family Income in Florence is $62,953.
What is the Median Household income in Florence?
Median Household Income in Florence is $47,048.
What is Income or Wage Gap in Florence?
Income or Wage Gap in Florence is 32.0%.
Women in Florence earn 68.0 cents for every dollar earned by a man.
What is Family Income Deficit in Florence?
Family Income Deficit in Florence is $11,055.
Families that are below poverty line in Florence earn $11,055 less on average than the poverty threshold level.
What is Inequality or Gini Index in Florence?
Inequality or Gini Index in Florence is 0.49.
What is the Total Population of Florence?
Total Population of Florence is 40,781.
What is the Total Male Population of Florence?
Total Male Population of Florence is 18,585.
What is the Total Female Population of Florence?
Total Female Population of Florence is 22,196.
What is the Ratio of Males per 100 Females in Florence?
There are 83.73 Males per 100 Females in Florence.
What is the Ratio of Females per 100 Males in Florence?
There are 119.43 Females per 100 Males in Florence.
What is the Median Population Age in Florence?
Median Population Age in Florence is 34.9 Years.
What is the Average Family Size in Florence
Average Family Size in Florence is 3.0 People.
What is the Average Household Size in Florence
Average Household Size in Florence is 2.3 People.
How Large is the Labor Force in Florence?
There are 18,883 People in the Labor Forcein in Florence.
What is the Percentage of People in the Labor Force in Florence?
56.1% of People are in the Labor Force in Florence.
What is the Unemployment Rate in Florence?
Unemployment Rate in Florence is 5.7%.