Evergreen, AL Map & Demographics
Evergreen Map
Evergreen Overview
$19,455
PER CAPITA INCOME
$45,417
AVG FAMILY INCOME
$37,679
AVG HOUSEHOLD INCOME
0.48
INEQUALITY / GINI INDEX
3,497
TOTAL POPULATION
1,545
MALE POPULATION
1,952
FEMALE POPULATION
79.15
MALES / 100 FEMALES
126.34
FEMALES / 100 MALES
36.0
MEDIAN AGE
4.0
AVG FAMILY SIZE
2.6
AVG HOUSEHOLD SIZE
1,053
LABOR FORCE [ PEOPLE ]
36.5%
PERCENT IN LABOR FORCE
6.6%
UNEMPLOYMENT RATE
Evergreen Zip Codes
Evergreen Area Codes
Income in Evergreen
Income Overview in Evergreen
Per Capita Income in Evergreen is $19,455, while median incomes of families and households are $45,417 and $37,679 respectively.
| Characteristic | Number | Measure |
| Per Capita Income | 3,497 | $19,455 |
| Median Family Income | 676 | $45,417 |
| Mean Family Income | 676 | $65,204 |
| Median Household Income | 1,304 | $37,679 |
| Mean Household Income | 1,304 | $47,228 |
| Income Deficit | 676 | $0 |
| Wage / Income Gap (%) | 3,497 | 0.00% |
| Wage / Income Gap ($) | 3,497 | 100.00¢ per $1 |
| Gini / Inequality Index | 3,497 | 0.48 |
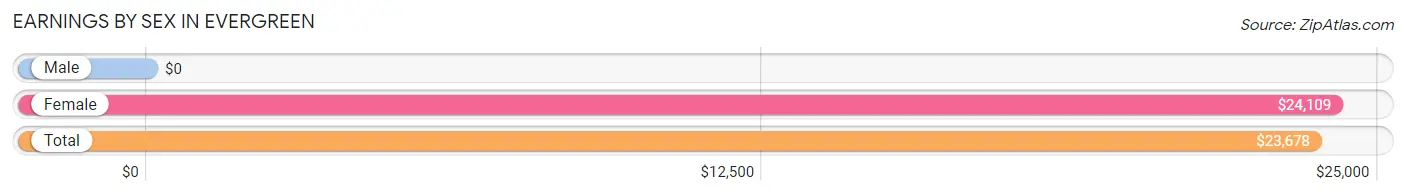
Earnings by Sex in Evergreen
| Sex | Number | Average Earnings |
| Male | 406 (37.8%) | $0 |
| Female | 668 (62.2%) | $24,109 |
| Total | 1,074 (100.0%) | $23,678 |
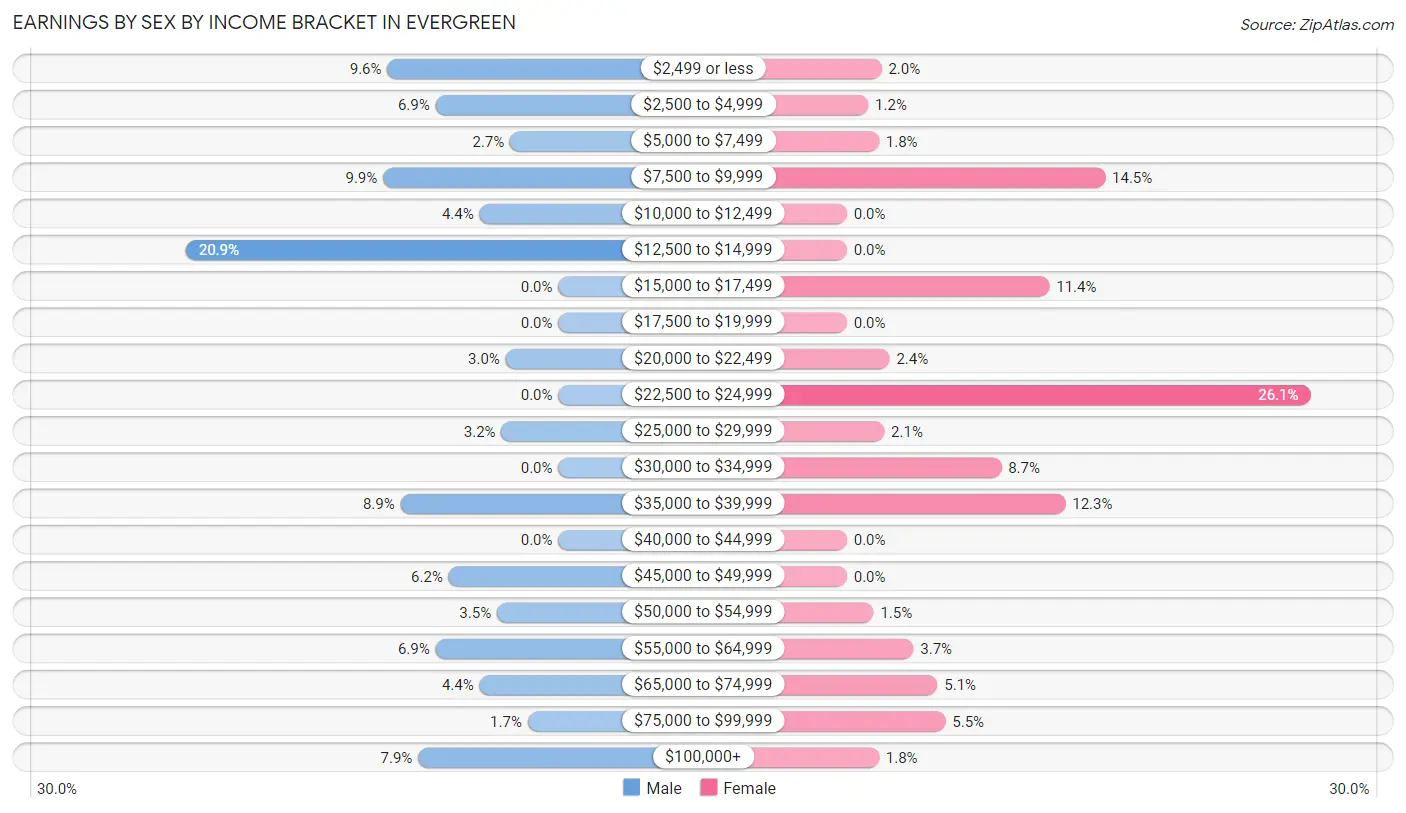
Earnings by Sex by Income Bracket in Evergreen
The most common earnings brackets in Evergreen are $12,500 to $14,999 for men (85 | 20.9%) and $22,500 to $24,999 for women (174 | 26.1%).
| Income | Male | Female |
| $2,499 or less | 39 (9.6%) | 13 (1.9%) |
| $2,500 to $4,999 | 28 (6.9%) | 8 (1.2%) |
| $5,000 to $7,499 | 11 (2.7%) | 12 (1.8%) |
| $7,500 to $9,999 | 40 (9.9%) | 97 (14.5%) |
| $10,000 to $12,499 | 18 (4.4%) | 0 (0.0%) |
| $12,500 to $14,999 | 85 (20.9%) | 0 (0.0%) |
| $15,000 to $17,499 | 0 (0.0%) | 76 (11.4%) |
| $17,500 to $19,999 | 0 (0.0%) | 0 (0.0%) |
| $20,000 to $22,499 | 12 (3.0%) | 16 (2.4%) |
| $22,500 to $24,999 | 0 (0.0%) | 174 (26.1%) |
| $25,000 to $29,999 | 13 (3.2%) | 14 (2.1%) |
| $30,000 to $34,999 | 0 (0.0%) | 58 (8.7%) |
| $35,000 to $39,999 | 36 (8.9%) | 82 (12.3%) |
| $40,000 to $44,999 | 0 (0.0%) | 0 (0.0%) |
| $45,000 to $49,999 | 25 (6.2%) | 0 (0.0%) |
| $50,000 to $54,999 | 14 (3.5%) | 10 (1.5%) |
| $55,000 to $64,999 | 28 (6.9%) | 25 (3.7%) |
| $65,000 to $74,999 | 18 (4.4%) | 34 (5.1%) |
| $75,000 to $99,999 | 7 (1.7%) | 37 (5.5%) |
| $100,000+ | 32 (7.9%) | 12 (1.8%) |
| Total | 406 (100.0%) | 668 (100.0%) |
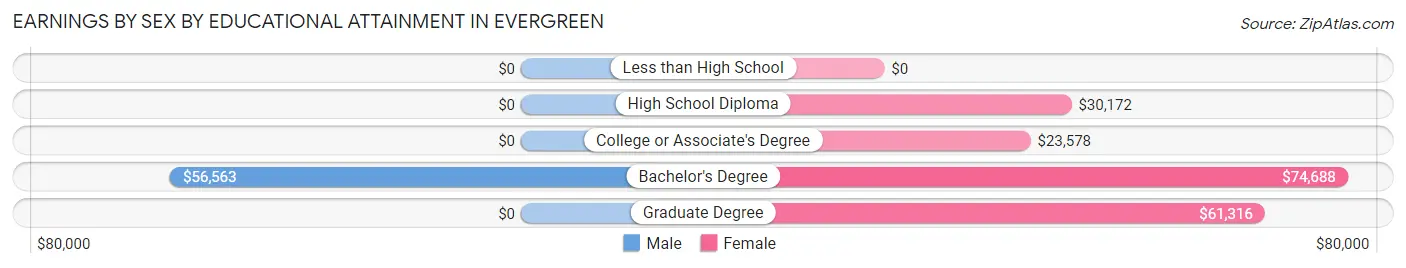
Earnings by Sex by Educational Attainment in Evergreen
| Educational Attainment | Male Income | Female Income |
| Less than High School | - | - |
| High School Diploma | - | - |
| College or Associate's Degree | - | - |
| Bachelor's Degree | $56,563 | $74,688 |
| Graduate Degree | - | - |
| Total | - | - |
Family Income in Evergreen
Family Income Brackets in Evergreen
According to the Evergreen family income data, there are 186 families falling into the $35,000 to $49,999 income range, which is the most common income bracket and makes up 27.5% of all families.
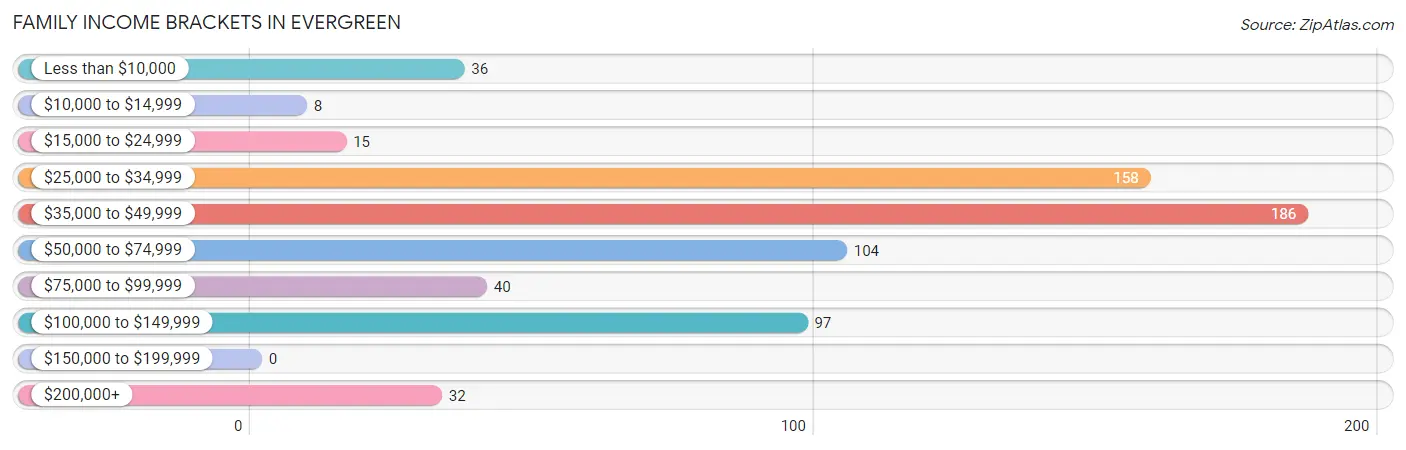
| Income Bracket | # Families | % Families |
| Less than $10,000 | 36 | 5.3% |
| $10,000 to $14,999 | 8 | 1.2% |
| $15,000 to $24,999 | 15 | 2.2% |
| $25,000 to $34,999 | 158 | 23.4% |
| $35,000 to $49,999 | 186 | 27.5% |
| $50,000 to $74,999 | 104 | 15.4% |
| $75,000 to $99,999 | 40 | 5.9% |
| $100,000 to $149,999 | 97 | 14.3% |
| $150,000 to $199,999 | 0 | 0.0% |
| $200,000+ | 32 | 4.7% |
Family Income by Famaliy Size in Evergreen
2-person families (392 | 58.0%) account for the highest median family income in Evergreen with $54,297 per family, while 2-person families (392 | 58.0%) have the highest median income of $27,148 per family member.
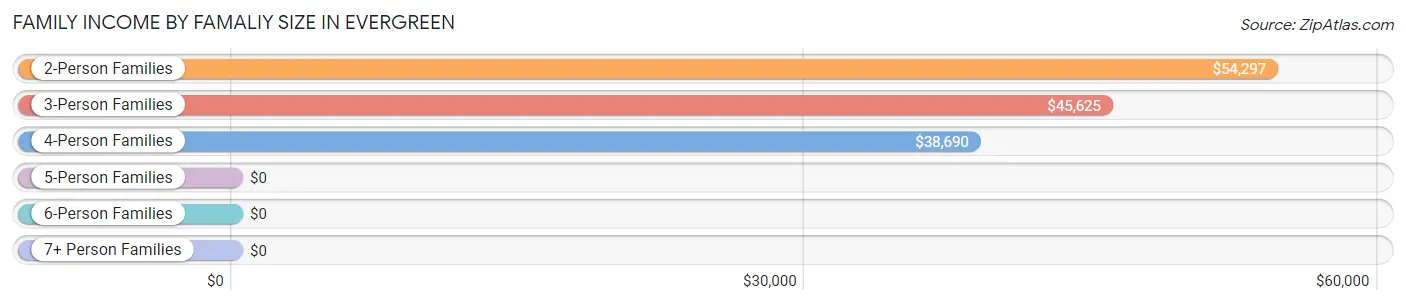
| Income Bracket | # Families | Median Income |
| 2-Person Families | 392 (58.0%) | $54,297 |
| 3-Person Families | 201 (29.7%) | $45,625 |
| 4-Person Families | 77 (11.4%) | $38,690 |
| 5-Person Families | 6 (0.9%) | $0 |
| 6-Person Families | 0 (0.0%) | $0 |
| 7+ Person Families | 0 (0.0%) | $0 |
| Total | 676 (100.0%) | $45,417 |
Family Income by Number of Earners in Evergreen
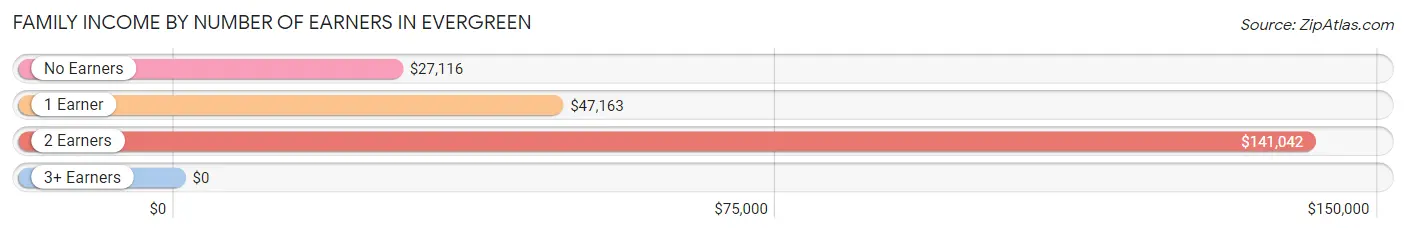
| Number of Earners | # Families | Median Income |
| No Earners | 245 (36.2%) | $27,116 |
| 1 Earner | 357 (52.8%) | $47,163 |
| 2 Earners | 43 (6.4%) | $141,042 |
| 3+ Earners | 31 (4.6%) | $0 |
| Total | 676 (100.0%) | $45,417 |
Household Income in Evergreen
Household Income Brackets in Evergreen
With 303 households falling in the category, the $35,000 to $49,999 income range is the most frequent in Evergreen, accounting for 23.2% of all households.
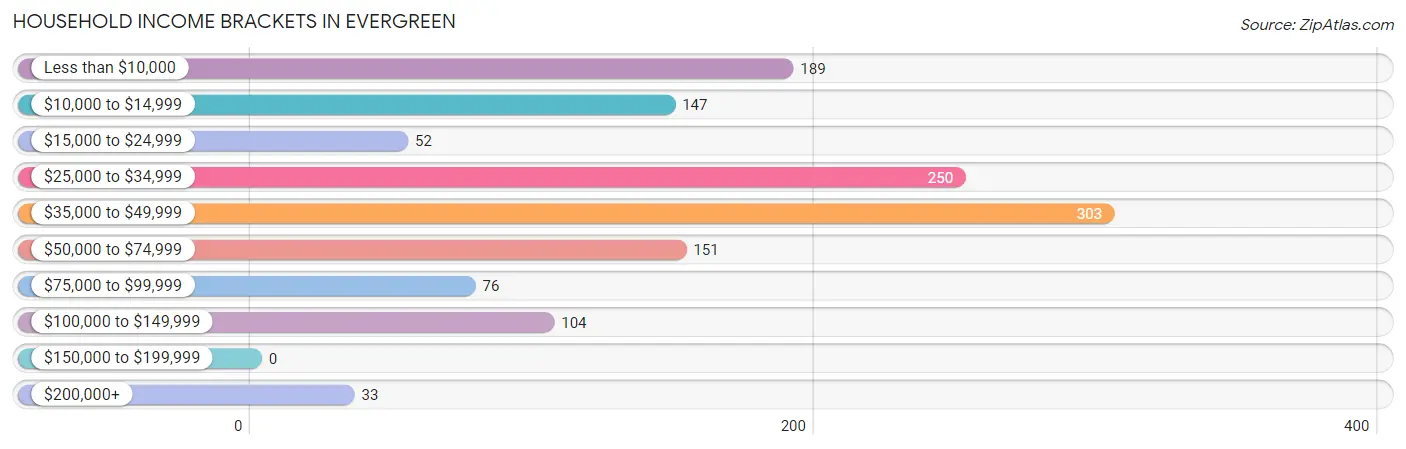
| Income Bracket | # Households | % Households |
| Less than $10,000 | 189 | 14.5% |
| $10,000 to $14,999 | 147 | 11.3% |
| $15,000 to $24,999 | 52 | 4.0% |
| $25,000 to $34,999 | 250 | 19.2% |
| $35,000 to $49,999 | 303 | 23.2% |
| $50,000 to $74,999 | 151 | 11.6% |
| $75,000 to $99,999 | 76 | 5.8% |
| $100,000 to $149,999 | 104 | 8.0% |
| $150,000 to $199,999 | 0 | 0.0% |
| $200,000+ | 33 | 2.5% |
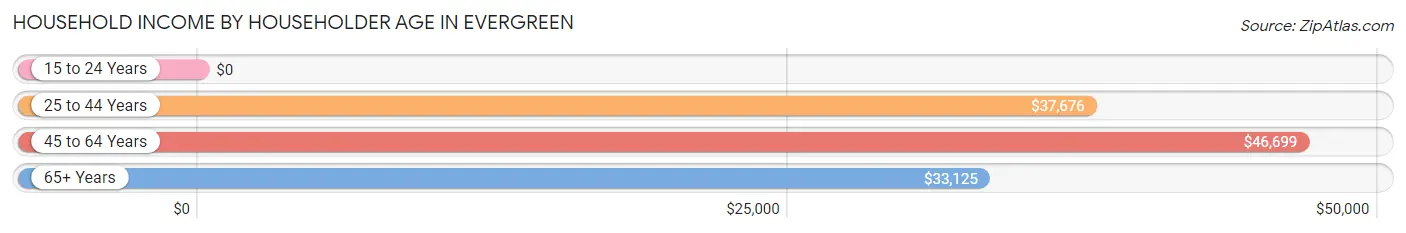
Household Income by Householder Age in Evergreen
The median household income in Evergreen is $37,679, with the highest median household income of $46,699 found in the 45 to 64 years age bracket for the primary householder. A total of 396 households (30.4%) fall into this category. Meanwhile, the 15 to 24 years age bracket for the primary householder has the lowest median household income of $0, with 51 households (3.9%) in this group.
| Income Bracket | # Households | Median Income |
| 15 to 24 Years | 51 (3.9%) | $0 |
| 25 to 44 Years | 425 (32.6%) | $37,676 |
| 45 to 64 Years | 396 (30.4%) | $46,699 |
| 65+ Years | 432 (33.1%) | $33,125 |
| Total | 1,304 (100.0%) | $37,679 |
Poverty in Evergreen
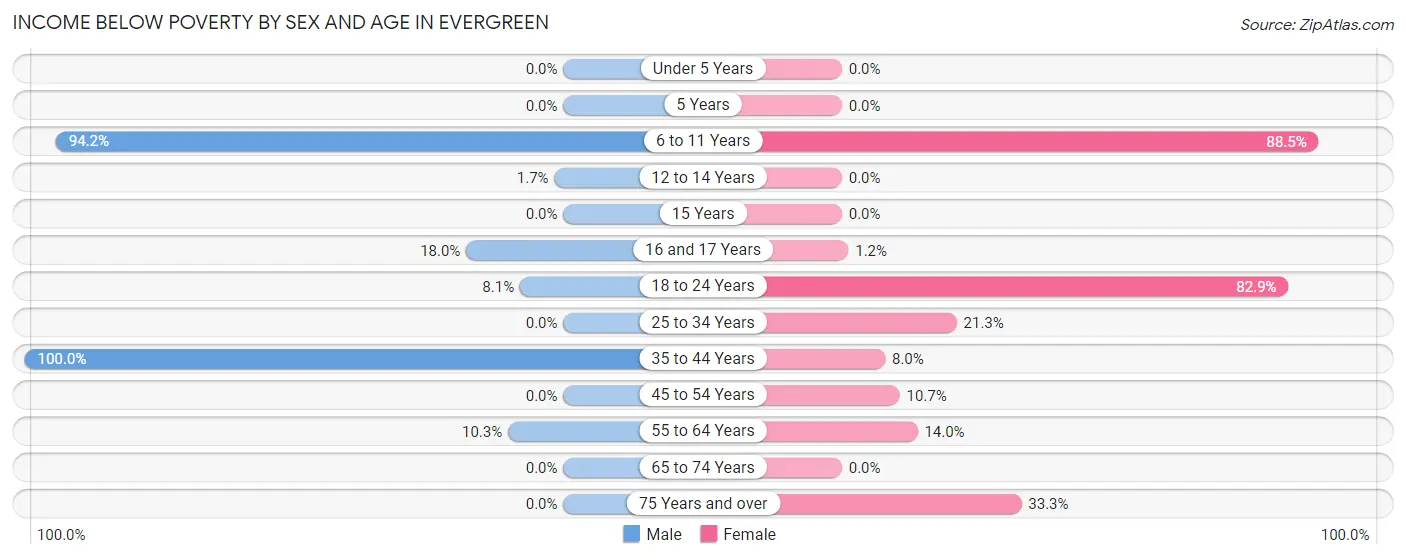
Income Below Poverty by Sex and Age in Evergreen
With 18.2% poverty level for males and 21.1% for females among the residents of Evergreen, 35 to 44 year old males and 6 to 11 year old females are the most vulnerable to poverty, with 54 males (100.0%) and 100 females (88.5%) in their respective age groups living below the poverty level.
| Age Bracket | Male | Female |
| Under 5 Years | 0 (0.0%) | 0 (0.0%) |
| 5 Years | 0 (0.0%) | 0 (0.0%) |
| 6 to 11 Years | 179 (94.2%) | 100 (88.5%) |
| 12 to 14 Years | 2 (1.7%) | 0 (0.0%) |
| 15 Years | 0 (0.0%) | 0 (0.0%) |
| 16 and 17 Years | 11 (18.0%) | 2 (1.2%) |
| 18 to 24 Years | 14 (8.1%) | 63 (82.9%) |
| 25 to 34 Years | 0 (0.0%) | 88 (21.3%) |
| 35 to 44 Years | 54 (100.0%) | 17 (8.0%) |
| 45 to 54 Years | 0 (0.0%) | 22 (10.7%) |
| 55 to 64 Years | 16 (10.3%) | 40 (14.0%) |
| 65 to 74 Years | 0 (0.0%) | 0 (0.0%) |
| 75 Years and over | 0 (0.0%) | 74 (33.3%) |
| Total | 276 (18.2%) | 406 (21.1%) |
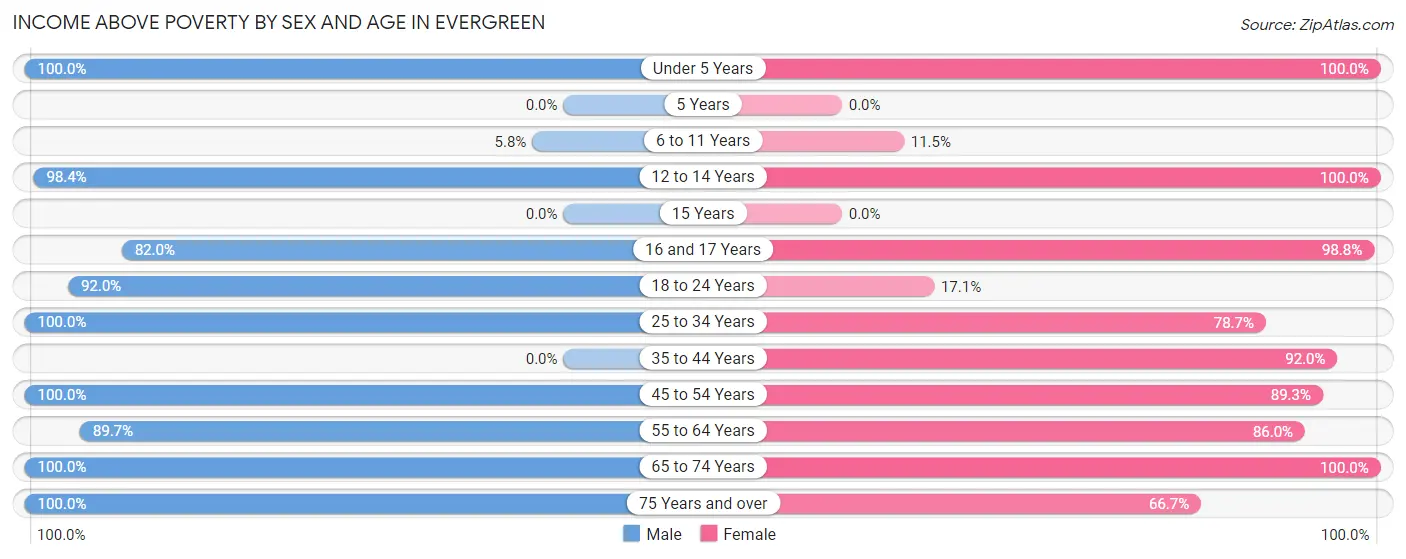
Income Above Poverty by Sex and Age in Evergreen
According to the poverty statistics in Evergreen, males aged under 5 years and females aged under 5 years are the age groups that are most secure financially, with 100.0% of males and 100.0% of females in these age groups living above the poverty line.
| Age Bracket | Male | Female |
| Under 5 Years | 151 (100.0%) | 31 (100.0%) |
| 5 Years | 0 (0.0%) | 0 (0.0%) |
| 6 to 11 Years | 11 (5.8%) | 13 (11.5%) |
| 12 to 14 Years | 119 (98.4%) | 7 (100.0%) |
| 15 Years | 0 (0.0%) | 0 (0.0%) |
| 16 and 17 Years | 50 (82.0%) | 163 (98.8%) |
| 18 to 24 Years | 160 (91.9%) | 13 (17.1%) |
| 25 to 34 Years | 199 (100.0%) | 325 (78.7%) |
| 35 to 44 Years | 0 (0.0%) | 195 (92.0%) |
| 45 to 54 Years | 149 (100.0%) | 183 (89.3%) |
| 55 to 64 Years | 140 (89.7%) | 245 (86.0%) |
| 65 to 74 Years | 171 (100.0%) | 195 (100.0%) |
| 75 Years and over | 89 (100.0%) | 148 (66.7%) |
| Total | 1,239 (81.8%) | 1,518 (78.9%) |
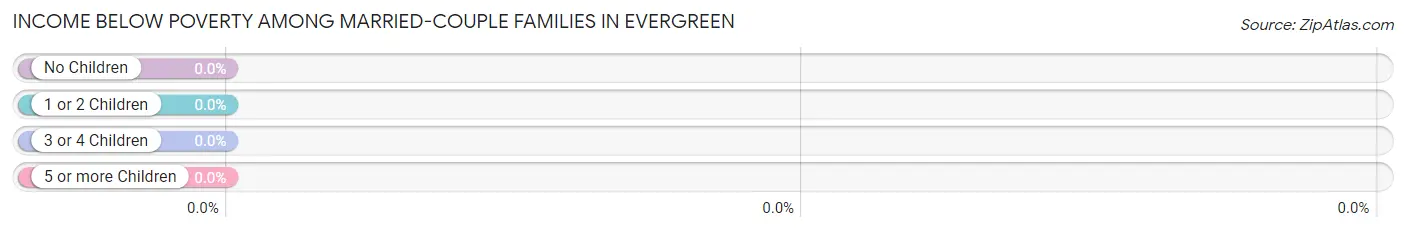
Income Below Poverty Among Married-Couple Families in Evergreen
| Children | Above Poverty | Below Poverty |
| No Children | 234 (100.0%) | 0 (0.0%) |
| 1 or 2 Children | 25 (100.0%) | 0 (0.0%) |
| 3 or 4 Children | 0 (0.0%) | 0 (0.0%) |
| 5 or more Children | 0 (0.0%) | 0 (0.0%) |
| Total | 259 (100.0%) | 0 (0.0%) |
Income Below Poverty Among Single-Parent Households in Evergreen
According to the poverty data in Evergreen, 29.5% or 26 single-father households and 7.6% or 25 single-mother households are living below the poverty line. Among single-father households, those with 1 or 2 children have the highest poverty rate, with 26 households (83.9%) experiencing poverty. Likewise, among single-mother households, those with 1 or 2 children have the highest poverty rate, with 25 households (12.9%) falling below the poverty line.
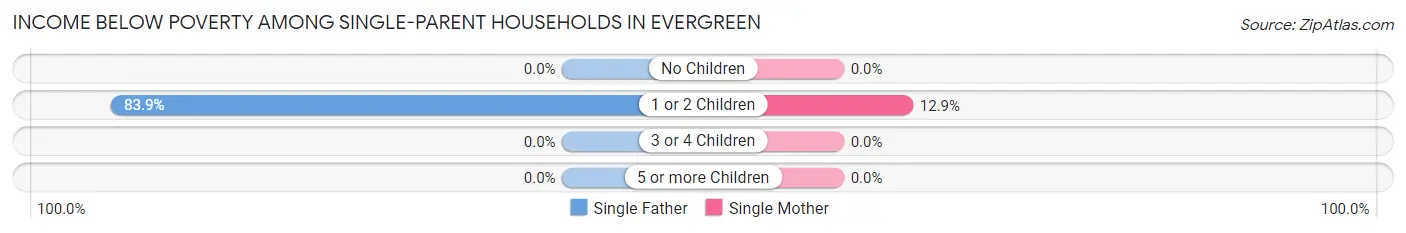
| Children | Single Father | Single Mother |
| No Children | 0 (0.0%) | 0 (0.0%) |
| 1 or 2 Children | 26 (83.9%) | 25 (12.9%) |
| 3 or 4 Children | 0 (0.0%) | 0 (0.0%) |
| 5 or more Children | 0 (0.0%) | 0 (0.0%) |
| Total | 26 (29.5%) | 25 (7.6%) |
Income Below Poverty Among Married-Couple vs Single-Parent Households in Evergreen
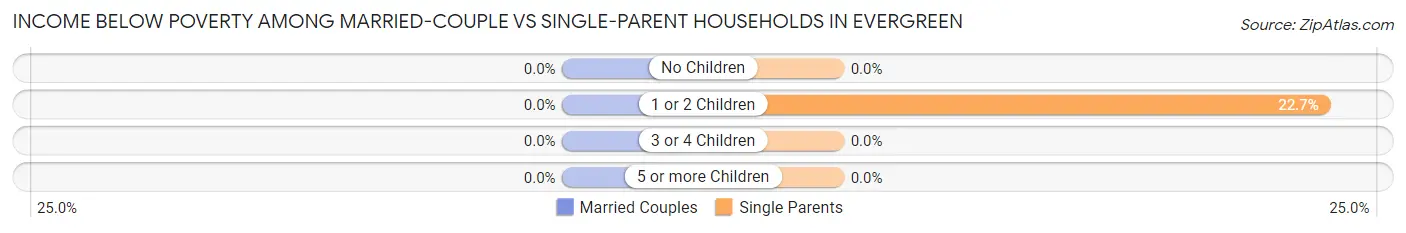
| Children | Married-Couple Families | Single-Parent Households |
| No Children | 0 (0.0%) | 0 (0.0%) |
| 1 or 2 Children | 0 (0.0%) | 51 (22.7%) |
| 3 or 4 Children | 0 (0.0%) | 0 (0.0%) |
| 5 or more Children | 0 (0.0%) | 0 (0.0%) |
| Total | 0 (0.0%) | 51 (12.2%) |
Race in Evergreen
The most populous races in Evergreen are Black / African American (2,610 | 74.6%), White / Caucasian (845 | 24.2%), and Two or more Races (21 | 0.6%).
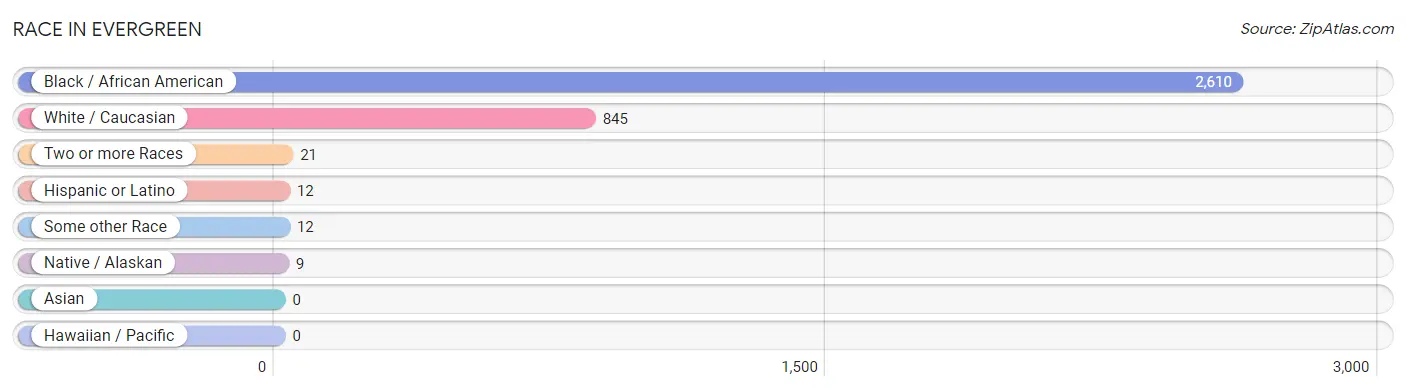
| Race | # Population | % Population |
| Asian | 0 | 0.0% |
| Black / African American | 2,610 | 74.6% |
| Hawaiian / Pacific | 0 | 0.0% |
| Hispanic or Latino | 12 | 0.3% |
| Native / Alaskan | 9 | 0.3% |
| White / Caucasian | 845 | 24.2% |
| Two or more Races | 21 | 0.6% |
| Some other Race | 12 | 0.3% |
| Total | 3,497 | 100.0% |
Ancestry in Evergreen
The most populous ancestries reported in Evergreen are Irish (316 | 9.0%), American (277 | 7.9%), French (245 | 7.0%), English (150 | 4.3%), and British (72 | 2.1%), together accounting for 30.3% of all Evergreen residents.
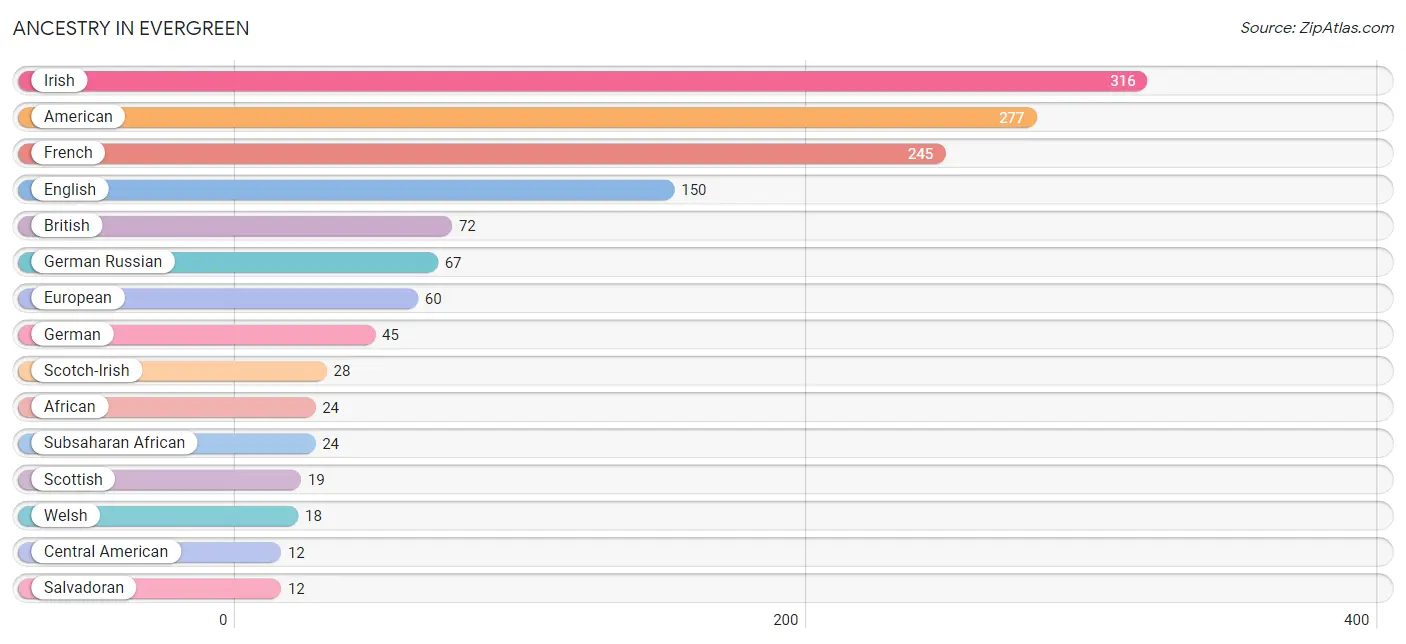
| Ancestry | # Population | % Population |
| African | 24 | 0.7% |
| American | 277 | 7.9% |
| British | 72 | 2.1% |
| Central American | 12 | 0.3% |
| Cherokee | 9 | 0.3% |
| English | 150 | 4.3% |
| European | 60 | 1.7% |
| French | 245 | 7.0% |
| German | 45 | 1.3% |
| German Russian | 67 | 1.9% |
| Haitian | 9 | 0.3% |
| Irish | 316 | 9.0% |
| Polish | 2 | 0.1% |
| Salvadoran | 12 | 0.3% |
| Scotch-Irish | 28 | 0.8% |
| Scottish | 19 | 0.5% |
| Subsaharan African | 24 | 0.7% |
| Welsh | 18 | 0.5% | View All 18 Rows |
Immigrants in Evergreen
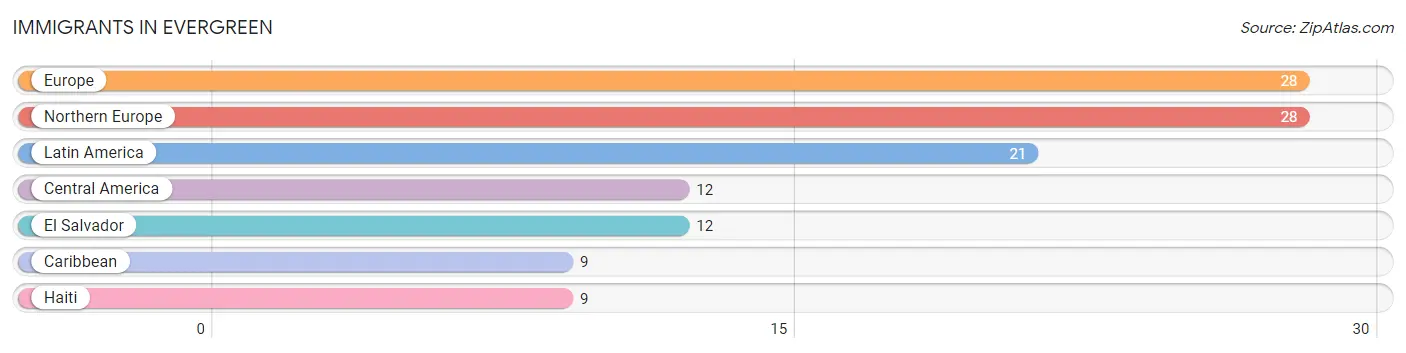
The most numerous immigrant groups reported in Evergreen came from Europe (28 | 0.8%), Northern Europe (28 | 0.8%), Latin America (21 | 0.6%), Central America (12 | 0.3%), and El Salvador (12 | 0.3%), together accounting for 2.9% of all Evergreen residents.
| Immigration Origin | # Population | % Population |
| Caribbean | 9 | 0.3% |
| Central America | 12 | 0.3% |
| El Salvador | 12 | 0.3% |
| Europe | 28 | 0.8% |
| Haiti | 9 | 0.3% |
| Latin America | 21 | 0.6% |
| Northern Europe | 28 | 0.8% | View All 7 Rows |
Sex and Age in Evergreen
Sex and Age in Evergreen
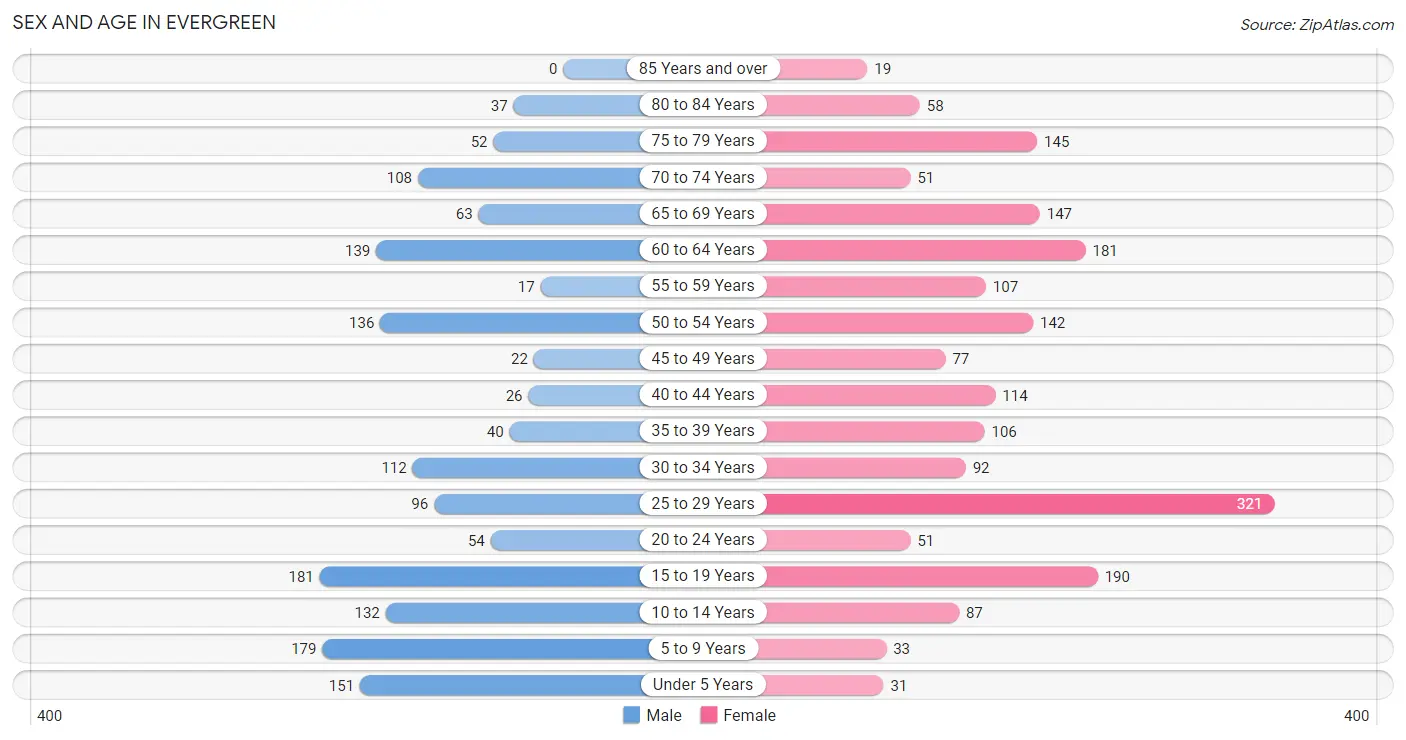
The most populous age groups in Evergreen are 15 to 19 Years (181 | 11.7%) for men and 25 to 29 Years (321 | 16.4%) for women.
| Age Bracket | Male | Female |
| Under 5 Years | 151 (9.8%) | 31 (1.6%) |
| 5 to 9 Years | 179 (11.6%) | 33 (1.7%) |
| 10 to 14 Years | 132 (8.5%) | 87 (4.5%) |
| 15 to 19 Years | 181 (11.7%) | 190 (9.7%) |
| 20 to 24 Years | 54 (3.5%) | 51 (2.6%) |
| 25 to 29 Years | 96 (6.2%) | 321 (16.4%) |
| 30 to 34 Years | 112 (7.2%) | 92 (4.7%) |
| 35 to 39 Years | 40 (2.6%) | 106 (5.4%) |
| 40 to 44 Years | 26 (1.7%) | 114 (5.8%) |
| 45 to 49 Years | 22 (1.4%) | 77 (3.9%) |
| 50 to 54 Years | 136 (8.8%) | 142 (7.3%) |
| 55 to 59 Years | 17 (1.1%) | 107 (5.5%) |
| 60 to 64 Years | 139 (9.0%) | 181 (9.3%) |
| 65 to 69 Years | 63 (4.1%) | 147 (7.5%) |
| 70 to 74 Years | 108 (7.0%) | 51 (2.6%) |
| 75 to 79 Years | 52 (3.4%) | 145 (7.4%) |
| 80 to 84 Years | 37 (2.4%) | 58 (3.0%) |
| 85 Years and over | 0 (0.0%) | 19 (1.0%) |
| Total | 1,545 (100.0%) | 1,952 (100.0%) |
Families and Households in Evergreen
Median Family Size in Evergreen
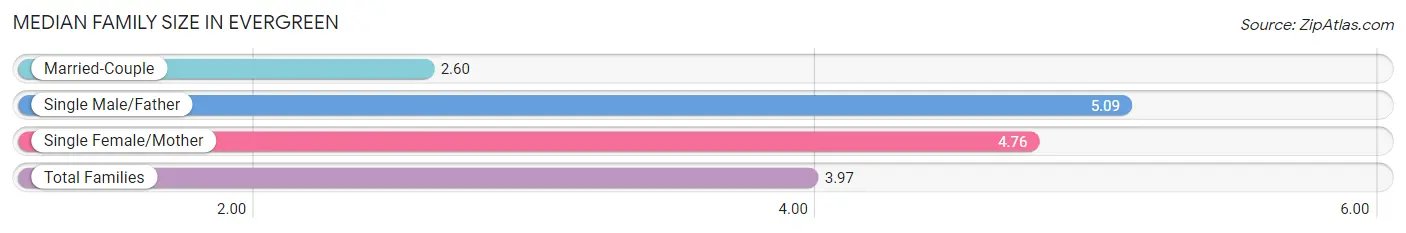
The median family size in Evergreen is 3.97 persons per family, with single male/father families (88 | 13.0%) accounting for the largest median family size of 5.09 persons per family. On the other hand, married-couple families (259 | 38.3%) represent the smallest median family size with 2.60 persons per family.
| Family Type | # Families | Family Size |
| Married-Couple | 259 (38.3%) | 2.60 |
| Single Male/Father | 88 (13.0%) | 5.09 |
| Single Female/Mother | 329 (48.7%) | 4.76 |
| Total Families | 676 (100.0%) | 3.97 |
Median Household Size in Evergreen
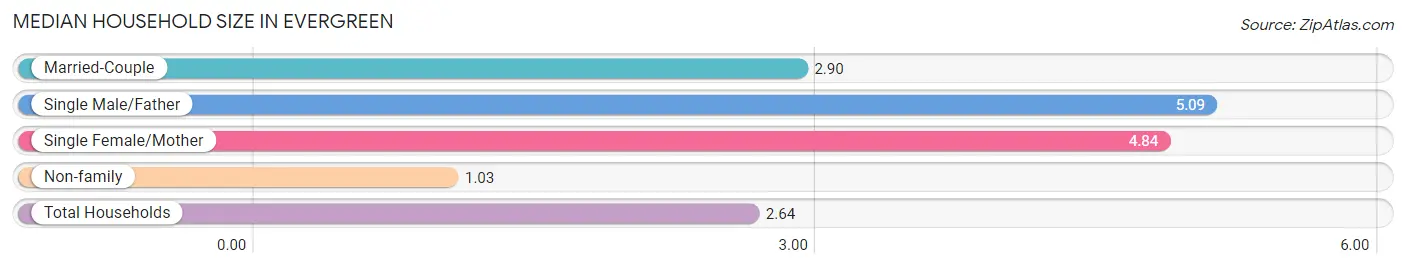
The median household size in Evergreen is 2.64 persons per household, with single male/father households (88 | 6.8%) accounting for the largest median household size of 5.09 persons per household. non-family households (628 | 48.2%) represent the smallest median household size with 1.03 persons per household.
| Household Type | # Households | Household Size |
| Married-Couple | 259 (19.9%) | 2.90 |
| Single Male/Father | 88 (6.8%) | 5.09 |
| Single Female/Mother | 329 (25.2%) | 4.84 |
| Non-family | 628 (48.2%) | 1.03 |
| Total Households | 1,304 (100.0%) | 2.64 |
Household Size by Marriage Status in Evergreen
Out of a total of 1,304 households in Evergreen, 676 (51.8%) are family households, while 628 (48.2%) are nonfamily households. The most numerous type of family households are 3-person households, comprising 309, and the most common type of nonfamily households are 1-person households, comprising 611.
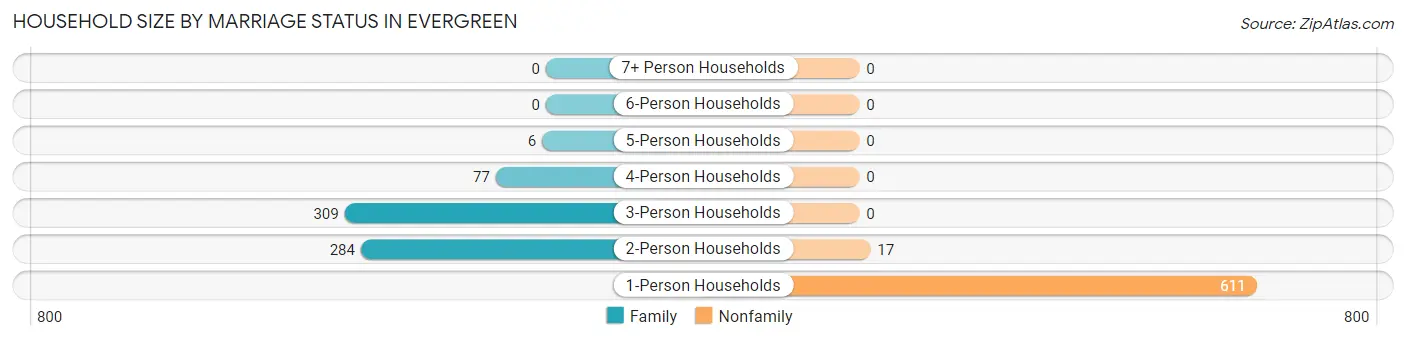
| Household Size | Family Households | Nonfamily Households |
| 1-Person Households | - | 611 (46.9%) |
| 2-Person Households | 284 (21.8%) | 17 (1.3%) |
| 3-Person Households | 309 (23.7%) | 0 (0.0%) |
| 4-Person Households | 77 (5.9%) | 0 (0.0%) |
| 5-Person Households | 6 (0.5%) | 0 (0.0%) |
| 6-Person Households | 0 (0.0%) | 0 (0.0%) |
| 7+ Person Households | 0 (0.0%) | 0 (0.0%) |
| Total | 676 (51.8%) | 628 (48.2%) |
Female Fertility in Evergreen
Fertility by Age in Evergreen
Average fertility rate in Evergreen is 13.0 births per 1,000 women. Women in the age bracket of 20 to 34 years have the highest fertility rate with 26.0 births per 1,000 women. Women in the age bracket of 20 to 34 years acount for 100.0% of all women with births.
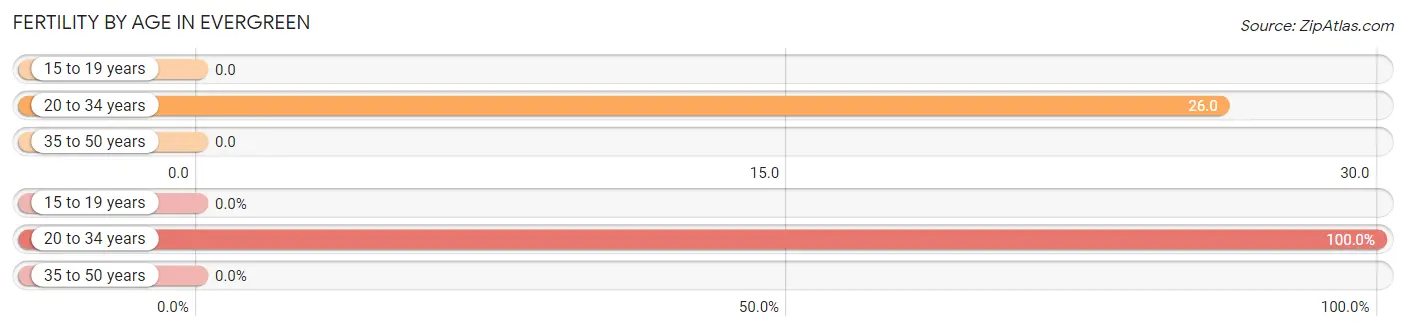
| Age Bracket | Women with Births | Births / 1,000 Women |
| 15 to 19 years | 0 (0.0%) | 0.0 |
| 20 to 34 years | 12 (100.0%) | 26.0 |
| 35 to 50 years | 0 (0.0%) | 0.0 |
| Total | 12 (100.0%) | 13.0 |
Fertility by Age by Marriage Status in Evergreen
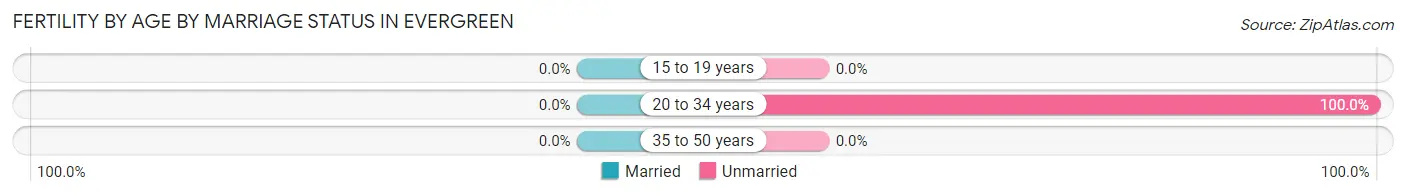
| Age Bracket | Married | Unmarried |
| 15 to 19 years | 0 (0.0%) | 0 (0.0%) |
| 20 to 34 years | 0 (0.0%) | 12 (100.0%) |
| 35 to 50 years | 0 (0.0%) | 0 (0.0%) |
| Total | 0 (0.0%) | 12 (100.0%) |
Fertility by Education in Evergreen
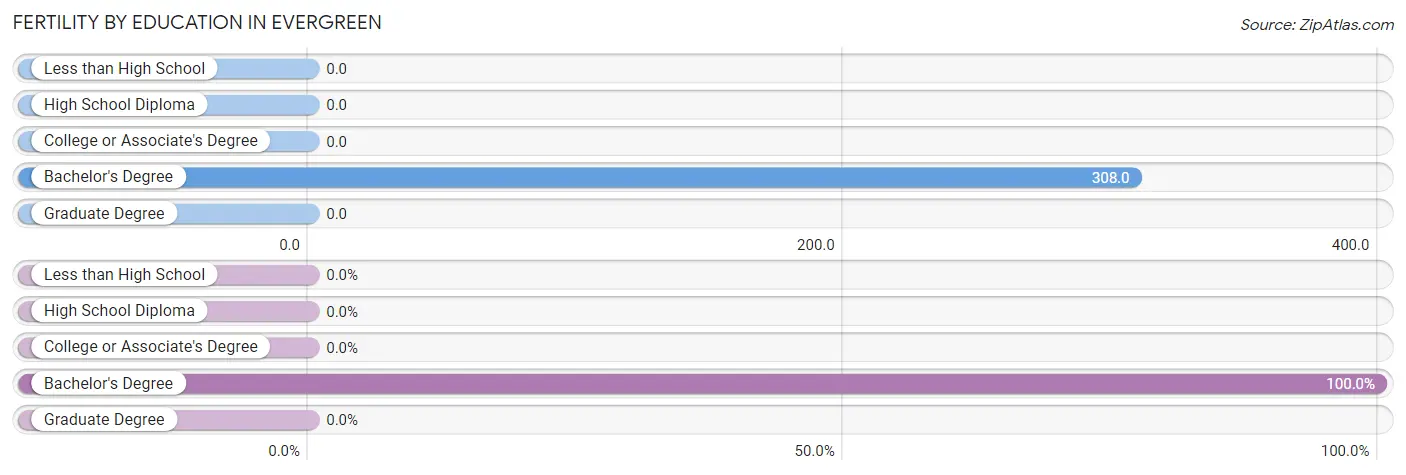
| Educational Attainment | Women with Births | Births / 1,000 Women |
| Less than High School | 0 (0.0%) | 0.0 |
| High School Diploma | 0 (0.0%) | 0.0 |
| College or Associate's Degree | 0 (0.0%) | 0.0 |
| Bachelor's Degree | 12 (100.0%) | 308.0 |
| Graduate Degree | 0 (0.0%) | 0.0 |
| Total | 12 (100.0%) | 13.0 |
Fertility by Education by Marriage Status in Evergreen
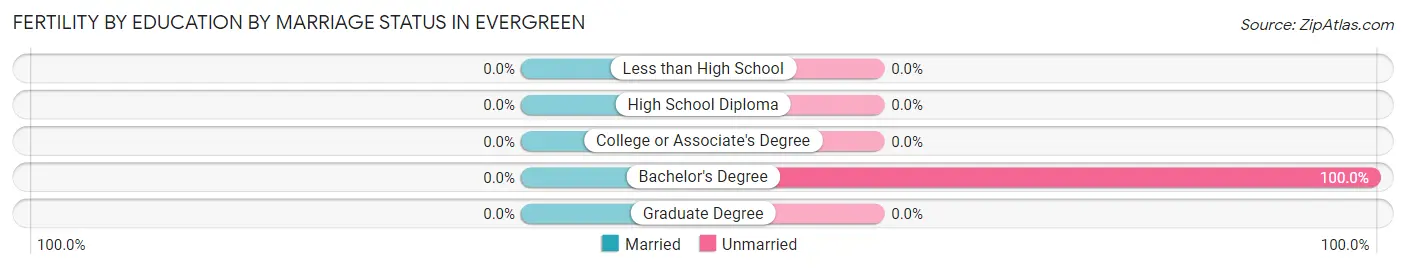
| Educational Attainment | Married | Unmarried |
| Less than High School | 0 (0.0%) | 0 (0.0%) |
| High School Diploma | 0 (0.0%) | 0 (0.0%) |
| College or Associate's Degree | 0 (0.0%) | 0 (0.0%) |
| Bachelor's Degree | 0 (0.0%) | 12 (100.0%) |
| Graduate Degree | 0 (0.0%) | 0 (0.0%) |
| Total | 0 (0.0%) | 12 (100.0%) |
Employment Characteristics in Evergreen
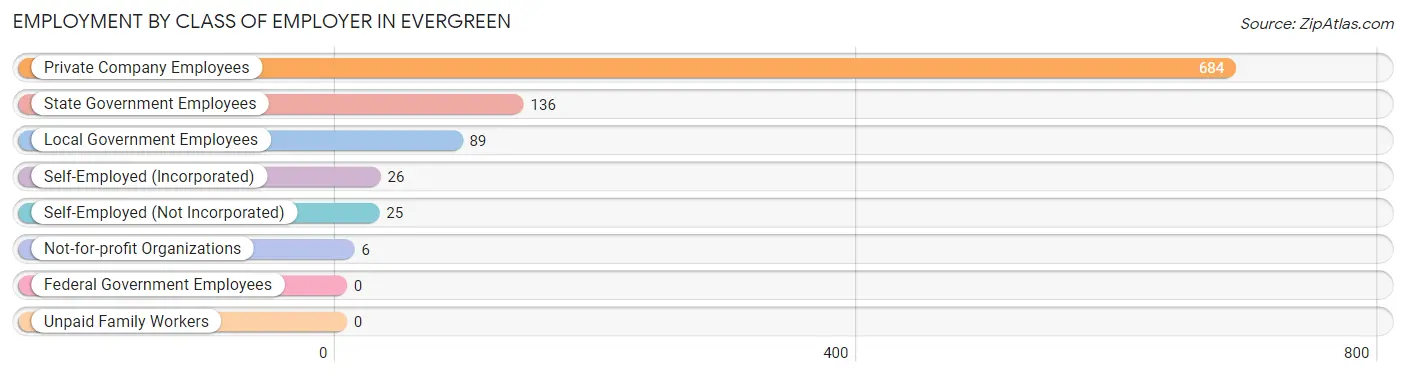
Employment by Class of Employer in Evergreen
Among the 966 employed individuals in Evergreen, private company employees (684 | 70.8%), state government employees (136 | 14.1%), and local government employees (89 | 9.2%) make up the most common classes of employment.
| Employer Class | # Employees | % Employees |
| Private Company Employees | 684 | 70.8% |
| Self-Employed (Incorporated) | 26 | 2.7% |
| Self-Employed (Not Incorporated) | 25 | 2.6% |
| Not-for-profit Organizations | 6 | 0.6% |
| Local Government Employees | 89 | 9.2% |
| State Government Employees | 136 | 14.1% |
| Federal Government Employees | 0 | 0.0% |
| Unpaid Family Workers | 0 | 0.0% |
| Total | 966 | 100.0% |
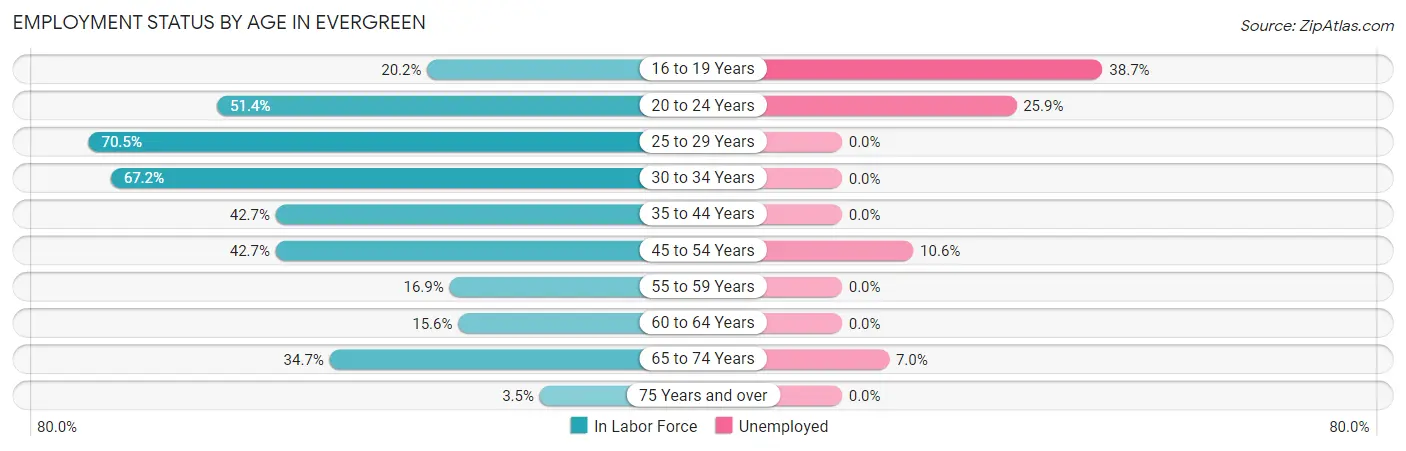
Employment Status by Age in Evergreen
According to the labor force statistics for Evergreen, out of the total population over 16 years of age (2,884), 36.5% or 1,053 individuals are in the labor force, with 6.6% or 69 of them unemployed. The age group with the highest labor force participation rate is 25 to 29 years, with 70.5% or 294 individuals in the labor force. Within the labor force, the 16 to 19 years age range has the highest percentage of unemployed individuals, with 38.7% or 29 of them being unemployed.
| Age Bracket | In Labor Force | Unemployed |
| 16 to 19 Years | 75 (20.2%) | 29 (38.7%) |
| 20 to 24 Years | 54 (51.4%) | 14 (25.9%) |
| 25 to 29 Years | 294 (70.5%) | 0 (0.0%) |
| 30 to 34 Years | 137 (67.2%) | 0 (0.0%) |
| 35 to 44 Years | 122 (42.7%) | 0 (0.0%) |
| 45 to 54 Years | 161 (42.7%) | 17 (10.6%) |
| 55 to 59 Years | 21 (16.9%) | 0 (0.0%) |
| 60 to 64 Years | 50 (15.6%) | 0 (0.0%) |
| 65 to 74 Years | 128 (34.7%) | 9 (7.0%) |
| 75 Years and over | 11 (3.5%) | 0 (0.0%) |
| Total | 1,053 (36.5%) | 69 (6.6%) |
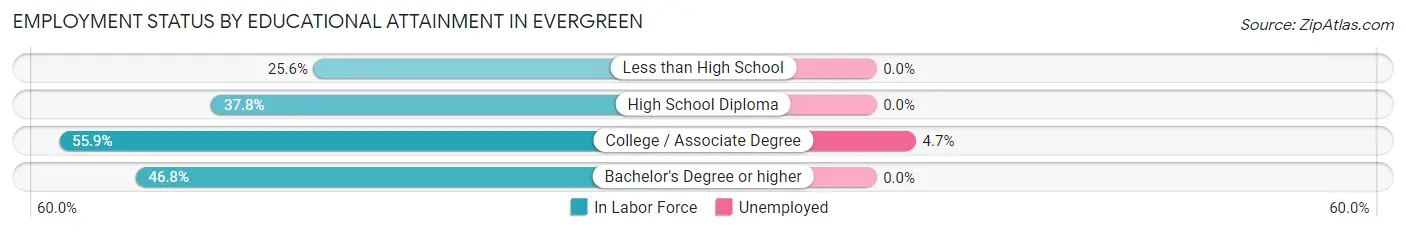
Employment Status by Educational Attainment in Evergreen
According to labor force statistics for Evergreen, 45.4% of individuals (785) out of the total population between 25 and 64 years of age (1,728) are in the labor force, with 2.2% or 17 of them being unemployed. The group with the highest labor force participation rate are those with the educational attainment of college / associate degree, with 55.9% or 361 individuals in the labor force. Within the labor force, individuals with college / associate degree education have the highest percentage of unemployment, with 4.7% or 17 of them being unemployed.
| Educational Attainment | In Labor Force | Unemployed |
| Less than High School | 22 (25.6%) | 0 (0.0%) |
| High School Diploma | 269 (37.8%) | 0 (0.0%) |
| College / Associate Degree | 361 (55.9%) | 30 (4.7%) |
| Bachelor's Degree or higher | 133 (46.8%) | 0 (0.0%) |
| Total | 785 (45.4%) | 38 (2.2%) |
Employment Occupations by Sex in Evergreen
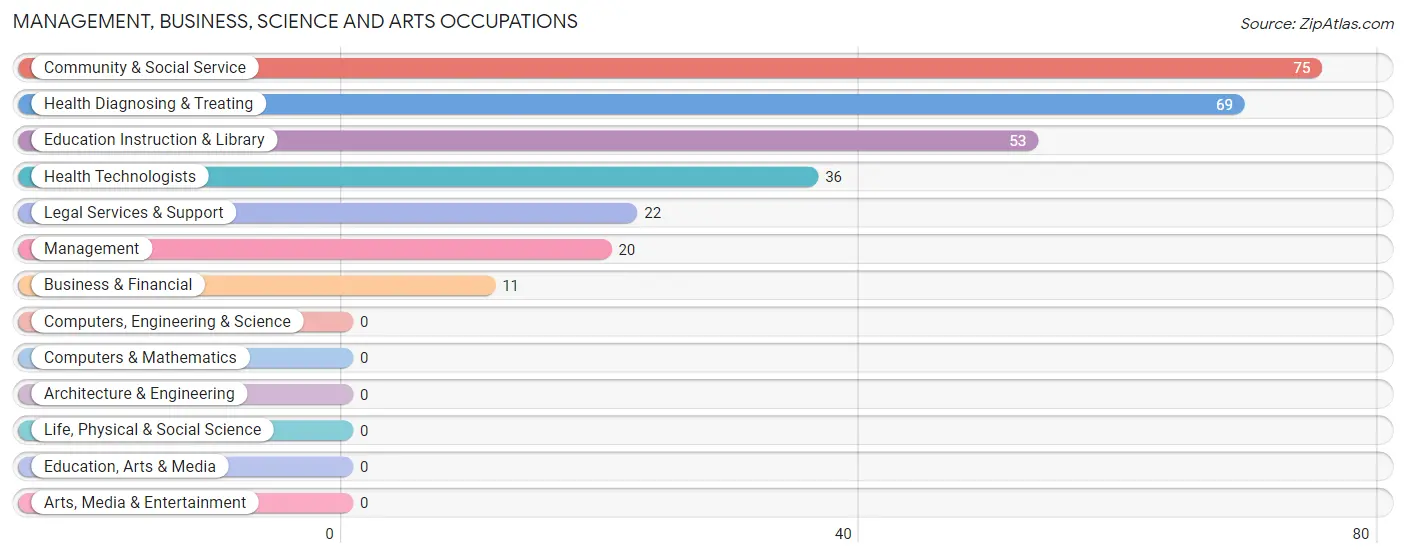
Management, Business, Science and Arts Occupations
The most common Management, Business, Science and Arts occupations in Evergreen are Community & Social Service (75 | 7.6%), Health Diagnosing & Treating (69 | 7.0%), Education Instruction & Library (53 | 5.4%), Health Technologists (36 | 3.7%), and Legal Services & Support (22 | 2.2%).
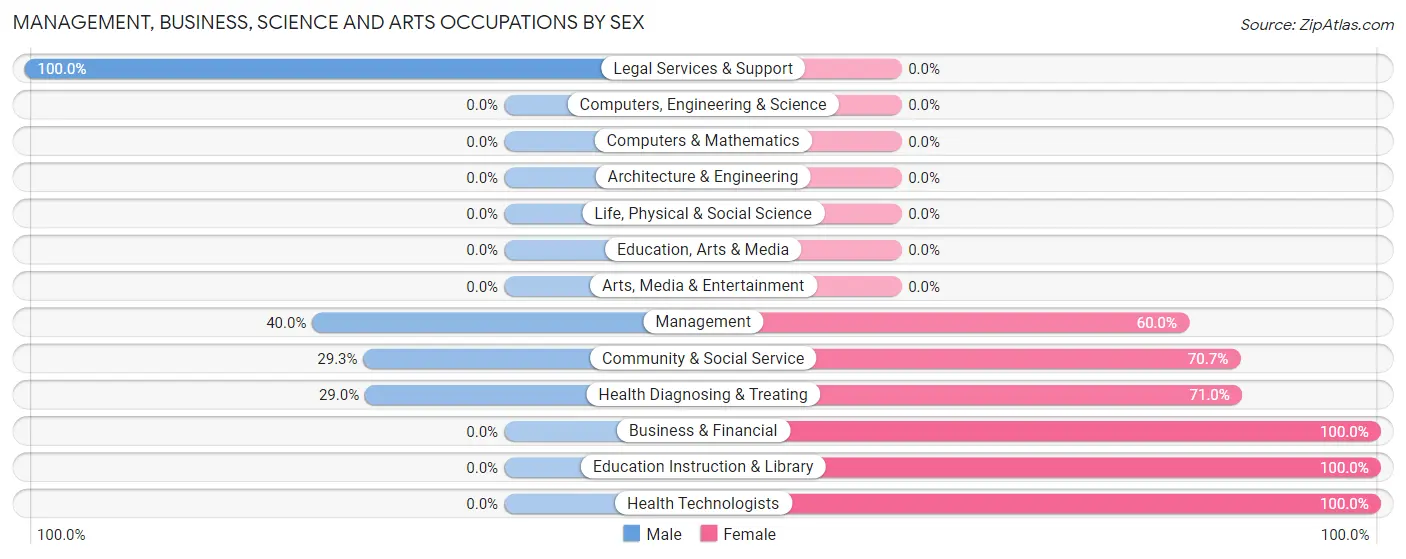
Management, Business, Science and Arts Occupations by Sex
Within the Management, Business, Science and Arts occupations in Evergreen, the most male-oriented occupations are Legal Services & Support (100.0%), Management (40.0%), and Community & Social Service (29.3%), while the most female-oriented occupations are Business & Financial (100.0%), Education Instruction & Library (100.0%), and Health Technologists (100.0%).
| Occupation | Male | Female |
| Management | 8 (40.0%) | 12 (60.0%) |
| Business & Financial | 0 (0.0%) | 11 (100.0%) |
| Computers, Engineering & Science | 0 (0.0%) | 0 (0.0%) |
| Computers & Mathematics | 0 (0.0%) | 0 (0.0%) |
| Architecture & Engineering | 0 (0.0%) | 0 (0.0%) |
| Life, Physical & Social Science | 0 (0.0%) | 0 (0.0%) |
| Community & Social Service | 22 (29.3%) | 53 (70.7%) |
| Education, Arts & Media | 0 (0.0%) | 0 (0.0%) |
| Legal Services & Support | 22 (100.0%) | 0 (0.0%) |
| Education Instruction & Library | 0 (0.0%) | 53 (100.0%) |
| Arts, Media & Entertainment | 0 (0.0%) | 0 (0.0%) |
| Health Diagnosing & Treating | 20 (29.0%) | 49 (71.0%) |
| Health Technologists | 0 (0.0%) | 36 (100.0%) |
| Total (Category) | 50 (28.6%) | 125 (71.4%) |
| Total (Overall) | 332 (33.7%) | 652 (66.3%) |
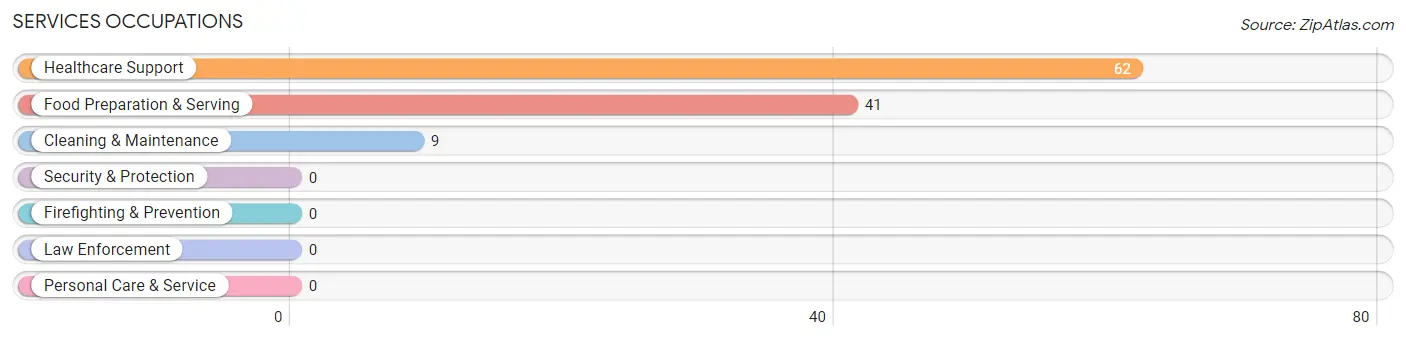
Services Occupations
The most common Services occupations in Evergreen are Healthcare Support (62 | 6.3%), Food Preparation & Serving (41 | 4.2%), and Cleaning & Maintenance (9 | 0.9%).
Services Occupations by Sex
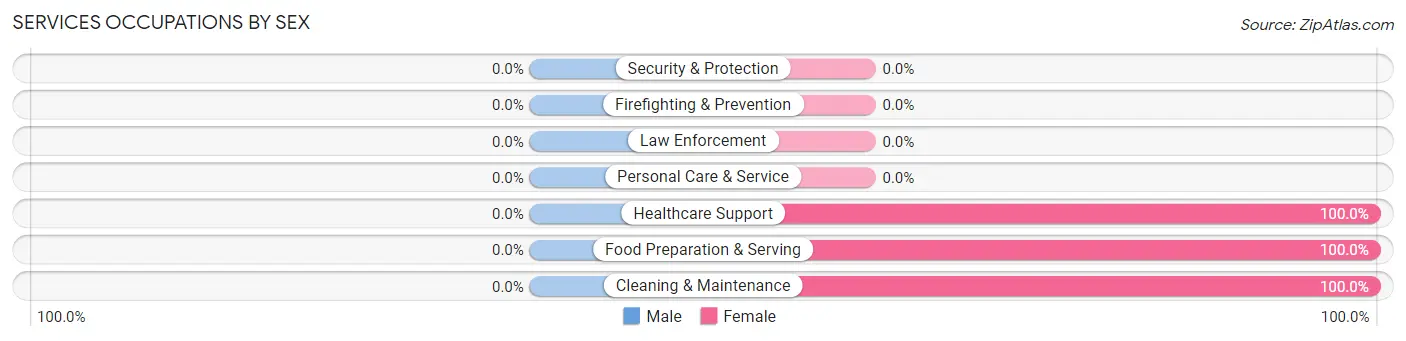
| Occupation | Male | Female |
| Healthcare Support | 0 (0.0%) | 62 (100.0%) |
| Security & Protection | 0 (0.0%) | 0 (0.0%) |
| Firefighting & Prevention | 0 (0.0%) | 0 (0.0%) |
| Law Enforcement | 0 (0.0%) | 0 (0.0%) |
| Food Preparation & Serving | 0 (0.0%) | 41 (100.0%) |
| Cleaning & Maintenance | 0 (0.0%) | 9 (100.0%) |
| Personal Care & Service | 0 (0.0%) | 0 (0.0%) |
| Total (Category) | 0 (0.0%) | 112 (100.0%) |
| Total (Overall) | 332 (33.7%) | 652 (66.3%) |
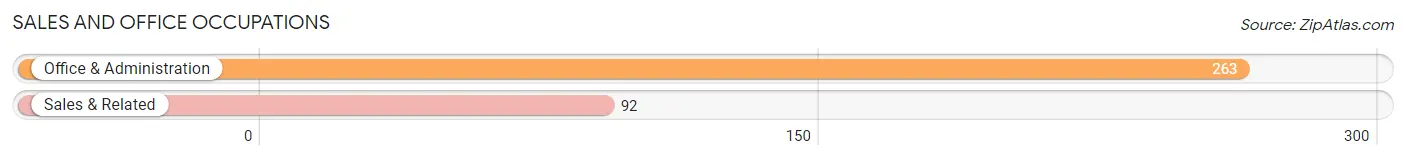
Sales and Office Occupations
The most common Sales and Office occupations in Evergreen are Office & Administration (263 | 26.7%), and Sales & Related (92 | 9.3%).
Sales and Office Occupations by Sex
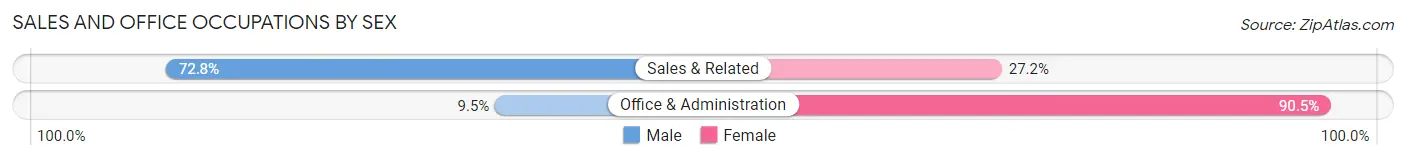
| Occupation | Male | Female |
| Sales & Related | 67 (72.8%) | 25 (27.2%) |
| Office & Administration | 25 (9.5%) | 238 (90.5%) |
| Total (Category) | 92 (25.9%) | 263 (74.1%) |
| Total (Overall) | 332 (33.7%) | 652 (66.3%) |
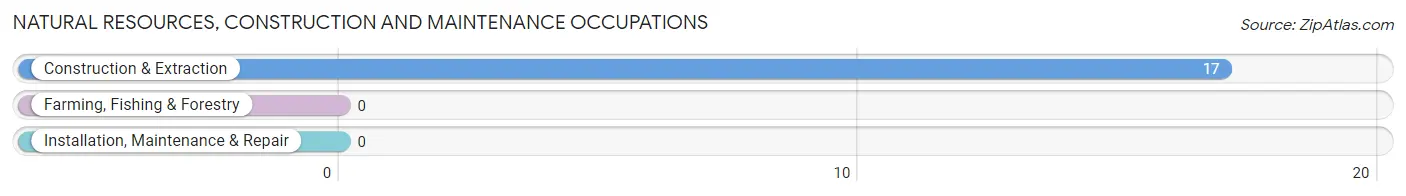
Natural Resources, Construction and Maintenance Occupations
The most common Natural Resources, Construction and Maintenance occupations in Evergreen are , and Construction & Extraction (17 | 1.7%).
Natural Resources, Construction and Maintenance Occupations by Sex
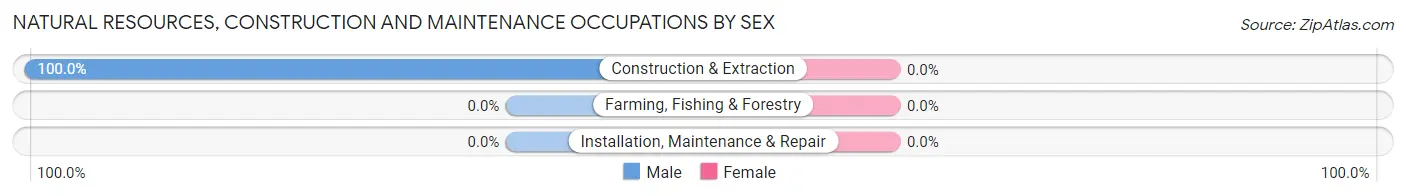
| Occupation | Male | Female |
| Farming, Fishing & Forestry | 0 (0.0%) | 0 (0.0%) |
| Construction & Extraction | 17 (100.0%) | 0 (0.0%) |
| Installation, Maintenance & Repair | 0 (0.0%) | 0 (0.0%) |
| Total (Category) | 17 (100.0%) | 0 (0.0%) |
| Total (Overall) | 332 (33.7%) | 652 (66.3%) |
Production, Transportation and Moving Occupations
The most common Production, Transportation and Moving occupations in Evergreen are Transportation (131 | 13.3%), Material Moving (106 | 10.8%), and Production (88 | 8.9%).
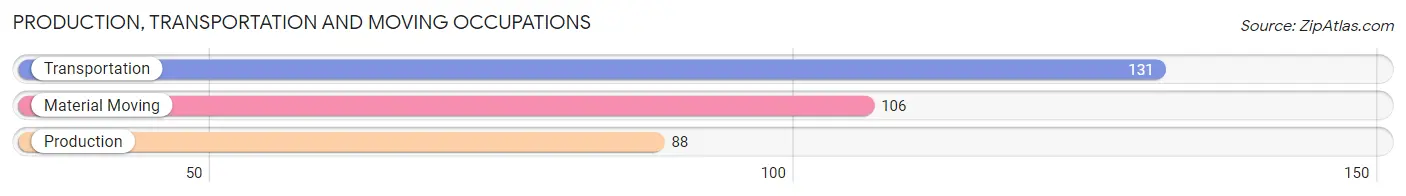
Production, Transportation and Moving Occupations by Sex
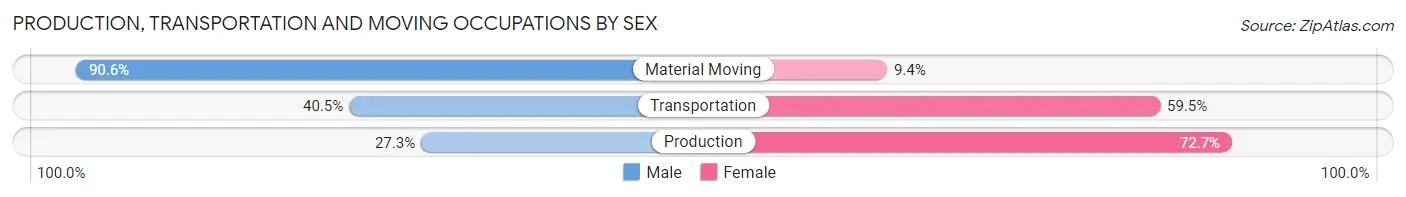
| Occupation | Male | Female |
| Production | 24 (27.3%) | 64 (72.7%) |
| Transportation | 53 (40.5%) | 78 (59.5%) |
| Material Moving | 96 (90.6%) | 10 (9.4%) |
| Total (Category) | 173 (53.2%) | 152 (46.8%) |
| Total (Overall) | 332 (33.7%) | 652 (66.3%) |
Employment Industries by Sex in Evergreen
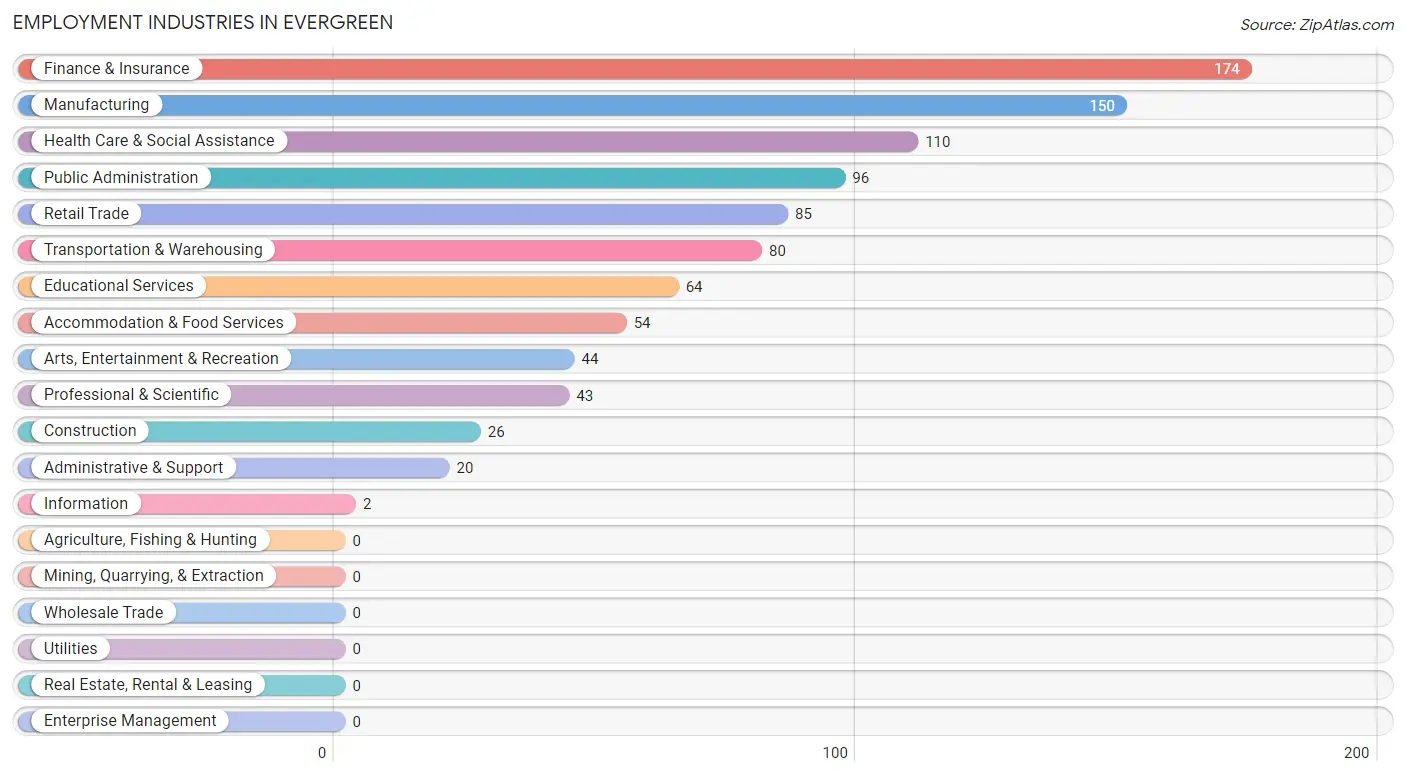
Employment Industries in Evergreen
The major employment industries in Evergreen include Finance & Insurance (174 | 17.7%), Manufacturing (150 | 15.2%), Health Care & Social Assistance (110 | 11.2%), Public Administration (96 | 9.8%), and Retail Trade (85 | 8.6%).
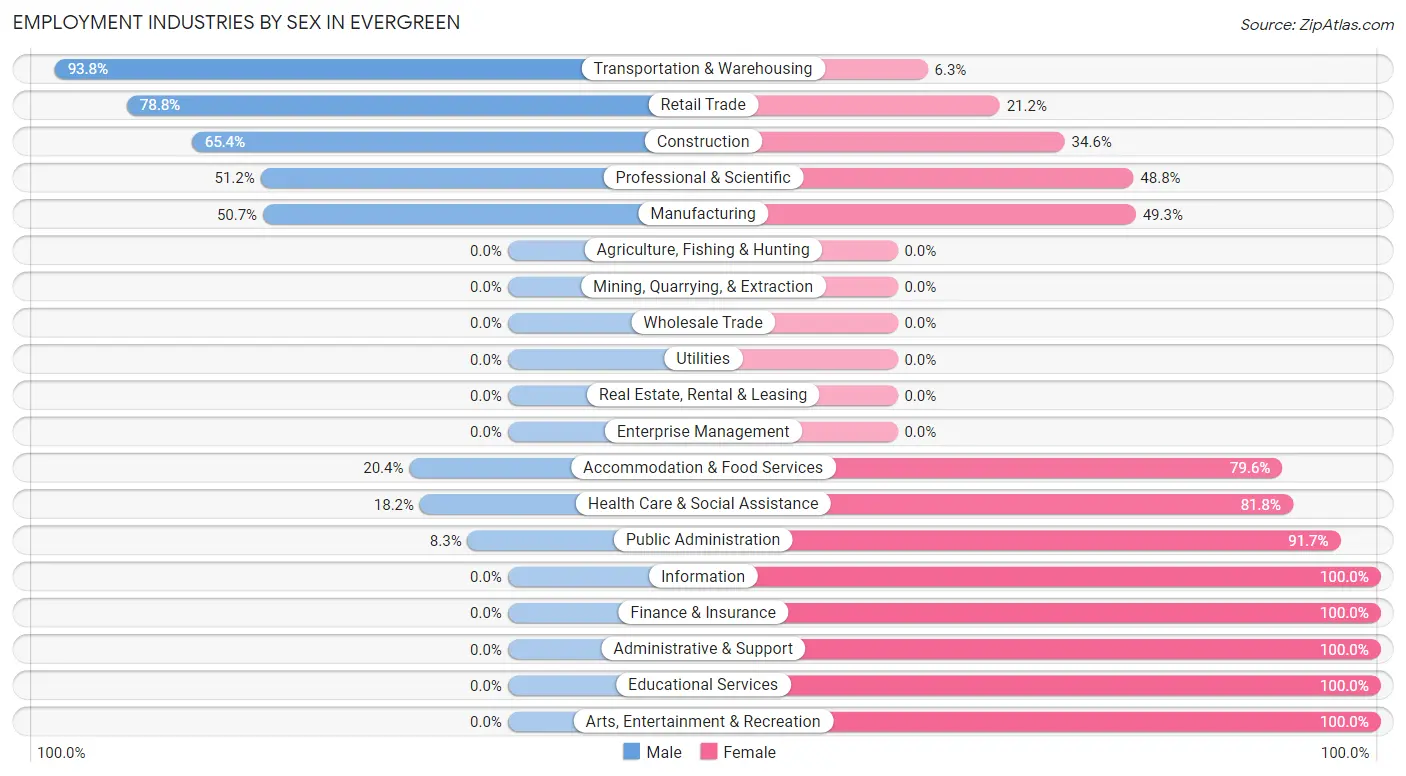
Employment Industries by Sex in Evergreen
The Evergreen industries that see more men than women are Transportation & Warehousing (93.8%), Retail Trade (78.8%), and Construction (65.4%), whereas the industries that tend to have a higher number of women are Information (100.0%), Finance & Insurance (100.0%), and Administrative & Support (100.0%).
| Industry | Male | Female |
| Agriculture, Fishing & Hunting | 0 (0.0%) | 0 (0.0%) |
| Mining, Quarrying, & Extraction | 0 (0.0%) | 0 (0.0%) |
| Construction | 17 (65.4%) | 9 (34.6%) |
| Manufacturing | 76 (50.7%) | 74 (49.3%) |
| Wholesale Trade | 0 (0.0%) | 0 (0.0%) |
| Retail Trade | 67 (78.8%) | 18 (21.2%) |
| Transportation & Warehousing | 75 (93.8%) | 5 (6.2%) |
| Utilities | 0 (0.0%) | 0 (0.0%) |
| Information | 0 (0.0%) | 2 (100.0%) |
| Finance & Insurance | 0 (0.0%) | 174 (100.0%) |
| Real Estate, Rental & Leasing | 0 (0.0%) | 0 (0.0%) |
| Professional & Scientific | 22 (51.2%) | 21 (48.8%) |
| Enterprise Management | 0 (0.0%) | 0 (0.0%) |
| Administrative & Support | 0 (0.0%) | 20 (100.0%) |
| Educational Services | 0 (0.0%) | 64 (100.0%) |
| Health Care & Social Assistance | 20 (18.2%) | 90 (81.8%) |
| Arts, Entertainment & Recreation | 0 (0.0%) | 44 (100.0%) |
| Accommodation & Food Services | 11 (20.4%) | 43 (79.6%) |
| Public Administration | 8 (8.3%) | 88 (91.7%) |
| Total | 332 (33.7%) | 652 (66.3%) |
Education in Evergreen
School Enrollment in Evergreen
The most common levels of schooling among the 891 students in Evergreen are high school (350 | 39.3%), middle school (229 | 25.7%), and elementary school (192 | 21.5%).
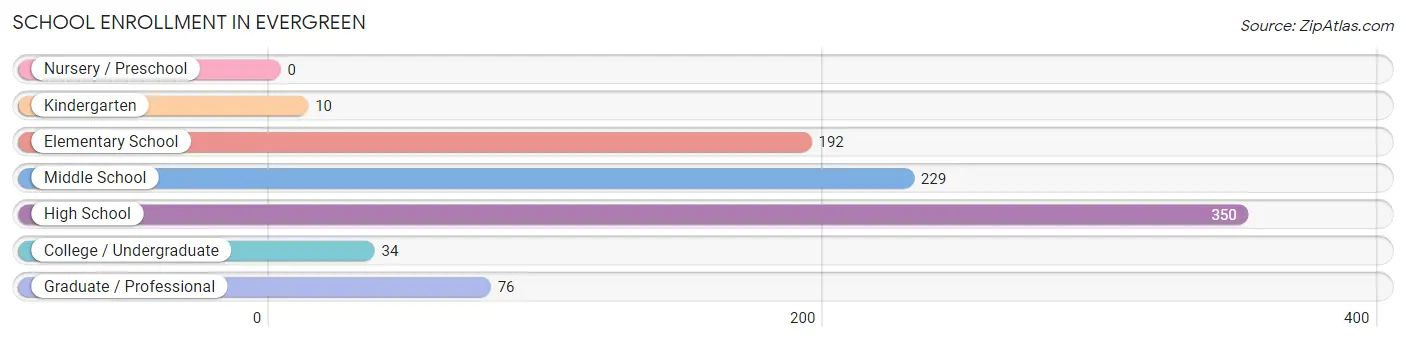
| School Level | # Students | % Students |
| Nursery / Preschool | 0 | 0.0% |
| Kindergarten | 10 | 1.1% |
| Elementary School | 192 | 21.5% |
| Middle School | 229 | 25.7% |
| High School | 350 | 39.3% |
| College / Undergraduate | 34 | 3.8% |
| Graduate / Professional | 76 | 8.5% |
| Total | 891 | 100.0% |
School Enrollment by Age by Funding Source in Evergreen
Out of a total of 891 students who are enrolled in schools in Evergreen, 199 (22.3%) attend a private institution, while the remaining 692 (77.7%) are enrolled in public schools. The age group of 35 years and over has the highest likelihood of being enrolled in private schools, with 96 (100.0% in the age bracket) enrolled. Conversely, the age group of 5 to 9 year old has the lowest likelihood of being enrolled in a private school, with 212 (100.0% in the age bracket) attending a public institution.
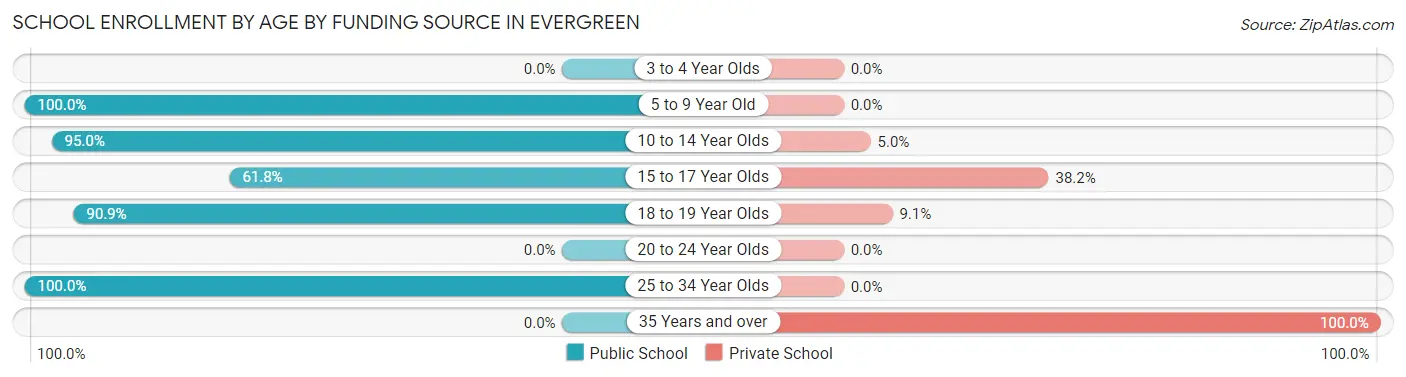
| Age Bracket | Public School | Private School |
| 3 to 4 Year Olds | 0 (0.0%) | 0 (0.0%) |
| 5 to 9 Year Old | 212 (100.0%) | 0 (0.0%) |
| 10 to 14 Year Olds | 208 (95.0%) | 11 (5.0%) |
| 15 to 17 Year Olds | 128 (61.8%) | 79 (38.2%) |
| 18 to 19 Year Olds | 130 (90.9%) | 13 (9.1%) |
| 20 to 24 Year Olds | 0 (0.0%) | 0 (0.0%) |
| 25 to 34 Year Olds | 14 (100.0%) | 0 (0.0%) |
| 35 Years and over | 0 (0.0%) | 96 (100.0%) |
| Total | 692 (77.7%) | 199 (22.3%) |
Educational Attainment by Field of Study in Evergreen
Business (196 | 48.2%), education (76 | 18.7%), arts & humanities (47 | 11.6%), science & technology (41 | 10.1%), and liberal arts & history (36 | 8.8%) are the most common fields of study among 407 individuals in Evergreen who have obtained a bachelor's degree or higher.
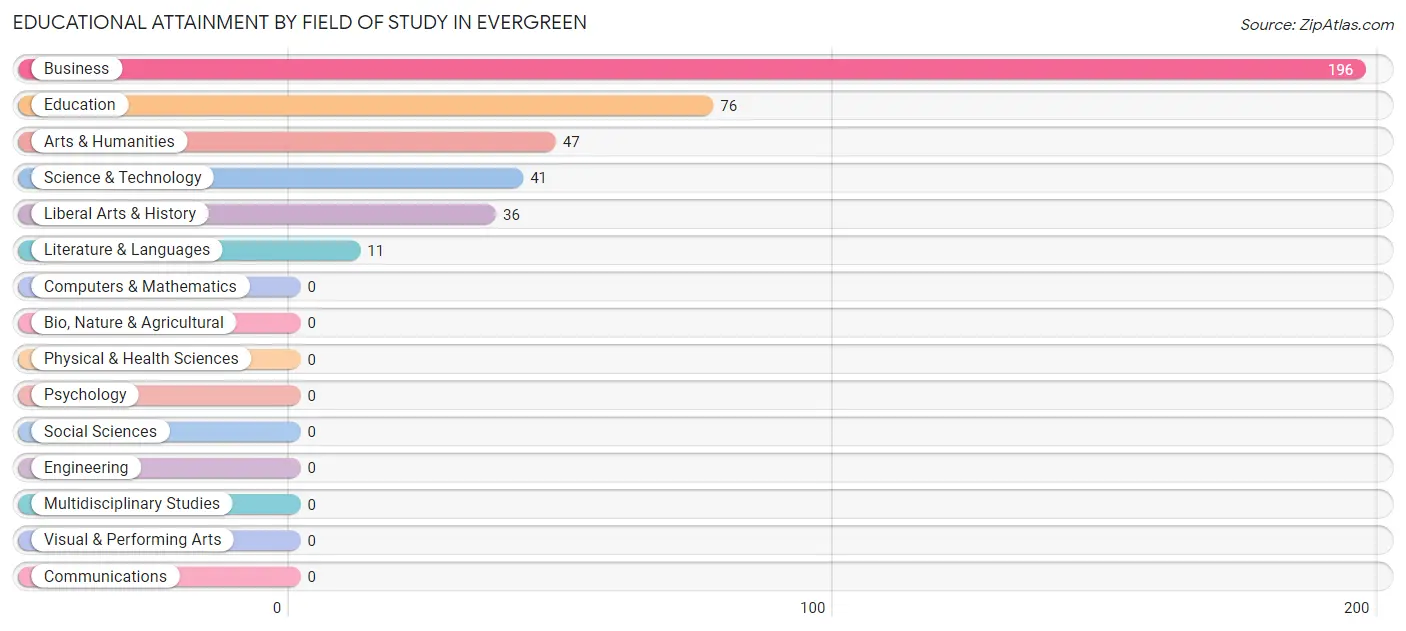
| Field of Study | # Graduates | % Graduates |
| Computers & Mathematics | 0 | 0.0% |
| Bio, Nature & Agricultural | 0 | 0.0% |
| Physical & Health Sciences | 0 | 0.0% |
| Psychology | 0 | 0.0% |
| Social Sciences | 0 | 0.0% |
| Engineering | 0 | 0.0% |
| Multidisciplinary Studies | 0 | 0.0% |
| Science & Technology | 41 | 10.1% |
| Business | 196 | 48.2% |
| Education | 76 | 18.7% |
| Literature & Languages | 11 | 2.7% |
| Liberal Arts & History | 36 | 8.8% |
| Visual & Performing Arts | 0 | 0.0% |
| Communications | 0 | 0.0% |
| Arts & Humanities | 47 | 11.6% |
| Total | 407 | 100.0% |
Transportation & Commute in Evergreen
Vehicle Availability by Sex in Evergreen
The most prevalent vehicle ownership categories in Evergreen are males with 4 vehicles (90, accounting for 28.7%) and females with 4 vehicles (46, making up 13.8%).
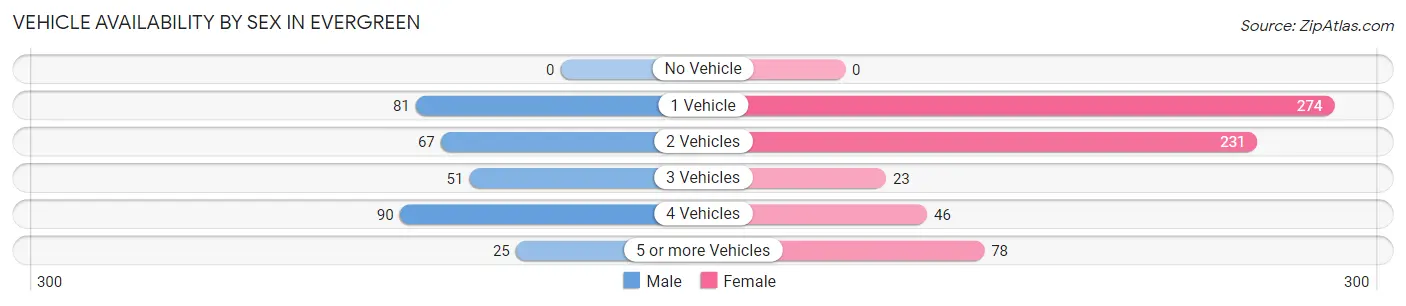
| Vehicles Available | Male | Female |
| No Vehicle | 0 (0.0%) | 0 (0.0%) |
| 1 Vehicle | 81 (25.8%) | 274 (42.0%) |
| 2 Vehicles | 67 (21.3%) | 231 (35.4%) |
| 3 Vehicles | 51 (16.2%) | 23 (3.5%) |
| 4 Vehicles | 90 (28.7%) | 46 (7.1%) |
| 5 or more Vehicles | 25 (8.0%) | 78 (12.0%) |
| Total | 314 (100.0%) | 652 (100.0%) |
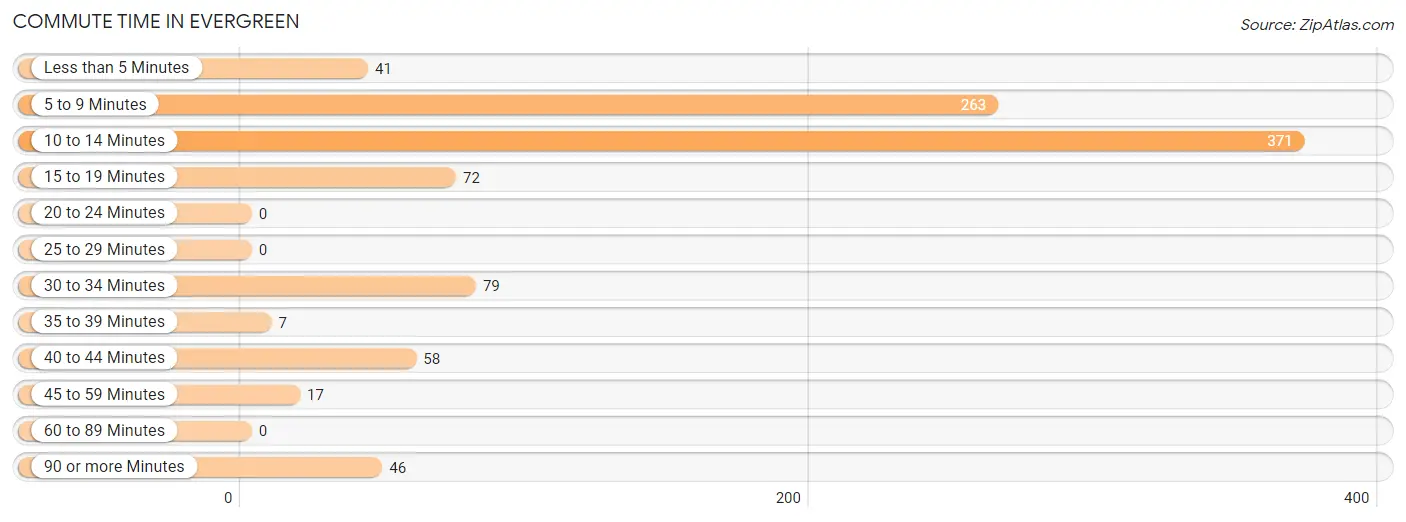
Commute Time in Evergreen
The most frequently occuring commute durations in Evergreen are 10 to 14 minutes (371 commuters, 38.9%), 5 to 9 minutes (263 commuters, 27.6%), and 30 to 34 minutes (79 commuters, 8.3%).
| Commute Time | # Commuters | % Commuters |
| Less than 5 Minutes | 41 | 4.3% |
| 5 to 9 Minutes | 263 | 27.6% |
| 10 to 14 Minutes | 371 | 38.9% |
| 15 to 19 Minutes | 72 | 7.5% |
| 20 to 24 Minutes | 0 | 0.0% |
| 25 to 29 Minutes | 0 | 0.0% |
| 30 to 34 Minutes | 79 | 8.3% |
| 35 to 39 Minutes | 7 | 0.7% |
| 40 to 44 Minutes | 58 | 6.1% |
| 45 to 59 Minutes | 17 | 1.8% |
| 60 to 89 Minutes | 0 | 0.0% |
| 90 or more Minutes | 46 | 4.8% |
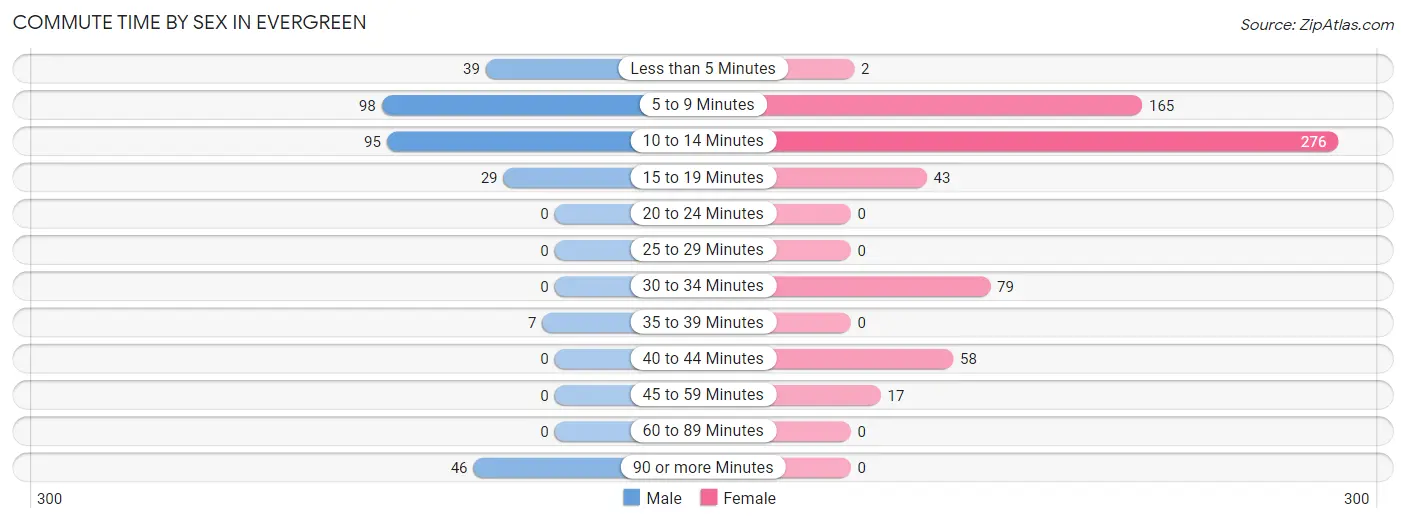
Commute Time by Sex in Evergreen
The most common commute times in Evergreen are 5 to 9 minutes (98 commuters, 31.2%) for males and 10 to 14 minutes (276 commuters, 43.1%) for females.
| Commute Time | Male | Female |
| Less than 5 Minutes | 39 (12.4%) | 2 (0.3%) |
| 5 to 9 Minutes | 98 (31.2%) | 165 (25.8%) |
| 10 to 14 Minutes | 95 (30.2%) | 276 (43.1%) |
| 15 to 19 Minutes | 29 (9.2%) | 43 (6.7%) |
| 20 to 24 Minutes | 0 (0.0%) | 0 (0.0%) |
| 25 to 29 Minutes | 0 (0.0%) | 0 (0.0%) |
| 30 to 34 Minutes | 0 (0.0%) | 79 (12.3%) |
| 35 to 39 Minutes | 7 (2.2%) | 0 (0.0%) |
| 40 to 44 Minutes | 0 (0.0%) | 58 (9.1%) |
| 45 to 59 Minutes | 0 (0.0%) | 17 (2.7%) |
| 60 to 89 Minutes | 0 (0.0%) | 0 (0.0%) |
| 90 or more Minutes | 46 (14.6%) | 0 (0.0%) |
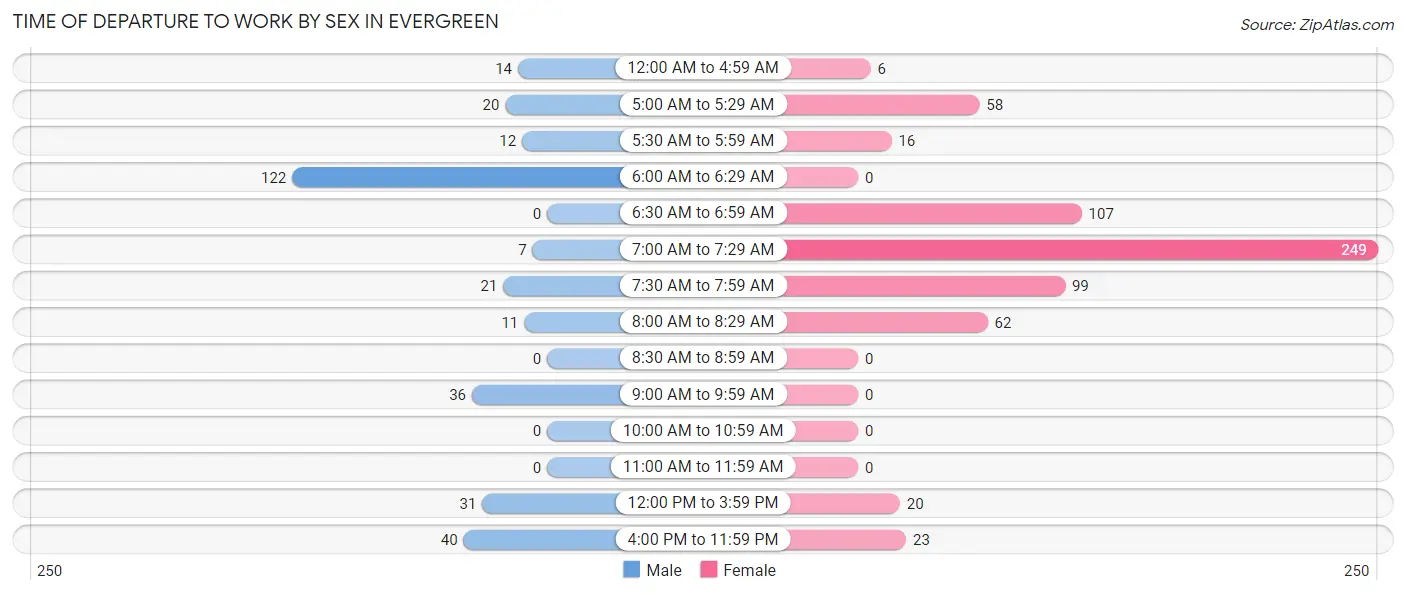
Time of Departure to Work by Sex in Evergreen
The most frequent times of departure to work in Evergreen are 6:00 AM to 6:29 AM (122, 38.9%) for males and 7:00 AM to 7:29 AM (249, 38.9%) for females.
| Time of Departure | Male | Female |
| 12:00 AM to 4:59 AM | 14 (4.5%) | 6 (0.9%) |
| 5:00 AM to 5:29 AM | 20 (6.4%) | 58 (9.1%) |
| 5:30 AM to 5:59 AM | 12 (3.8%) | 16 (2.5%) |
| 6:00 AM to 6:29 AM | 122 (38.9%) | 0 (0.0%) |
| 6:30 AM to 6:59 AM | 0 (0.0%) | 107 (16.7%) |
| 7:00 AM to 7:29 AM | 7 (2.2%) | 249 (38.9%) |
| 7:30 AM to 7:59 AM | 21 (6.7%) | 99 (15.5%) |
| 8:00 AM to 8:29 AM | 11 (3.5%) | 62 (9.7%) |
| 8:30 AM to 8:59 AM | 0 (0.0%) | 0 (0.0%) |
| 9:00 AM to 9:59 AM | 36 (11.5%) | 0 (0.0%) |
| 10:00 AM to 10:59 AM | 0 (0.0%) | 0 (0.0%) |
| 11:00 AM to 11:59 AM | 0 (0.0%) | 0 (0.0%) |
| 12:00 PM to 3:59 PM | 31 (9.9%) | 20 (3.1%) |
| 4:00 PM to 11:59 PM | 40 (12.7%) | 23 (3.6%) |
| Total | 314 (100.0%) | 640 (100.0%) |
Housing Occupancy in Evergreen
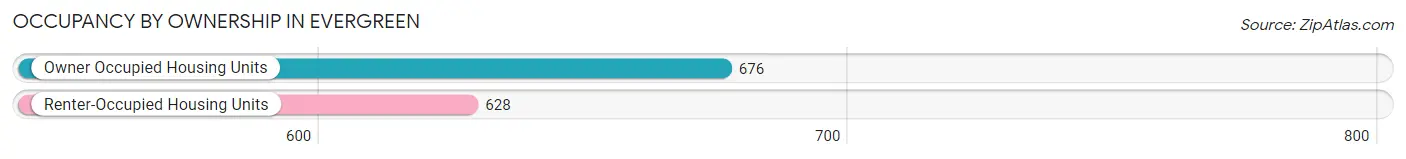
Occupancy by Ownership in Evergreen
Of the total 1,304 dwellings in Evergreen, owner-occupied units account for 676 (51.8%), while renter-occupied units make up 628 (48.2%).
| Occupancy | # Housing Units | % Housing Units |
| Owner Occupied Housing Units | 676 | 51.8% |
| Renter-Occupied Housing Units | 628 | 48.2% |
| Total Occupied Housing Units | 1,304 | 100.0% |
Occupancy by Household Size in Evergreen
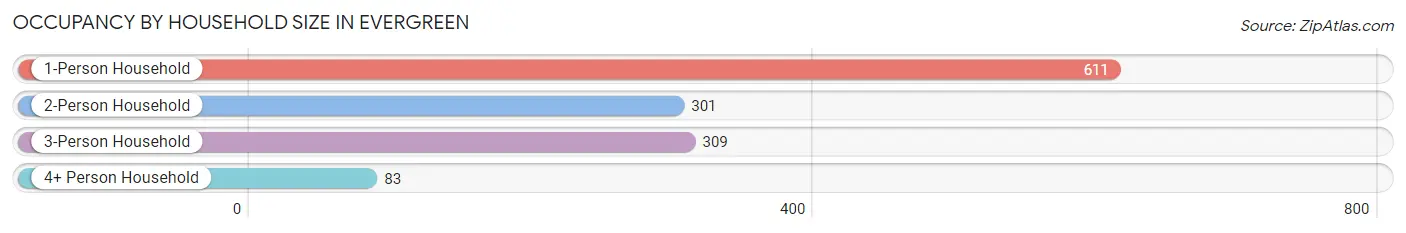
| Household Size | # Housing Units | % Housing Units |
| 1-Person Household | 611 | 46.9% |
| 2-Person Household | 301 | 23.1% |
| 3-Person Household | 309 | 23.7% |
| 4+ Person Household | 83 | 6.4% |
| Total Housing Units | 1,304 | 100.0% |
Occupancy by Ownership by Household Size in Evergreen
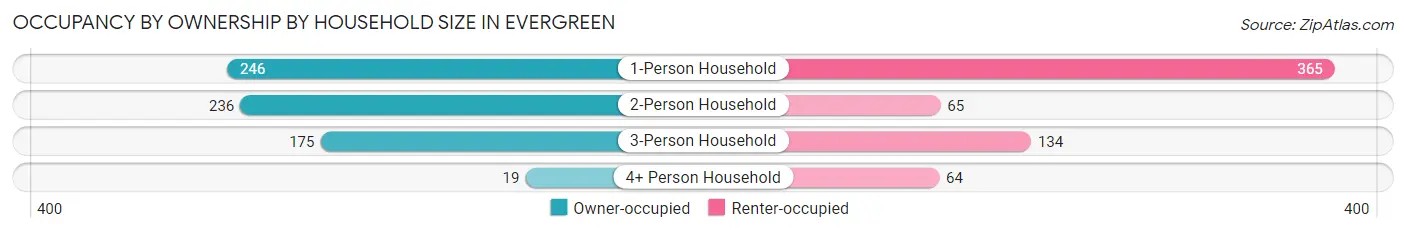
| Household Size | Owner-occupied | Renter-occupied |
| 1-Person Household | 246 (40.3%) | 365 (59.7%) |
| 2-Person Household | 236 (78.4%) | 65 (21.6%) |
| 3-Person Household | 175 (56.6%) | 134 (43.4%) |
| 4+ Person Household | 19 (22.9%) | 64 (77.1%) |
| Total Housing Units | 676 (51.8%) | 628 (48.2%) |
Occupancy by Educational Attainment in Evergreen
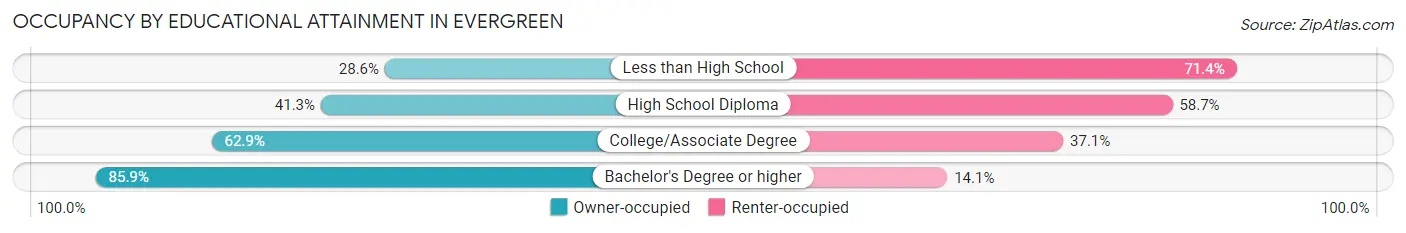
| Household Size | Owner-occupied | Renter-occupied |
| Less than High School | 54 (28.6%) | 135 (71.4%) |
| High School Diploma | 248 (41.3%) | 353 (58.7%) |
| College/Associate Degree | 185 (62.9%) | 109 (37.1%) |
| Bachelor's Degree or higher | 189 (85.9%) | 31 (14.1%) |
Occupancy by Age of Householder in Evergreen
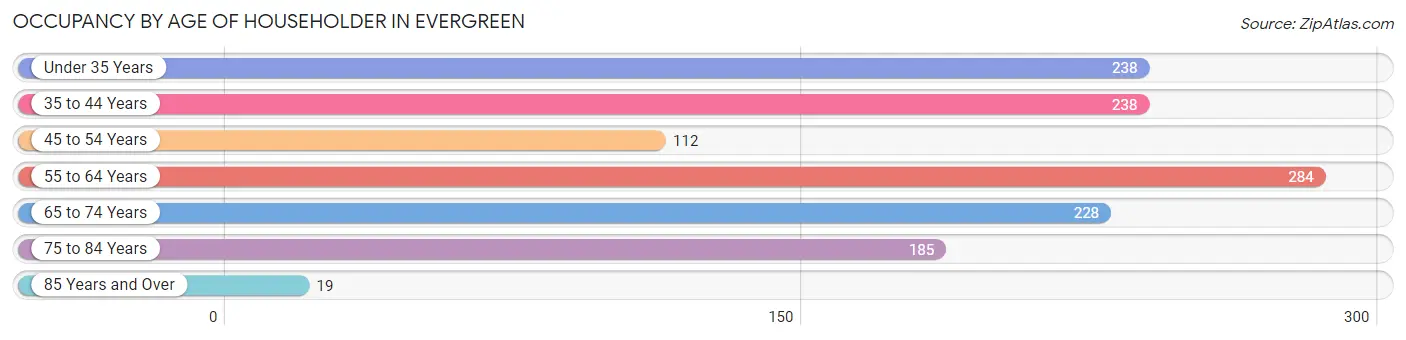
| Age Bracket | # Households | % Households |
| Under 35 Years | 238 | 18.2% |
| 35 to 44 Years | 238 | 18.2% |
| 45 to 54 Years | 112 | 8.6% |
| 55 to 64 Years | 284 | 21.8% |
| 65 to 74 Years | 228 | 17.5% |
| 75 to 84 Years | 185 | 14.2% |
| 85 Years and Over | 19 | 1.5% |
| Total | 1,304 | 100.0% |
Housing Finances in Evergreen
Median Income by Occupancy in Evergreen
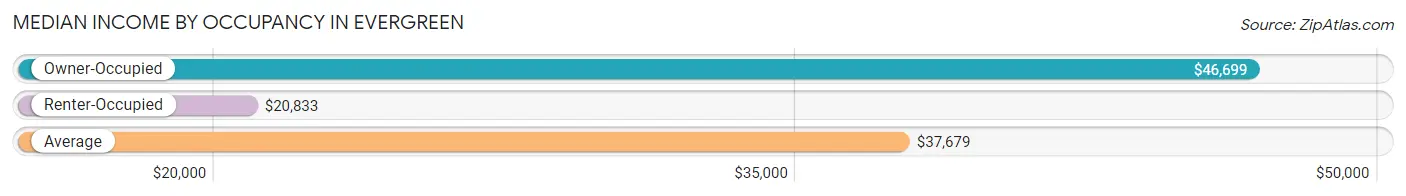
| Occupancy Type | # Households | Median Income |
| Owner-Occupied | 676 (51.8%) | $46,699 |
| Renter-Occupied | 628 (48.2%) | $20,833 |
| Average | 1,304 (100.0%) | $37,679 |
Occupancy by Householder Income Bracket in Evergreen
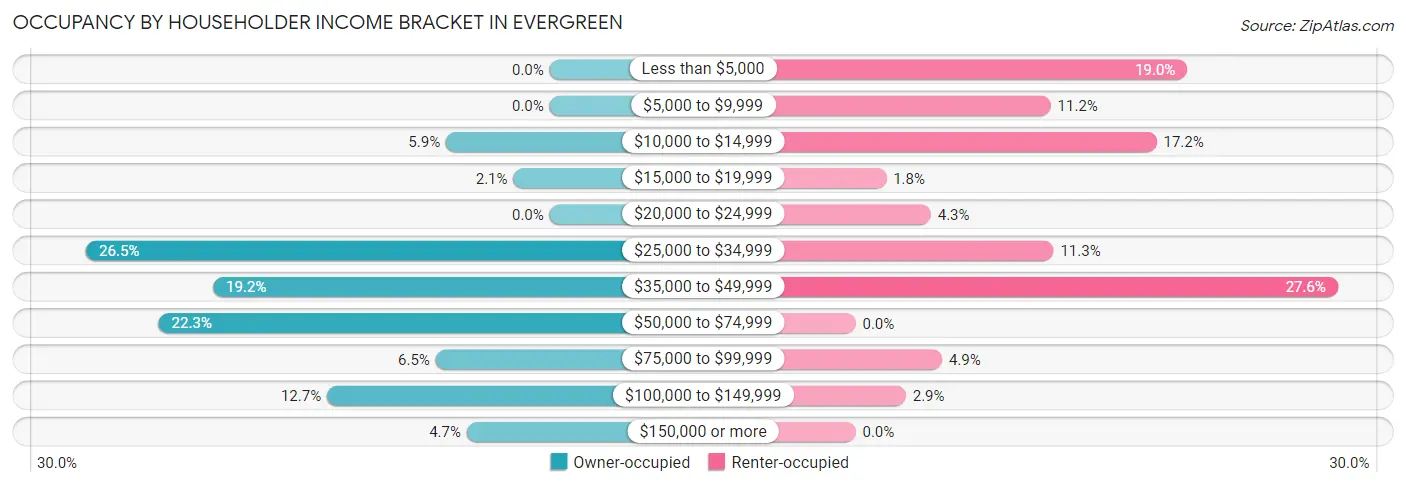
| Income Bracket | Owner-occupied | Renter-occupied |
| Less than $5,000 | 0 (0.0%) | 119 (19.0%) |
| $5,000 to $9,999 | 0 (0.0%) | 70 (11.2%) |
| $10,000 to $14,999 | 40 (5.9%) | 108 (17.2%) |
| $15,000 to $19,999 | 14 (2.1%) | 11 (1.8%) |
| $20,000 to $24,999 | 0 (0.0%) | 27 (4.3%) |
| $25,000 to $34,999 | 179 (26.5%) | 71 (11.3%) |
| $35,000 to $49,999 | 130 (19.2%) | 173 (27.6%) |
| $50,000 to $74,999 | 151 (22.3%) | 0 (0.0%) |
| $75,000 to $99,999 | 44 (6.5%) | 31 (4.9%) |
| $100,000 to $149,999 | 86 (12.7%) | 18 (2.9%) |
| $150,000 or more | 32 (4.7%) | 0 (0.0%) |
| Total | 676 (100.0%) | 628 (100.0%) |
Monthly Housing Cost Tiers in Evergreen
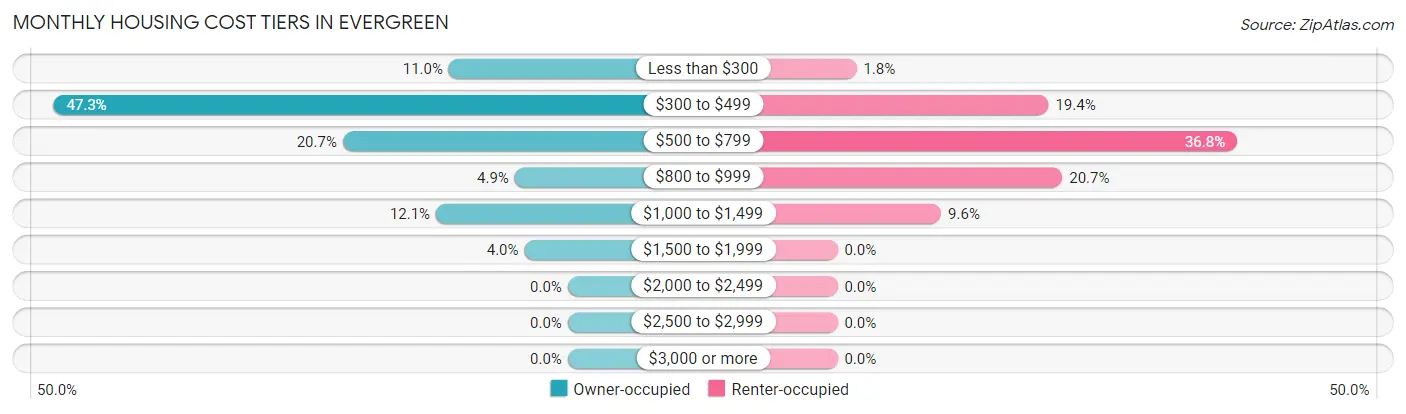
| Monthly Cost | Owner-occupied | Renter-occupied |
| Less than $300 | 74 (11.0%) | 11 (1.8%) |
| $300 to $499 | 320 (47.3%) | 122 (19.4%) |
| $500 to $799 | 140 (20.7%) | 231 (36.8%) |
| $800 to $999 | 33 (4.9%) | 130 (20.7%) |
| $1,000 to $1,499 | 82 (12.1%) | 60 (9.6%) |
| $1,500 to $1,999 | 27 (4.0%) | 0 (0.0%) |
| $2,000 to $2,499 | 0 (0.0%) | 0 (0.0%) |
| $2,500 to $2,999 | 0 (0.0%) | 0 (0.0%) |
| $3,000 or more | 0 (0.0%) | 0 (0.0%) |
| Total | 676 (100.0%) | 628 (100.0%) |
Physical Housing Characteristics in Evergreen
Housing Structures in Evergreen
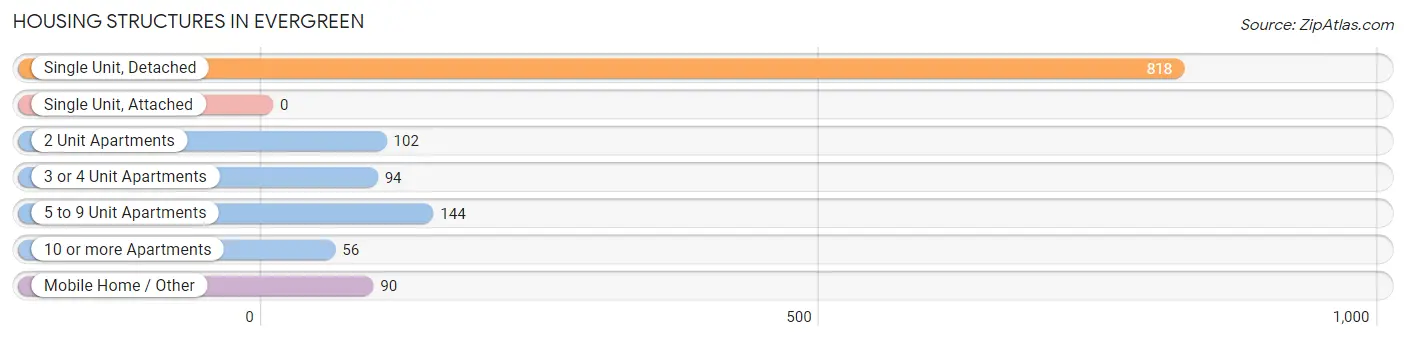
| Structure Type | # Housing Units | % Housing Units |
| Single Unit, Detached | 818 | 62.7% |
| Single Unit, Attached | 0 | 0.0% |
| 2 Unit Apartments | 102 | 7.8% |
| 3 or 4 Unit Apartments | 94 | 7.2% |
| 5 to 9 Unit Apartments | 144 | 11.0% |
| 10 or more Apartments | 56 | 4.3% |
| Mobile Home / Other | 90 | 6.9% |
| Total | 1,304 | 100.0% |
Housing Structures by Occupancy in Evergreen
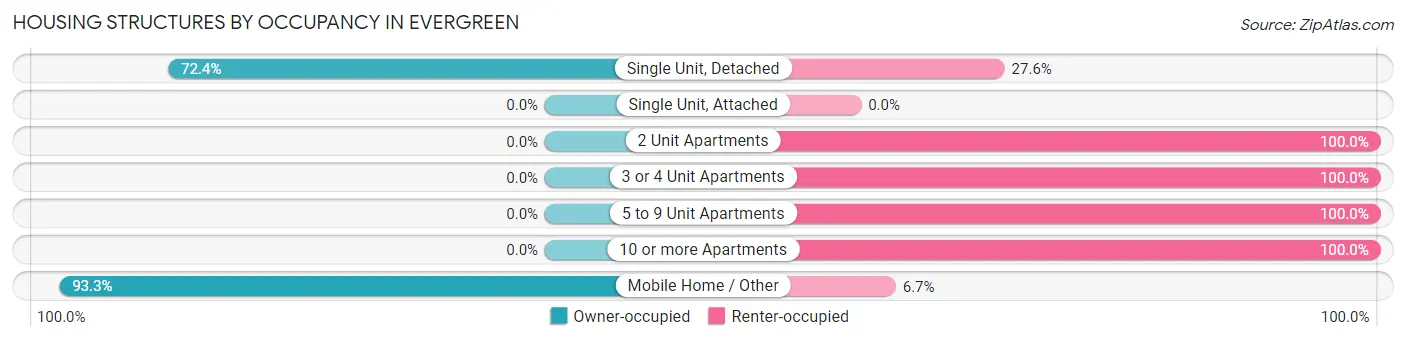
| Structure Type | Owner-occupied | Renter-occupied |
| Single Unit, Detached | 592 (72.4%) | 226 (27.6%) |
| Single Unit, Attached | 0 (0.0%) | 0 (0.0%) |
| 2 Unit Apartments | 0 (0.0%) | 102 (100.0%) |
| 3 or 4 Unit Apartments | 0 (0.0%) | 94 (100.0%) |
| 5 to 9 Unit Apartments | 0 (0.0%) | 144 (100.0%) |
| 10 or more Apartments | 0 (0.0%) | 56 (100.0%) |
| Mobile Home / Other | 84 (93.3%) | 6 (6.7%) |
| Total | 676 (51.8%) | 628 (48.2%) |
Housing Structures by Number of Rooms in Evergreen
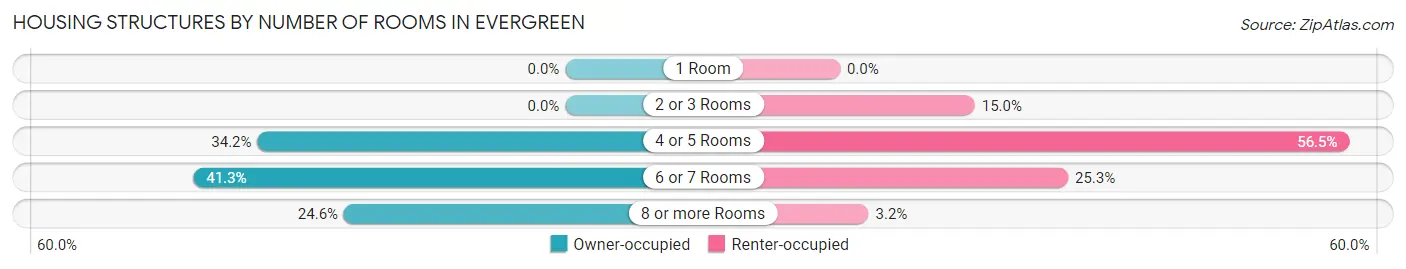
| Number of Rooms | Owner-occupied | Renter-occupied |
| 1 Room | 0 (0.0%) | 0 (0.0%) |
| 2 or 3 Rooms | 0 (0.0%) | 94 (15.0%) |
| 4 or 5 Rooms | 231 (34.2%) | 355 (56.5%) |
| 6 or 7 Rooms | 279 (41.3%) | 159 (25.3%) |
| 8 or more Rooms | 166 (24.6%) | 20 (3.2%) |
| Total | 676 (100.0%) | 628 (100.0%) |
Housing Structure by Heating Type in Evergreen
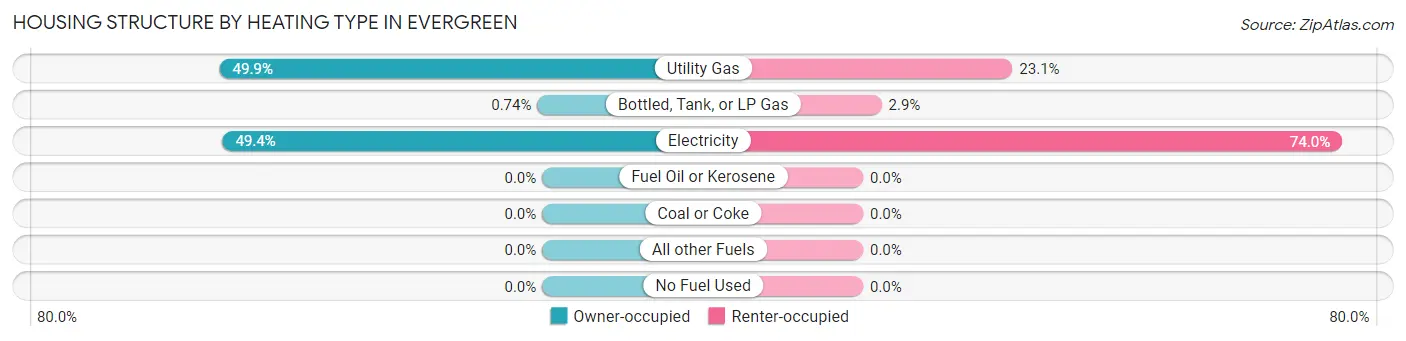
| Heating Type | Owner-occupied | Renter-occupied |
| Utility Gas | 337 (49.8%) | 145 (23.1%) |
| Bottled, Tank, or LP Gas | 5 (0.7%) | 18 (2.9%) |
| Electricity | 334 (49.4%) | 465 (74.0%) |
| Fuel Oil or Kerosene | 0 (0.0%) | 0 (0.0%) |
| Coal or Coke | 0 (0.0%) | 0 (0.0%) |
| All other Fuels | 0 (0.0%) | 0 (0.0%) |
| No Fuel Used | 0 (0.0%) | 0 (0.0%) |
| Total | 676 (100.0%) | 628 (100.0%) |
Household Vehicle Usage in Evergreen
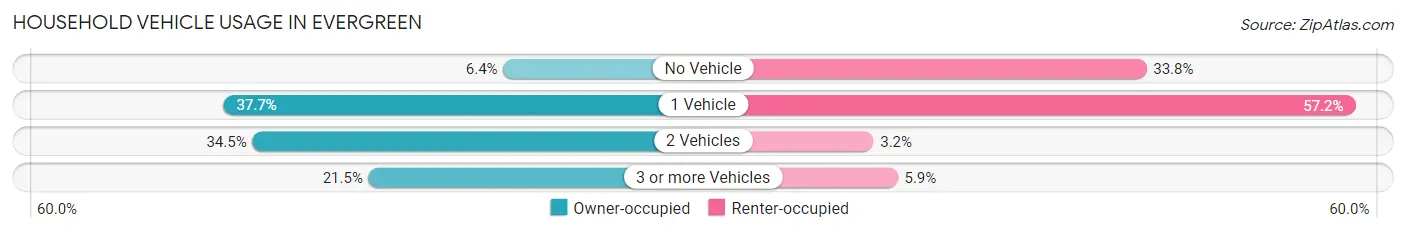
| Vehicles per Household | Owner-occupied | Renter-occupied |
| No Vehicle | 43 (6.4%) | 212 (33.8%) |
| 1 Vehicle | 255 (37.7%) | 359 (57.2%) |
| 2 Vehicles | 233 (34.5%) | 20 (3.2%) |
| 3 or more Vehicles | 145 (21.4%) | 37 (5.9%) |
| Total | 676 (100.0%) | 628 (100.0%) |
Real Estate & Mortgages in Evergreen
Real Estate and Mortgage Overview in Evergreen
| Characteristic | Without Mortgage | With Mortgage |
| Housing Units | 506 | 170 |
| Median Property Value | $93,900 | $154,200 |
| Median Household Income | $45,609 | $32 |
| Monthly Housing Costs | $433 | $0 |
| Real Estate Taxes | $285 | $23 |
Property Value by Mortgage Status in Evergreen
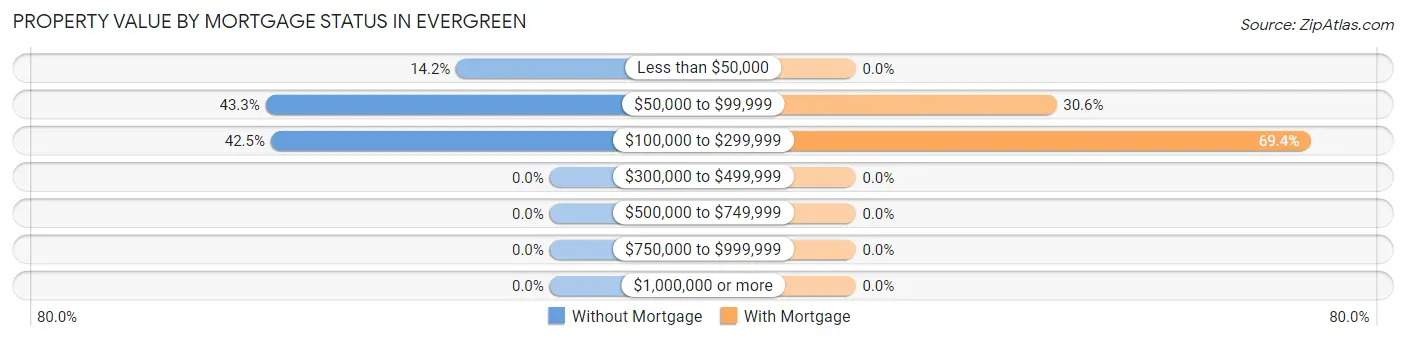
| Property Value | Without Mortgage | With Mortgage |
| Less than $50,000 | 72 (14.2%) | 0 (0.0%) |
| $50,000 to $99,999 | 219 (43.3%) | 52 (30.6%) |
| $100,000 to $299,999 | 215 (42.5%) | 118 (69.4%) |
| $300,000 to $499,999 | 0 (0.0%) | 0 (0.0%) |
| $500,000 to $749,999 | 0 (0.0%) | 0 (0.0%) |
| $750,000 to $999,999 | 0 (0.0%) | 0 (0.0%) |
| $1,000,000 or more | 0 (0.0%) | 0 (0.0%) |
| Total | 506 (100.0%) | 170 (100.0%) |
Household Income by Mortgage Status in Evergreen
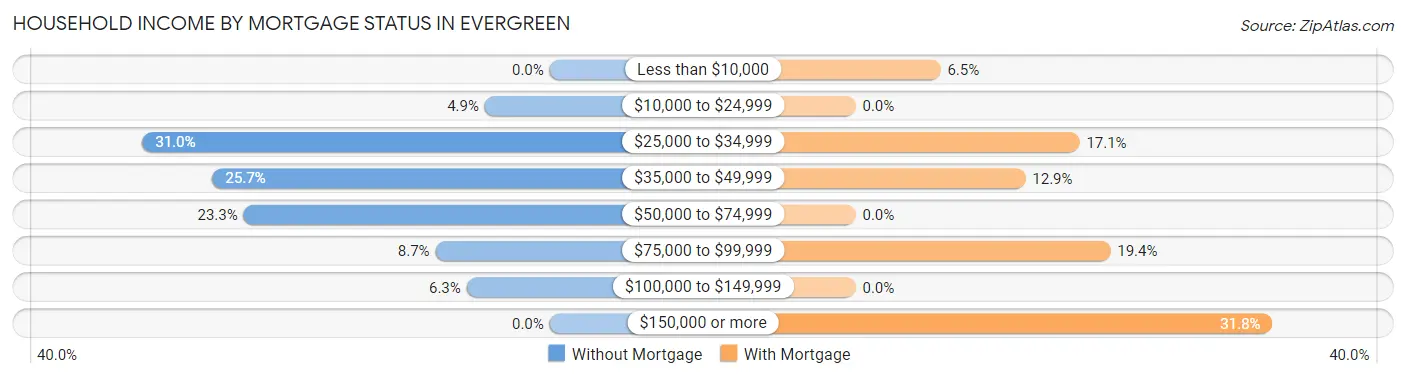
| Household Income | Without Mortgage | With Mortgage |
| Less than $10,000 | 0 (0.0%) | 11 (6.5%) |
| $10,000 to $24,999 | 25 (4.9%) | 0 (0.0%) |
| $25,000 to $34,999 | 157 (31.0%) | 29 (17.1%) |
| $35,000 to $49,999 | 130 (25.7%) | 22 (12.9%) |
| $50,000 to $74,999 | 118 (23.3%) | 0 (0.0%) |
| $75,000 to $99,999 | 44 (8.7%) | 33 (19.4%) |
| $100,000 to $149,999 | 32 (6.3%) | 0 (0.0%) |
| $150,000 or more | 0 (0.0%) | 54 (31.8%) |
| Total | 506 (100.0%) | 170 (100.0%) |
Property Value to Household Income Ratio in Evergreen
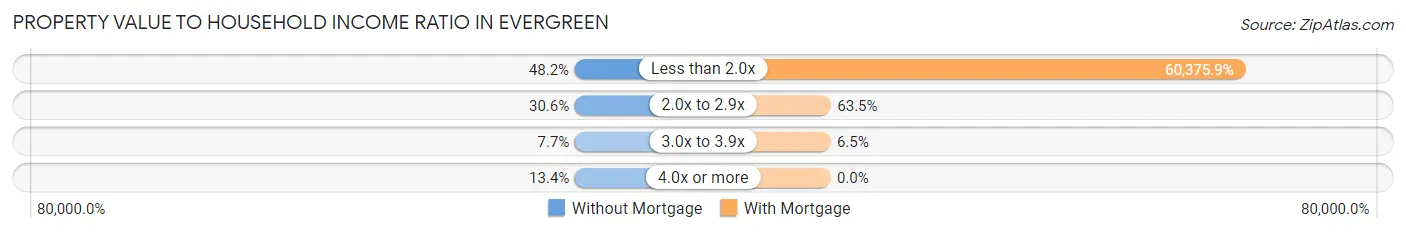
| Value-to-Income Ratio | Without Mortgage | With Mortgage |
| Less than 2.0x | 244 (48.2%) | 102,639 (60,375.9%) |
| 2.0x to 2.9x | 155 (30.6%) | 108 (63.5%) |
| 3.0x to 3.9x | 39 (7.7%) | 11 (6.5%) |
| 4.0x or more | 68 (13.4%) | 0 (0.0%) |
| Total | 506 (100.0%) | 170 (100.0%) |
Real Estate Taxes by Mortgage Status in Evergreen
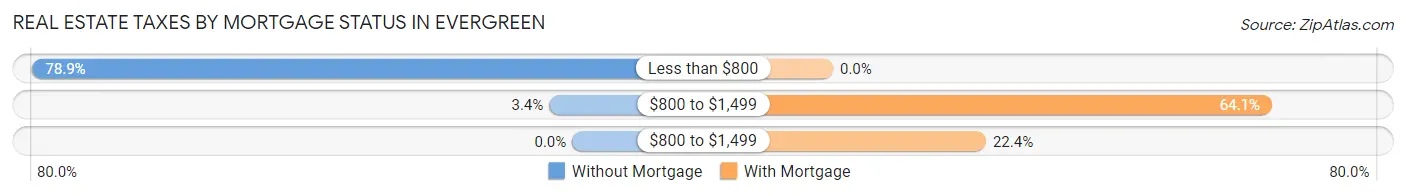
| Property Taxes | Without Mortgage | With Mortgage |
| Less than $800 | 399 (78.8%) | 0 (0.0%) |
| $800 to $1,499 | 17 (3.4%) | 109 (64.1%) |
| $800 to $1,499 | 0 (0.0%) | 38 (22.4%) |
| Total | 506 (100.0%) | 170 (100.0%) |
Health & Disability in Evergreen
Health Insurance Coverage by Age in Evergreen
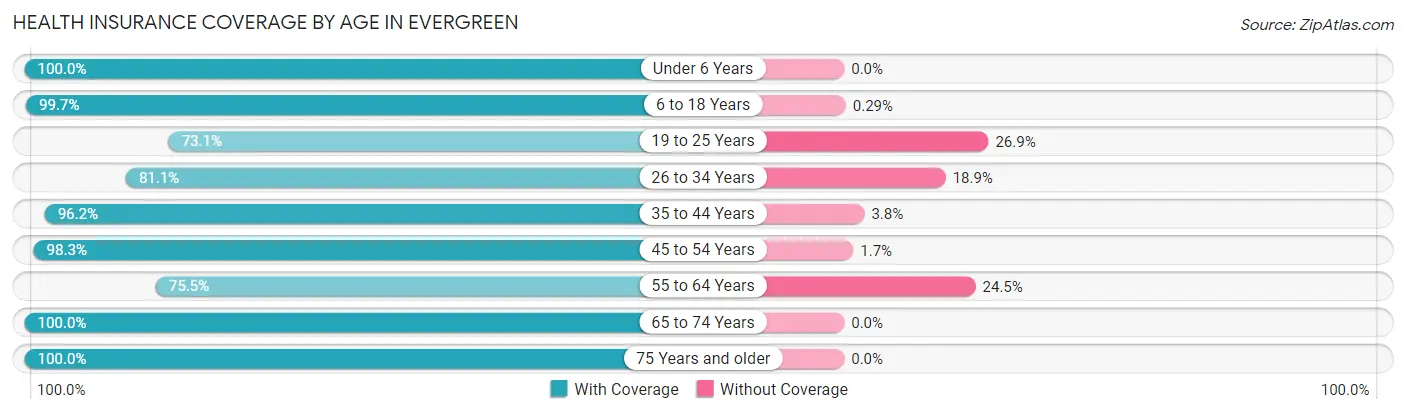
| Age Bracket | With Coverage | Without Coverage |
| Under 6 Years | 182 (100.0%) | 0 (0.0%) |
| 6 to 18 Years | 678 (99.7%) | 2 (0.3%) |
| 19 to 25 Years | 223 (73.1%) | 82 (26.9%) |
| 26 to 34 Years | 433 (81.1%) | 101 (18.9%) |
| 35 to 44 Years | 256 (96.2%) | 10 (3.8%) |
| 45 to 54 Years | 348 (98.3%) | 6 (1.7%) |
| 55 to 64 Years | 333 (75.5%) | 108 (24.5%) |
| 65 to 74 Years | 366 (100.0%) | 0 (0.0%) |
| 75 Years and older | 311 (100.0%) | 0 (0.0%) |
| Total | 3,130 (91.0%) | 309 (9.0%) |
Health Insurance Coverage by Citizenship Status in Evergreen
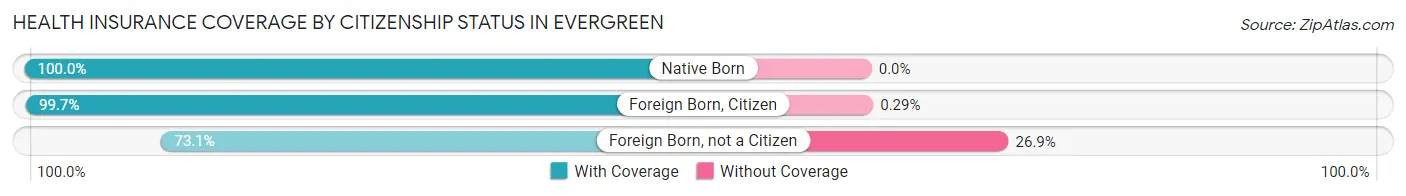
| Citizenship Status | With Coverage | Without Coverage |
| Native Born | 182 (100.0%) | 0 (0.0%) |
| Foreign Born, Citizen | 678 (99.7%) | 2 (0.3%) |
| Foreign Born, not a Citizen | 223 (73.1%) | 82 (26.9%) |
Health Insurance Coverage by Household Income in Evergreen
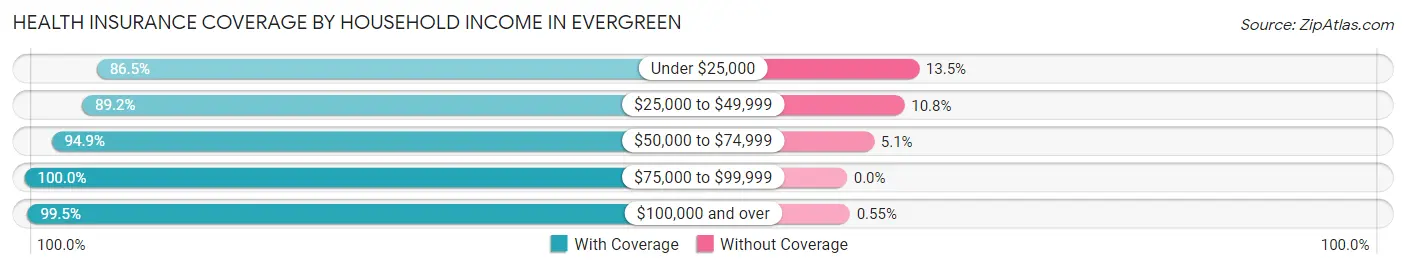
| Household Income | With Coverage | Without Coverage |
| Under $25,000 | 717 (86.5%) | 112 (13.5%) |
| $25,000 to $49,999 | 1,473 (89.2%) | 178 (10.8%) |
| $50,000 to $74,999 | 318 (94.9%) | 17 (5.1%) |
| $75,000 to $99,999 | 263 (100.0%) | 0 (0.0%) |
| $100,000 and over | 359 (99.5%) | 2 (0.5%) |
Public vs Private Health Insurance Coverage by Age in Evergreen
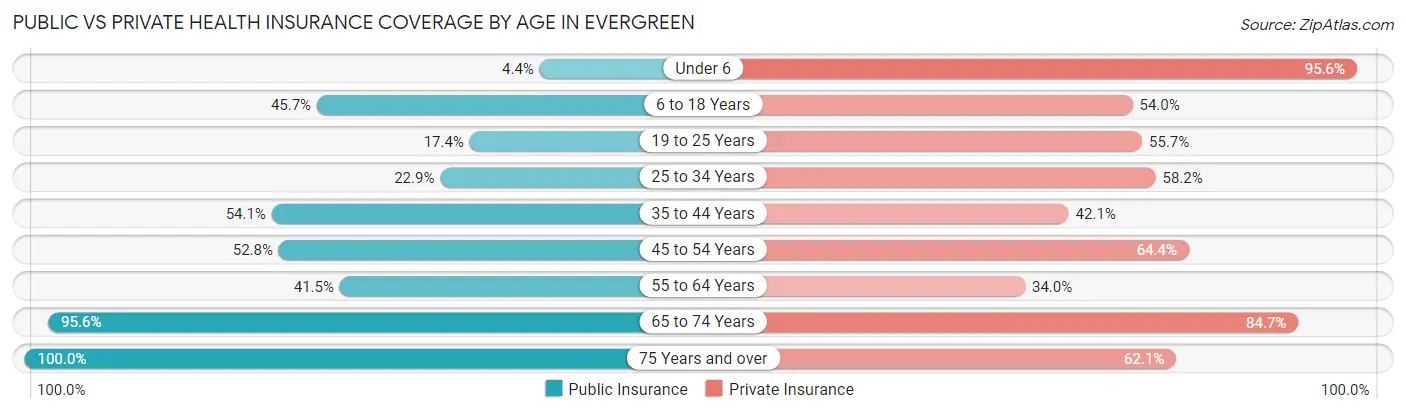
| Age Bracket | Public Insurance | Private Insurance |
| Under 6 | 8 (4.4%) | 174 (95.6%) |
| 6 to 18 Years | 311 (45.7%) | 367 (54.0%) |
| 19 to 25 Years | 53 (17.4%) | 170 (55.7%) |
| 25 to 34 Years | 122 (22.9%) | 311 (58.2%) |
| 35 to 44 Years | 144 (54.1%) | 112 (42.1%) |
| 45 to 54 Years | 187 (52.8%) | 228 (64.4%) |
| 55 to 64 Years | 183 (41.5%) | 150 (34.0%) |
| 65 to 74 Years | 350 (95.6%) | 310 (84.7%) |
| 75 Years and over | 311 (100.0%) | 193 (62.1%) |
| Total | 1,669 (48.5%) | 2,015 (58.6%) |
Disability Status by Sex by Age in Evergreen
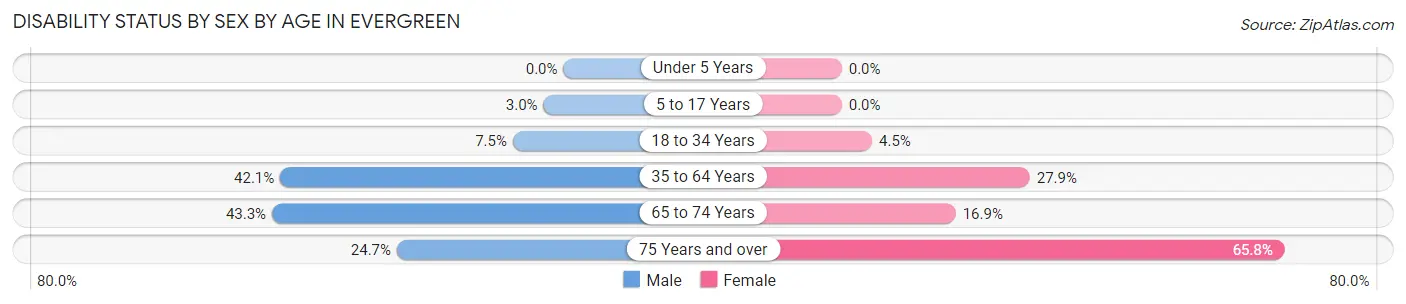
| Age Bracket | Male | Female |
| Under 5 Years | 0 (0.0%) | 0 (0.0%) |
| 5 to 17 Years | 11 (3.0%) | 0 (0.0%) |
| 18 to 34 Years | 28 (7.5%) | 22 (4.5%) |
| 35 to 64 Years | 151 (42.1%) | 196 (27.9%) |
| 65 to 74 Years | 74 (43.3%) | 33 (16.9%) |
| 75 Years and over | 22 (24.7%) | 146 (65.8%) |
Disability Class by Sex by Age in Evergreen
Disability Class: Hearing Difficulty
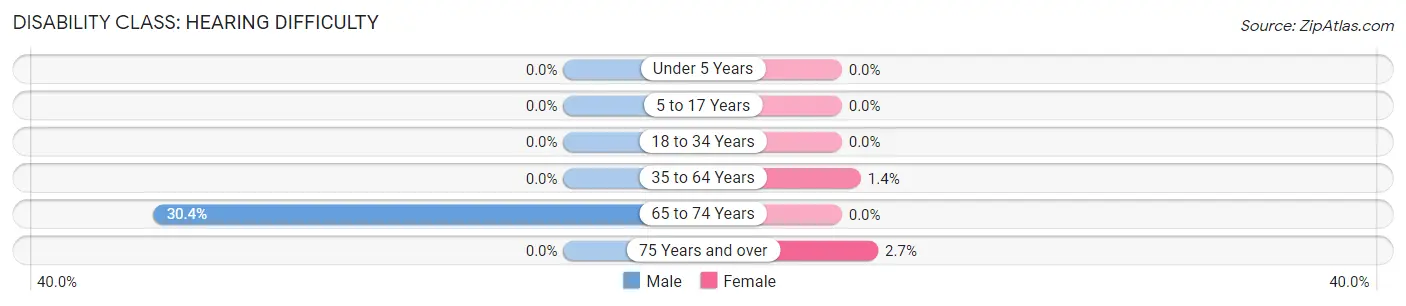
| Age Bracket | Male | Female |
| Under 5 Years | 0 (0.0%) | 0 (0.0%) |
| 5 to 17 Years | 0 (0.0%) | 0 (0.0%) |
| 18 to 34 Years | 0 (0.0%) | 0 (0.0%) |
| 35 to 64 Years | 0 (0.0%) | 10 (1.4%) |
| 65 to 74 Years | 52 (30.4%) | 0 (0.0%) |
| 75 Years and over | 0 (0.0%) | 6 (2.7%) |
Disability Class: Vision Difficulty
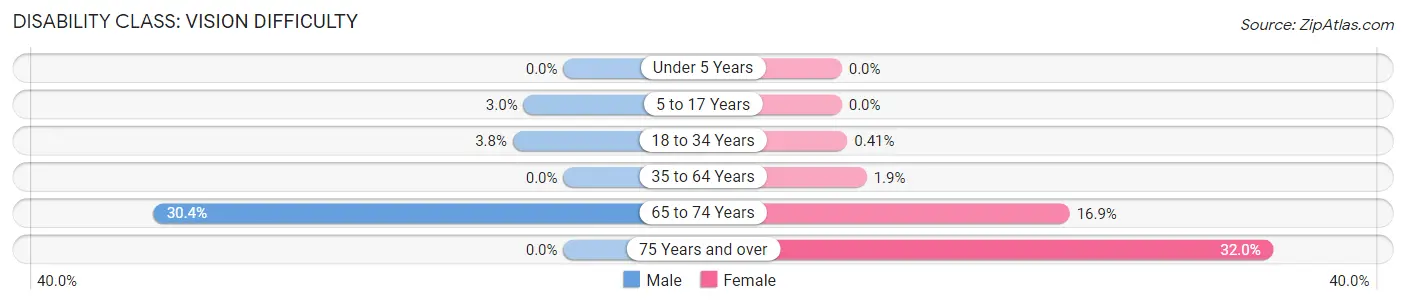
| Age Bracket | Male | Female |
| Under 5 Years | 0 (0.0%) | 0 (0.0%) |
| 5 to 17 Years | 11 (3.0%) | 0 (0.0%) |
| 18 to 34 Years | 14 (3.7%) | 2 (0.4%) |
| 35 to 64 Years | 0 (0.0%) | 13 (1.8%) |
| 65 to 74 Years | 52 (30.4%) | 33 (16.9%) |
| 75 Years and over | 0 (0.0%) | 71 (32.0%) |
Disability Class: Cognitive Difficulty
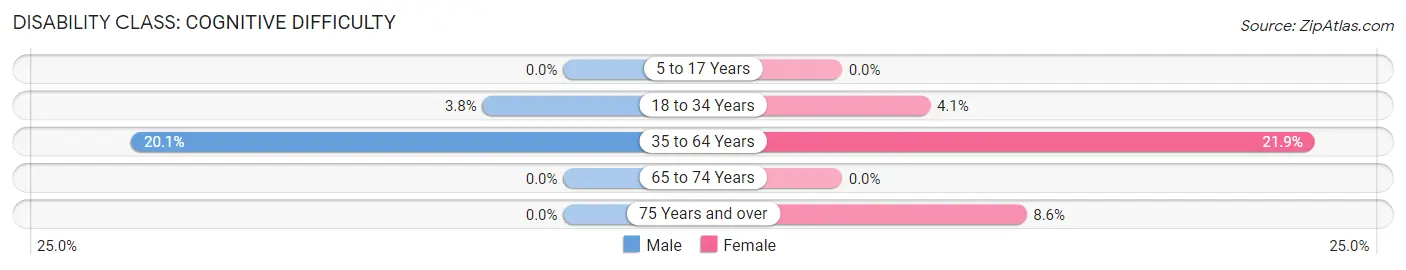
| Age Bracket | Male | Female |
| 5 to 17 Years | 0 (0.0%) | 0 (0.0%) |
| 18 to 34 Years | 14 (3.7%) | 20 (4.1%) |
| 35 to 64 Years | 72 (20.1%) | 154 (21.9%) |
| 65 to 74 Years | 0 (0.0%) | 0 (0.0%) |
| 75 Years and over | 0 (0.0%) | 19 (8.6%) |
Disability Class: Ambulatory Difficulty
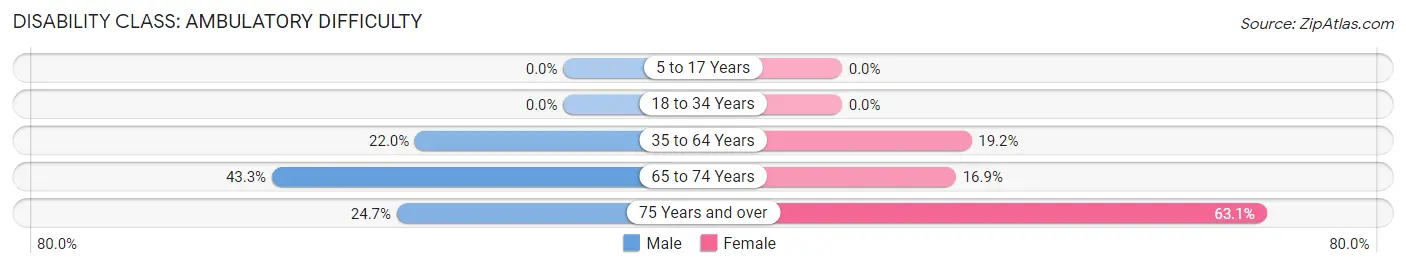
| Age Bracket | Male | Female |
| 5 to 17 Years | 0 (0.0%) | 0 (0.0%) |
| 18 to 34 Years | 0 (0.0%) | 0 (0.0%) |
| 35 to 64 Years | 79 (22.0%) | 135 (19.2%) |
| 65 to 74 Years | 74 (43.3%) | 33 (16.9%) |
| 75 Years and over | 22 (24.7%) | 140 (63.1%) |
Disability Class: Self-Care Difficulty
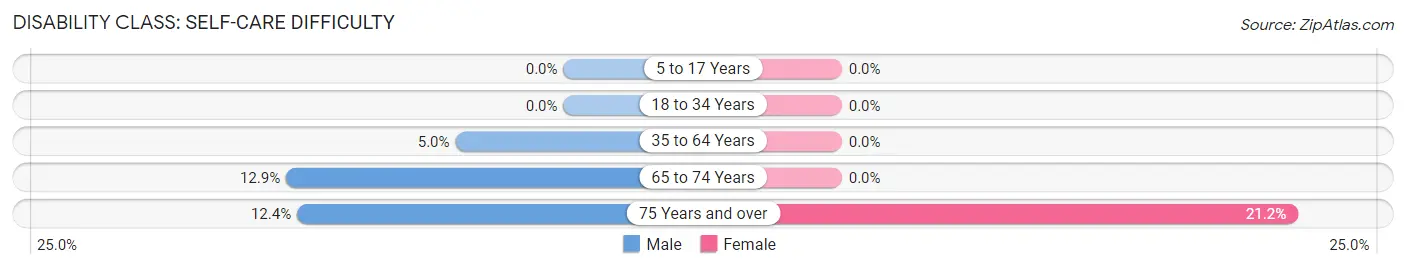
| Age Bracket | Male | Female |
| 5 to 17 Years | 0 (0.0%) | 0 (0.0%) |
| 18 to 34 Years | 0 (0.0%) | 0 (0.0%) |
| 35 to 64 Years | 18 (5.0%) | 0 (0.0%) |
| 65 to 74 Years | 22 (12.9%) | 0 (0.0%) |
| 75 Years and over | 11 (12.4%) | 47 (21.2%) |
Technology Access in Evergreen
Computing Device Access in Evergreen
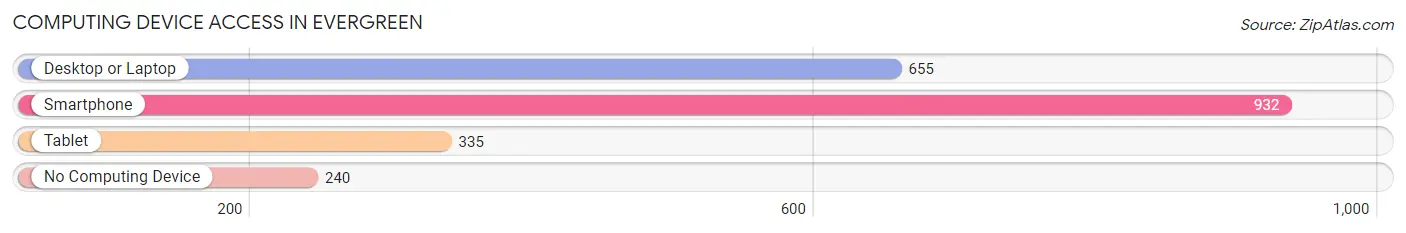
| Device Type | # Households | % Households |
| Desktop or Laptop | 655 | 50.2% |
| Smartphone | 932 | 71.5% |
| Tablet | 335 | 25.7% |
| No Computing Device | 240 | 18.4% |
| Total | 1,304 | 100.0% |
Internet Access in Evergreen
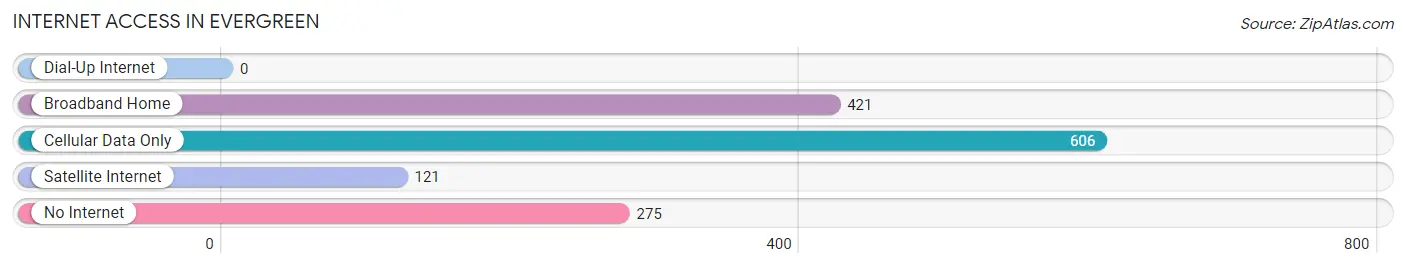
| Internet Type | # Households | % Households |
| Dial-Up Internet | 0 | 0.0% |
| Broadband Home | 421 | 32.3% |
| Cellular Data Only | 606 | 46.5% |
| Satellite Internet | 121 | 9.3% |
| No Internet | 275 | 21.1% |
| Total | 1,304 | 100.0% |
Evergreen Summary
History
The small town of Evergreen, Alabama is located in the southeastern corner of the state, in Conecuh County. The town was founded in 1819 and was originally known as “Evergreen Station” due to its location on the Mobile and Great Northern Railroad. The town was officially incorporated in 1887 and was named after the abundance of evergreen trees in the area.
The town was originally a farming community, with cotton being the main crop. The town also had a sawmill, gristmill, and a few stores. In the early 1900s, the town began to grow and develop, with the construction of a new school, a bank, and a post office.
In the 1920s, the town experienced a boom in population and economic growth. This was due to the discovery of oil in the area, which led to the construction of several oil refineries. The town also experienced a surge in tourism, as people from all over the country came to visit the nearby beaches.
In the 1950s, the town experienced a decline in population and economic activity. This was due to the closure of the oil refineries and the decline of the cotton industry. The town also experienced a decrease in tourism due to the development of nearby resorts.
In the late 1970s, the town began to experience a resurgence in population and economic activity. This was due to the development of the nearby military base, Fort Rucker, which brought in new jobs and businesses. The town also experienced a surge in tourism due to the development of nearby resorts and attractions.
Geography
Evergreen is located in the southeastern corner of Alabama, in Conecuh County. The town is situated on the banks of the Conecuh River, which flows through the town. The town is surrounded by rolling hills and forests, with the nearby beaches of the Gulf of Mexico being a popular tourist destination.
The town has a total area of 4.2 square miles, with 0.2 square miles of water. The town has a humid subtropical climate, with hot, humid summers and mild winters. The average temperature in the summer is around 80 degrees Fahrenheit, with the average winter temperature being around 50 degrees Fahrenheit.
Economy
The economy of Evergreen is largely based on tourism, with the nearby beaches and resorts being a popular destination for visitors. The town also has a few small businesses, such as restaurants, shops, and gas stations. The town is also home to a few manufacturing plants, which produce a variety of products.
The town is also home to Fort Rucker, a military base which provides jobs and economic activity to the area. The base is home to the United States Army Aviation Center of Excellence, which trains pilots and other personnel for the Army.
Demographics
As of the 2010 census, the population of Evergreen was 2,845. The town has a population density of 683 people per square mile. The median age of the population is 37.7 years, with 50.3% of the population being male and 49.7% being female.
The racial makeup of the town is 79.2% White, 17.3% African American, 0.7% Native American, 0.3% Asian, 0.1% Pacific Islander, 0.7% from other races, and 1.7% from two or more races. The median household income is $30,938, with 17.3% of the population living below the poverty line.
Common Questions
What is Per Capita Income in Evergreen?
Per Capita income in Evergreen is $19,455.
What is the Median Family Income in Evergreen?
Median Family Income in Evergreen is $45,417.
What is the Median Household income in Evergreen?
Median Household Income in Evergreen is $37,679.
What is Inequality or Gini Index in Evergreen?
Inequality or Gini Index in Evergreen is 0.48.
What is the Total Population of Evergreen?
Total Population of Evergreen is 3,497.
What is the Total Male Population of Evergreen?
Total Male Population of Evergreen is 1,545.
What is the Total Female Population of Evergreen?
Total Female Population of Evergreen is 1,952.
What is the Ratio of Males per 100 Females in Evergreen?
There are 79.15 Males per 100 Females in Evergreen.
What is the Ratio of Females per 100 Males in Evergreen?
There are 126.34 Females per 100 Males in Evergreen.
What is the Median Population Age in Evergreen?
Median Population Age in Evergreen is 36.0 Years.
What is the Average Family Size in Evergreen
Average Family Size in Evergreen is 4.0 People.
What is the Average Household Size in Evergreen
Average Household Size in Evergreen is 2.6 People.
How Large is the Labor Force in Evergreen?
There are 1,053 People in the Labor Forcein in Evergreen.
What is the Percentage of People in the Labor Force in Evergreen?
36.5% of People are in the Labor Force in Evergreen.
What is the Unemployment Rate in Evergreen?
Unemployment Rate in Evergreen is 6.6%.