Dadeville, AL Map & Demographics
Dadeville Map
Dadeville Overview
$22,639
PER CAPITA INCOME
$67,454
AVG FAMILY INCOME
$46,477
AVG HOUSEHOLD INCOME
21.0%
WAGE / INCOME GAP [ % ]
79.0¢/ $1
WAGE / INCOME GAP [ $ ]
0.45
INEQUALITY / GINI INDEX
3,062
TOTAL POPULATION
1,605
MALE POPULATION
1,457
FEMALE POPULATION
110.16
MALES / 100 FEMALES
90.78
FEMALES / 100 MALES
42.8
MEDIAN AGE
3.3
AVG FAMILY SIZE
2.4
AVG HOUSEHOLD SIZE
1,232
LABOR FORCE [ PEOPLE ]
47.0%
PERCENT IN LABOR FORCE
27.9%
UNEMPLOYMENT RATE
Dadeville Zip Codes
Dadeville Area Codes
Income in Dadeville
Income Overview in Dadeville
Per Capita Income in Dadeville is $22,639, while median incomes of families and households are $67,454 and $46,477 respectively.
| Characteristic | Number | Measure |
| Per Capita Income | 3,062 | $22,639 |
| Median Family Income | 661 | $67,454 |
| Mean Family Income | 661 | $72,134 |
| Median Household Income | 1,147 | $46,477 |
| Mean Household Income | 1,147 | $53,139 |
| Income Deficit | 661 | $0 |
| Wage / Income Gap (%) | 3,062 | 21.04% |
| Wage / Income Gap ($) | 3,062 | 78.96¢ per $1 |
| Gini / Inequality Index | 3,062 | 0.45 |
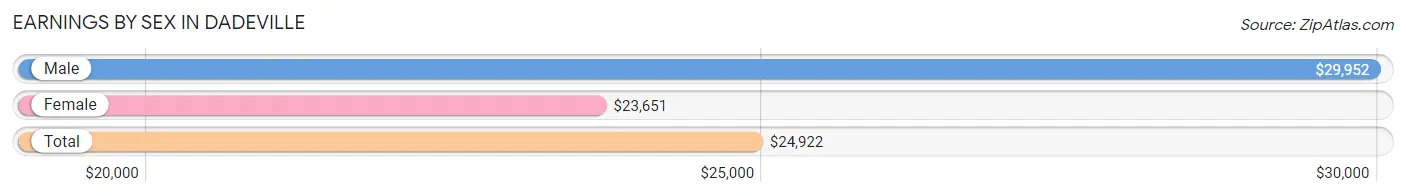
Earnings by Sex in Dadeville
Average Earnings in Dadeville are $24,922, $29,952 for men and $23,651 for women, a difference of 21.0%.
| Sex | Number | Average Earnings |
| Male | 641 (52.8%) | $29,952 |
| Female | 572 (47.2%) | $23,651 |
| Total | 1,213 (100.0%) | $24,922 |
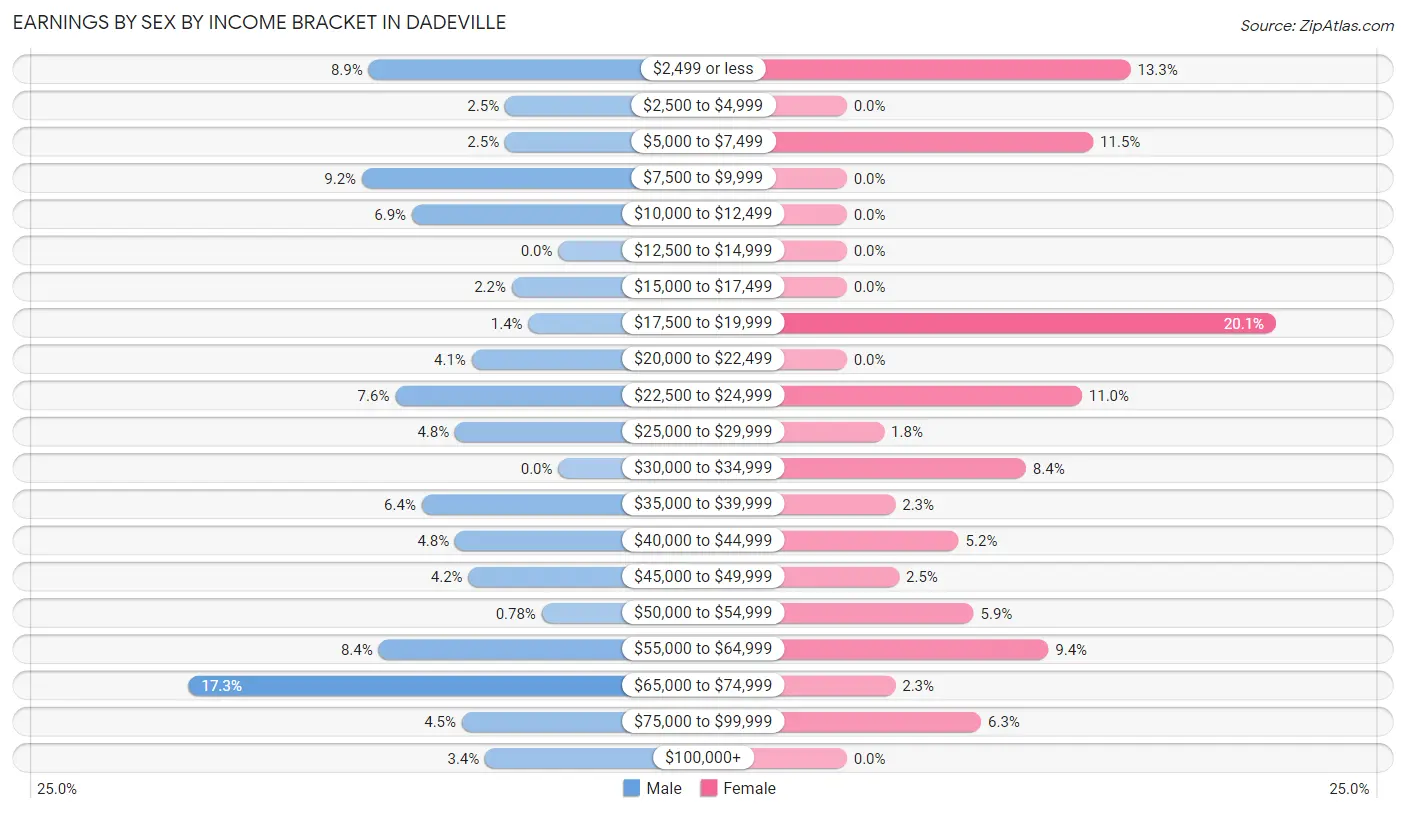
Earnings by Sex by Income Bracket in Dadeville
The most common earnings brackets in Dadeville are $65,000 to $74,999 for men (111 | 17.3%) and $17,500 to $19,999 for women (115 | 20.1%).
| Income | Male | Female |
| $2,499 or less | 57 (8.9%) | 76 (13.3%) |
| $2,500 to $4,999 | 16 (2.5%) | 0 (0.0%) |
| $5,000 to $7,499 | 16 (2.5%) | 66 (11.5%) |
| $7,500 to $9,999 | 59 (9.2%) | 0 (0.0%) |
| $10,000 to $12,499 | 44 (6.9%) | 0 (0.0%) |
| $12,500 to $14,999 | 0 (0.0%) | 0 (0.0%) |
| $15,000 to $17,499 | 14 (2.2%) | 0 (0.0%) |
| $17,500 to $19,999 | 9 (1.4%) | 115 (20.1%) |
| $20,000 to $22,499 | 26 (4.1%) | 0 (0.0%) |
| $22,500 to $24,999 | 49 (7.6%) | 63 (11.0%) |
| $25,000 to $29,999 | 31 (4.8%) | 10 (1.8%) |
| $30,000 to $34,999 | 0 (0.0%) | 48 (8.4%) |
| $35,000 to $39,999 | 41 (6.4%) | 13 (2.3%) |
| $40,000 to $44,999 | 31 (4.8%) | 30 (5.2%) |
| $45,000 to $49,999 | 27 (4.2%) | 14 (2.5%) |
| $50,000 to $54,999 | 5 (0.8%) | 34 (5.9%) |
| $55,000 to $64,999 | 54 (8.4%) | 54 (9.4%) |
| $65,000 to $74,999 | 111 (17.3%) | 13 (2.3%) |
| $75,000 to $99,999 | 29 (4.5%) | 36 (6.3%) |
| $100,000+ | 22 (3.4%) | 0 (0.0%) |
| Total | 641 (100.0%) | 572 (100.0%) |
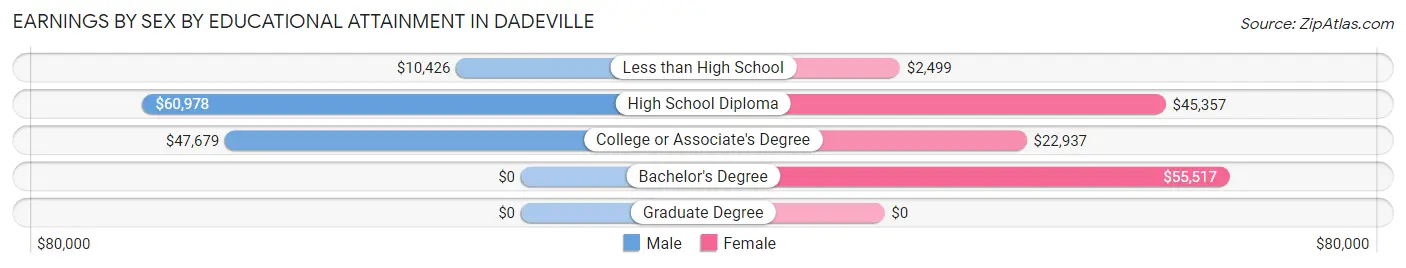
Earnings by Sex by Educational Attainment in Dadeville
Average earnings in Dadeville are $39,607 for men and $27,375 for women, a difference of 30.9%. Men with an educational attainment of high school diploma enjoy the highest average annual earnings of $60,978, while those with less than high school education earn the least with $10,426. Women with an educational attainment of bachelor's degree earn the most with the average annual earnings of $55,517, while those with less than high school education have the smallest earnings of $2,499.
| Educational Attainment | Male Income | Female Income |
| Less than High School | $10,426 | $2,499 |
| High School Diploma | $60,978 | $45,357 |
| College or Associate's Degree | $47,679 | $22,937 |
| Bachelor's Degree | - | - |
| Graduate Degree | - | - |
| Total | $39,607 | $27,375 |
Family Income in Dadeville
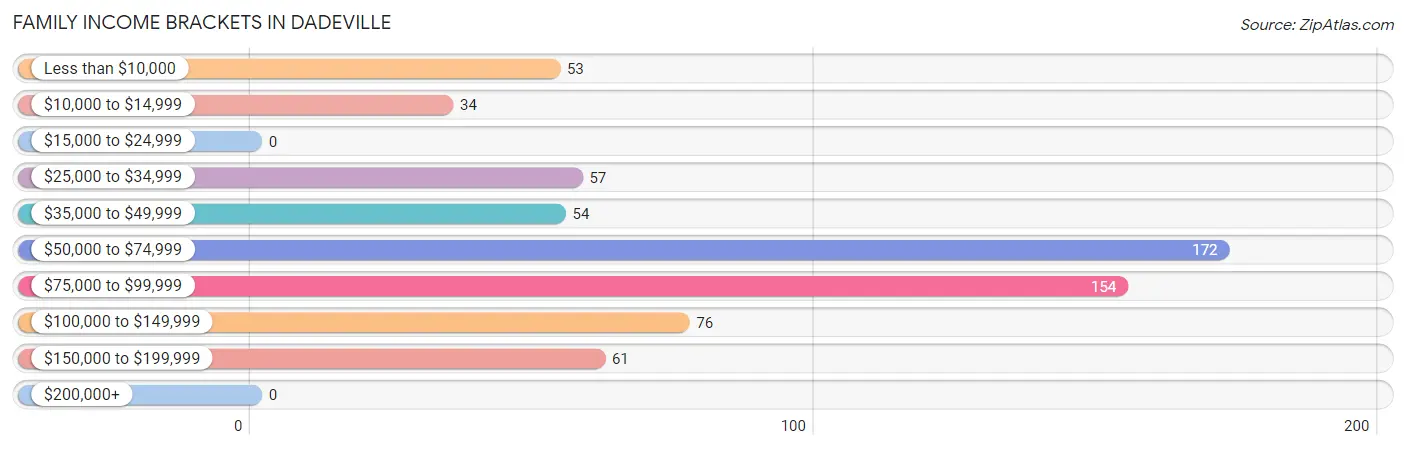
Family Income Brackets in Dadeville
According to the Dadeville family income data, there are 172 families falling into the $50,000 to $74,999 income range, which is the most common income bracket and makes up 26.0% of all families.
| Income Bracket | # Families | % Families |
| Less than $10,000 | 53 | 8.0% |
| $10,000 to $14,999 | 34 | 5.1% |
| $15,000 to $24,999 | 0 | 0.0% |
| $25,000 to $34,999 | 57 | 8.6% |
| $35,000 to $49,999 | 54 | 8.2% |
| $50,000 to $74,999 | 172 | 26.0% |
| $75,000 to $99,999 | 154 | 23.3% |
| $100,000 to $149,999 | 76 | 11.5% |
| $150,000 to $199,999 | 61 | 9.2% |
| $200,000+ | 0 | 0.0% |
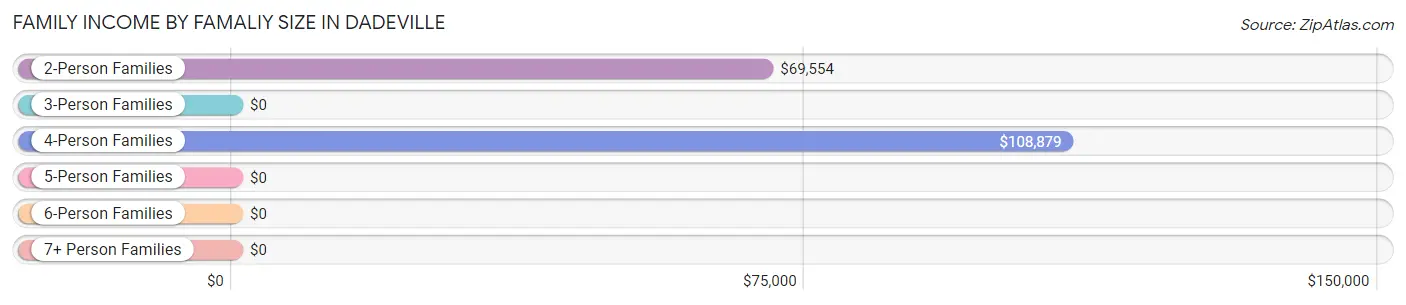
Family Income by Famaliy Size in Dadeville
4-person families (124 | 18.8%) account for the highest median family income in Dadeville with $108,879 per family, while 2-person families (303 | 45.8%) have the highest median income of $34,777 per family member.
| Income Bracket | # Families | Median Income |
| 2-Person Families | 303 (45.8%) | $69,554 |
| 3-Person Families | 212 (32.1%) | $0 |
| 4-Person Families | 124 (18.8%) | $108,879 |
| 5-Person Families | 0 (0.0%) | $0 |
| 6-Person Families | 0 (0.0%) | $0 |
| 7+ Person Families | 22 (3.3%) | $0 |
| Total | 661 (100.0%) | $67,454 |
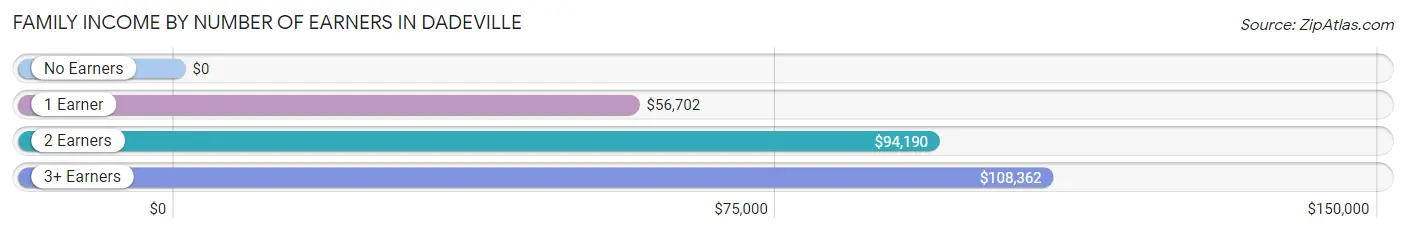
Family Income by Number of Earners in Dadeville
| Number of Earners | # Families | Median Income |
| No Earners | 114 (17.2%) | $0 |
| 1 Earner | 350 (52.9%) | $56,702 |
| 2 Earners | 133 (20.1%) | $94,190 |
| 3+ Earners | 64 (9.7%) | $108,362 |
| Total | 661 (100.0%) | $67,454 |
Household Income in Dadeville
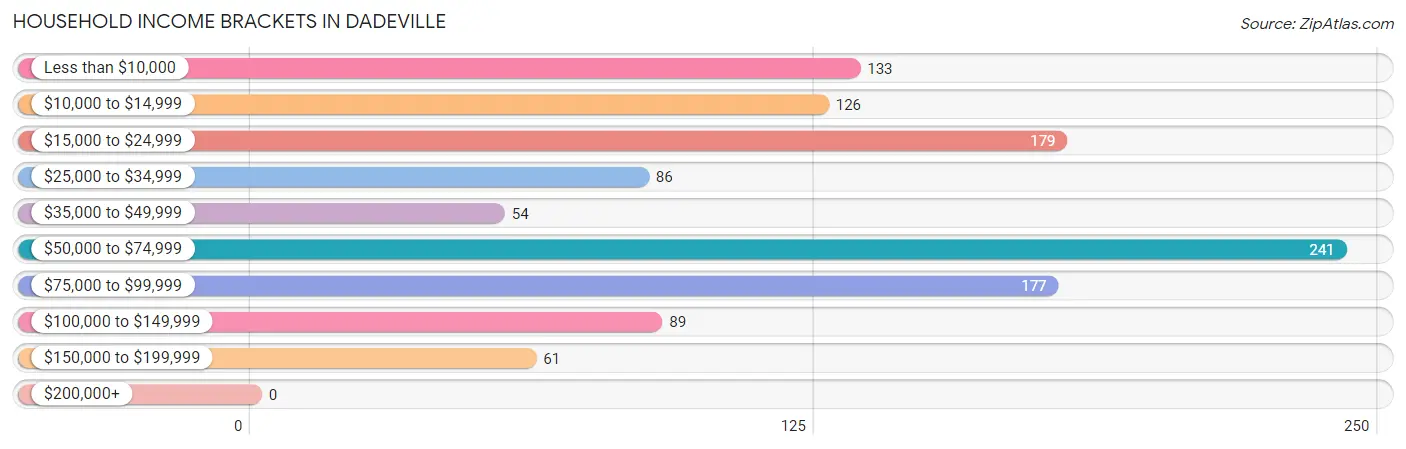
Household Income Brackets in Dadeville
With 241 households falling in the category, the $50,000 to $74,999 income range is the most frequent in Dadeville, accounting for 21.0% of all households.
| Income Bracket | # Households | % Households |
| Less than $10,000 | 133 | 11.6% |
| $10,000 to $14,999 | 126 | 11.0% |
| $15,000 to $24,999 | 179 | 15.6% |
| $25,000 to $34,999 | 86 | 7.5% |
| $35,000 to $49,999 | 54 | 4.7% |
| $50,000 to $74,999 | 241 | 21.0% |
| $75,000 to $99,999 | 177 | 15.4% |
| $100,000 to $149,999 | 89 | 7.8% |
| $150,000 to $199,999 | 61 | 5.3% |
| $200,000+ | 0 | 0.0% |
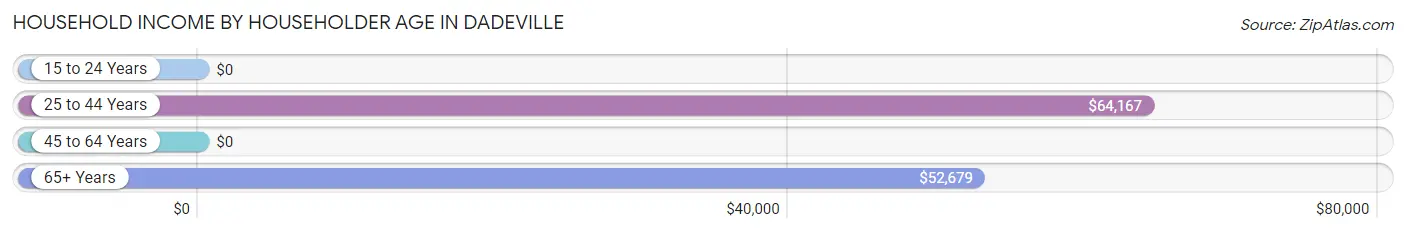
Household Income by Householder Age in Dadeville
The median household income in Dadeville is $46,477, with the highest median household income of $64,167 found in the 25 to 44 years age bracket for the primary householder. A total of 348 households (30.3%) fall into this category.
| Income Bracket | # Households | Median Income |
| 15 to 24 Years | 0 (0.0%) | $0 |
| 25 to 44 Years | 348 (30.3%) | $64,167 |
| 45 to 64 Years | 455 (39.7%) | $0 |
| 65+ Years | 344 (30.0%) | $52,679 |
| Total | 1,147 (100.0%) | $46,477 |
Poverty in Dadeville
Income Below Poverty by Sex and Age in Dadeville
With 23.0% poverty level for males and 13.8% for females among the residents of Dadeville, 12 to 14 year old males and 35 to 44 year old females are the most vulnerable to poverty, with 30 males (100.0%) and 83 females (33.6%) in their respective age groups living below the poverty level.
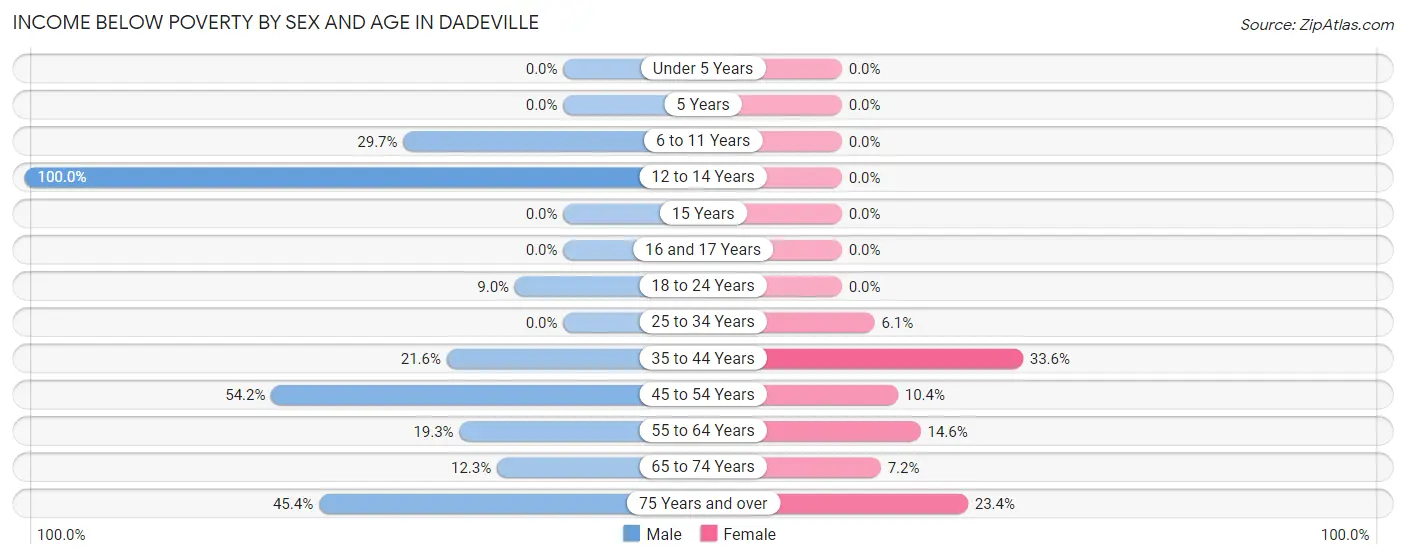
| Age Bracket | Male | Female |
| Under 5 Years | 0 (0.0%) | 0 (0.0%) |
| 5 Years | 0 (0.0%) | 0 (0.0%) |
| 6 to 11 Years | 30 (29.7%) | 0 (0.0%) |
| 12 to 14 Years | 30 (100.0%) | 0 (0.0%) |
| 15 Years | 0 (0.0%) | 0 (0.0%) |
| 16 and 17 Years | 0 (0.0%) | 0 (0.0%) |
| 18 to 24 Years | 15 (9.0%) | 0 (0.0%) |
| 25 to 34 Years | 0 (0.0%) | 9 (6.1%) |
| 35 to 44 Years | 53 (21.6%) | 83 (33.6%) |
| 45 to 54 Years | 103 (54.2%) | 8 (10.4%) |
| 55 to 64 Years | 38 (19.3%) | 45 (14.6%) |
| 65 to 74 Years | 16 (12.3%) | 7 (7.2%) |
| 75 Years and over | 44 (45.4%) | 40 (23.4%) |
| Total | 329 (23.0%) | 192 (13.8%) |
Income Above Poverty by Sex and Age in Dadeville
According to the poverty statistics in Dadeville, males aged under 5 years and females aged under 5 years are the age groups that are most secure financially, with 100.0% of males and 100.0% of females in these age groups living above the poverty line.
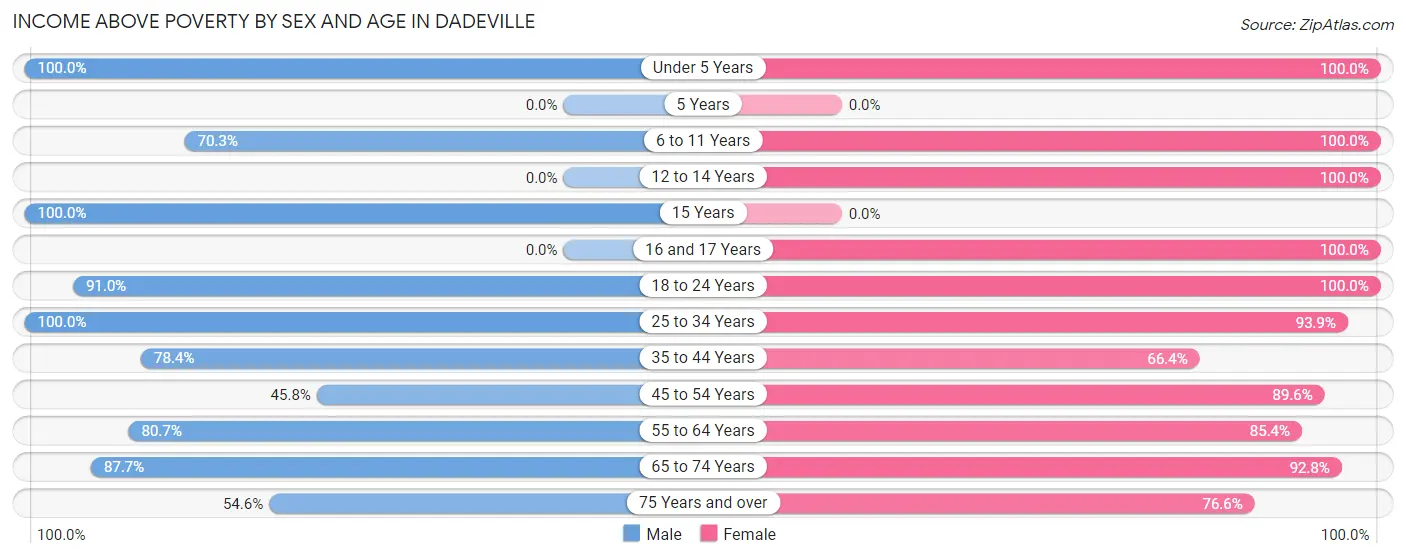
| Age Bracket | Male | Female |
| Under 5 Years | 103 (100.0%) | 64 (100.0%) |
| 5 Years | 0 (0.0%) | 0 (0.0%) |
| 6 to 11 Years | 71 (70.3%) | 102 (100.0%) |
| 12 to 14 Years | 0 (0.0%) | 28 (100.0%) |
| 15 Years | 13 (100.0%) | 0 (0.0%) |
| 16 and 17 Years | 0 (0.0%) | 26 (100.0%) |
| 18 to 24 Years | 152 (91.0%) | 121 (100.0%) |
| 25 to 34 Years | 157 (100.0%) | 139 (93.9%) |
| 35 to 44 Years | 192 (78.4%) | 164 (66.4%) |
| 45 to 54 Years | 87 (45.8%) | 69 (89.6%) |
| 55 to 64 Years | 159 (80.7%) | 263 (85.4%) |
| 65 to 74 Years | 114 (87.7%) | 90 (92.8%) |
| 75 Years and over | 53 (54.6%) | 131 (76.6%) |
| Total | 1,101 (77.0%) | 1,197 (86.2%) |
Income Below Poverty Among Married-Couple Families in Dadeville
The poverty statistics for married-couple families in Dadeville show that 6.5% or 34 of the total 522 families live below the poverty line. Families with no children have the highest poverty rate of 8.3%, comprising of 34 families. On the other hand, families with 1 or 2 children have the lowest poverty rate of 0.0%, which includes 0 families.
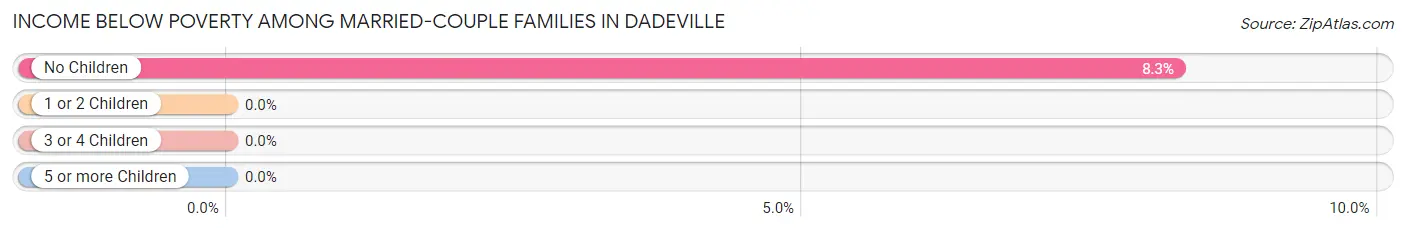
| Children | Above Poverty | Below Poverty |
| No Children | 378 (91.7%) | 34 (8.3%) |
| 1 or 2 Children | 88 (100.0%) | 0 (0.0%) |
| 3 or 4 Children | 22 (100.0%) | 0 (0.0%) |
| 5 or more Children | 0 (0.0%) | 0 (0.0%) |
| Total | 488 (93.5%) | 34 (6.5%) |
Income Below Poverty Among Single-Parent Households in Dadeville
According to the poverty data in Dadeville, 47.3% or 44 single-father households and 19.6% or 9 single-mother households are living below the poverty line. Among single-father households, those with 1 or 2 children have the highest poverty rate, with 44 households (47.3%) experiencing poverty. Likewise, among single-mother households, those with no children have the highest poverty rate, with 9 households (100.0%) falling below the poverty line.
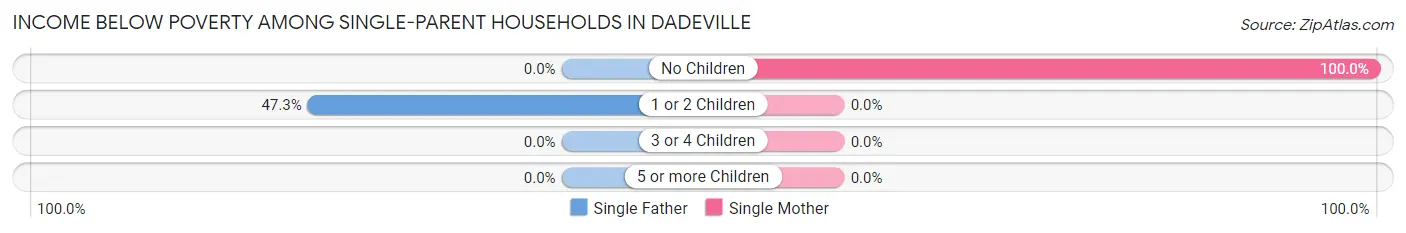
| Children | Single Father | Single Mother |
| No Children | 0 (0.0%) | 9 (100.0%) |
| 1 or 2 Children | 44 (47.3%) | 0 (0.0%) |
| 3 or 4 Children | 0 (0.0%) | 0 (0.0%) |
| 5 or more Children | 0 (0.0%) | 0 (0.0%) |
| Total | 44 (47.3%) | 9 (19.6%) |
Income Below Poverty Among Married-Couple vs Single-Parent Households in Dadeville
The poverty data for Dadeville shows that 34 of the married-couple family households (6.5%) and 53 of the single-parent households (38.1%) are living below the poverty level. Within the married-couple family households, those with no children have the highest poverty rate, with 34 households (8.3%) falling below the poverty line. Among the single-parent households, those with no children have the highest poverty rate, with 9 household (100.0%) living below poverty.
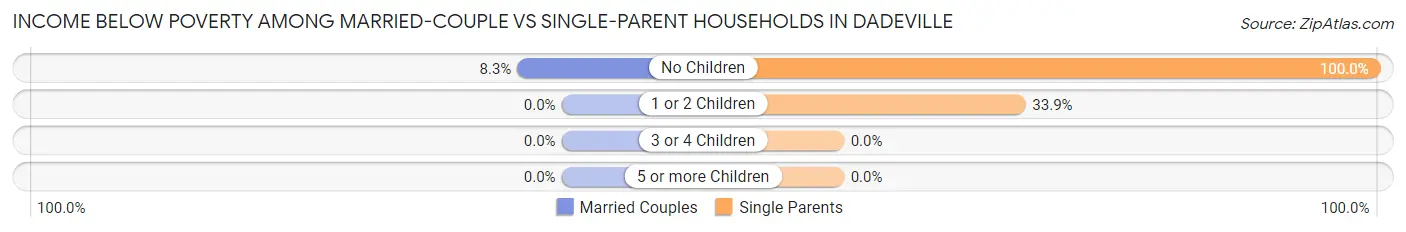
| Children | Married-Couple Families | Single-Parent Households |
| No Children | 34 (8.3%) | 9 (100.0%) |
| 1 or 2 Children | 0 (0.0%) | 44 (33.9%) |
| 3 or 4 Children | 0 (0.0%) | 0 (0.0%) |
| 5 or more Children | 0 (0.0%) | 0 (0.0%) |
| Total | 34 (6.5%) | 53 (38.1%) |
Race in Dadeville
The most populous races in Dadeville are White / Caucasian (1,975 | 64.5%), Black / African American (1,065 | 34.8%), and Two or more Races (16 | 0.5%).
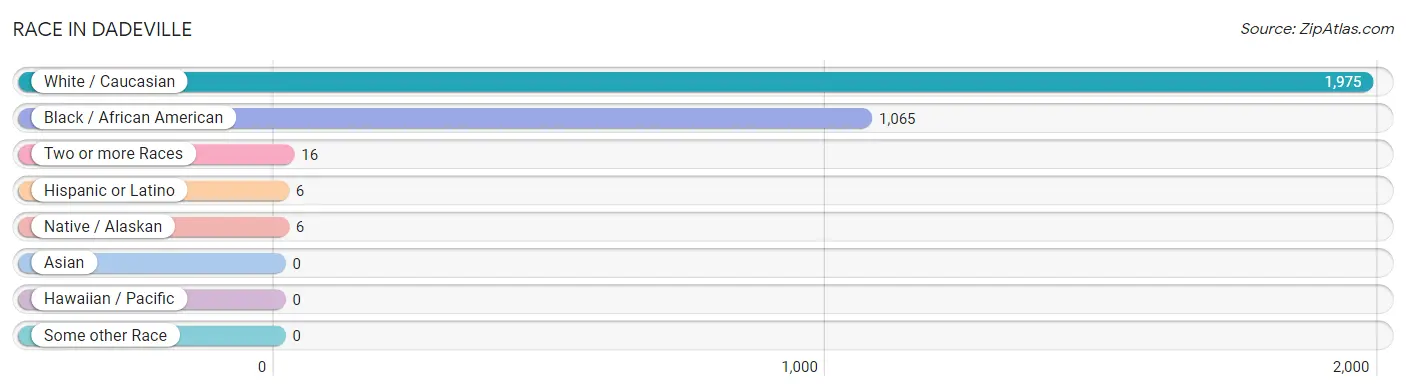
| Race | # Population | % Population |
| Asian | 0 | 0.0% |
| Black / African American | 1,065 | 34.8% |
| Hawaiian / Pacific | 0 | 0.0% |
| Hispanic or Latino | 6 | 0.2% |
| Native / Alaskan | 6 | 0.2% |
| White / Caucasian | 1,975 | 64.5% |
| Two or more Races | 16 | 0.5% |
| Some other Race | 0 | 0.0% |
| Total | 3,062 | 100.0% |
Ancestry in Dadeville
The most populous ancestries reported in Dadeville are American (503 | 16.4%), Irish (474 | 15.5%), English (279 | 9.1%), German (166 | 5.4%), and Italian (98 | 3.2%), together accounting for 49.6% of all Dadeville residents.
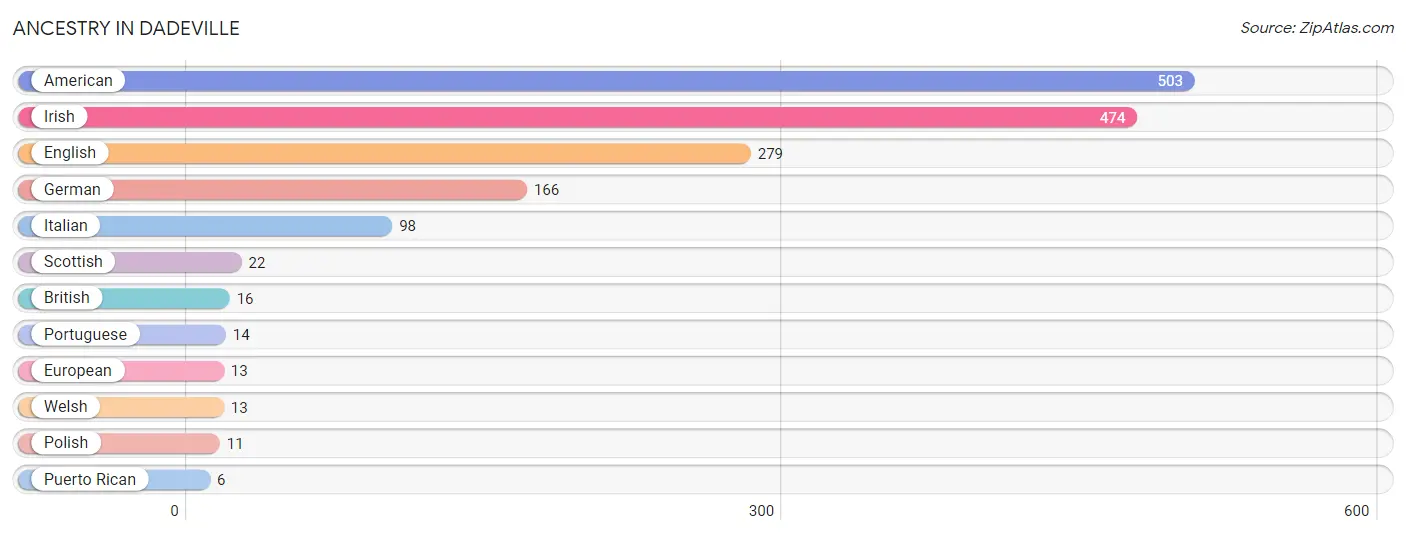
| Ancestry | # Population | % Population |
| American | 503 | 16.4% |
| British | 16 | 0.5% |
| English | 279 | 9.1% |
| European | 13 | 0.4% |
| German | 166 | 5.4% |
| Irish | 474 | 15.5% |
| Italian | 98 | 3.2% |
| Polish | 11 | 0.4% |
| Portuguese | 14 | 0.5% |
| Puerto Rican | 6 | 0.2% |
| Scottish | 22 | 0.7% |
| Welsh | 13 | 0.4% | View All 12 Rows |
Immigrants in Dadeville

| Immigration Origin | # Population | % Population | View All 0 Rows |
Sex and Age in Dadeville
Sex and Age in Dadeville
The most populous age groups in Dadeville are 55 to 59 Years (154 | 9.6%) for men and 55 to 59 Years (195 | 13.4%) for women.
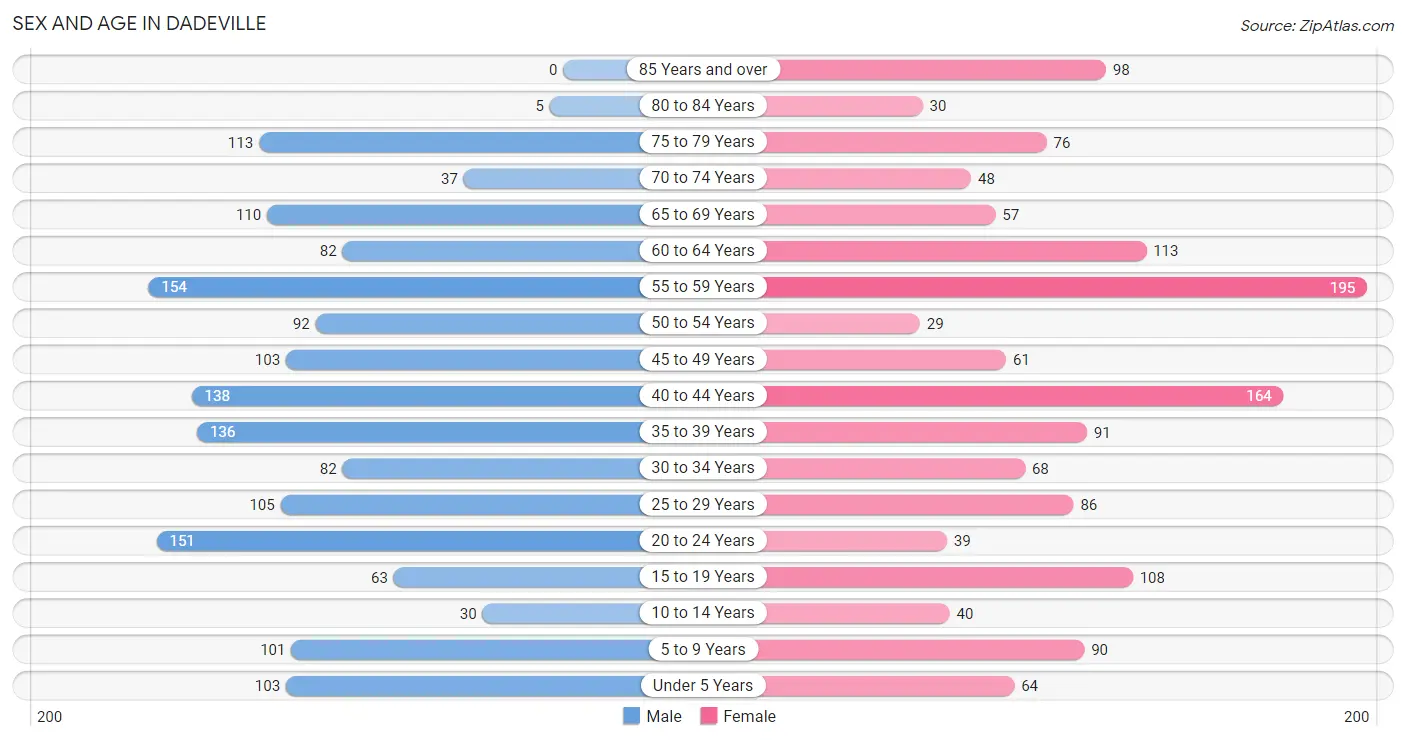
| Age Bracket | Male | Female |
| Under 5 Years | 103 (6.4%) | 64 (4.4%) |
| 5 to 9 Years | 101 (6.3%) | 90 (6.2%) |
| 10 to 14 Years | 30 (1.9%) | 40 (2.8%) |
| 15 to 19 Years | 63 (3.9%) | 108 (7.4%) |
| 20 to 24 Years | 151 (9.4%) | 39 (2.7%) |
| 25 to 29 Years | 105 (6.5%) | 86 (5.9%) |
| 30 to 34 Years | 82 (5.1%) | 68 (4.7%) |
| 35 to 39 Years | 136 (8.5%) | 91 (6.2%) |
| 40 to 44 Years | 138 (8.6%) | 164 (11.3%) |
| 45 to 49 Years | 103 (6.4%) | 61 (4.2%) |
| 50 to 54 Years | 92 (5.7%) | 29 (2.0%) |
| 55 to 59 Years | 154 (9.6%) | 195 (13.4%) |
| 60 to 64 Years | 82 (5.1%) | 113 (7.8%) |
| 65 to 69 Years | 110 (6.9%) | 57 (3.9%) |
| 70 to 74 Years | 37 (2.3%) | 48 (3.3%) |
| 75 to 79 Years | 113 (7.0%) | 76 (5.2%) |
| 80 to 84 Years | 5 (0.3%) | 30 (2.1%) |
| 85 Years and over | 0 (0.0%) | 98 (6.7%) |
| Total | 1,605 (100.0%) | 1,457 (100.0%) |
Families and Households in Dadeville
Median Family Size in Dadeville
The median family size in Dadeville is 3.29 persons per family, with single female/mother families (46 | 7.0%) accounting for the largest median family size of 3.52 persons per family. On the other hand, married-couple families (522 | 79.0%) represent the smallest median family size with 3.26 persons per family.
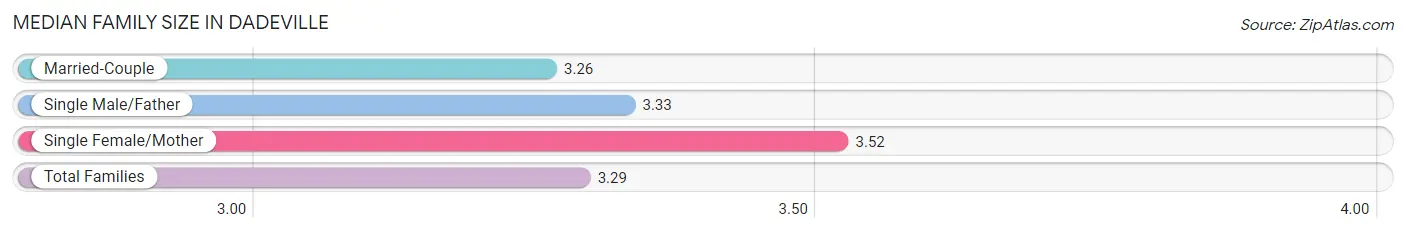
| Family Type | # Families | Family Size |
| Married-Couple | 522 (79.0%) | 3.26 |
| Single Male/Father | 93 (14.1%) | 3.33 |
| Single Female/Mother | 46 (7.0%) | 3.52 |
| Total Families | 661 (100.0%) | 3.29 |
Median Household Size in Dadeville
The median household size in Dadeville is 2.44 persons per household, with single male/father households (93 | 8.1%) accounting for the largest median household size of 4.05 persons per household. non-family households (486 | 42.4%) represent the smallest median household size with 1.15 persons per household.
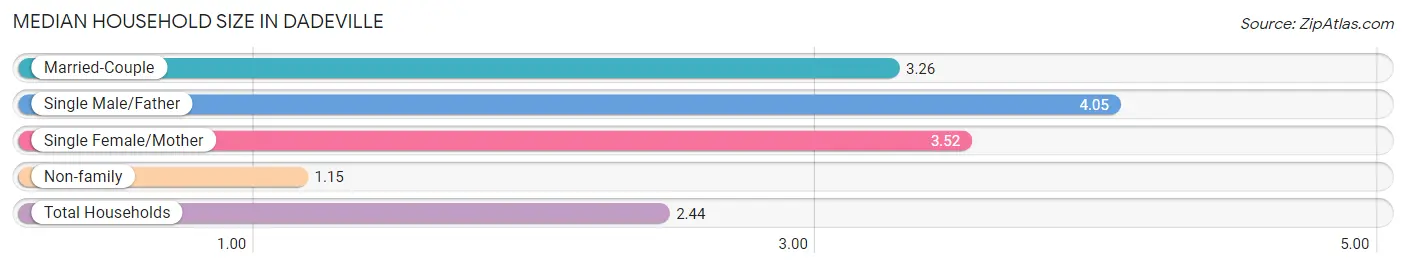
| Household Type | # Households | Household Size |
| Married-Couple | 522 (45.5%) | 3.26 |
| Single Male/Father | 93 (8.1%) | 4.05 |
| Single Female/Mother | 46 (4.0%) | 3.52 |
| Non-family | 486 (42.4%) | 1.15 |
| Total Households | 1,147 (100.0%) | 2.44 |
Household Size by Marriage Status in Dadeville
Out of a total of 1,147 households in Dadeville, 661 (57.6%) are family households, while 486 (42.4%) are nonfamily households. The most numerous type of family households are 2-person households, comprising 289, and the most common type of nonfamily households are 1-person households, comprising 424.
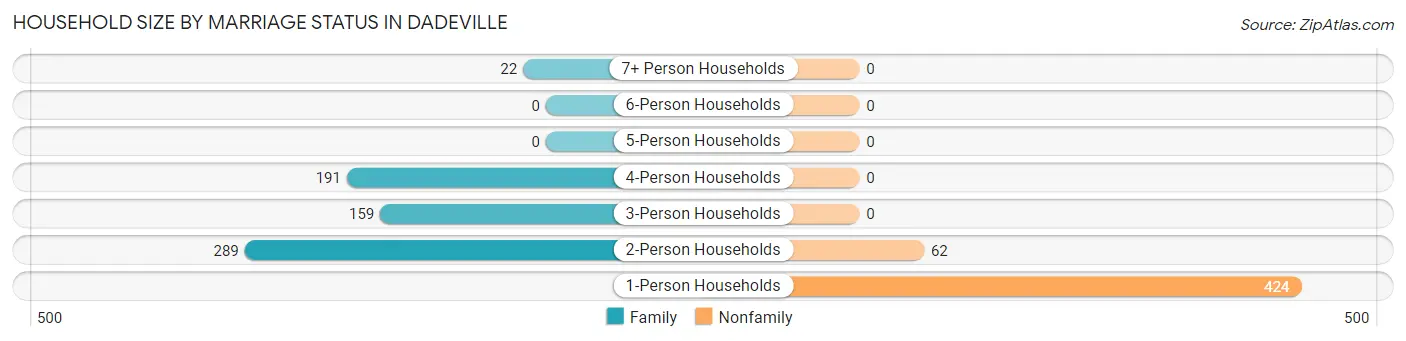
| Household Size | Family Households | Nonfamily Households |
| 1-Person Households | - | 424 (37.0%) |
| 2-Person Households | 289 (25.2%) | 62 (5.4%) |
| 3-Person Households | 159 (13.9%) | 0 (0.0%) |
| 4-Person Households | 191 (16.7%) | 0 (0.0%) |
| 5-Person Households | 0 (0.0%) | 0 (0.0%) |
| 6-Person Households | 0 (0.0%) | 0 (0.0%) |
| 7+ Person Households | 22 (1.9%) | 0 (0.0%) |
| Total | 661 (57.6%) | 486 (42.4%) |
Female Fertility in Dadeville
Fertility by Age in Dadeville
Average fertility rate in Dadeville is 97.0 births per 1,000 women. Women in the age bracket of 20 to 34 years have the highest fertility rate with 124.0 births per 1,000 women. Women in the age bracket of 35 to 50 years acount for 49.2% of all women with births.
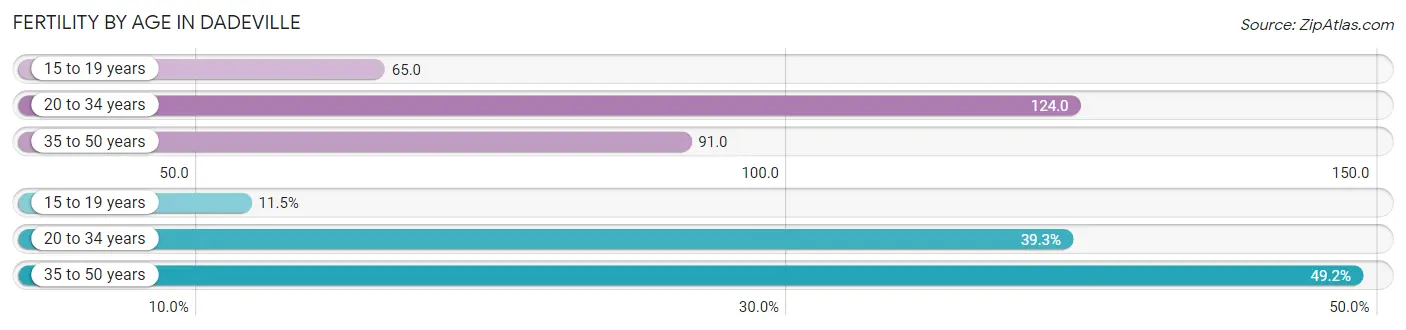
| Age Bracket | Women with Births | Births / 1,000 Women |
| 15 to 19 years | 7 (11.5%) | 65.0 |
| 20 to 34 years | 24 (39.3%) | 124.0 |
| 35 to 50 years | 30 (49.2%) | 91.0 |
| Total | 61 (100.0%) | 97.0 |
Fertility by Age by Marriage Status in Dadeville
49.2% of women with births (61) in Dadeville are married. The highest percentage of unmarried women with births falls into 15 to 19 years age bracket with 100.0% of them unmarried at the time of birth, while the lowest percentage of unmarried women with births belong to 35 to 50 years age bracket with 0.0% of them unmarried.
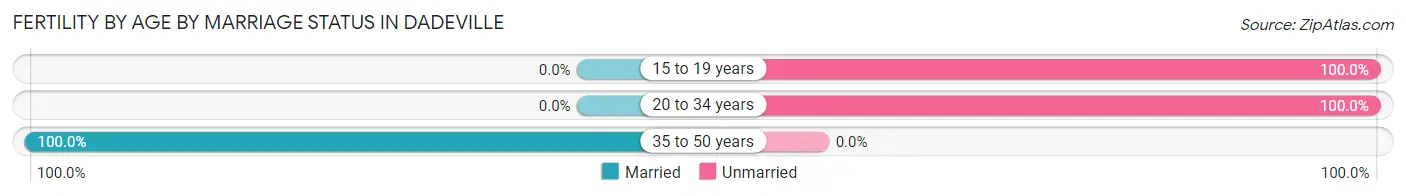
| Age Bracket | Married | Unmarried |
| 15 to 19 years | 0 (0.0%) | 7 (100.0%) |
| 20 to 34 years | 0 (0.0%) | 24 (100.0%) |
| 35 to 50 years | 30 (100.0%) | 0 (0.0%) |
| Total | 30 (49.2%) | 31 (50.8%) |
Fertility by Education in Dadeville
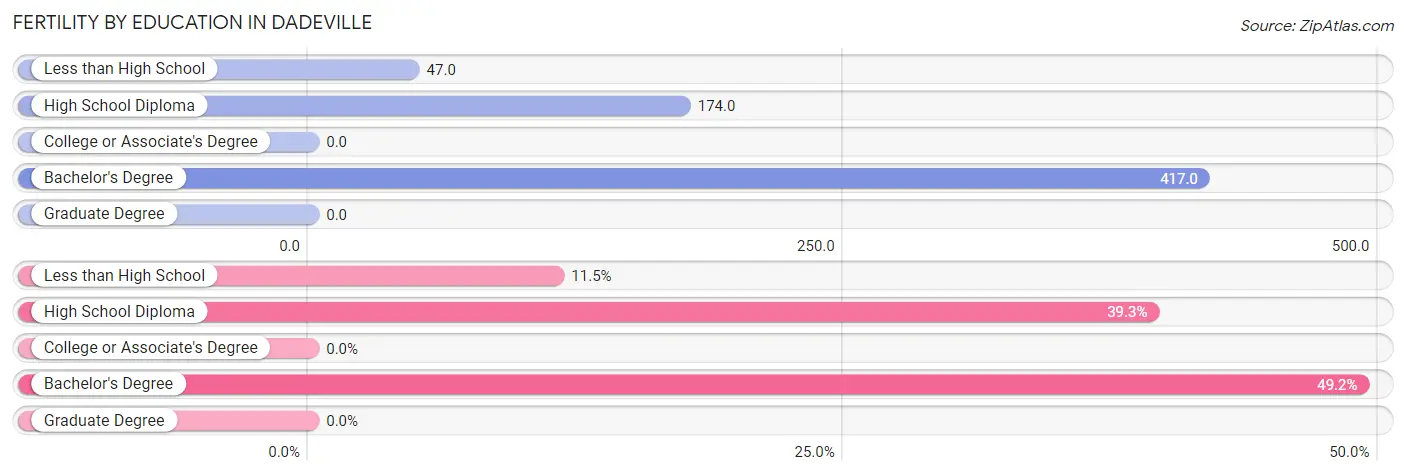
| Educational Attainment | Women with Births | Births / 1,000 Women |
| Less than High School | 7 (11.5%) | 47.0 |
| High School Diploma | 24 (39.3%) | 174.0 |
| College or Associate's Degree | 0 (0.0%) | 0.0 |
| Bachelor's Degree | 30 (49.2%) | 417.0 |
| Graduate Degree | 0 (0.0%) | 0.0 |
| Total | 61 (100.0%) | 97.0 |
Fertility by Education by Marriage Status in Dadeville
50.8% of women with births in Dadeville are unmarried. Women with the educational attainment of bachelor's degree are most likely to be married with 100.0% of them married at childbirth, while women with the educational attainment of less than high school are least likely to be married with 100.0% of them unmarried at childbirth.
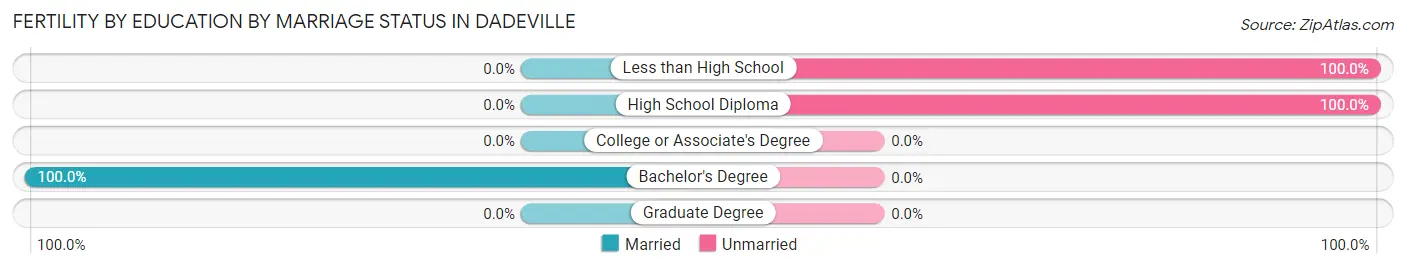
| Educational Attainment | Married | Unmarried |
| Less than High School | 0 (0.0%) | 7 (100.0%) |
| High School Diploma | 0 (0.0%) | 24 (100.0%) |
| College or Associate's Degree | 0 (0.0%) | 0 (0.0%) |
| Bachelor's Degree | 30 (100.0%) | 0 (0.0%) |
| Graduate Degree | 0 (0.0%) | 0 (0.0%) |
| Total | 30 (49.2%) | 31 (50.8%) |
Employment Characteristics in Dadeville
Employment by Class of Employer in Dadeville
Among the 875 employed individuals in Dadeville, private company employees (526 | 60.1%), local government employees (98 | 11.2%), and state government employees (94 | 10.7%) make up the most common classes of employment.
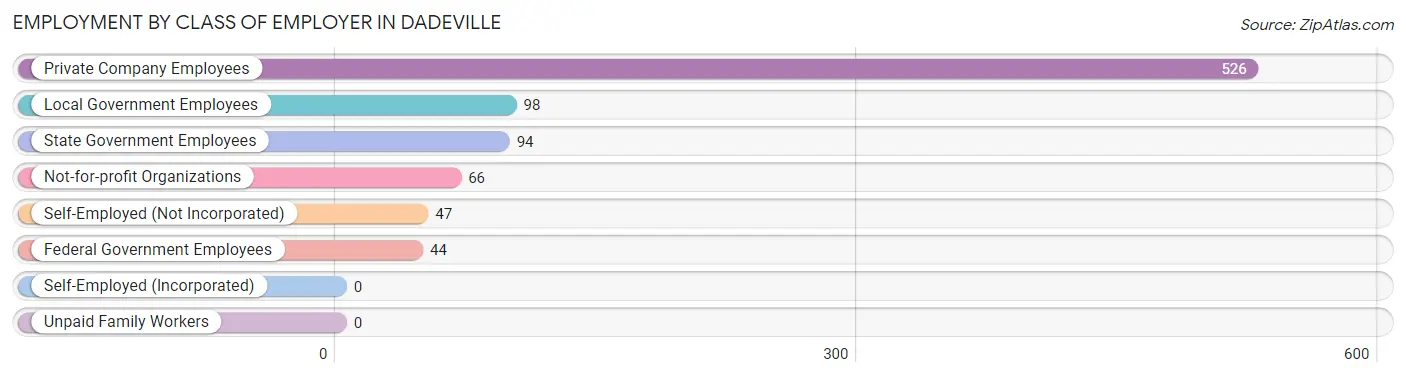
| Employer Class | # Employees | % Employees |
| Private Company Employees | 526 | 60.1% |
| Self-Employed (Incorporated) | 0 | 0.0% |
| Self-Employed (Not Incorporated) | 47 | 5.4% |
| Not-for-profit Organizations | 66 | 7.5% |
| Local Government Employees | 98 | 11.2% |
| State Government Employees | 94 | 10.7% |
| Federal Government Employees | 44 | 5.0% |
| Unpaid Family Workers | 0 | 0.0% |
| Total | 875 | 100.0% |
Employment Status by Age in Dadeville
According to the labor force statistics for Dadeville, out of the total population over 16 years of age (2,621), 47.0% or 1,232 individuals are in the labor force, with 27.9% or 344 of them unemployed. The age group with the highest labor force participation rate is 25 to 29 years, with 87.4% or 167 individuals in the labor force. Within the labor force, the 16 to 19 years age range has the highest percentage of unemployed individuals, with 66.7% or 42 of them being unemployed.
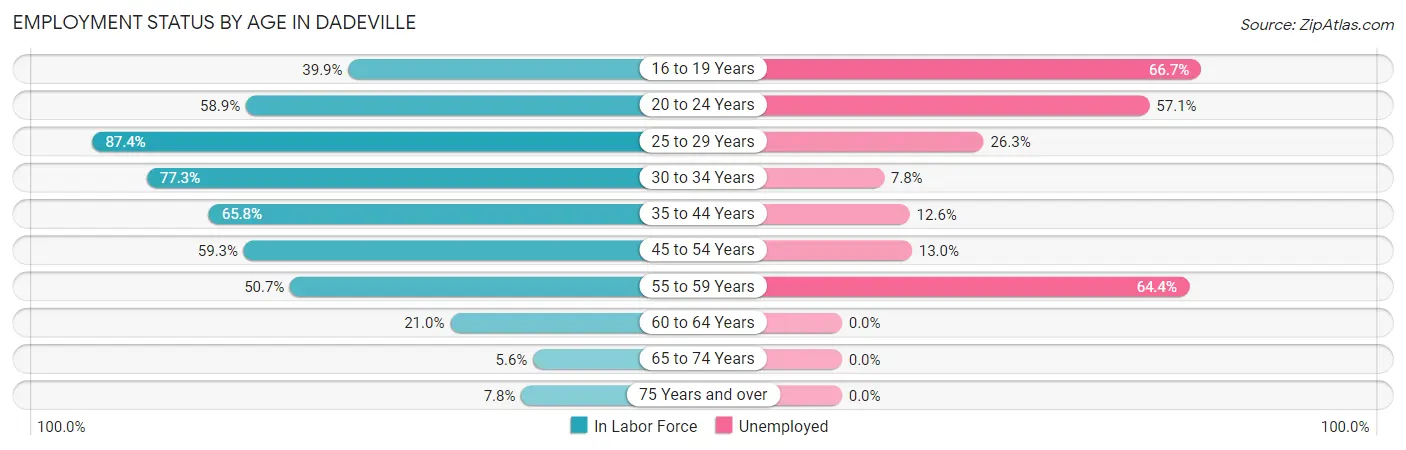
| Age Bracket | In Labor Force | Unemployed |
| 16 to 19 Years | 63 (39.9%) | 42 (66.7%) |
| 20 to 24 Years | 112 (58.9%) | 64 (57.1%) |
| 25 to 29 Years | 167 (87.4%) | 44 (26.3%) |
| 30 to 34 Years | 116 (77.3%) | 9 (7.8%) |
| 35 to 44 Years | 348 (65.8%) | 44 (12.6%) |
| 45 to 54 Years | 169 (59.3%) | 22 (13.0%) |
| 55 to 59 Years | 177 (50.7%) | 114 (64.4%) |
| 60 to 64 Years | 41 (21.0%) | 0 (0.0%) |
| 65 to 74 Years | 14 (5.6%) | 0 (0.0%) |
| 75 Years and over | 25 (7.8%) | 0 (0.0%) |
| Total | 1,232 (47.0%) | 344 (27.9%) |
Employment Status by Educational Attainment in Dadeville
According to labor force statistics for Dadeville, 59.9% of individuals (1,018) out of the total population between 25 and 64 years of age (1,699) are in the labor force, with 23.2% or 236 of them being unemployed. The group with the highest labor force participation rate are those with the educational attainment of bachelor's degree or higher, with 74.7% or 165 individuals in the labor force. Within the labor force, individuals with less than high school education have the highest percentage of unemployment, with 51.7% or 93 of them being unemployed.
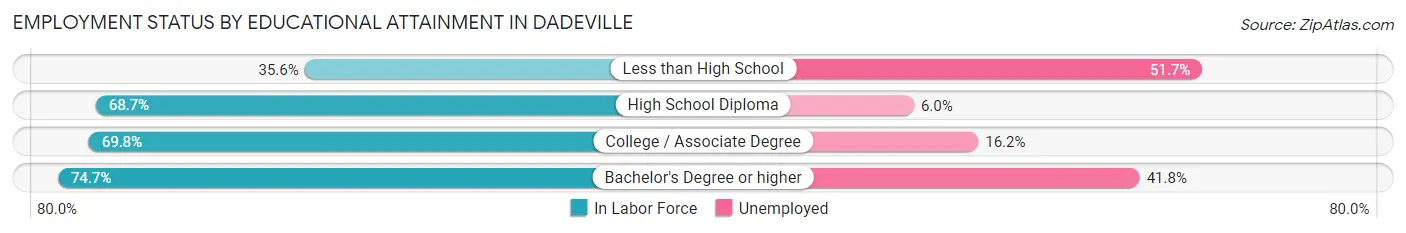
| Educational Attainment | In Labor Force | Unemployed |
| Less than High School | 180 (35.6%) | 261 (51.7%) |
| High School Diploma | 366 (68.7%) | 32 (6.0%) |
| College / Associate Degree | 307 (69.8%) | 71 (16.2%) |
| Bachelor's Degree or higher | 165 (74.7%) | 92 (41.8%) |
| Total | 1,018 (59.9%) | 394 (23.2%) |
Employment Occupations by Sex in Dadeville
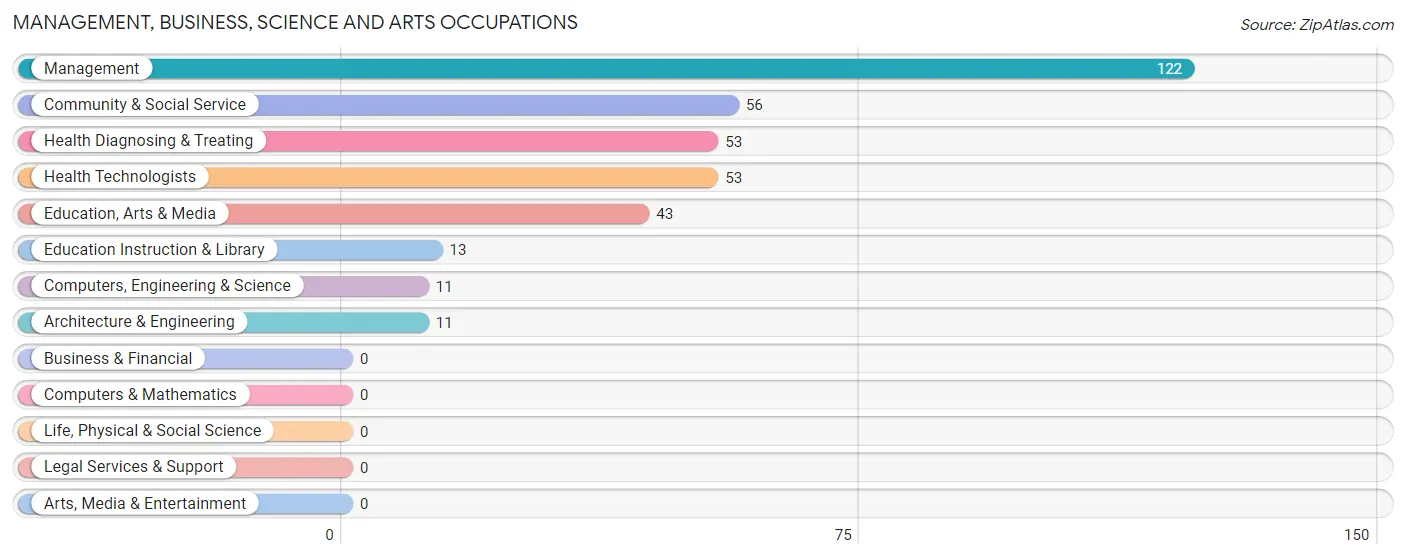
Management, Business, Science and Arts Occupations
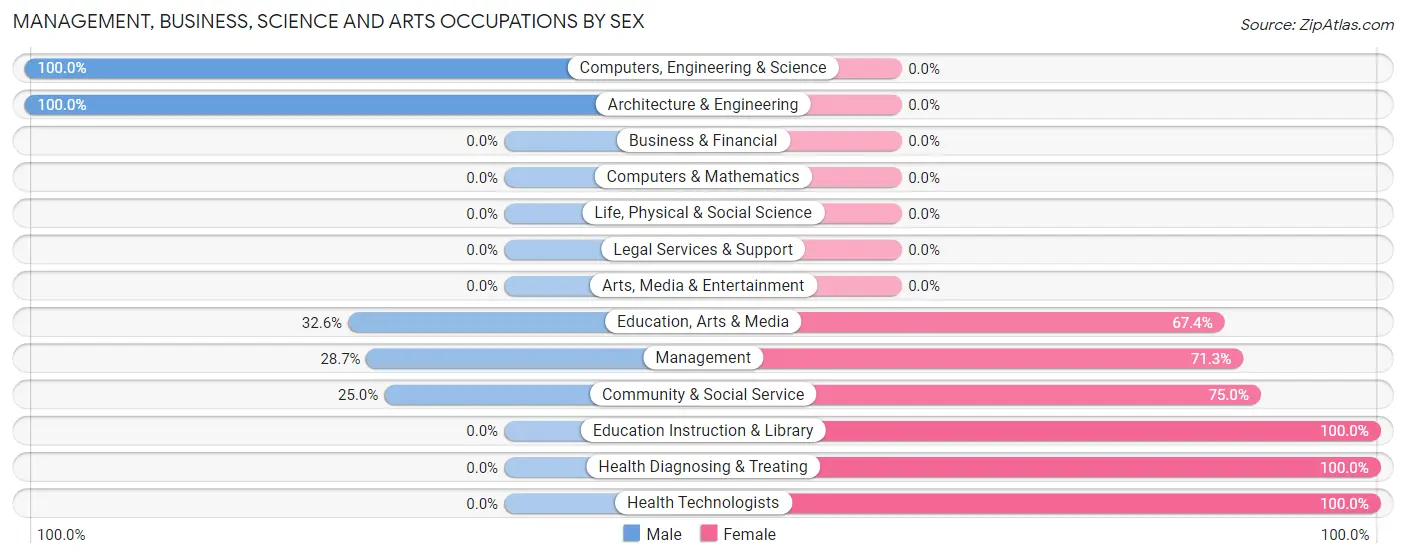
The most common Management, Business, Science and Arts occupations in Dadeville are Management (122 | 14.1%), Community & Social Service (56 | 6.5%), Health Diagnosing & Treating (53 | 6.1%), Health Technologists (53 | 6.1%), and Education, Arts & Media (43 | 5.0%).
Management, Business, Science and Arts Occupations by Sex
Within the Management, Business, Science and Arts occupations in Dadeville, the most male-oriented occupations are Computers, Engineering & Science (100.0%), Architecture & Engineering (100.0%), and Education, Arts & Media (32.6%), while the most female-oriented occupations are Education Instruction & Library (100.0%), Health Diagnosing & Treating (100.0%), and Health Technologists (100.0%).
| Occupation | Male | Female |
| Management | 35 (28.7%) | 87 (71.3%) |
| Business & Financial | 0 (0.0%) | 0 (0.0%) |
| Computers, Engineering & Science | 11 (100.0%) | 0 (0.0%) |
| Computers & Mathematics | 0 (0.0%) | 0 (0.0%) |
| Architecture & Engineering | 11 (100.0%) | 0 (0.0%) |
| Life, Physical & Social Science | 0 (0.0%) | 0 (0.0%) |
| Community & Social Service | 14 (25.0%) | 42 (75.0%) |
| Education, Arts & Media | 14 (32.6%) | 29 (67.4%) |
| Legal Services & Support | 0 (0.0%) | 0 (0.0%) |
| Education Instruction & Library | 0 (0.0%) | 13 (100.0%) |
| Arts, Media & Entertainment | 0 (0.0%) | 0 (0.0%) |
| Health Diagnosing & Treating | 0 (0.0%) | 53 (100.0%) |
| Health Technologists | 0 (0.0%) | 53 (100.0%) |
| Total (Category) | 60 (24.8%) | 182 (75.2%) |
| Total (Overall) | 416 (48.0%) | 451 (52.0%) |
Services Occupations
The most common Services occupations in Dadeville are Healthcare Support (24 | 2.8%), and Personal Care & Service (24 | 2.8%).
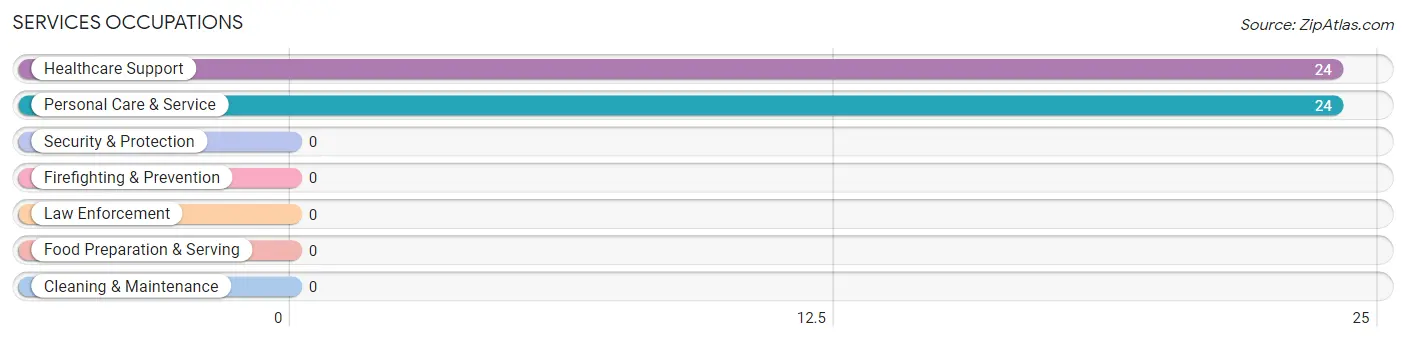
Services Occupations by Sex
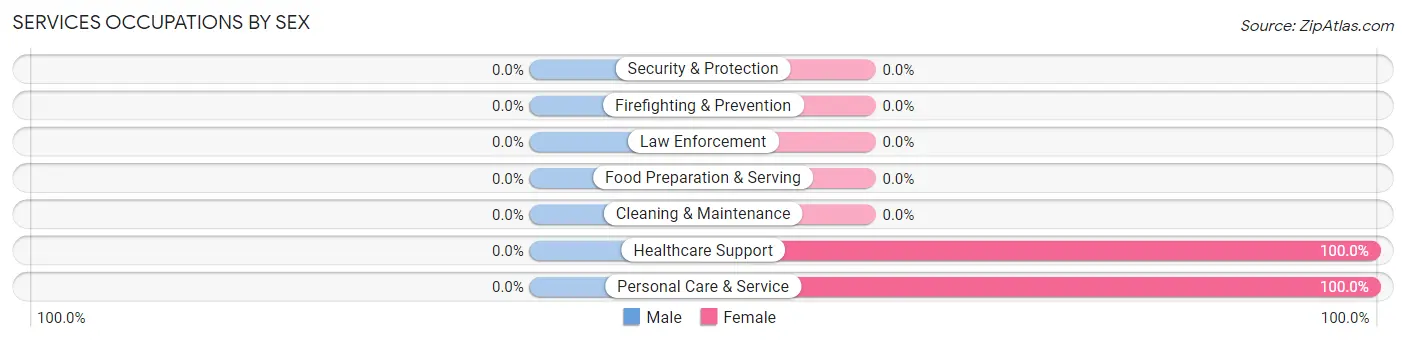
| Occupation | Male | Female |
| Healthcare Support | 0 (0.0%) | 24 (100.0%) |
| Security & Protection | 0 (0.0%) | 0 (0.0%) |
| Firefighting & Prevention | 0 (0.0%) | 0 (0.0%) |
| Law Enforcement | 0 (0.0%) | 0 (0.0%) |
| Food Preparation & Serving | 0 (0.0%) | 0 (0.0%) |
| Cleaning & Maintenance | 0 (0.0%) | 0 (0.0%) |
| Personal Care & Service | 0 (0.0%) | 24 (100.0%) |
| Total (Category) | 0 (0.0%) | 48 (100.0%) |
| Total (Overall) | 416 (48.0%) | 451 (52.0%) |
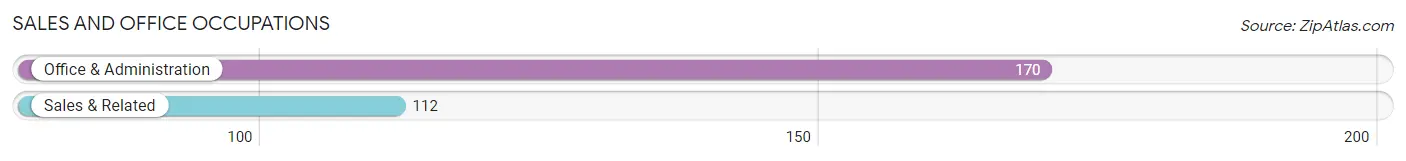
Sales and Office Occupations
The most common Sales and Office occupations in Dadeville are Office & Administration (170 | 19.6%), and Sales & Related (112 | 12.9%).
Sales and Office Occupations by Sex
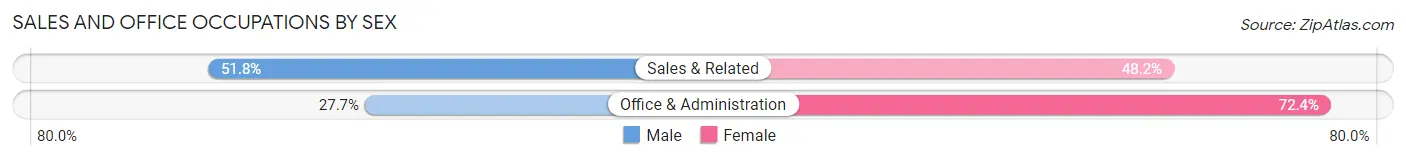
| Occupation | Male | Female |
| Sales & Related | 58 (51.8%) | 54 (48.2%) |
| Office & Administration | 47 (27.7%) | 123 (72.4%) |
| Total (Category) | 105 (37.2%) | 177 (62.8%) |
| Total (Overall) | 416 (48.0%) | 451 (52.0%) |
Natural Resources, Construction and Maintenance Occupations
The most common Natural Resources, Construction and Maintenance occupations in Dadeville are Construction & Extraction (61 | 7.0%), Installation, Maintenance & Repair (14 | 1.6%), and Farming, Fishing & Forestry (7 | 0.8%).

Natural Resources, Construction and Maintenance Occupations by Sex
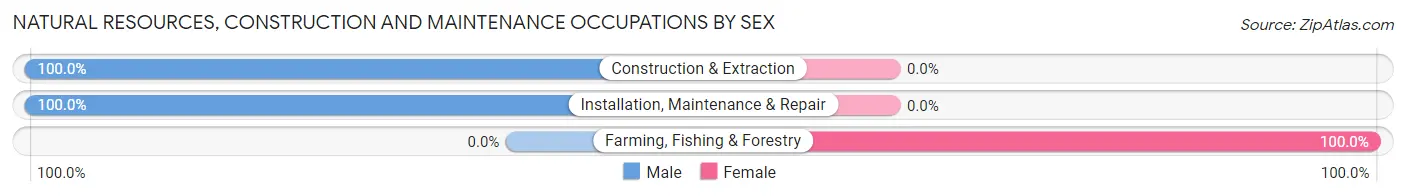
| Occupation | Male | Female |
| Farming, Fishing & Forestry | 0 (0.0%) | 7 (100.0%) |
| Construction & Extraction | 61 (100.0%) | 0 (0.0%) |
| Installation, Maintenance & Repair | 14 (100.0%) | 0 (0.0%) |
| Total (Category) | 75 (91.5%) | 7 (8.5%) |
| Total (Overall) | 416 (48.0%) | 451 (52.0%) |
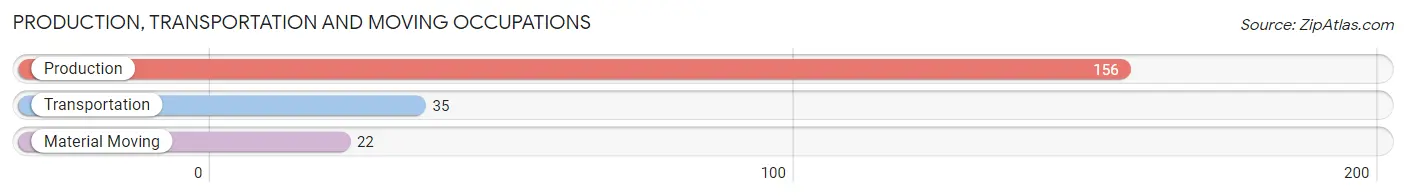
Production, Transportation and Moving Occupations
The most common Production, Transportation and Moving occupations in Dadeville are Production (156 | 18.0%), Transportation (35 | 4.0%), and Material Moving (22 | 2.5%).
Production, Transportation and Moving Occupations by Sex
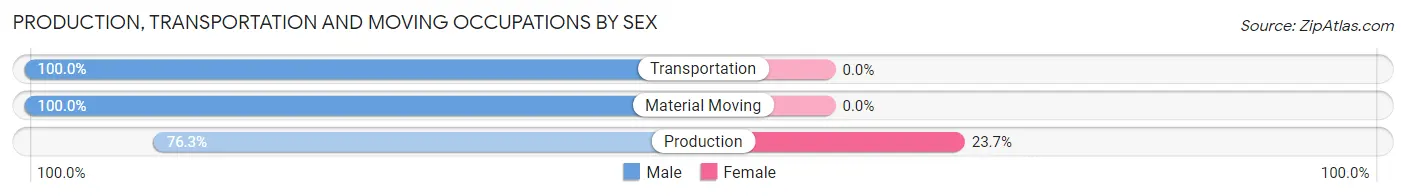
| Occupation | Male | Female |
| Production | 119 (76.3%) | 37 (23.7%) |
| Transportation | 35 (100.0%) | 0 (0.0%) |
| Material Moving | 22 (100.0%) | 0 (0.0%) |
| Total (Category) | 176 (82.6%) | 37 (17.4%) |
| Total (Overall) | 416 (48.0%) | 451 (52.0%) |
Employment Industries by Sex in Dadeville
Employment Industries in Dadeville
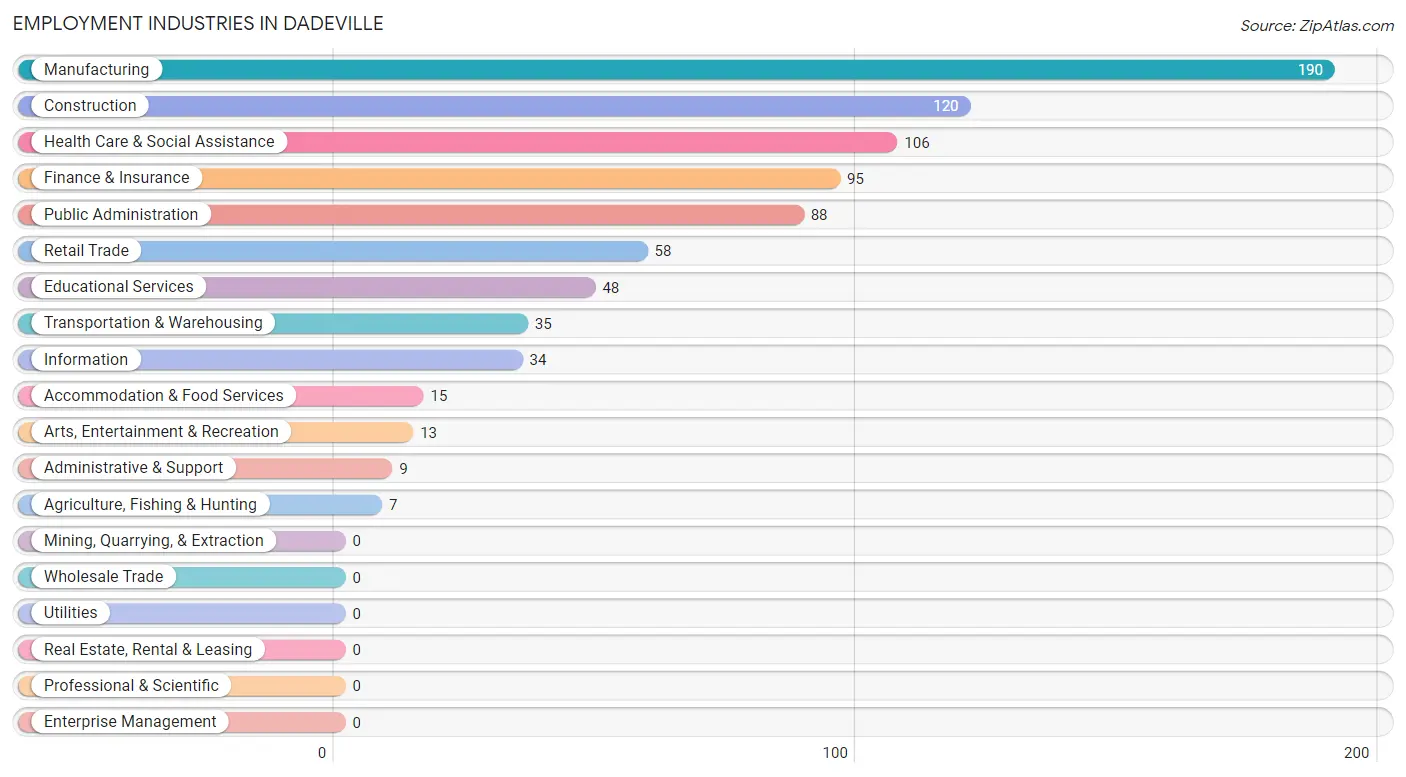
The major employment industries in Dadeville include Manufacturing (190 | 21.9%), Construction (120 | 13.8%), Health Care & Social Assistance (106 | 12.2%), Finance & Insurance (95 | 11.0%), and Public Administration (88 | 10.2%).
Employment Industries by Sex in Dadeville
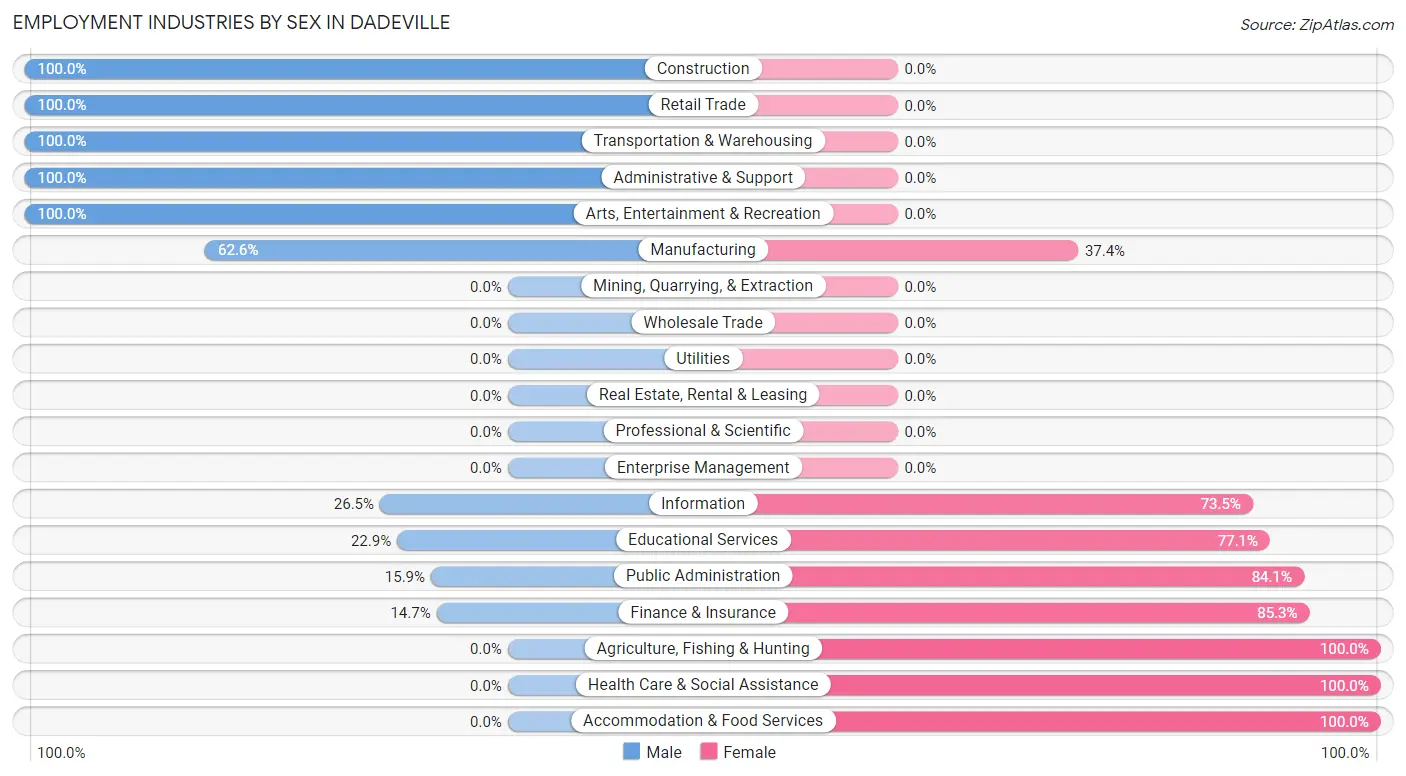
The Dadeville industries that see more men than women are Construction (100.0%), Retail Trade (100.0%), and Transportation & Warehousing (100.0%), whereas the industries that tend to have a higher number of women are Agriculture, Fishing & Hunting (100.0%), Health Care & Social Assistance (100.0%), and Accommodation & Food Services (100.0%).
| Industry | Male | Female |
| Agriculture, Fishing & Hunting | 0 (0.0%) | 7 (100.0%) |
| Mining, Quarrying, & Extraction | 0 (0.0%) | 0 (0.0%) |
| Construction | 120 (100.0%) | 0 (0.0%) |
| Manufacturing | 119 (62.6%) | 71 (37.4%) |
| Wholesale Trade | 0 (0.0%) | 0 (0.0%) |
| Retail Trade | 58 (100.0%) | 0 (0.0%) |
| Transportation & Warehousing | 35 (100.0%) | 0 (0.0%) |
| Utilities | 0 (0.0%) | 0 (0.0%) |
| Information | 9 (26.5%) | 25 (73.5%) |
| Finance & Insurance | 14 (14.7%) | 81 (85.3%) |
| Real Estate, Rental & Leasing | 0 (0.0%) | 0 (0.0%) |
| Professional & Scientific | 0 (0.0%) | 0 (0.0%) |
| Enterprise Management | 0 (0.0%) | 0 (0.0%) |
| Administrative & Support | 9 (100.0%) | 0 (0.0%) |
| Educational Services | 11 (22.9%) | 37 (77.1%) |
| Health Care & Social Assistance | 0 (0.0%) | 106 (100.0%) |
| Arts, Entertainment & Recreation | 13 (100.0%) | 0 (0.0%) |
| Accommodation & Food Services | 0 (0.0%) | 15 (100.0%) |
| Public Administration | 14 (15.9%) | 74 (84.1%) |
| Total | 416 (48.0%) | 451 (52.0%) |
Education in Dadeville
School Enrollment in Dadeville
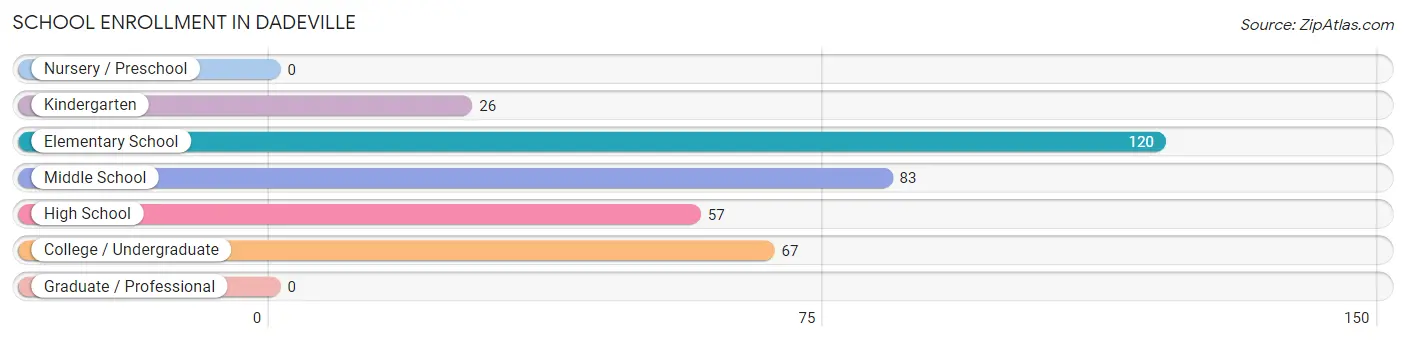
The most common levels of schooling among the 353 students in Dadeville are elementary school (120 | 34.0%), middle school (83 | 23.5%), and college / undergraduate (67 | 19.0%).
| School Level | # Students | % Students |
| Nursery / Preschool | 0 | 0.0% |
| Kindergarten | 26 | 7.4% |
| Elementary School | 120 | 34.0% |
| Middle School | 83 | 23.5% |
| High School | 57 | 16.2% |
| College / Undergraduate | 67 | 19.0% |
| Graduate / Professional | 0 | 0.0% |
| Total | 353 | 100.0% |
School Enrollment by Age by Funding Source in Dadeville
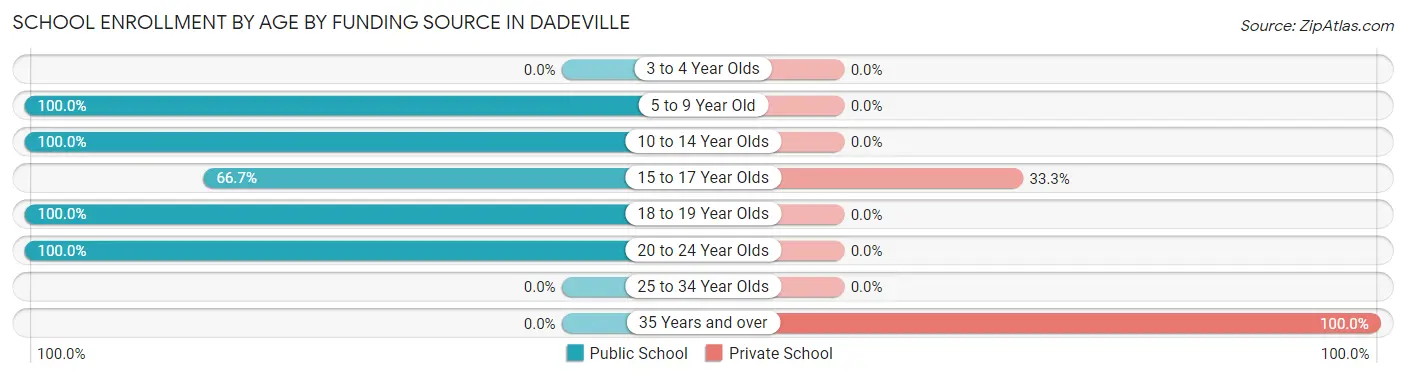
Out of a total of 353 students who are enrolled in schools in Dadeville, 18 (5.1%) attend a private institution, while the remaining 335 (94.9%) are enrolled in public schools. The age group of 35 years and over has the highest likelihood of being enrolled in private schools, with 5 (100.0% in the age bracket) enrolled. Conversely, the age group of 5 to 9 year old has the lowest likelihood of being enrolled in a private school, with 146 (100.0% in the age bracket) attending a public institution.
| Age Bracket | Public School | Private School |
| 3 to 4 Year Olds | 0 (0.0%) | 0 (0.0%) |
| 5 to 9 Year Old | 146 (100.0%) | 0 (0.0%) |
| 10 to 14 Year Olds | 70 (100.0%) | 0 (0.0%) |
| 15 to 17 Year Olds | 26 (66.7%) | 13 (33.3%) |
| 18 to 19 Year Olds | 60 (100.0%) | 0 (0.0%) |
| 20 to 24 Year Olds | 33 (100.0%) | 0 (0.0%) |
| 25 to 34 Year Olds | 0 (0.0%) | 0 (0.0%) |
| 35 Years and over | 0 (0.0%) | 5 (100.0%) |
| Total | 335 (94.9%) | 18 (5.1%) |
Educational Attainment by Field of Study in Dadeville
Literature & languages (69 | 23.4%), business (55 | 18.6%), science & technology (45 | 15.2%), education (43 | 14.6%), and bio, nature & agricultural (23 | 7.8%) are the most common fields of study among 295 individuals in Dadeville who have obtained a bachelor's degree or higher.
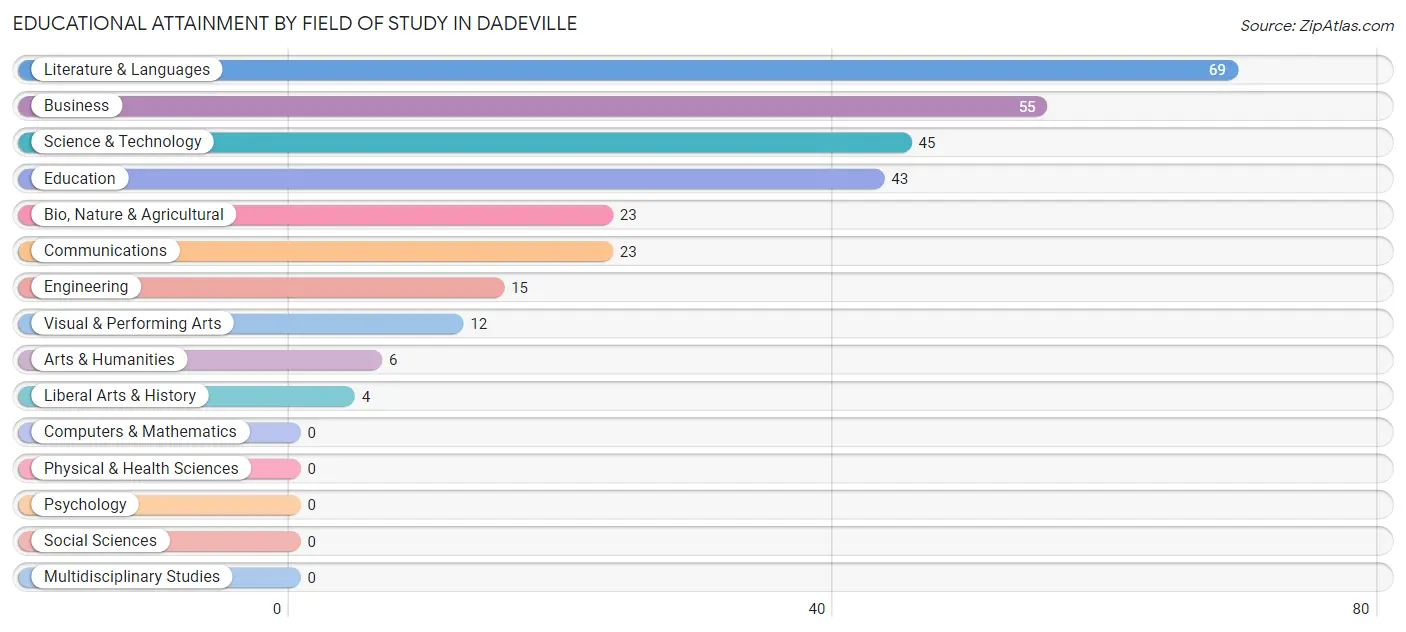
| Field of Study | # Graduates | % Graduates |
| Computers & Mathematics | 0 | 0.0% |
| Bio, Nature & Agricultural | 23 | 7.8% |
| Physical & Health Sciences | 0 | 0.0% |
| Psychology | 0 | 0.0% |
| Social Sciences | 0 | 0.0% |
| Engineering | 15 | 5.1% |
| Multidisciplinary Studies | 0 | 0.0% |
| Science & Technology | 45 | 15.2% |
| Business | 55 | 18.6% |
| Education | 43 | 14.6% |
| Literature & Languages | 69 | 23.4% |
| Liberal Arts & History | 4 | 1.4% |
| Visual & Performing Arts | 12 | 4.1% |
| Communications | 23 | 7.8% |
| Arts & Humanities | 6 | 2.0% |
| Total | 295 | 100.0% |
Transportation & Commute in Dadeville
Vehicle Availability by Sex in Dadeville
The most prevalent vehicle ownership categories in Dadeville are males with 2 vehicles (131, accounting for 31.6%) and females with 2 vehicles (117, making up 29.0%).
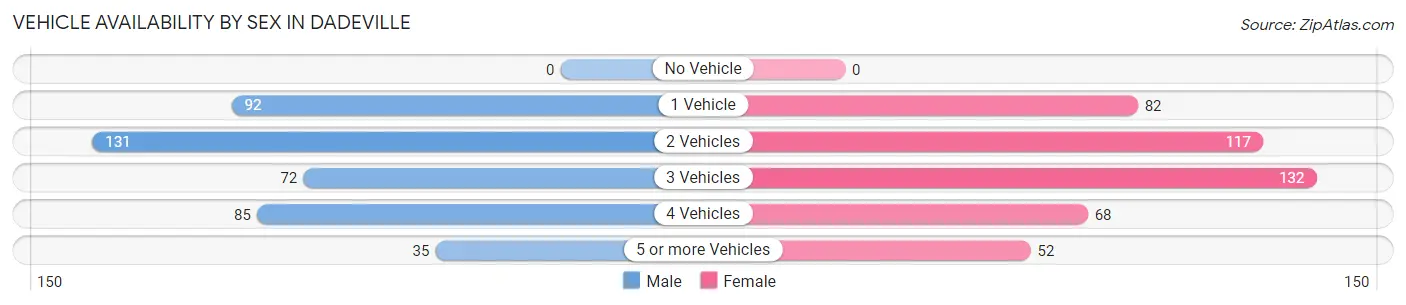
| Vehicles Available | Male | Female |
| No Vehicle | 0 (0.0%) | 0 (0.0%) |
| 1 Vehicle | 92 (22.2%) | 82 (18.2%) |
| 2 Vehicles | 131 (31.6%) | 117 (25.9%) |
| 3 Vehicles | 72 (17.3%) | 132 (29.3%) |
| 4 Vehicles | 85 (20.5%) | 68 (15.1%) |
| 5 or more Vehicles | 35 (8.4%) | 52 (11.5%) |
| Total | 415 (100.0%) | 451 (100.0%) |
Commute Time in Dadeville
The most frequently occuring commute durations in Dadeville are 15 to 19 minutes (200 commuters, 23.9%), 20 to 24 minutes (174 commuters, 20.8%), and 10 to 14 minutes (100 commuters, 11.9%).
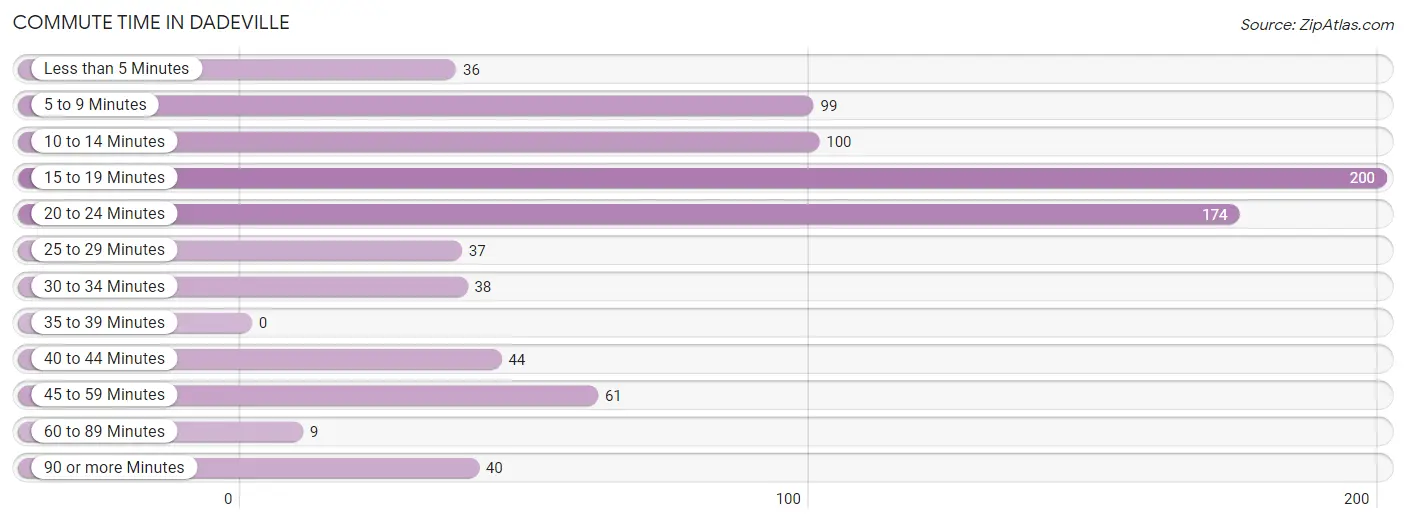
| Commute Time | # Commuters | % Commuters |
| Less than 5 Minutes | 36 | 4.3% |
| 5 to 9 Minutes | 99 | 11.8% |
| 10 to 14 Minutes | 100 | 11.9% |
| 15 to 19 Minutes | 200 | 23.9% |
| 20 to 24 Minutes | 174 | 20.8% |
| 25 to 29 Minutes | 37 | 4.4% |
| 30 to 34 Minutes | 38 | 4.5% |
| 35 to 39 Minutes | 0 | 0.0% |
| 40 to 44 Minutes | 44 | 5.2% |
| 45 to 59 Minutes | 61 | 7.3% |
| 60 to 89 Minutes | 9 | 1.1% |
| 90 or more Minutes | 40 | 4.8% |
Commute Time by Sex in Dadeville
The most common commute times in Dadeville are 15 to 19 minutes (100 commuters, 24.3%) for males and 20 to 24 minutes (106 commuters, 24.9%) for females.
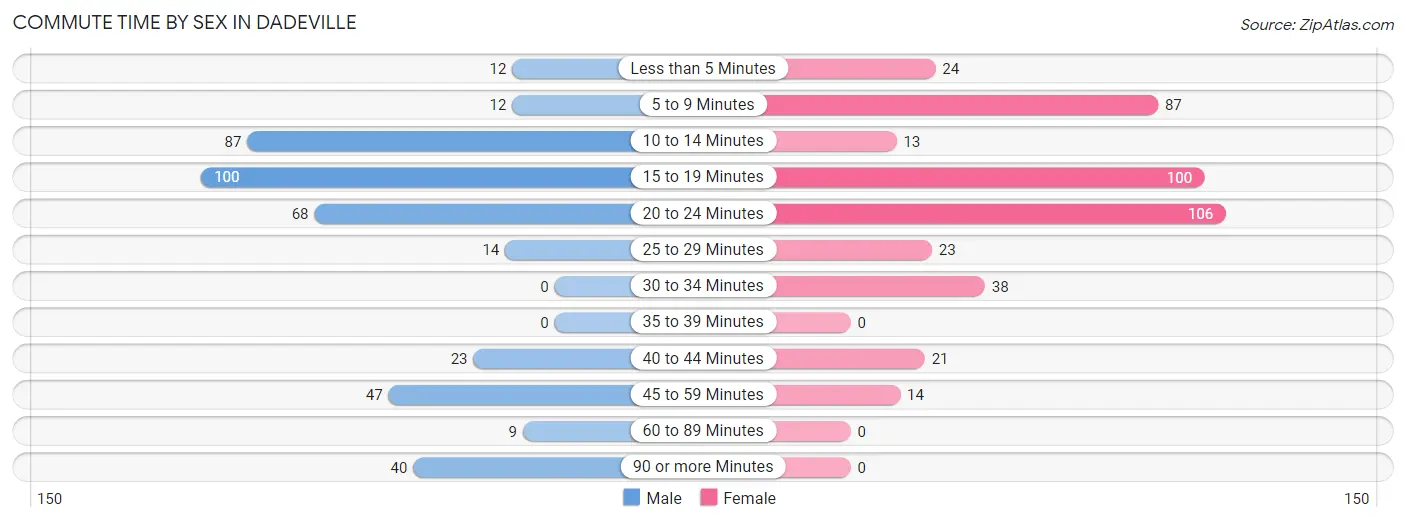
| Commute Time | Male | Female |
| Less than 5 Minutes | 12 (2.9%) | 24 (5.6%) |
| 5 to 9 Minutes | 12 (2.9%) | 87 (20.4%) |
| 10 to 14 Minutes | 87 (21.1%) | 13 (3.0%) |
| 15 to 19 Minutes | 100 (24.3%) | 100 (23.5%) |
| 20 to 24 Minutes | 68 (16.5%) | 106 (24.9%) |
| 25 to 29 Minutes | 14 (3.4%) | 23 (5.4%) |
| 30 to 34 Minutes | 0 (0.0%) | 38 (8.9%) |
| 35 to 39 Minutes | 0 (0.0%) | 0 (0.0%) |
| 40 to 44 Minutes | 23 (5.6%) | 21 (4.9%) |
| 45 to 59 Minutes | 47 (11.4%) | 14 (3.3%) |
| 60 to 89 Minutes | 9 (2.2%) | 0 (0.0%) |
| 90 or more Minutes | 40 (9.7%) | 0 (0.0%) |
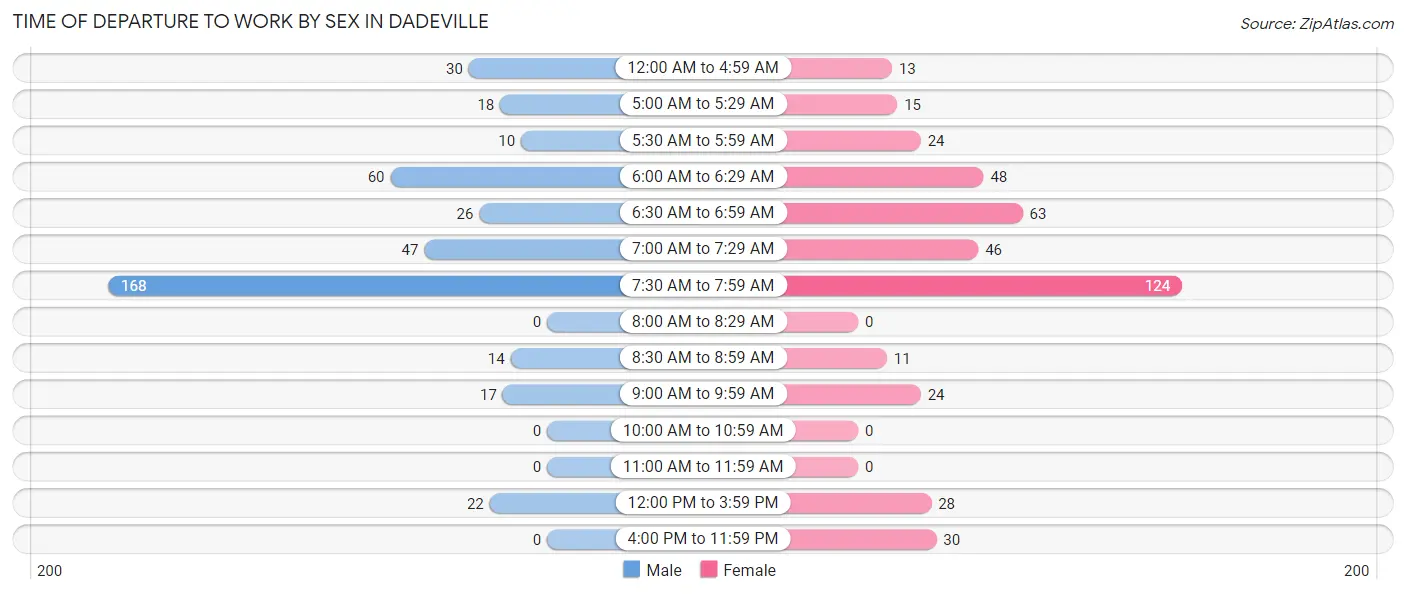
Time of Departure to Work by Sex in Dadeville
The most frequent times of departure to work in Dadeville are 7:30 AM to 7:59 AM (168, 40.8%) for males and 7:30 AM to 7:59 AM (124, 29.1%) for females.
| Time of Departure | Male | Female |
| 12:00 AM to 4:59 AM | 30 (7.3%) | 13 (3.0%) |
| 5:00 AM to 5:29 AM | 18 (4.4%) | 15 (3.5%) |
| 5:30 AM to 5:59 AM | 10 (2.4%) | 24 (5.6%) |
| 6:00 AM to 6:29 AM | 60 (14.6%) | 48 (11.3%) |
| 6:30 AM to 6:59 AM | 26 (6.3%) | 63 (14.8%) |
| 7:00 AM to 7:29 AM | 47 (11.4%) | 46 (10.8%) |
| 7:30 AM to 7:59 AM | 168 (40.8%) | 124 (29.1%) |
| 8:00 AM to 8:29 AM | 0 (0.0%) | 0 (0.0%) |
| 8:30 AM to 8:59 AM | 14 (3.4%) | 11 (2.6%) |
| 9:00 AM to 9:59 AM | 17 (4.1%) | 24 (5.6%) |
| 10:00 AM to 10:59 AM | 0 (0.0%) | 0 (0.0%) |
| 11:00 AM to 11:59 AM | 0 (0.0%) | 0 (0.0%) |
| 12:00 PM to 3:59 PM | 22 (5.3%) | 28 (6.6%) |
| 4:00 PM to 11:59 PM | 0 (0.0%) | 30 (7.0%) |
| Total | 412 (100.0%) | 426 (100.0%) |
Housing Occupancy in Dadeville
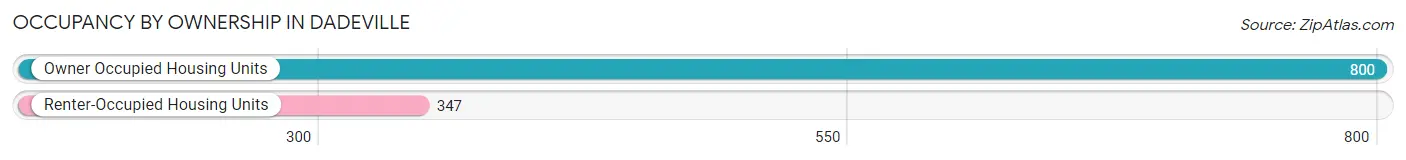
Occupancy by Ownership in Dadeville
Of the total 1,147 dwellings in Dadeville, owner-occupied units account for 800 (69.8%), while renter-occupied units make up 347 (30.2%).
| Occupancy | # Housing Units | % Housing Units |
| Owner Occupied Housing Units | 800 | 69.8% |
| Renter-Occupied Housing Units | 347 | 30.2% |
| Total Occupied Housing Units | 1,147 | 100.0% |
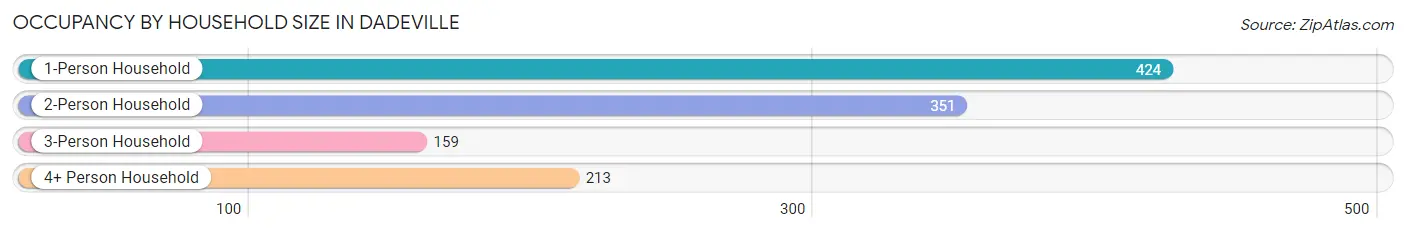
Occupancy by Household Size in Dadeville
| Household Size | # Housing Units | % Housing Units |
| 1-Person Household | 424 | 37.0% |
| 2-Person Household | 351 | 30.6% |
| 3-Person Household | 159 | 13.9% |
| 4+ Person Household | 213 | 18.6% |
| Total Housing Units | 1,147 | 100.0% |
Occupancy by Ownership by Household Size in Dadeville
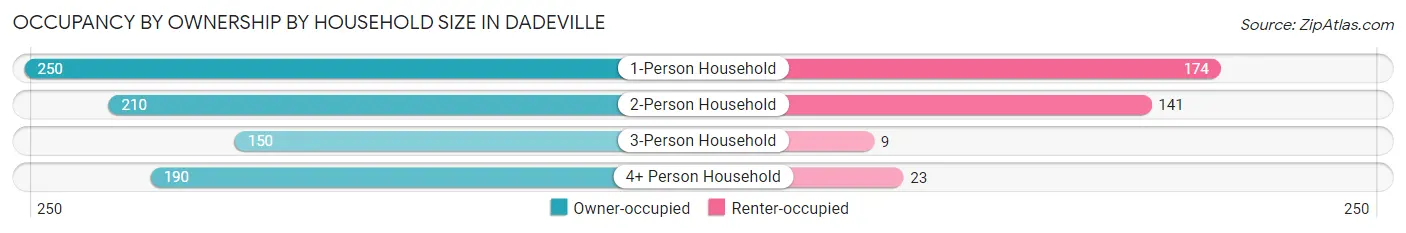
| Household Size | Owner-occupied | Renter-occupied |
| 1-Person Household | 250 (59.0%) | 174 (41.0%) |
| 2-Person Household | 210 (59.8%) | 141 (40.2%) |
| 3-Person Household | 150 (94.3%) | 9 (5.7%) |
| 4+ Person Household | 190 (89.2%) | 23 (10.8%) |
| Total Housing Units | 800 (69.8%) | 347 (30.2%) |
Occupancy by Educational Attainment in Dadeville
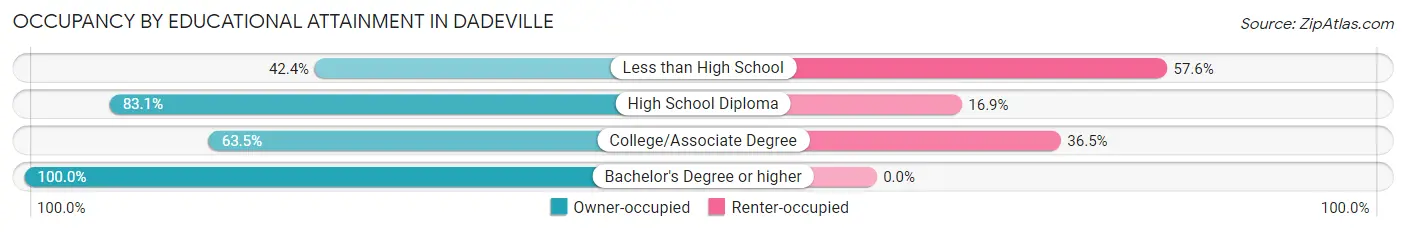
| Household Size | Owner-occupied | Renter-occupied |
| Less than High School | 129 (42.4%) | 175 (57.6%) |
| High School Diploma | 246 (83.1%) | 50 (16.9%) |
| College/Associate Degree | 212 (63.5%) | 122 (36.5%) |
| Bachelor's Degree or higher | 213 (100.0%) | 0 (0.0%) |
Occupancy by Age of Householder in Dadeville
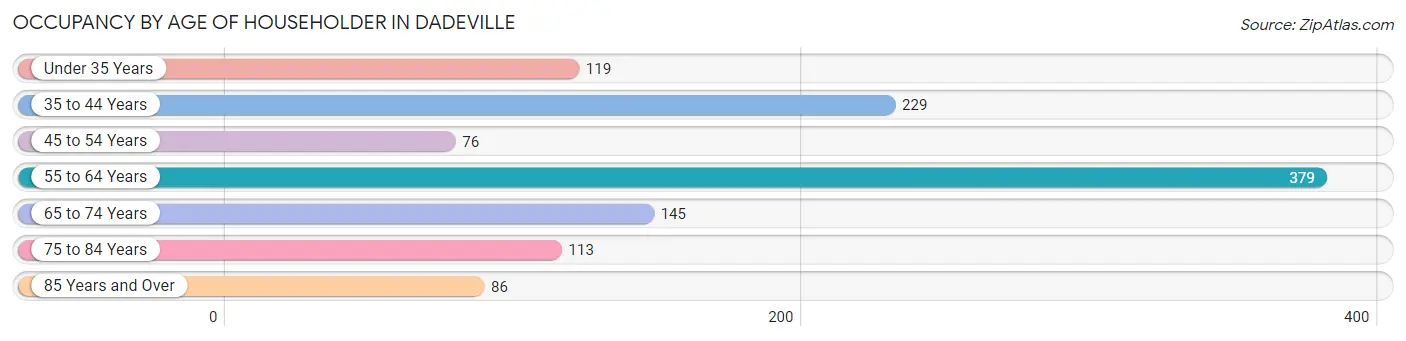
| Age Bracket | # Households | % Households |
| Under 35 Years | 119 | 10.4% |
| 35 to 44 Years | 229 | 20.0% |
| 45 to 54 Years | 76 | 6.6% |
| 55 to 64 Years | 379 | 33.0% |
| 65 to 74 Years | 145 | 12.6% |
| 75 to 84 Years | 113 | 9.9% |
| 85 Years and Over | 86 | 7.5% |
| Total | 1,147 | 100.0% |
Housing Finances in Dadeville
Median Income by Occupancy in Dadeville
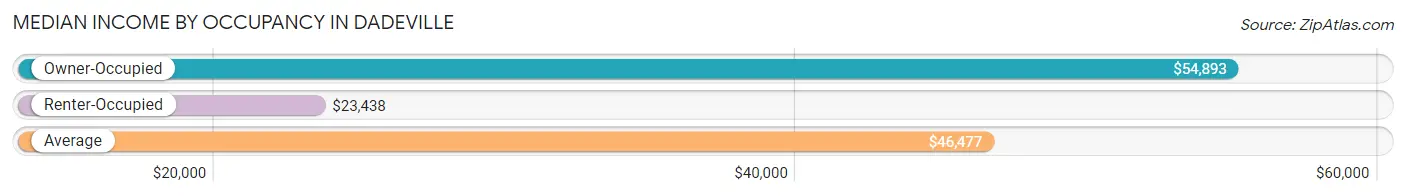
| Occupancy Type | # Households | Median Income |
| Owner-Occupied | 800 (69.8%) | $54,893 |
| Renter-Occupied | 347 (30.2%) | $23,438 |
| Average | 1,147 (100.0%) | $46,477 |
Occupancy by Householder Income Bracket in Dadeville
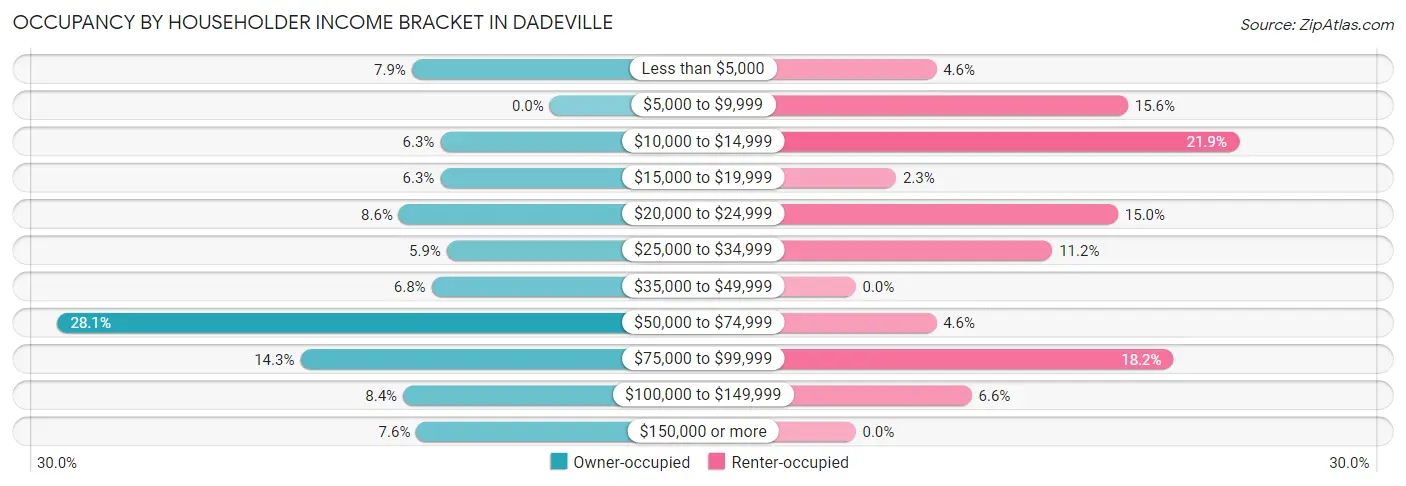
| Income Bracket | Owner-occupied | Renter-occupied |
| Less than $5,000 | 63 (7.9%) | 16 (4.6%) |
| $5,000 to $9,999 | 0 (0.0%) | 54 (15.6%) |
| $10,000 to $14,999 | 50 (6.2%) | 76 (21.9%) |
| $15,000 to $19,999 | 50 (6.2%) | 8 (2.3%) |
| $20,000 to $24,999 | 69 (8.6%) | 52 (15.0%) |
| $25,000 to $34,999 | 47 (5.9%) | 39 (11.2%) |
| $35,000 to $49,999 | 54 (6.8%) | 0 (0.0%) |
| $50,000 to $74,999 | 225 (28.1%) | 16 (4.6%) |
| $75,000 to $99,999 | 114 (14.2%) | 63 (18.2%) |
| $100,000 to $149,999 | 67 (8.4%) | 23 (6.6%) |
| $150,000 or more | 61 (7.6%) | 0 (0.0%) |
| Total | 800 (100.0%) | 347 (100.0%) |
Monthly Housing Cost Tiers in Dadeville
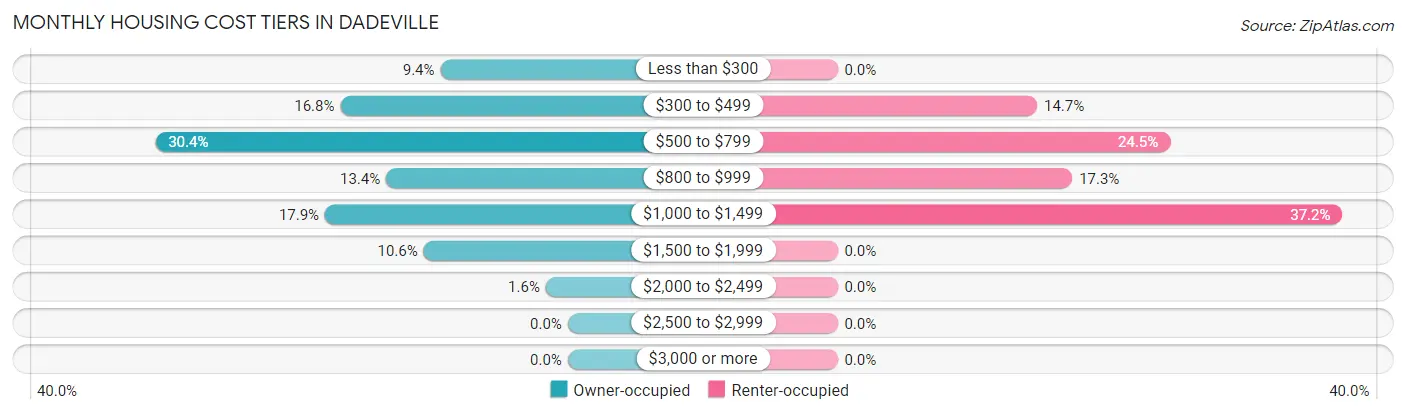
| Monthly Cost | Owner-occupied | Renter-occupied |
| Less than $300 | 75 (9.4%) | 0 (0.0%) |
| $300 to $499 | 134 (16.8%) | 51 (14.7%) |
| $500 to $799 | 243 (30.4%) | 85 (24.5%) |
| $800 to $999 | 107 (13.4%) | 60 (17.3%) |
| $1,000 to $1,499 | 143 (17.9%) | 129 (37.2%) |
| $1,500 to $1,999 | 85 (10.6%) | 0 (0.0%) |
| $2,000 to $2,499 | 13 (1.6%) | 0 (0.0%) |
| $2,500 to $2,999 | 0 (0.0%) | 0 (0.0%) |
| $3,000 or more | 0 (0.0%) | 0 (0.0%) |
| Total | 800 (100.0%) | 347 (100.0%) |
Physical Housing Characteristics in Dadeville
Housing Structures in Dadeville
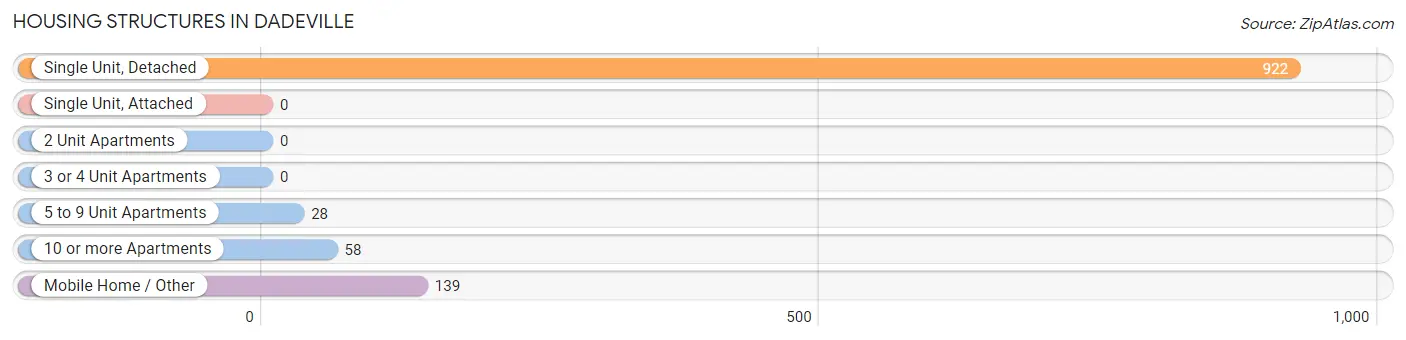
| Structure Type | # Housing Units | % Housing Units |
| Single Unit, Detached | 922 | 80.4% |
| Single Unit, Attached | 0 | 0.0% |
| 2 Unit Apartments | 0 | 0.0% |
| 3 or 4 Unit Apartments | 0 | 0.0% |
| 5 to 9 Unit Apartments | 28 | 2.4% |
| 10 or more Apartments | 58 | 5.1% |
| Mobile Home / Other | 139 | 12.1% |
| Total | 1,147 | 100.0% |
Housing Structures by Occupancy in Dadeville
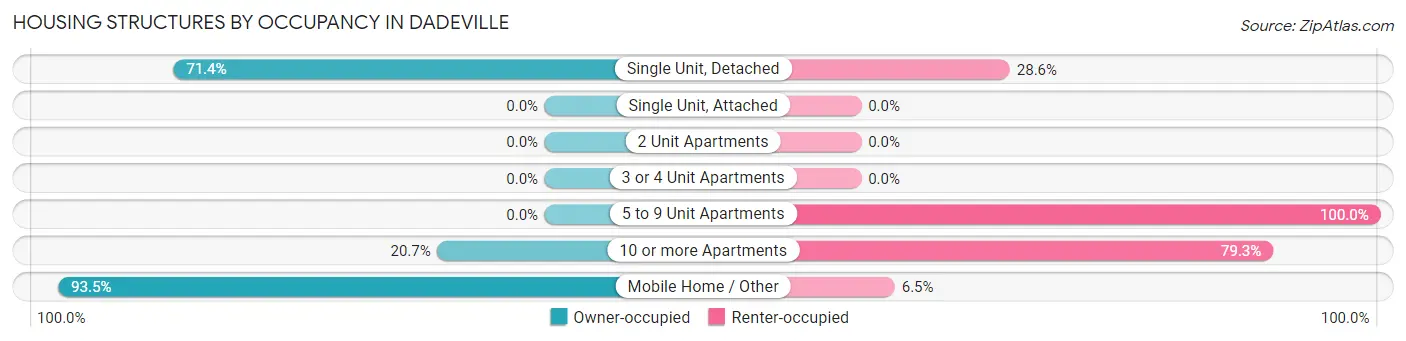
| Structure Type | Owner-occupied | Renter-occupied |
| Single Unit, Detached | 658 (71.4%) | 264 (28.6%) |
| Single Unit, Attached | 0 (0.0%) | 0 (0.0%) |
| 2 Unit Apartments | 0 (0.0%) | 0 (0.0%) |
| 3 or 4 Unit Apartments | 0 (0.0%) | 0 (0.0%) |
| 5 to 9 Unit Apartments | 0 (0.0%) | 28 (100.0%) |
| 10 or more Apartments | 12 (20.7%) | 46 (79.3%) |
| Mobile Home / Other | 130 (93.5%) | 9 (6.5%) |
| Total | 800 (69.8%) | 347 (30.2%) |
Housing Structures by Number of Rooms in Dadeville
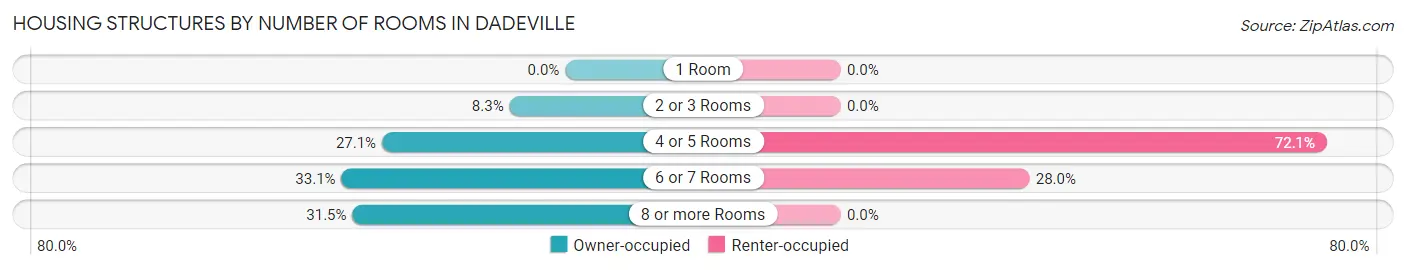
| Number of Rooms | Owner-occupied | Renter-occupied |
| 1 Room | 0 (0.0%) | 0 (0.0%) |
| 2 or 3 Rooms | 66 (8.3%) | 0 (0.0%) |
| 4 or 5 Rooms | 217 (27.1%) | 250 (72.1%) |
| 6 or 7 Rooms | 265 (33.1%) | 97 (28.0%) |
| 8 or more Rooms | 252 (31.5%) | 0 (0.0%) |
| Total | 800 (100.0%) | 347 (100.0%) |
Housing Structure by Heating Type in Dadeville
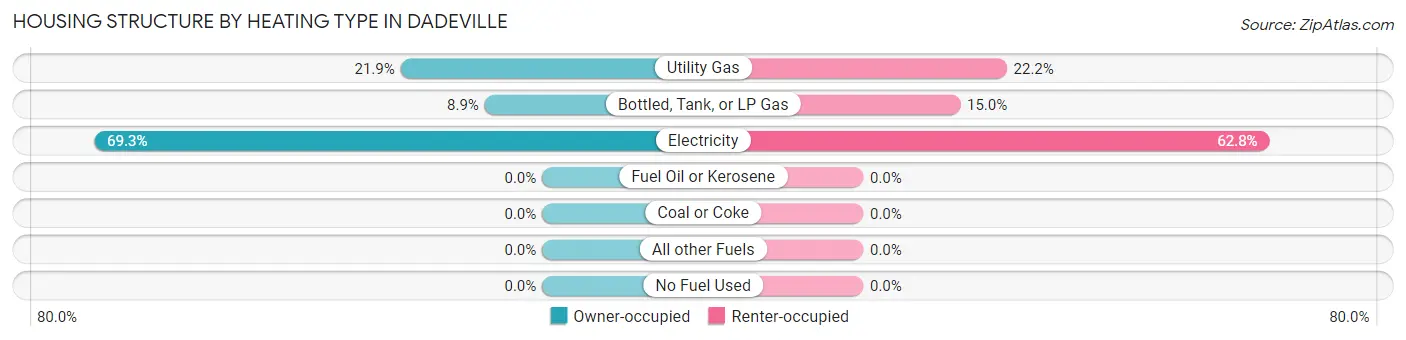
| Heating Type | Owner-occupied | Renter-occupied |
| Utility Gas | 175 (21.9%) | 77 (22.2%) |
| Bottled, Tank, or LP Gas | 71 (8.9%) | 52 (15.0%) |
| Electricity | 554 (69.3%) | 218 (62.8%) |
| Fuel Oil or Kerosene | 0 (0.0%) | 0 (0.0%) |
| Coal or Coke | 0 (0.0%) | 0 (0.0%) |
| All other Fuels | 0 (0.0%) | 0 (0.0%) |
| No Fuel Used | 0 (0.0%) | 0 (0.0%) |
| Total | 800 (100.0%) | 347 (100.0%) |
Household Vehicle Usage in Dadeville
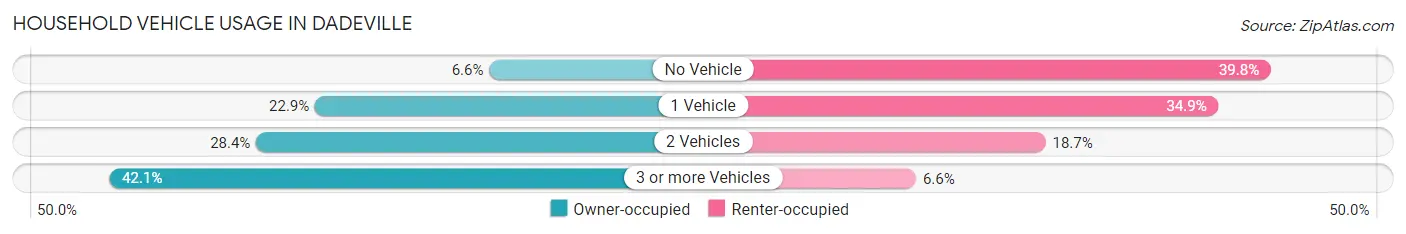
| Vehicles per Household | Owner-occupied | Renter-occupied |
| No Vehicle | 53 (6.6%) | 138 (39.8%) |
| 1 Vehicle | 183 (22.9%) | 121 (34.9%) |
| 2 Vehicles | 227 (28.4%) | 65 (18.7%) |
| 3 or more Vehicles | 337 (42.1%) | 23 (6.6%) |
| Total | 800 (100.0%) | 347 (100.0%) |
Real Estate & Mortgages in Dadeville
Real Estate and Mortgage Overview in Dadeville
| Characteristic | Without Mortgage | With Mortgage |
| Housing Units | 463 | 337 |
| Median Property Value | $115,500 | $158,000 |
| Median Household Income | $38,147 | $61 |
| Monthly Housing Costs | $541 | $0 |
| Real Estate Taxes | $258 | $68 |
Property Value by Mortgage Status in Dadeville
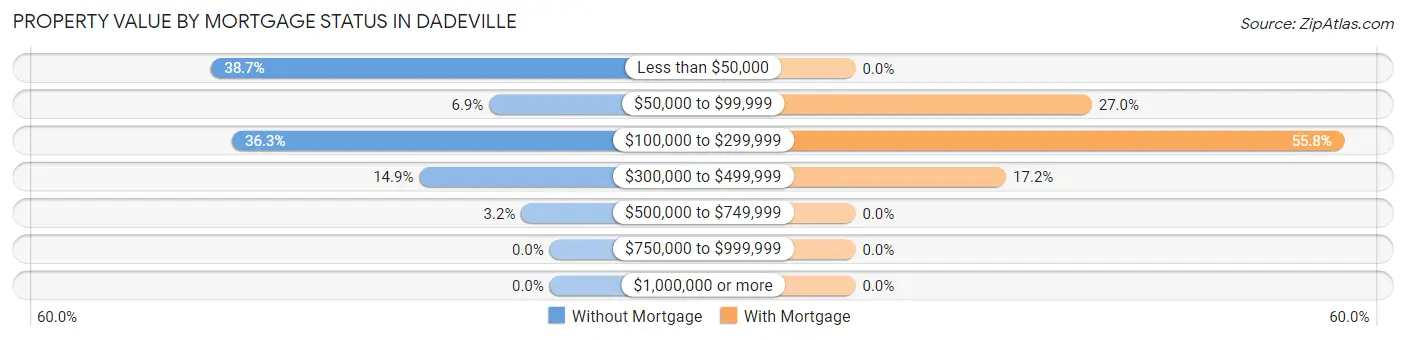
| Property Value | Without Mortgage | With Mortgage |
| Less than $50,000 | 179 (38.7%) | 0 (0.0%) |
| $50,000 to $99,999 | 32 (6.9%) | 91 (27.0%) |
| $100,000 to $299,999 | 168 (36.3%) | 188 (55.8%) |
| $300,000 to $499,999 | 69 (14.9%) | 58 (17.2%) |
| $500,000 to $749,999 | 15 (3.2%) | 0 (0.0%) |
| $750,000 to $999,999 | 0 (0.0%) | 0 (0.0%) |
| $1,000,000 or more | 0 (0.0%) | 0 (0.0%) |
| Total | 463 (100.0%) | 337 (100.0%) |
Household Income by Mortgage Status in Dadeville
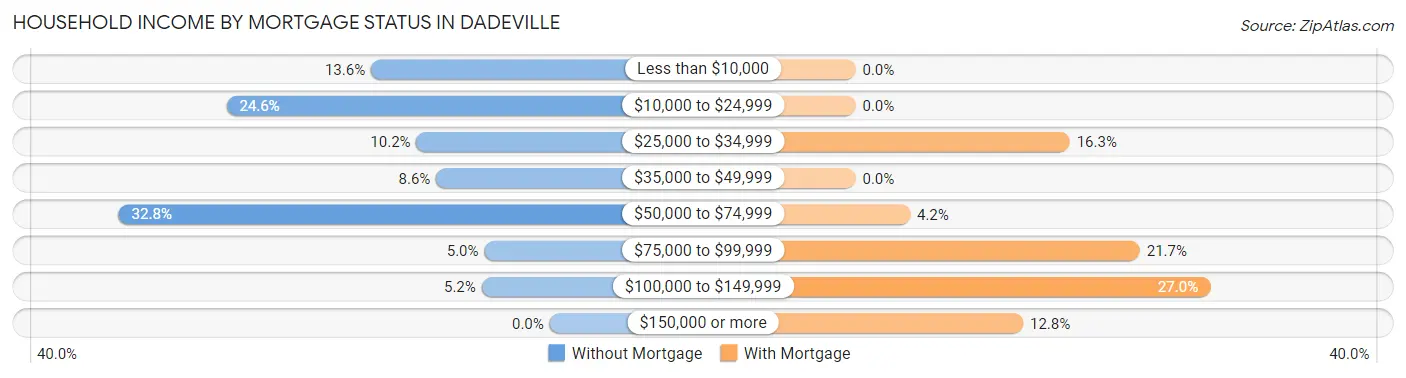
| Household Income | Without Mortgage | With Mortgage |
| Less than $10,000 | 63 (13.6%) | 0 (0.0%) |
| $10,000 to $24,999 | 114 (24.6%) | 0 (0.0%) |
| $25,000 to $34,999 | 47 (10.2%) | 55 (16.3%) |
| $35,000 to $49,999 | 40 (8.6%) | 0 (0.0%) |
| $50,000 to $74,999 | 152 (32.8%) | 14 (4.2%) |
| $75,000 to $99,999 | 23 (5.0%) | 73 (21.7%) |
| $100,000 to $149,999 | 24 (5.2%) | 91 (27.0%) |
| $150,000 or more | 0 (0.0%) | 43 (12.8%) |
| Total | 463 (100.0%) | 337 (100.0%) |
Property Value to Household Income Ratio in Dadeville
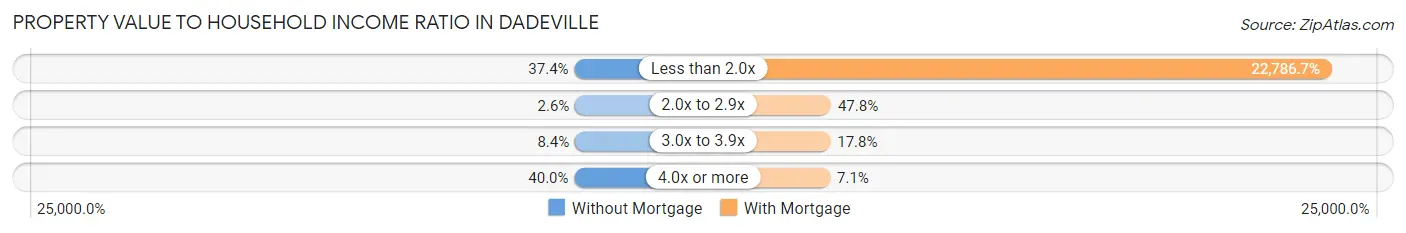
| Value-to-Income Ratio | Without Mortgage | With Mortgage |
| Less than 2.0x | 173 (37.4%) | 76,791 (22,786.7%) |
| 2.0x to 2.9x | 12 (2.6%) | 161 (47.8%) |
| 3.0x to 3.9x | 39 (8.4%) | 60 (17.8%) |
| 4.0x or more | 185 (40.0%) | 24 (7.1%) |
| Total | 463 (100.0%) | 337 (100.0%) |
Real Estate Taxes by Mortgage Status in Dadeville
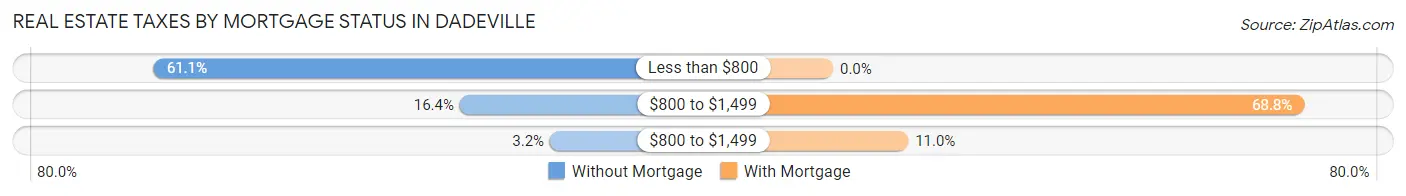
| Property Taxes | Without Mortgage | With Mortgage |
| Less than $800 | 283 (61.1%) | 0 (0.0%) |
| $800 to $1,499 | 76 (16.4%) | 232 (68.8%) |
| $800 to $1,499 | 15 (3.2%) | 37 (11.0%) |
| Total | 463 (100.0%) | 337 (100.0%) |
Health & Disability in Dadeville
Health Insurance Coverage by Age in Dadeville
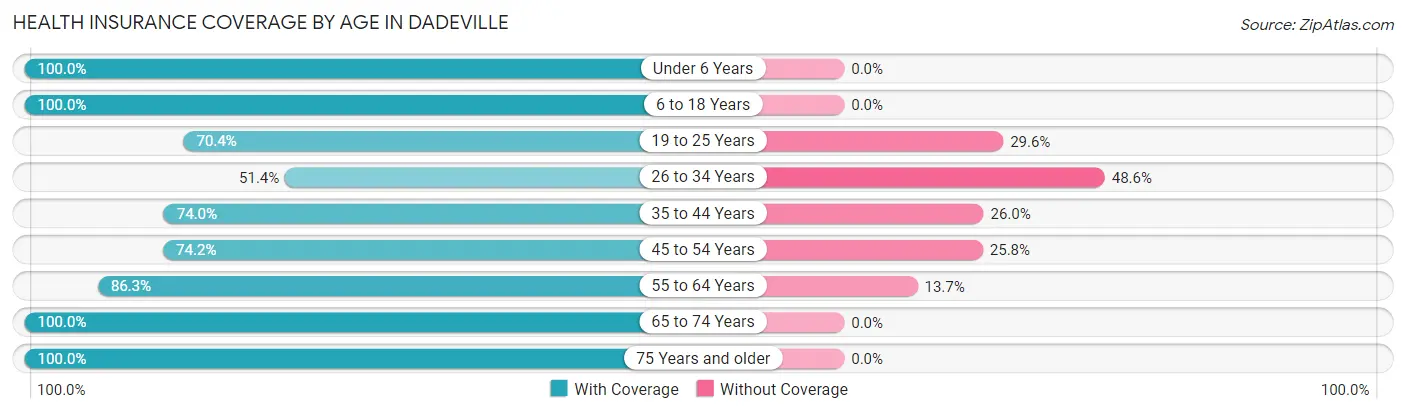
| Age Bracket | With Coverage | Without Coverage |
| Under 6 Years | 167 (100.0%) | 0 (0.0%) |
| 6 to 18 Years | 341 (100.0%) | 0 (0.0%) |
| 19 to 25 Years | 190 (70.4%) | 80 (29.6%) |
| 26 to 34 Years | 145 (51.4%) | 137 (48.6%) |
| 35 to 44 Years | 342 (74.0%) | 120 (26.0%) |
| 45 to 54 Years | 198 (74.2%) | 69 (25.8%) |
| 55 to 64 Years | 436 (86.3%) | 69 (13.7%) |
| 65 to 74 Years | 227 (100.0%) | 0 (0.0%) |
| 75 Years and older | 268 (100.0%) | 0 (0.0%) |
| Total | 2,314 (83.0%) | 475 (17.0%) |
Health Insurance Coverage by Citizenship Status in Dadeville

| Citizenship Status | With Coverage | Without Coverage |
| Native Born | 167 (100.0%) | 0 (0.0%) |
| Foreign Born, Citizen | 341 (100.0%) | 0 (0.0%) |
| Foreign Born, not a Citizen | 190 (70.4%) | 80 (29.6%) |
Health Insurance Coverage by Household Income in Dadeville

| Household Income | With Coverage | Without Coverage |
| Under $25,000 | 474 (68.1%) | 222 (31.9%) |
| $25,000 to $49,999 | 271 (81.6%) | 61 (18.4%) |
| $50,000 to $74,999 | 390 (91.3%) | 37 (8.7%) |
| $75,000 to $99,999 | 739 (89.1%) | 90 (10.9%) |
| $100,000 and over | 431 (88.5%) | 56 (11.5%) |
Public vs Private Health Insurance Coverage by Age in Dadeville
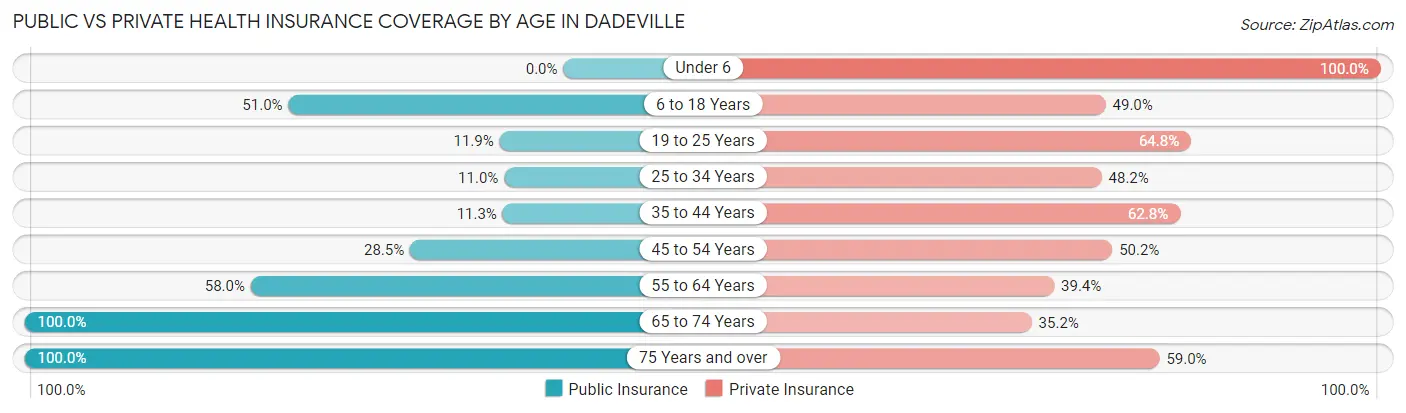
| Age Bracket | Public Insurance | Private Insurance |
| Under 6 | 0 (0.0%) | 167 (100.0%) |
| 6 to 18 Years | 174 (51.0%) | 167 (49.0%) |
| 19 to 25 Years | 32 (11.8%) | 175 (64.8%) |
| 25 to 34 Years | 31 (11.0%) | 136 (48.2%) |
| 35 to 44 Years | 52 (11.3%) | 290 (62.8%) |
| 45 to 54 Years | 76 (28.5%) | 134 (50.2%) |
| 55 to 64 Years | 293 (58.0%) | 199 (39.4%) |
| 65 to 74 Years | 227 (100.0%) | 80 (35.2%) |
| 75 Years and over | 268 (100.0%) | 158 (59.0%) |
| Total | 1,153 (41.3%) | 1,506 (54.0%) |
Disability Status by Sex by Age in Dadeville
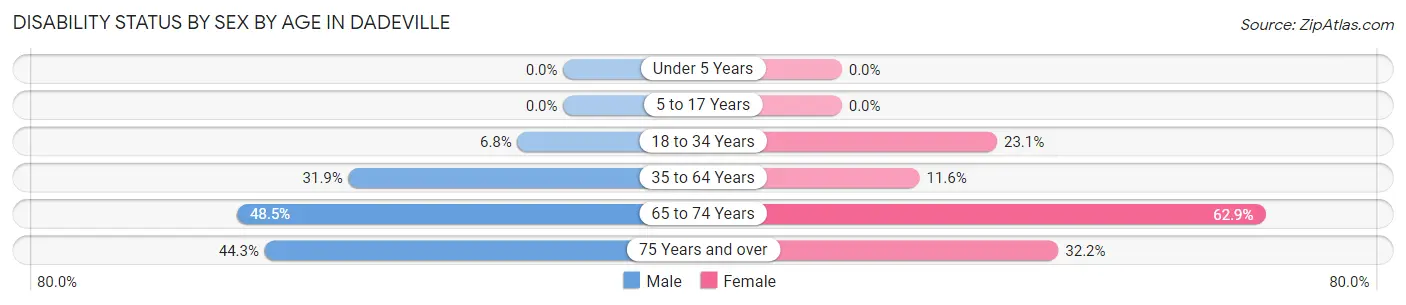
| Age Bracket | Male | Female |
| Under 5 Years | 0 (0.0%) | 0 (0.0%) |
| 5 to 17 Years | 0 (0.0%) | 0 (0.0%) |
| 18 to 34 Years | 22 (6.8%) | 62 (23.1%) |
| 35 to 64 Years | 192 (31.9%) | 73 (11.6%) |
| 65 to 74 Years | 63 (48.5%) | 61 (62.9%) |
| 75 Years and over | 43 (44.3%) | 55 (32.2%) |
Disability Class by Sex by Age in Dadeville
Disability Class: Hearing Difficulty
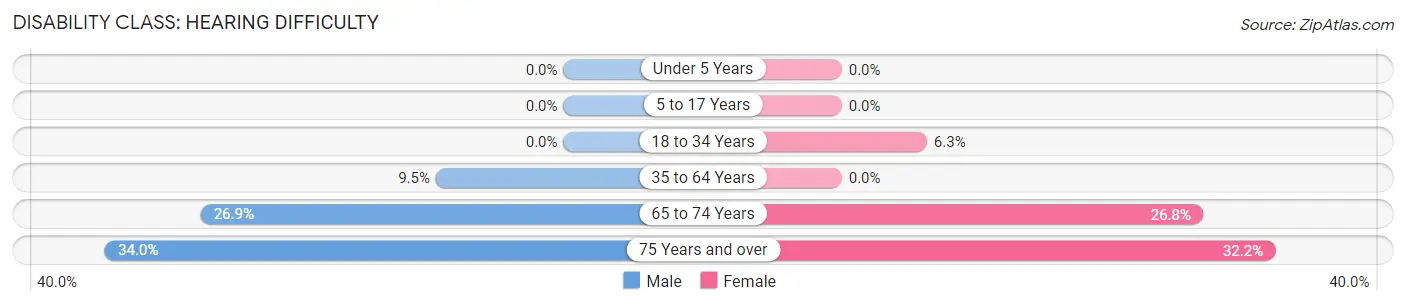
| Age Bracket | Male | Female |
| Under 5 Years | 0 (0.0%) | 0 (0.0%) |
| 5 to 17 Years | 0 (0.0%) | 0 (0.0%) |
| 18 to 34 Years | 0 (0.0%) | 17 (6.3%) |
| 35 to 64 Years | 57 (9.5%) | 0 (0.0%) |
| 65 to 74 Years | 35 (26.9%) | 26 (26.8%) |
| 75 Years and over | 33 (34.0%) | 55 (32.2%) |
Disability Class: Vision Difficulty
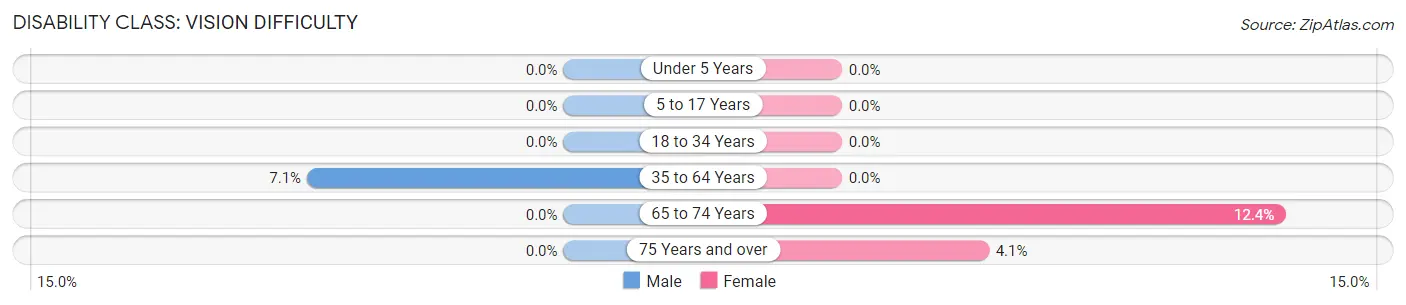
| Age Bracket | Male | Female |
| Under 5 Years | 0 (0.0%) | 0 (0.0%) |
| 5 to 17 Years | 0 (0.0%) | 0 (0.0%) |
| 18 to 34 Years | 0 (0.0%) | 0 (0.0%) |
| 35 to 64 Years | 43 (7.1%) | 0 (0.0%) |
| 65 to 74 Years | 0 (0.0%) | 12 (12.4%) |
| 75 Years and over | 0 (0.0%) | 7 (4.1%) |
Disability Class: Cognitive Difficulty
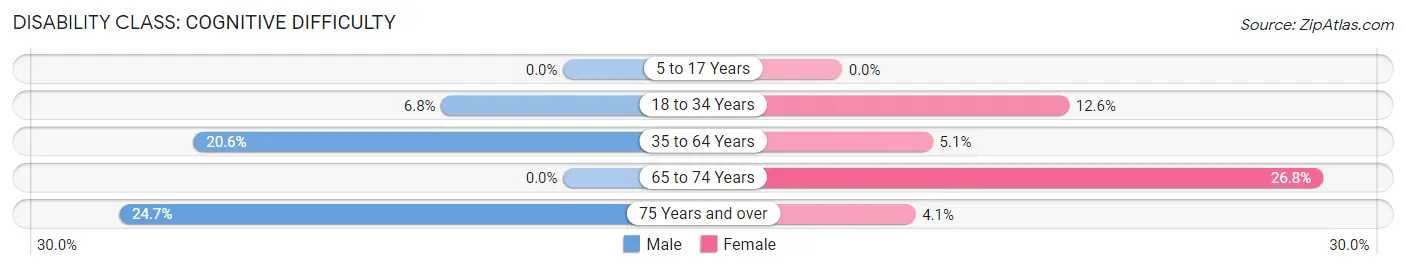
| Age Bracket | Male | Female |
| 5 to 17 Years | 0 (0.0%) | 0 (0.0%) |
| 18 to 34 Years | 22 (6.8%) | 34 (12.6%) |
| 35 to 64 Years | 124 (20.6%) | 32 (5.1%) |
| 65 to 74 Years | 0 (0.0%) | 26 (26.8%) |
| 75 Years and over | 24 (24.7%) | 7 (4.1%) |
Disability Class: Ambulatory Difficulty
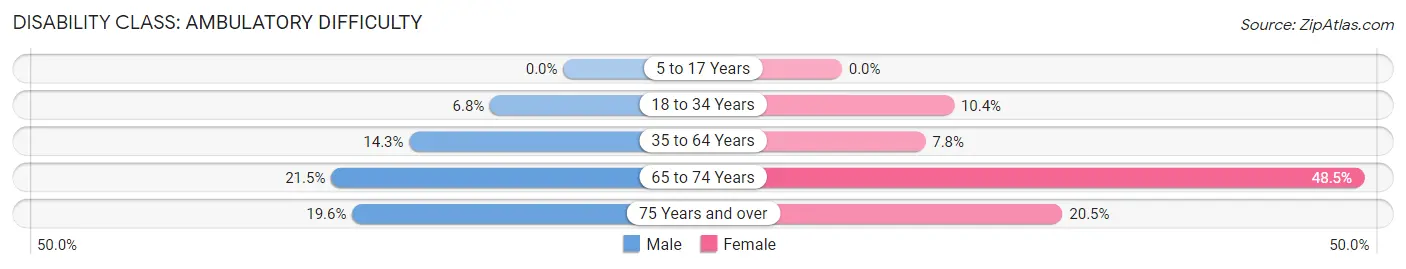
| Age Bracket | Male | Female |
| 5 to 17 Years | 0 (0.0%) | 0 (0.0%) |
| 18 to 34 Years | 22 (6.8%) | 28 (10.4%) |
| 35 to 64 Years | 86 (14.3%) | 49 (7.7%) |
| 65 to 74 Years | 28 (21.5%) | 47 (48.4%) |
| 75 Years and over | 19 (19.6%) | 35 (20.5%) |
Disability Class: Self-Care Difficulty
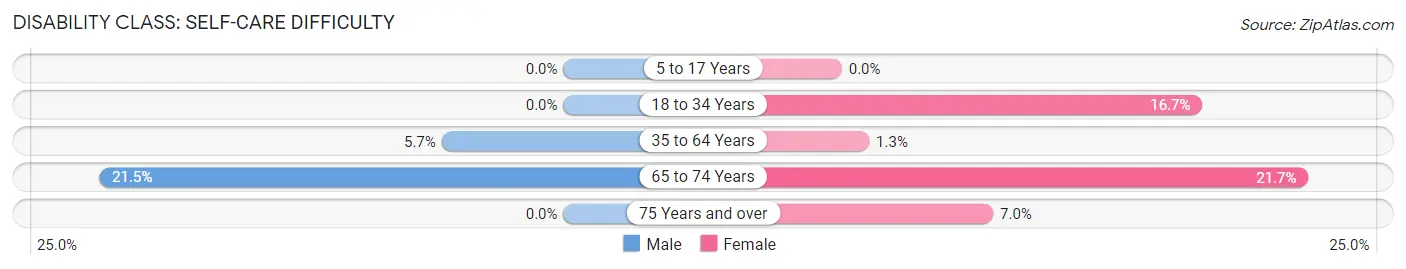
| Age Bracket | Male | Female |
| 5 to 17 Years | 0 (0.0%) | 0 (0.0%) |
| 18 to 34 Years | 0 (0.0%) | 45 (16.7%) |
| 35 to 64 Years | 34 (5.7%) | 8 (1.3%) |
| 65 to 74 Years | 28 (21.5%) | 21 (21.6%) |
| 75 Years and over | 0 (0.0%) | 12 (7.0%) |
Technology Access in Dadeville
Computing Device Access in Dadeville
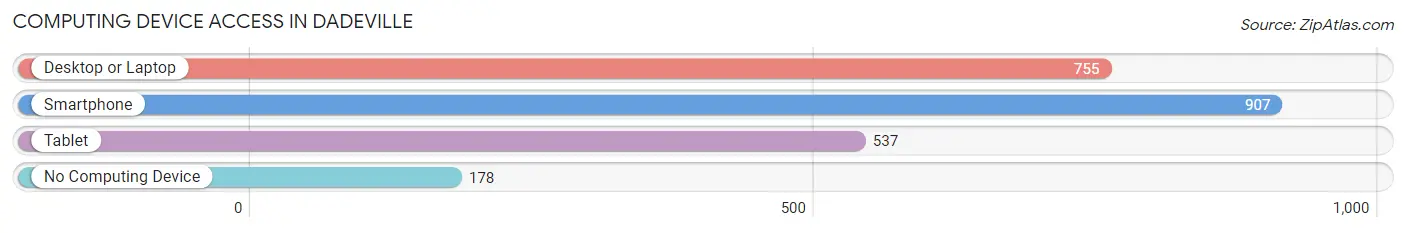
| Device Type | # Households | % Households |
| Desktop or Laptop | 755 | 65.8% |
| Smartphone | 907 | 79.1% |
| Tablet | 537 | 46.8% |
| No Computing Device | 178 | 15.5% |
| Total | 1,147 | 100.0% |
Internet Access in Dadeville
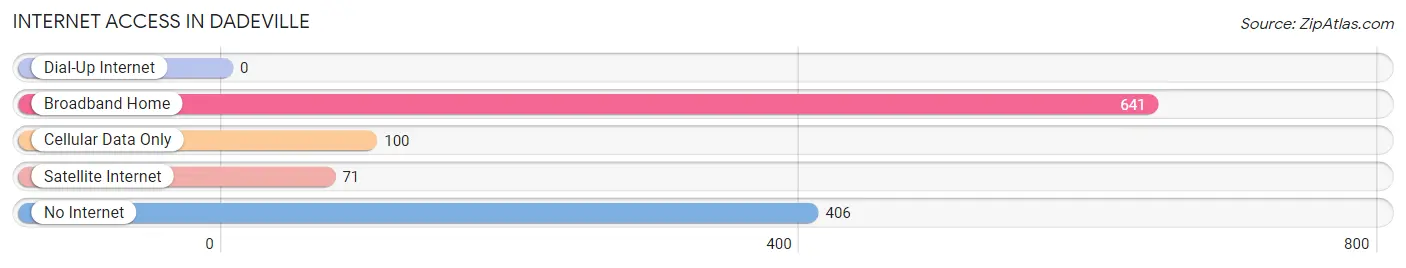
| Internet Type | # Households | % Households |
| Dial-Up Internet | 0 | 0.0% |
| Broadband Home | 641 | 55.9% |
| Cellular Data Only | 100 | 8.7% |
| Satellite Internet | 71 | 6.2% |
| No Internet | 406 | 35.4% |
| Total | 1,147 | 100.0% |
Dadeville Summary
Dadeville is a city located in Tallapoosa County, Alabama, United States. It is the county seat of Tallapoosa County. The population was 3,212 at the 2010 census.
Geography
Dadeville is located at 32 51 25 North 85 49 17 West 32 857019 85 821445
According to the United States Census Bureau, the city has a total area of 4.2 square miles (10.8 km2), all land.
History
Dadeville was founded in 1833 and named after Major Francis Langhorne Dade, who was killed in the Second Seminole War in Florida. The city was incorporated in 1837.
Dadeville was the site of a major battle in the Creek War of 1836. The Battle of Dadeville was fought on November 30, 1836, between the Creek Indians and the United States Army. The battle was a victory for the United States, and it effectively ended the Creek War.
Economy
The economy of Dadeville is largely based on agriculture and tourism. The city is home to several farms, as well as a number of tourist attractions, such as Lake Martin, Wind Creek State Park, and the Dadeville Historic District.
The city is also home to several manufacturing companies, including a paper mill, a furniture factory, and a textile mill.
Demographics
As of the census of 2010, there were 3,212 people, 1,323 households, and 845 families residing in the city. The population density was 762.2 people per square mile (294.3/km2). There were 1,521 housing units at an average density of 361.7 per square mile (140.1/km2). The racial makeup of the city was 68.2% White, 28.7% Black or African American, 0.2% Native American, 0.4% Asian, 0.1% Pacific Islander, 0.7% from other races, and 1.7% from two or more races. 2.2% of the population were Hispanic or Latino of any race.
There were 1,323 households, out of which 28.2% had children under the age of 18 living with them, 41.2% were married couples living together, 19.2% had a female householder with no husband present, and 35.3% were non-families. 30.7% of all households were made up of individuals, and 13.2% had someone living alone who was 65 years of age or older. The average household size was 2.41 and the average family size was 3.00.
In the city, the population was spread out, with 25.2% under the age of 18, 8.3% from 18 to 24, 25.7% from 25 to 44, 24.2% from 45 to 64, and 16.6% who were 65 years of age or older. The median age was 38 years. For every 100 females, there were 86.2 males. For every 100 females age 18 and over, there were 81.2 males.
The median income for a household in the city was $27,917, and the median income for a family was $35,938. Males had a median income of $30,000 versus $20,938 for females. The per capita income for the city was $15,945. About 17.2% of families and 20.2% of the population were below the poverty line, including 28.2% of those under age 18 and 16.2% of those age 65 or over.
Common Questions
What is Per Capita Income in Dadeville?
Per Capita income in Dadeville is $22,639.
What is the Median Family Income in Dadeville?
Median Family Income in Dadeville is $67,454.
What is the Median Household income in Dadeville?
Median Household Income in Dadeville is $46,477.
What is Income or Wage Gap in Dadeville?
Income or Wage Gap in Dadeville is 21.0%.
Women in Dadeville earn 79.0 cents for every dollar earned by a man.
What is Inequality or Gini Index in Dadeville?
Inequality or Gini Index in Dadeville is 0.45.
What is the Total Population of Dadeville?
Total Population of Dadeville is 3,062.
What is the Total Male Population of Dadeville?
Total Male Population of Dadeville is 1,605.
What is the Total Female Population of Dadeville?
Total Female Population of Dadeville is 1,457.
What is the Ratio of Males per 100 Females in Dadeville?
There are 110.16 Males per 100 Females in Dadeville.
What is the Ratio of Females per 100 Males in Dadeville?
There are 90.78 Females per 100 Males in Dadeville.
What is the Median Population Age in Dadeville?
Median Population Age in Dadeville is 42.8 Years.
What is the Average Family Size in Dadeville
Average Family Size in Dadeville is 3.3 People.
What is the Average Household Size in Dadeville
Average Household Size in Dadeville is 2.4 People.
How Large is the Labor Force in Dadeville?
There are 1,232 People in the Labor Forcein in Dadeville.
What is the Percentage of People in the Labor Force in Dadeville?
47.0% of People are in the Labor Force in Dadeville.
What is the Unemployment Rate in Dadeville?
Unemployment Rate in Dadeville is 27.9%.