Zip Codes with the Highest Percentage of Households Without a Vehicle in Cullman, AL
RELATED REPORTS & OPTIONS
Households without a Cars
Cullman
Compare Zip Codes
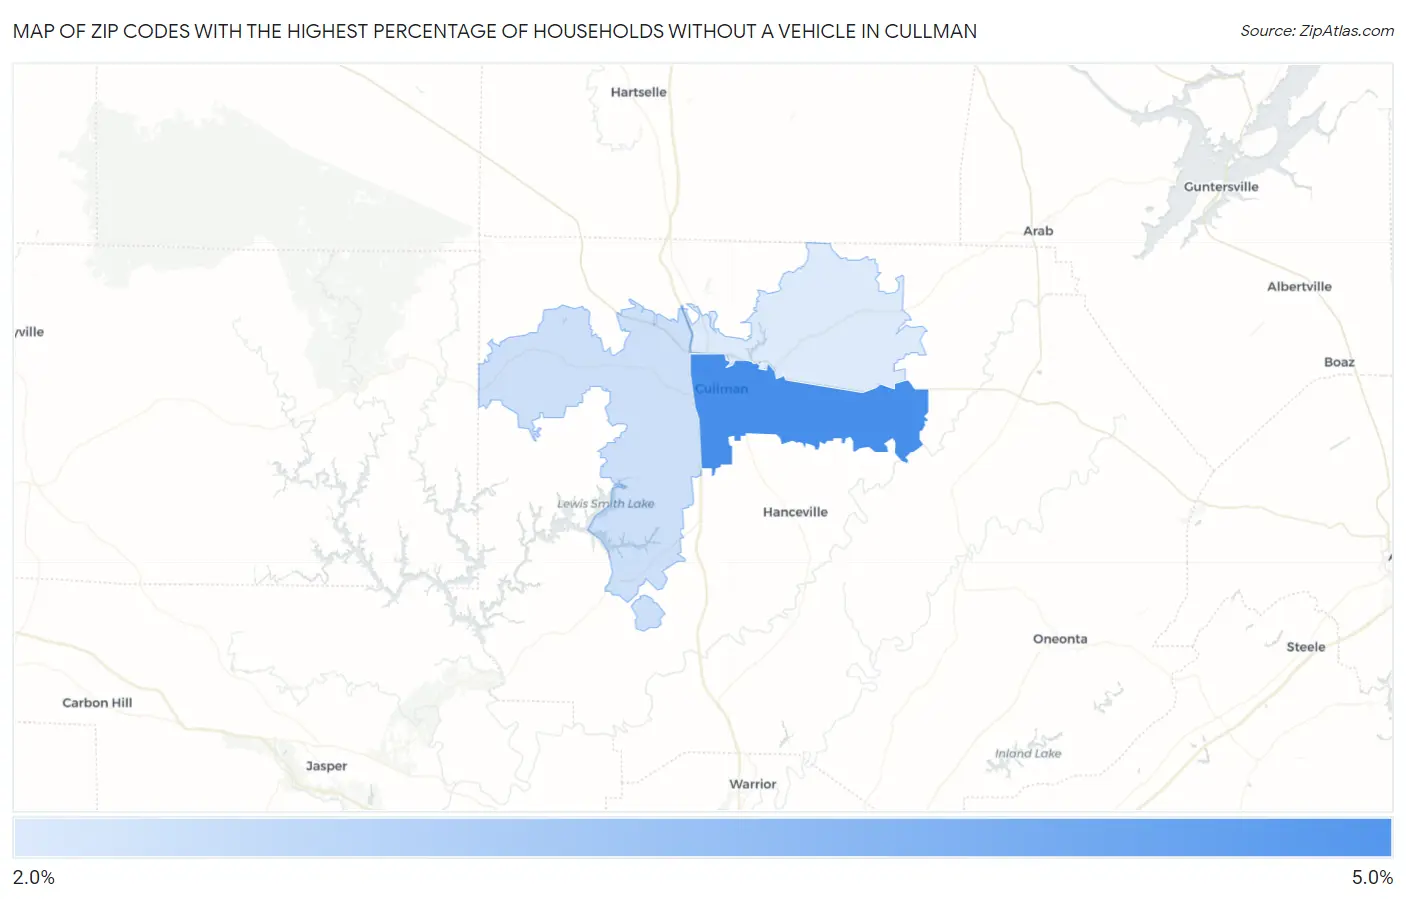
Map of Zip Codes with the Highest Percentage of Households Without a Vehicle in Cullman
2.0%
4.8%
Zip Codes with the Highest Percentage of Households Without a Vehicle in Cullman, AL
| Zip Code | Housholds Without a Car | vs State | vs National | |
| 1. | 35055 | 4.8% | 5.6%(-0.800)#262 | 8.3%(-3.50)#13,380 |
| 2. | 35057 | 2.3% | 5.6%(-3.30)#442 | 8.3%(-6.00)#21,423 |
| 3. | 35058 | 2.0% | 5.6%(-3.60)#460 | 8.3%(-6.30)#22,497 |
1
Common Questions
What are the Top Zip Codes with the Highest Percentage of Households Without a Vehicle in Cullman, AL?
Top Zip Codes with the Highest Percentage of Households Without a Vehicle in Cullman, AL are:
What zip code has the Highest Percentage of Households Without a Vehicle in Cullman, AL?
35055 has the Highest Percentage of Households Without a Vehicle in Cullman, AL with 4.8%.
What is the Percentage of Households Without a Vehicle in Cullman, AL?
Percentage of Households Without a Vehicle in Cullman is 4.8%.
What is the Percentage of Households Without a Vehicle in Alabama?
Percentage of Households Without a Vehicle in Alabama is 5.6%.
What is the Percentage of Households Without a Vehicle in the United States?
Percentage of Households Without a Vehicle in the United States is 8.3%.