Zip Codes with the Highest Percentage of Households Without a Vehicle in Sylacauga, AL
RELATED REPORTS & OPTIONS
Households without a Cars
Sylacauga
Compare Zip Codes
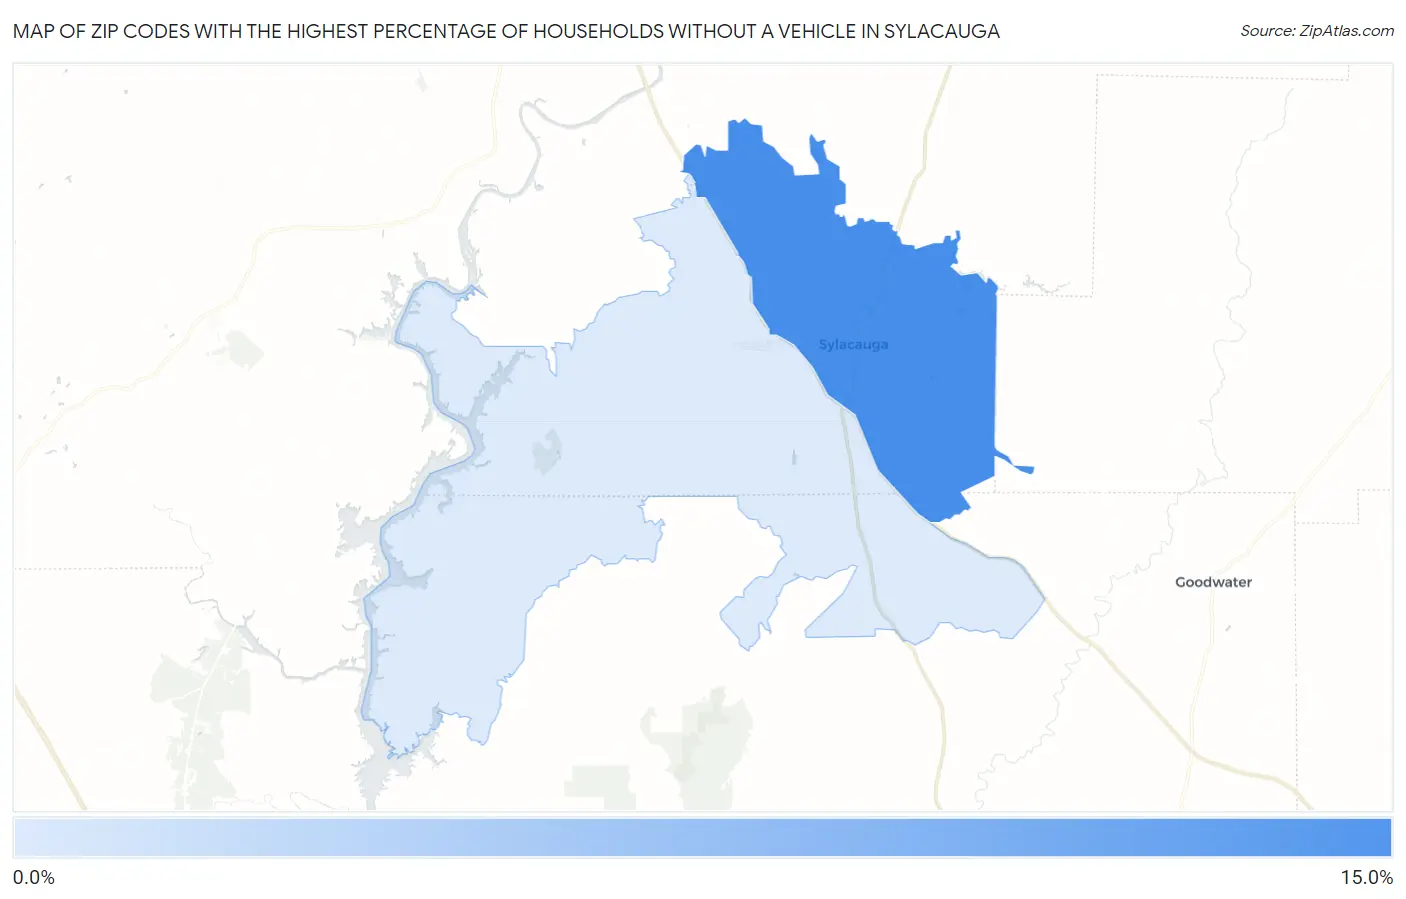
Map of Zip Codes with the Highest Percentage of Households Without a Vehicle in Sylacauga
2.7%
11.5%
Zip Codes with the Highest Percentage of Households Without a Vehicle in Sylacauga, AL
| Zip Code | Housholds Without a Car | vs State | vs National | |
| 1. | 35150 | 11.5% | 5.6%(+5.90)#82 | 8.3%(+3.20)#3,829 |
| 2. | 35151 | 2.7% | 5.6%(-2.90)#422 | 8.3%(-5.60)#20,182 |
1
Common Questions
What are the Top Zip Codes with the Highest Percentage of Households Without a Vehicle in Sylacauga, AL?
Top Zip Codes with the Highest Percentage of Households Without a Vehicle in Sylacauga, AL are:
What zip code has the Highest Percentage of Households Without a Vehicle in Sylacauga, AL?
35150 has the Highest Percentage of Households Without a Vehicle in Sylacauga, AL with 11.5%.
What is the Percentage of Households Without a Vehicle in Sylacauga, AL?
Percentage of Households Without a Vehicle in Sylacauga is 11.4%.
What is the Percentage of Households Without a Vehicle in Alabama?
Percentage of Households Without a Vehicle in Alabama is 5.6%.
What is the Percentage of Households Without a Vehicle in the United States?
Percentage of Households Without a Vehicle in the United States is 8.3%.