Courtland, AL Map & Demographics
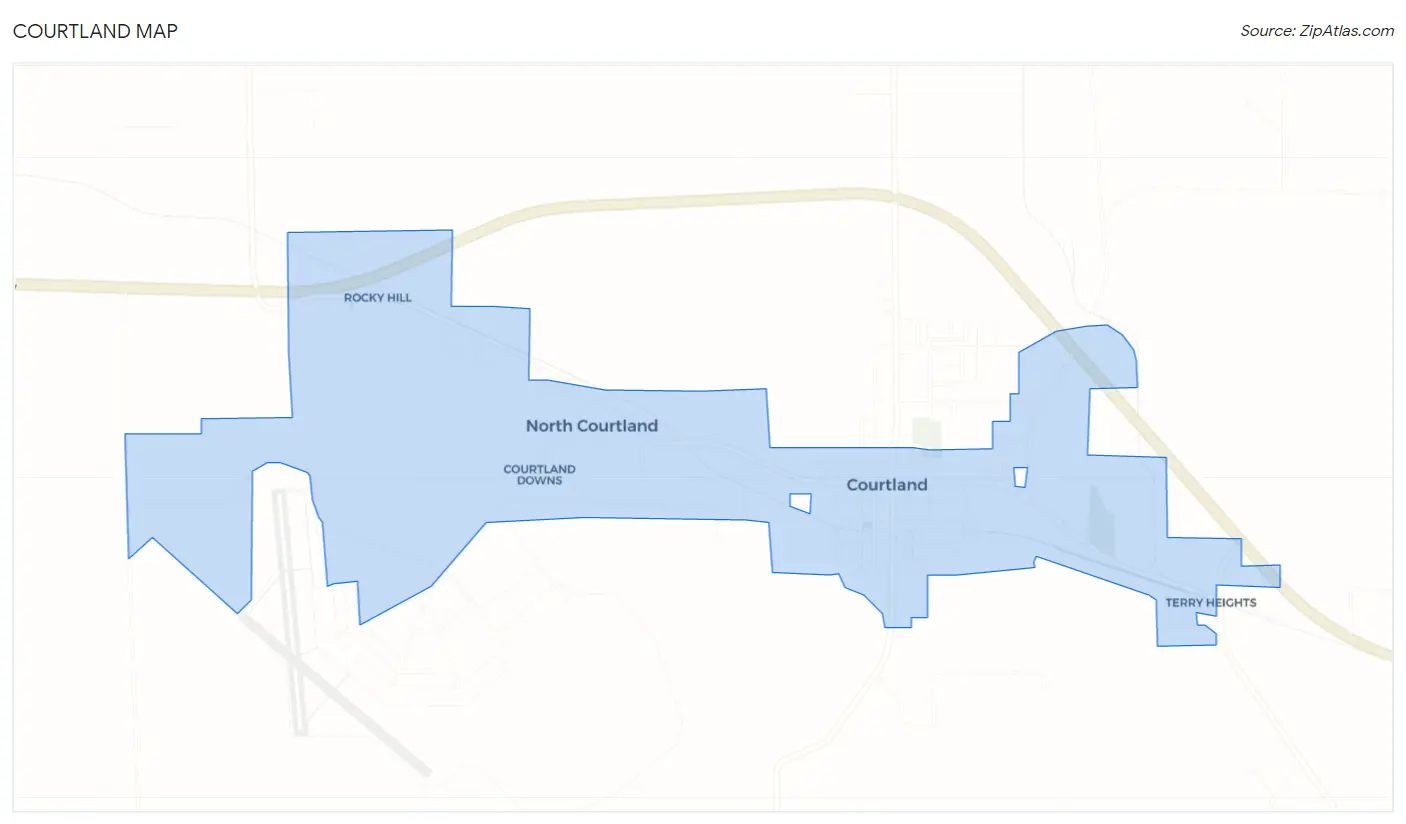
Courtland Map
Courtland Overview
$18,360
PER CAPITA INCOME
$54,886
AVG FAMILY INCOME
$39,900
AVG HOUSEHOLD INCOME
26.5%
WAGE / INCOME GAP [ % ]
73.5¢/ $1
WAGE / INCOME GAP [ $ ]
0.42
INEQUALITY / GINI INDEX
769
TOTAL POPULATION
305
MALE POPULATION
464
FEMALE POPULATION
65.73
MALES / 100 FEMALES
152.13
FEMALES / 100 MALES
42.4
MEDIAN AGE
3.3
AVG FAMILY SIZE
2.5
AVG HOUSEHOLD SIZE
198
LABOR FORCE [ PEOPLE ]
32.2%
PERCENT IN LABOR FORCE
2.5%
UNEMPLOYMENT RATE
Courtland Zip Codes
Courtland Area Codes
Income in Courtland
Income Overview in Courtland
Per Capita Income in Courtland is $18,360, while median incomes of families and households are $54,886 and $39,900 respectively.
| Characteristic | Number | Measure |
| Per Capita Income | 769 | $18,360 |
| Median Family Income | 199 | $54,886 |
| Mean Family Income | 199 | $57,310 |
| Median Household Income | 314 | $39,900 |
| Mean Household Income | 314 | $45,643 |
| Income Deficit | 199 | $0 |
| Wage / Income Gap (%) | 769 | 26.54% |
| Wage / Income Gap ($) | 769 | 73.46¢ per $1 |
| Gini / Inequality Index | 769 | 0.42 |
Earnings by Sex in Courtland
Average Earnings in Courtland are $40,658, $45,417 for men and $33,365 for women, a difference of 26.5%.
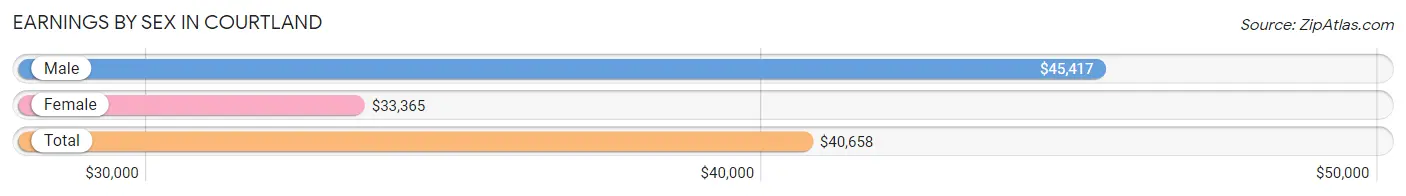
| Sex | Number | Average Earnings |
| Male | 101 (50.5%) | $45,417 |
| Female | 99 (49.5%) | $33,365 |
| Total | 200 (100.0%) | $40,658 |
Earnings by Sex by Income Bracket in Courtland
The most common earnings brackets in Courtland are $40,000 to $44,999 for men (22 | 21.8%) and $5,000 to $7,499 for women (29 | 29.3%).
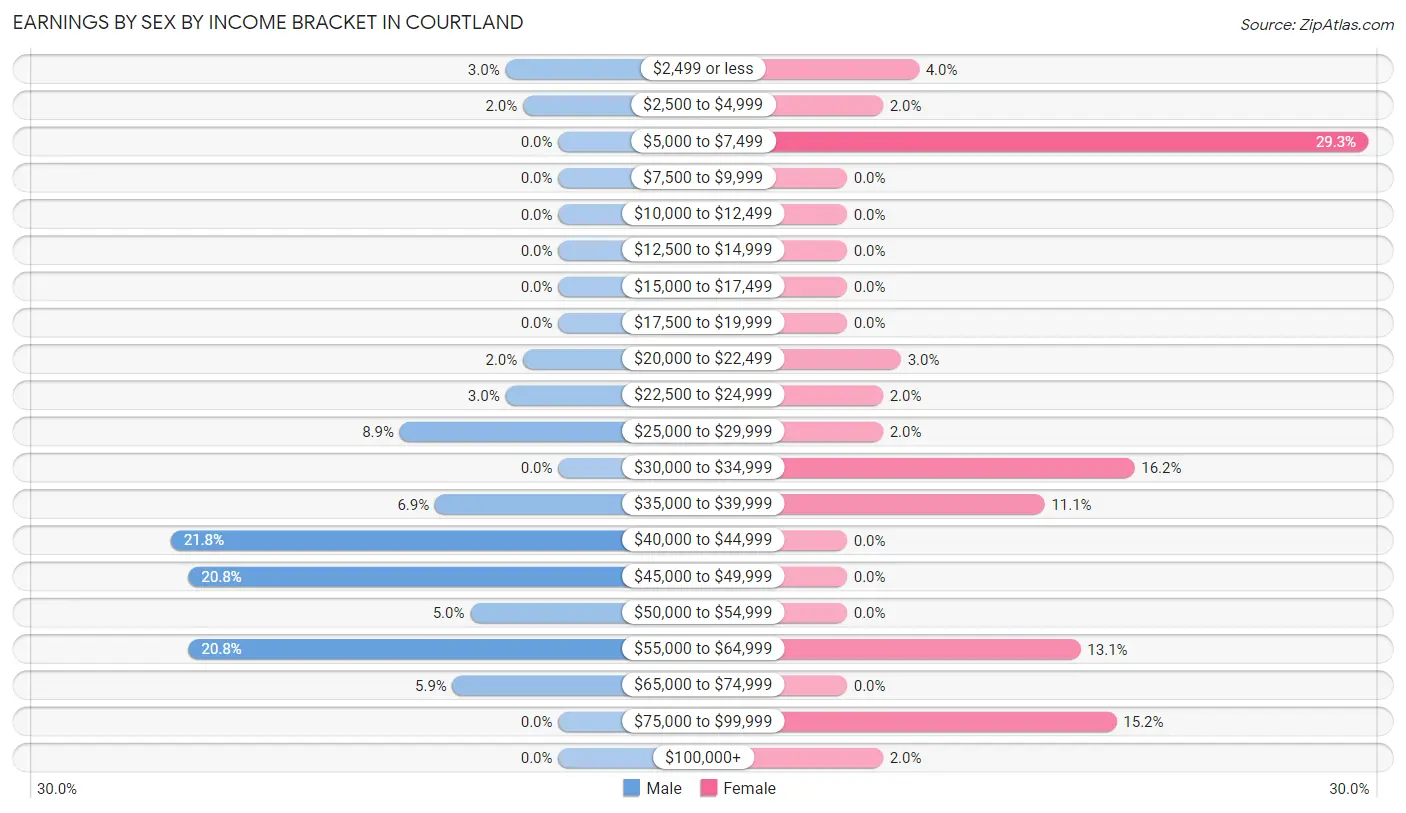
| Income | Male | Female |
| $2,499 or less | 3 (3.0%) | 4 (4.0%) |
| $2,500 to $4,999 | 2 (2.0%) | 2 (2.0%) |
| $5,000 to $7,499 | 0 (0.0%) | 29 (29.3%) |
| $7,500 to $9,999 | 0 (0.0%) | 0 (0.0%) |
| $10,000 to $12,499 | 0 (0.0%) | 0 (0.0%) |
| $12,500 to $14,999 | 0 (0.0%) | 0 (0.0%) |
| $15,000 to $17,499 | 0 (0.0%) | 0 (0.0%) |
| $17,500 to $19,999 | 0 (0.0%) | 0 (0.0%) |
| $20,000 to $22,499 | 2 (2.0%) | 3 (3.0%) |
| $22,500 to $24,999 | 3 (3.0%) | 2 (2.0%) |
| $25,000 to $29,999 | 9 (8.9%) | 2 (2.0%) |
| $30,000 to $34,999 | 0 (0.0%) | 16 (16.2%) |
| $35,000 to $39,999 | 7 (6.9%) | 11 (11.1%) |
| $40,000 to $44,999 | 22 (21.8%) | 0 (0.0%) |
| $45,000 to $49,999 | 21 (20.8%) | 0 (0.0%) |
| $50,000 to $54,999 | 5 (5.0%) | 0 (0.0%) |
| $55,000 to $64,999 | 21 (20.8%) | 13 (13.1%) |
| $65,000 to $74,999 | 6 (5.9%) | 0 (0.0%) |
| $75,000 to $99,999 | 0 (0.0%) | 15 (15.1%) |
| $100,000+ | 0 (0.0%) | 2 (2.0%) |
| Total | 101 (100.0%) | 99 (100.0%) |
Earnings by Sex by Educational Attainment in Courtland
Average earnings in Courtland are $45,833 for men and $33,558 for women, a difference of 26.8%. Men with an educational attainment of high school diploma enjoy the highest average annual earnings of $42,368, while those with college or associate's degree education earn the least with $38,750. Women with an educational attainment of high school diploma earn the most with the average annual earnings of $32,885, while those with high school diploma education have the smallest earnings of $32,885.
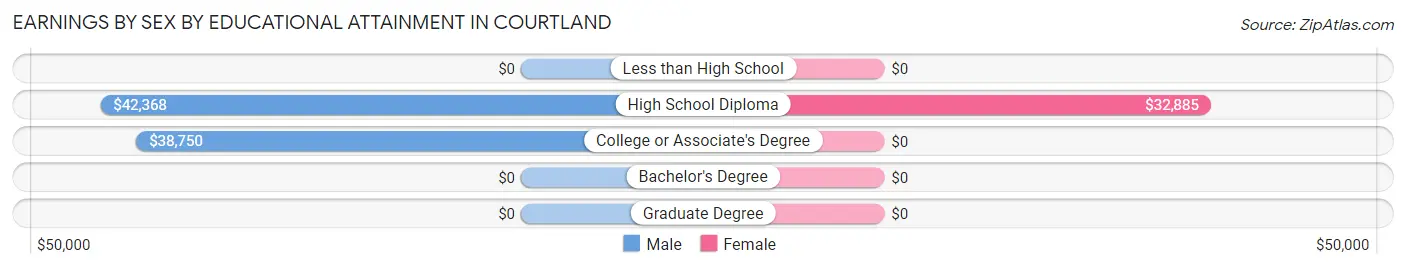
| Educational Attainment | Male Income | Female Income |
| Less than High School | - | - |
| High School Diploma | $42,368 | $32,885 |
| College or Associate's Degree | $38,750 | $0 |
| Bachelor's Degree | - | - |
| Graduate Degree | - | - |
| Total | $45,833 | $33,558 |
Family Income in Courtland
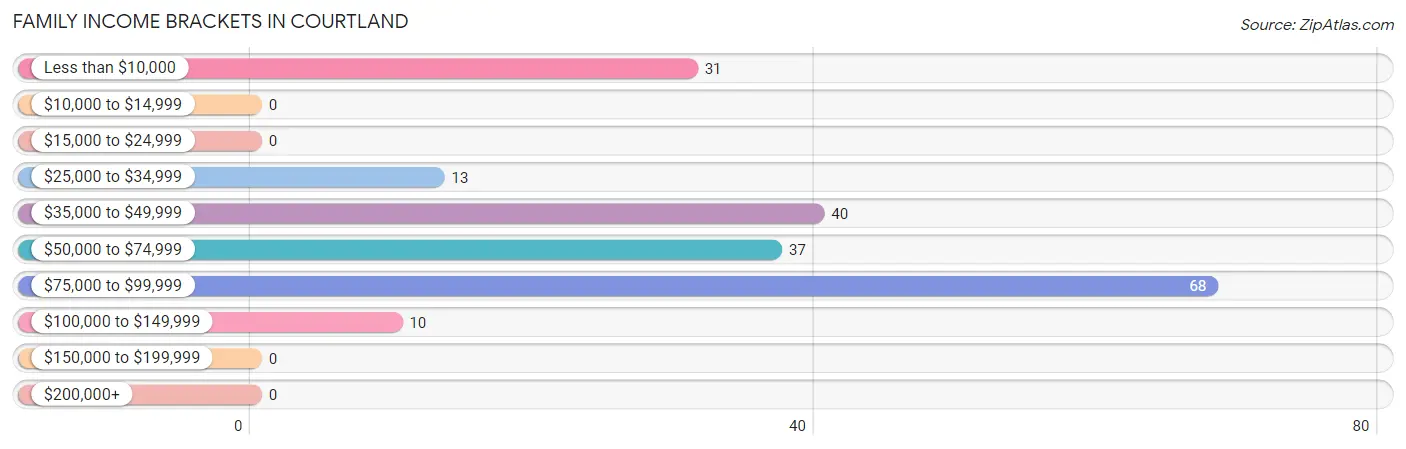
Family Income Brackets in Courtland
According to the Courtland family income data, there are 68 families falling into the $75,000 to $99,999 income range, which is the most common income bracket and makes up 34.2% of all families.
| Income Bracket | # Families | % Families |
| Less than $10,000 | 31 | 15.6% |
| $10,000 to $14,999 | 0 | 0.0% |
| $15,000 to $24,999 | 0 | 0.0% |
| $25,000 to $34,999 | 13 | 6.5% |
| $35,000 to $49,999 | 40 | 20.1% |
| $50,000 to $74,999 | 37 | 18.6% |
| $75,000 to $99,999 | 68 | 34.2% |
| $100,000 to $149,999 | 10 | 5.0% |
| $150,000 to $199,999 | 0 | 0.0% |
| $200,000+ | 0 | 0.0% |
Family Income by Famaliy Size in Courtland
2-person families (119 | 59.8%) account for the highest median family income in Courtland with $76,544 per family, while 2-person families (119 | 59.8%) have the highest median income of $38,272 per family member.
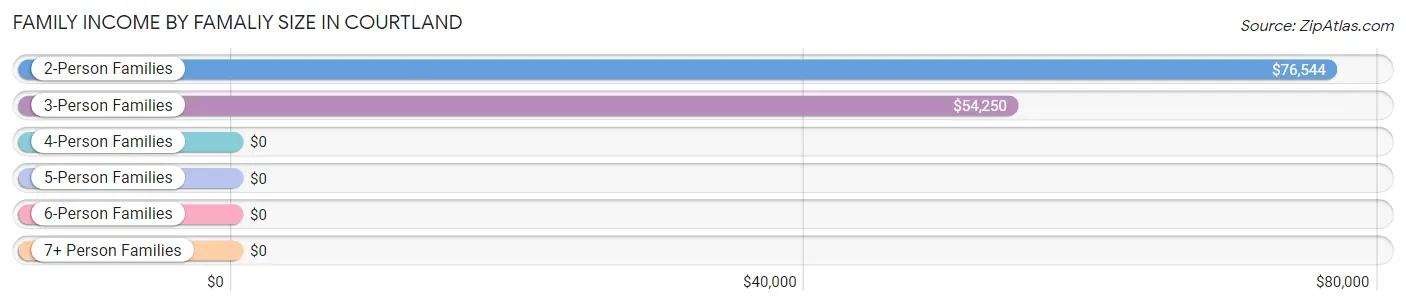
| Income Bracket | # Families | Median Income |
| 2-Person Families | 119 (59.8%) | $76,544 |
| 3-Person Families | 17 (8.5%) | $54,250 |
| 4-Person Families | 43 (21.6%) | $0 |
| 5-Person Families | 14 (7.0%) | $0 |
| 6-Person Families | 6 (3.0%) | $0 |
| 7+ Person Families | 0 (0.0%) | $0 |
| Total | 199 (100.0%) | $54,886 |
Family Income by Number of Earners in Courtland
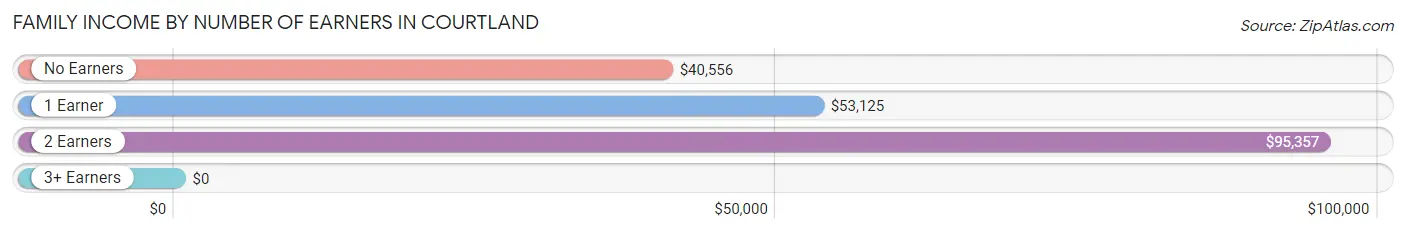
| Number of Earners | # Families | Median Income |
| No Earners | 76 (38.2%) | $40,556 |
| 1 Earner | 82 (41.2%) | $53,125 |
| 2 Earners | 40 (20.1%) | $95,357 |
| 3+ Earners | 1 (0.5%) | $0 |
| Total | 199 (100.0%) | $54,886 |
Household Income in Courtland
Household Income Brackets in Courtland
With 68 households falling in the category, the $75,000 to $99,999 income range is the most frequent in Courtland, accounting for 21.7% of all households.
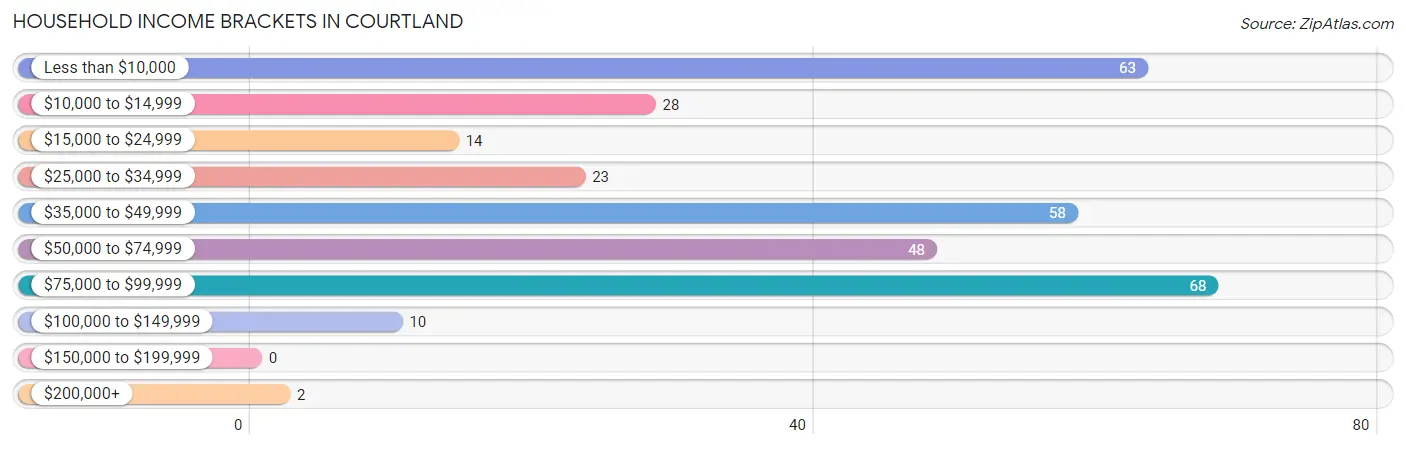
| Income Bracket | # Households | % Households |
| Less than $10,000 | 63 | 20.1% |
| $10,000 to $14,999 | 28 | 8.9% |
| $15,000 to $24,999 | 14 | 4.5% |
| $25,000 to $34,999 | 23 | 7.3% |
| $35,000 to $49,999 | 58 | 18.5% |
| $50,000 to $74,999 | 48 | 15.3% |
| $75,000 to $99,999 | 68 | 21.7% |
| $100,000 to $149,999 | 10 | 3.2% |
| $150,000 to $199,999 | 0 | 0.0% |
| $200,000+ | 2 | 0.6% |
Household Income by Householder Age in Courtland
The median household income in Courtland is $39,900, with the highest median household income of $46,250 found in the 45 to 64 years age bracket for the primary householder. A total of 124 households (39.5%) fall into this category.
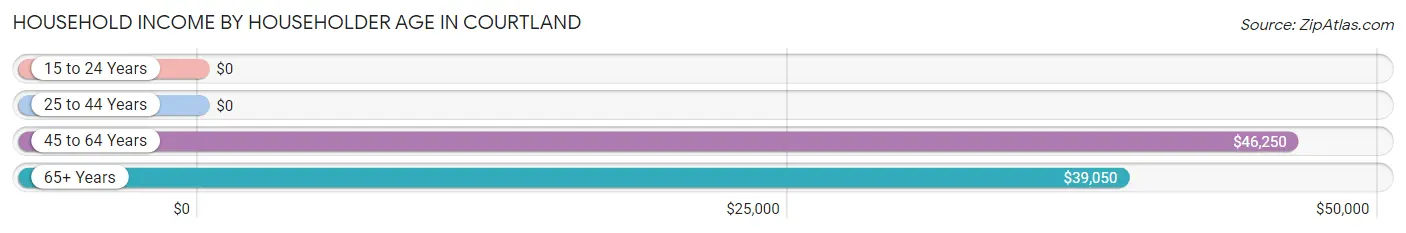
| Income Bracket | # Households | Median Income |
| 15 to 24 Years | 0 (0.0%) | $0 |
| 25 to 44 Years | 73 (23.3%) | $0 |
| 45 to 64 Years | 124 (39.5%) | $46,250 |
| 65+ Years | 117 (37.3%) | $39,050 |
| Total | 314 (100.0%) | $39,900 |
Poverty in Courtland
Income Below Poverty by Sex and Age in Courtland
With 21.0% poverty level for males and 36.8% for females among the residents of Courtland, 6 to 11 year old males and under 5 year old females are the most vulnerable to poverty, with 42 males (93.3%) and 38 females (100.0%) in their respective age groups living below the poverty level.
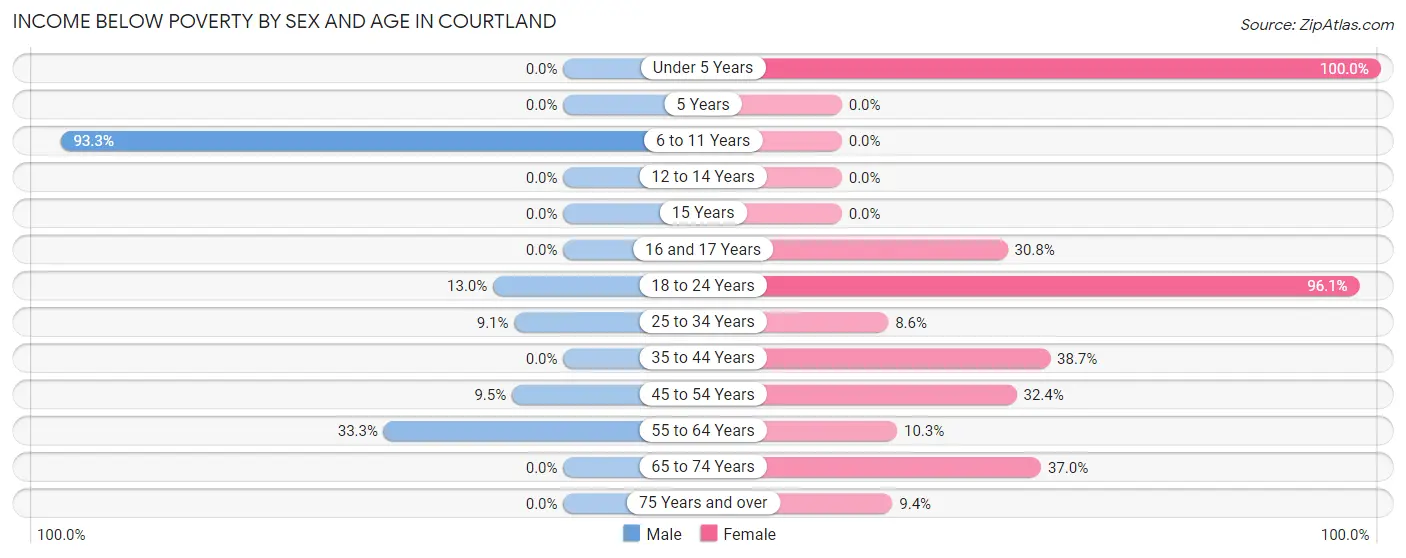
| Age Bracket | Male | Female |
| Under 5 Years | 0 (0.0%) | 38 (100.0%) |
| 5 Years | 0 (0.0%) | 0 (0.0%) |
| 6 to 11 Years | 42 (93.3%) | 0 (0.0%) |
| 12 to 14 Years | 0 (0.0%) | 0 (0.0%) |
| 15 Years | 0 (0.0%) | 0 (0.0%) |
| 16 and 17 Years | 0 (0.0%) | 4 (30.8%) |
| 18 to 24 Years | 3 (13.0%) | 49 (96.1%) |
| 25 to 34 Years | 3 (9.1%) | 5 (8.6%) |
| 35 to 44 Years | 0 (0.0%) | 29 (38.7%) |
| 45 to 54 Years | 4 (9.5%) | 12 (32.4%) |
| 55 to 64 Years | 12 (33.3%) | 4 (10.3%) |
| 65 to 74 Years | 0 (0.0%) | 27 (37.0%) |
| 75 Years and over | 0 (0.0%) | 3 (9.4%) |
| Total | 64 (21.0%) | 171 (36.8%) |
Income Above Poverty by Sex and Age in Courtland
According to the poverty statistics in Courtland, males aged under 5 years and females aged 6 to 11 years are the age groups that are most secure financially, with 100.0% of males and 100.0% of females in these age groups living above the poverty line.
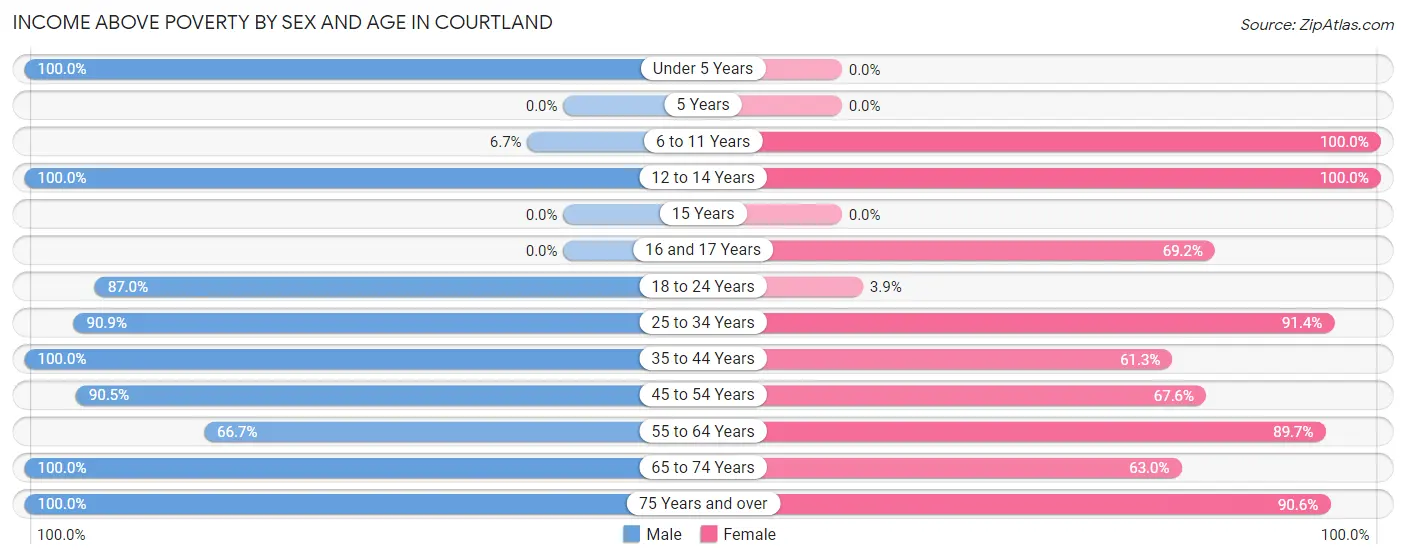
| Age Bracket | Male | Female |
| Under 5 Years | 14 (100.0%) | 0 (0.0%) |
| 5 Years | 0 (0.0%) | 0 (0.0%) |
| 6 to 11 Years | 3 (6.7%) | 29 (100.0%) |
| 12 to 14 Years | 10 (100.0%) | 19 (100.0%) |
| 15 Years | 0 (0.0%) | 0 (0.0%) |
| 16 and 17 Years | 0 (0.0%) | 9 (69.2%) |
| 18 to 24 Years | 20 (87.0%) | 2 (3.9%) |
| 25 to 34 Years | 30 (90.9%) | 53 (91.4%) |
| 35 to 44 Years | 30 (100.0%) | 46 (61.3%) |
| 45 to 54 Years | 38 (90.5%) | 25 (67.6%) |
| 55 to 64 Years | 24 (66.7%) | 35 (89.7%) |
| 65 to 74 Years | 38 (100.0%) | 46 (63.0%) |
| 75 Years and over | 34 (100.0%) | 29 (90.6%) |
| Total | 241 (79.0%) | 293 (63.1%) |
Income Below Poverty Among Married-Couple Families in Courtland
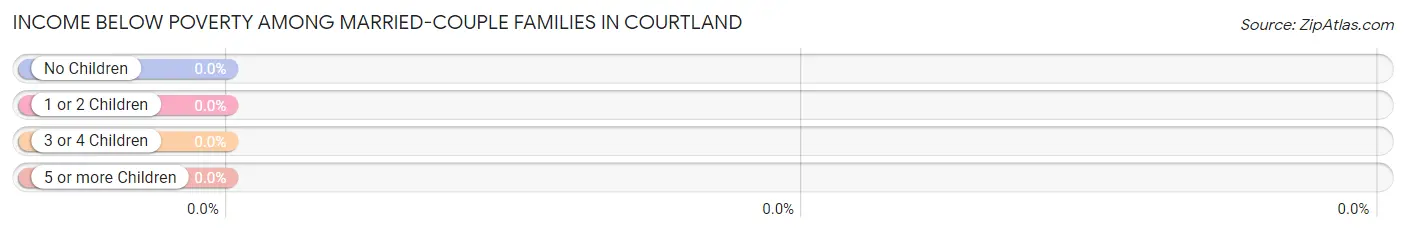
| Children | Above Poverty | Below Poverty |
| No Children | 99 (100.0%) | 0 (0.0%) |
| 1 or 2 Children | 14 (100.0%) | 0 (0.0%) |
| 3 or 4 Children | 10 (100.0%) | 0 (0.0%) |
| 5 or more Children | 0 (0.0%) | 0 (0.0%) |
| Total | 123 (100.0%) | 0 (0.0%) |
Income Below Poverty Among Single-Parent Households in Courtland
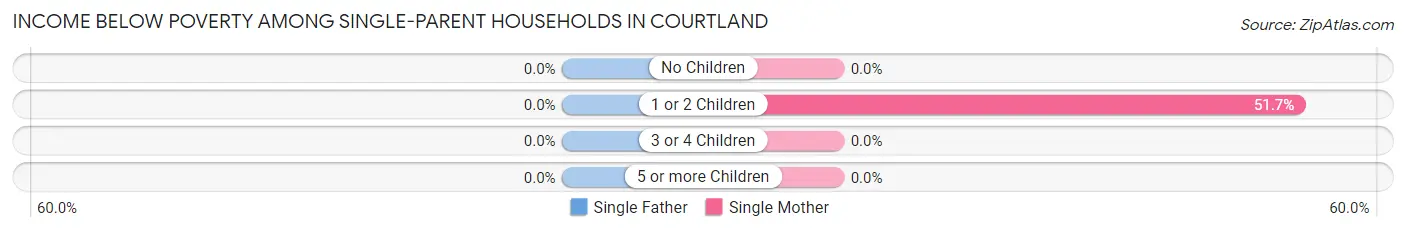
| Children | Single Father | Single Mother |
| No Children | 0 (0.0%) | 0 (0.0%) |
| 1 or 2 Children | 0 (0.0%) | 31 (51.7%) |
| 3 or 4 Children | 0 (0.0%) | 0 (0.0%) |
| 5 or more Children | 0 (0.0%) | 0 (0.0%) |
| Total | 0 (0.0%) | 31 (46.3%) |
Income Below Poverty Among Married-Couple vs Single-Parent Households in Courtland
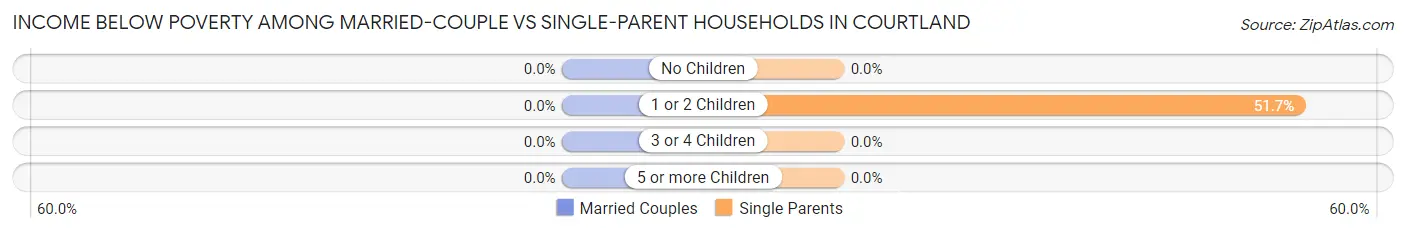
| Children | Married-Couple Families | Single-Parent Households |
| No Children | 0 (0.0%) | 0 (0.0%) |
| 1 or 2 Children | 0 (0.0%) | 31 (51.7%) |
| 3 or 4 Children | 0 (0.0%) | 0 (0.0%) |
| 5 or more Children | 0 (0.0%) | 0 (0.0%) |
| Total | 0 (0.0%) | 31 (40.8%) |
Race in Courtland
The most populous races in Courtland are White / Caucasian (391 | 50.8%), Black / African American (364 | 47.3%), and Two or more Races (10 | 1.3%).
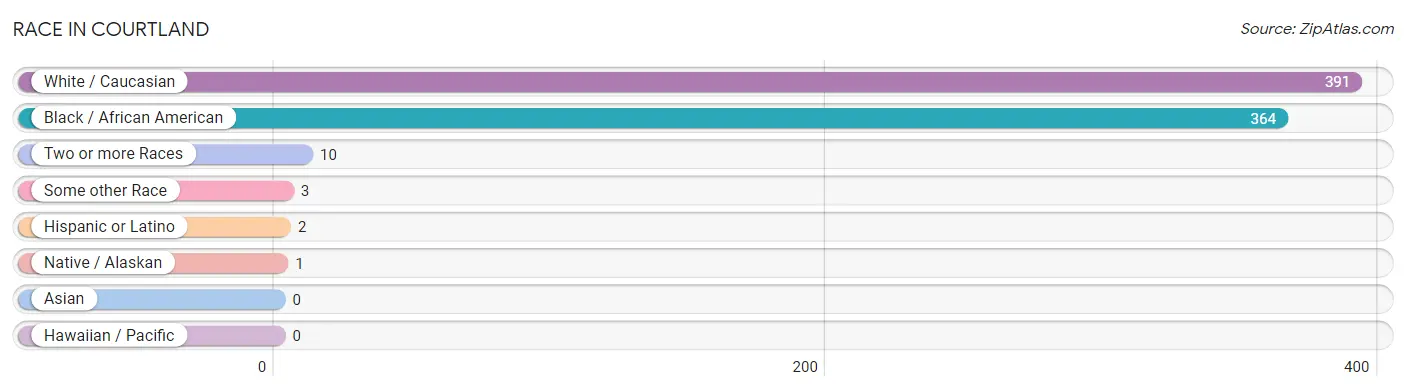
| Race | # Population | % Population |
| Asian | 0 | 0.0% |
| Black / African American | 364 | 47.3% |
| Hawaiian / Pacific | 0 | 0.0% |
| Hispanic or Latino | 2 | 0.3% |
| Native / Alaskan | 1 | 0.1% |
| White / Caucasian | 391 | 50.8% |
| Two or more Races | 10 | 1.3% |
| Some other Race | 3 | 0.4% |
| Total | 769 | 100.0% |
Ancestry in Courtland
The most populous ancestries reported in Courtland are American (128 | 16.6%), English (65 | 8.5%), Arab (35 | 4.5%), African (14 | 1.8%), and Subsaharan African (14 | 1.8%), together accounting for 33.3% of all Courtland residents.
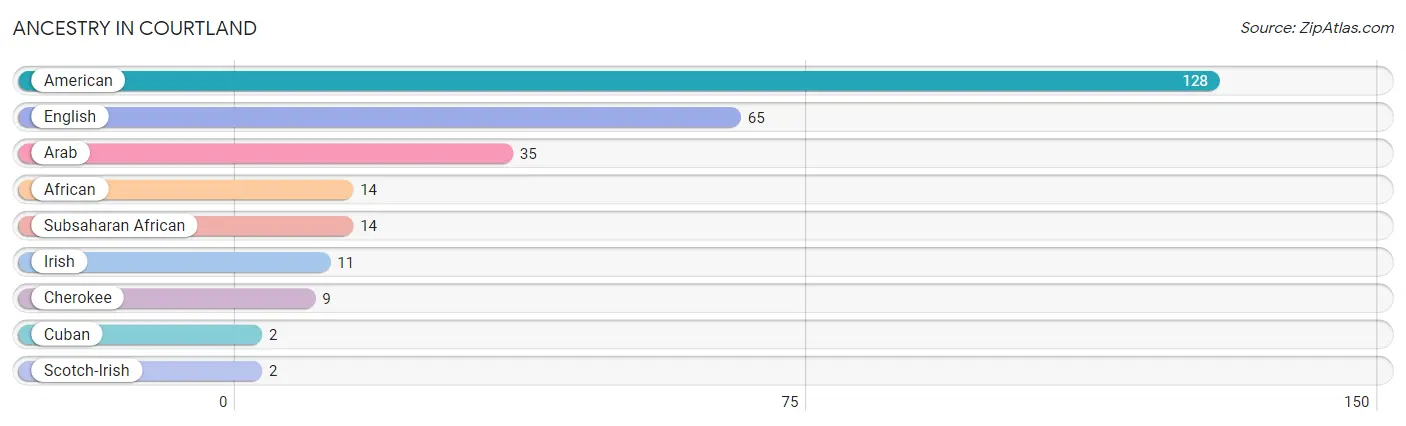
| Ancestry | # Population | % Population |
| African | 14 | 1.8% |
| American | 128 | 16.6% |
| Arab | 35 | 4.5% |
| Cherokee | 9 | 1.2% |
| Cuban | 2 | 0.3% |
| English | 65 | 8.5% |
| Irish | 11 | 1.4% |
| Scotch-Irish | 2 | 0.3% |
| Subsaharan African | 14 | 1.8% | View All 9 Rows |
Immigrants in Courtland
The most numerous immigrant groups reported in Courtland came from Asia (14 | 1.8%), Western Asia (14 | 1.8%), and Yemen (14 | 1.8%), together accounting for 5.5% of all Courtland residents.
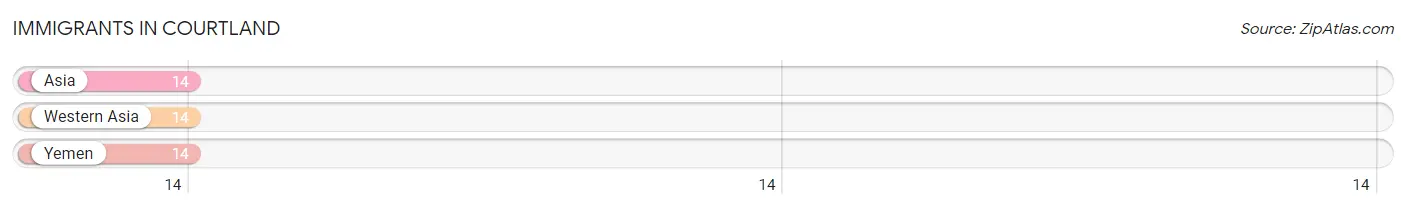
| Immigration Origin | # Population | % Population |
| Asia | 14 | 1.8% |
| Western Asia | 14 | 1.8% |
| Yemen | 14 | 1.8% | View All 3 Rows |
Sex and Age in Courtland
Sex and Age in Courtland
The most populous age groups in Courtland are 10 to 14 Years (52 | 17.1%) for men and 40 to 44 Years (52 | 11.2%) for women.
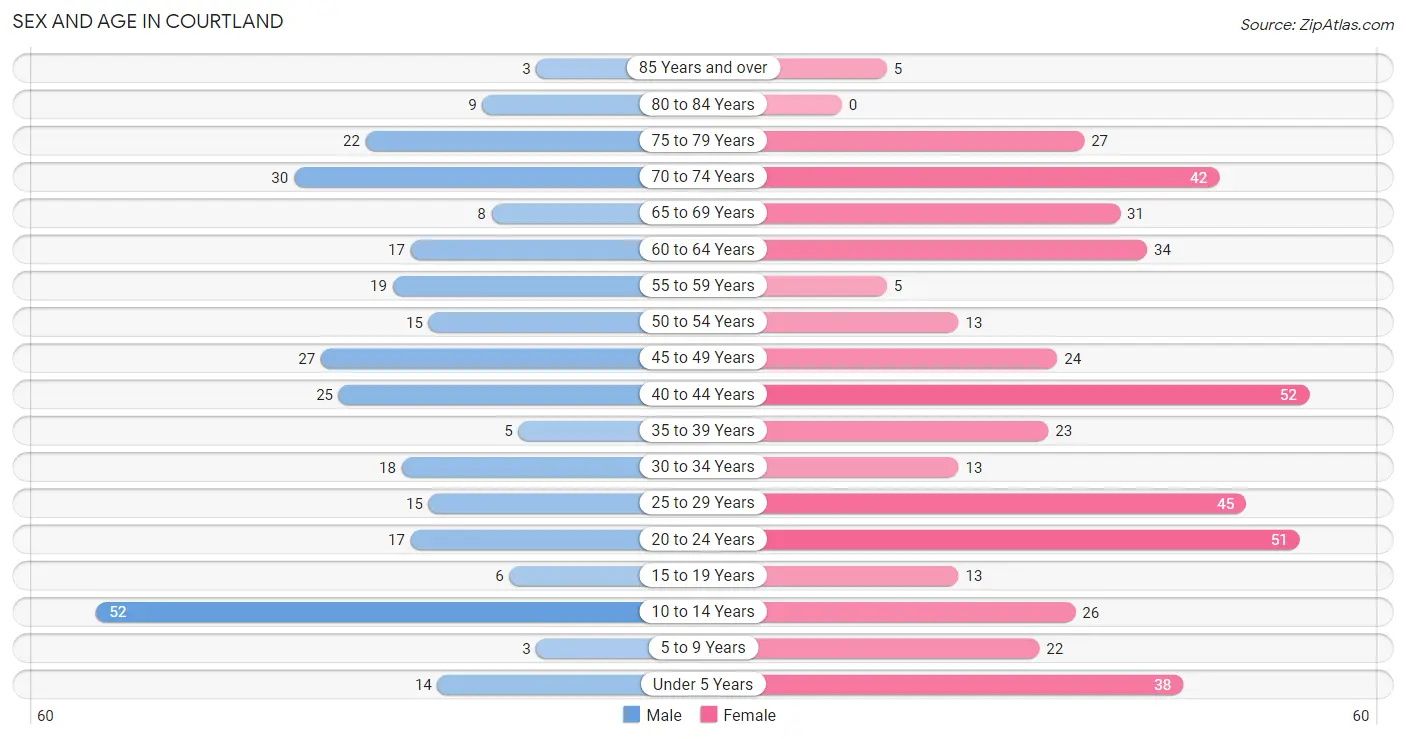
| Age Bracket | Male | Female |
| Under 5 Years | 14 (4.6%) | 38 (8.2%) |
| 5 to 9 Years | 3 (1.0%) | 22 (4.7%) |
| 10 to 14 Years | 52 (17.1%) | 26 (5.6%) |
| 15 to 19 Years | 6 (2.0%) | 13 (2.8%) |
| 20 to 24 Years | 17 (5.6%) | 51 (11.0%) |
| 25 to 29 Years | 15 (4.9%) | 45 (9.7%) |
| 30 to 34 Years | 18 (5.9%) | 13 (2.8%) |
| 35 to 39 Years | 5 (1.6%) | 23 (5.0%) |
| 40 to 44 Years | 25 (8.2%) | 52 (11.2%) |
| 45 to 49 Years | 27 (8.8%) | 24 (5.2%) |
| 50 to 54 Years | 15 (4.9%) | 13 (2.8%) |
| 55 to 59 Years | 19 (6.2%) | 5 (1.1%) |
| 60 to 64 Years | 17 (5.6%) | 34 (7.3%) |
| 65 to 69 Years | 8 (2.6%) | 31 (6.7%) |
| 70 to 74 Years | 30 (9.8%) | 42 (9.0%) |
| 75 to 79 Years | 22 (7.2%) | 27 (5.8%) |
| 80 to 84 Years | 9 (2.9%) | 0 (0.0%) |
| 85 Years and over | 3 (1.0%) | 5 (1.1%) |
| Total | 305 (100.0%) | 464 (100.0%) |
Families and Households in Courtland
Median Family Size in Courtland
The median family size in Courtland is 3.27 persons per family, with single female/mother families (67 | 33.7%) accounting for the largest median family size of 4.13 persons per family. On the other hand, single male/father families (9 | 4.5%) represent the smallest median family size with 2.11 persons per family.
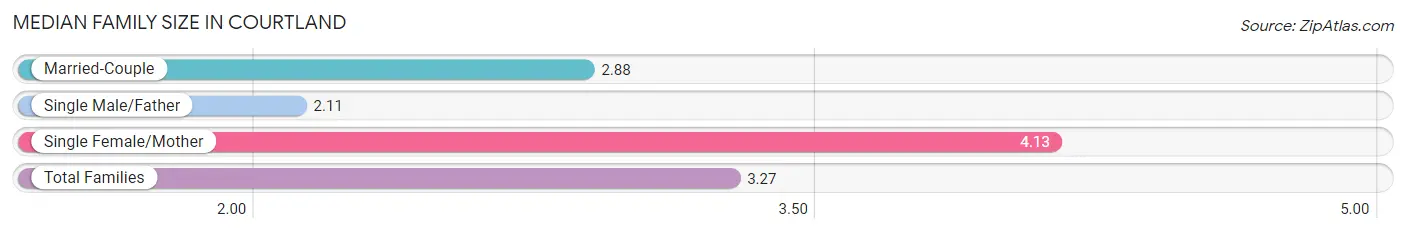
| Family Type | # Families | Family Size |
| Married-Couple | 123 (61.8%) | 2.88 |
| Single Male/Father | 9 (4.5%) | 2.11 |
| Single Female/Mother | 67 (33.7%) | 4.13 |
| Total Families | 199 (100.0%) | 3.27 |
Median Household Size in Courtland
The median household size in Courtland is 2.45 persons per household, with single female/mother households (67 | 21.3%) accounting for the largest median household size of 4.13 persons per household. non-family households (115 | 36.6%) represent the smallest median household size with 1.03 persons per household.
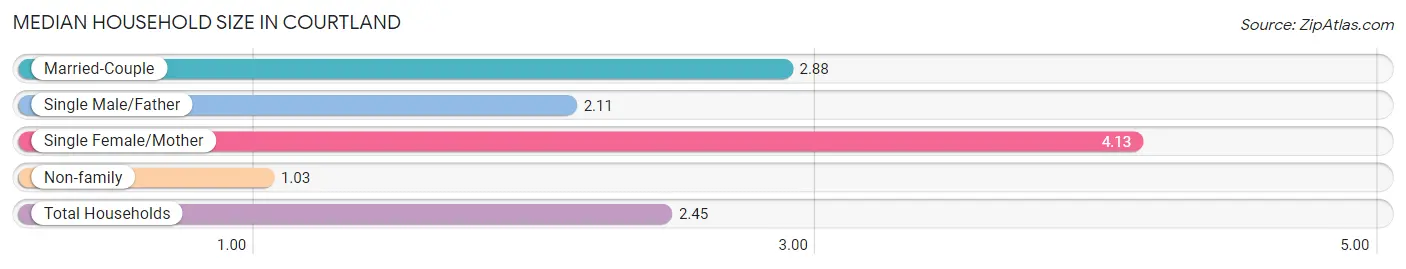
| Household Type | # Households | Household Size |
| Married-Couple | 123 (39.2%) | 2.88 |
| Single Male/Father | 9 (2.9%) | 2.11 |
| Single Female/Mother | 67 (21.3%) | 4.13 |
| Non-family | 115 (36.6%) | 1.03 |
| Total Households | 314 (100.0%) | 2.45 |
Household Size by Marriage Status in Courtland
Out of a total of 314 households in Courtland, 199 (63.4%) are family households, while 115 (36.6%) are nonfamily households. The most numerous type of family households are 2-person households, comprising 119, and the most common type of nonfamily households are 1-person households, comprising 112.
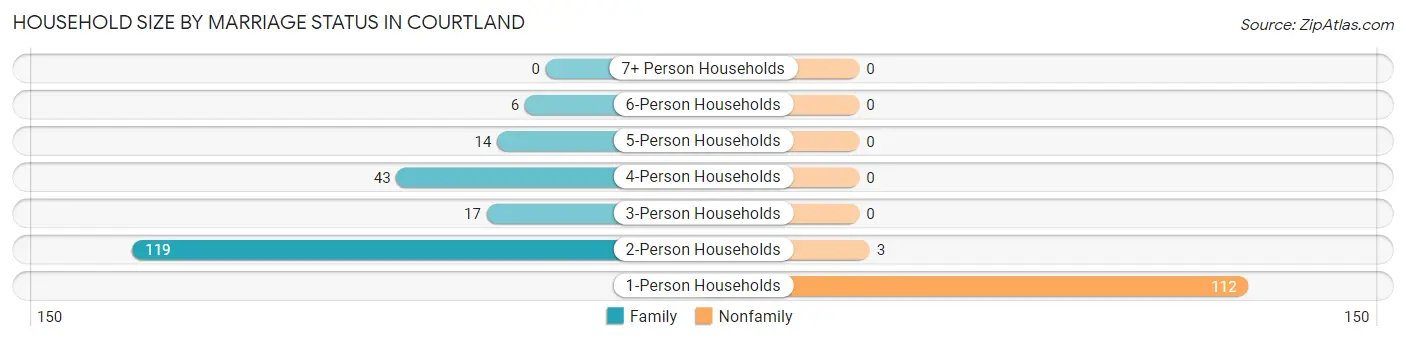
| Household Size | Family Households | Nonfamily Households |
| 1-Person Households | - | 112 (35.7%) |
| 2-Person Households | 119 (37.9%) | 3 (1.0%) |
| 3-Person Households | 17 (5.4%) | 0 (0.0%) |
| 4-Person Households | 43 (13.7%) | 0 (0.0%) |
| 5-Person Households | 14 (4.5%) | 0 (0.0%) |
| 6-Person Households | 6 (1.9%) | 0 (0.0%) |
| 7+ Person Households | 0 (0.0%) | 0 (0.0%) |
| Total | 199 (63.4%) | 115 (36.6%) |
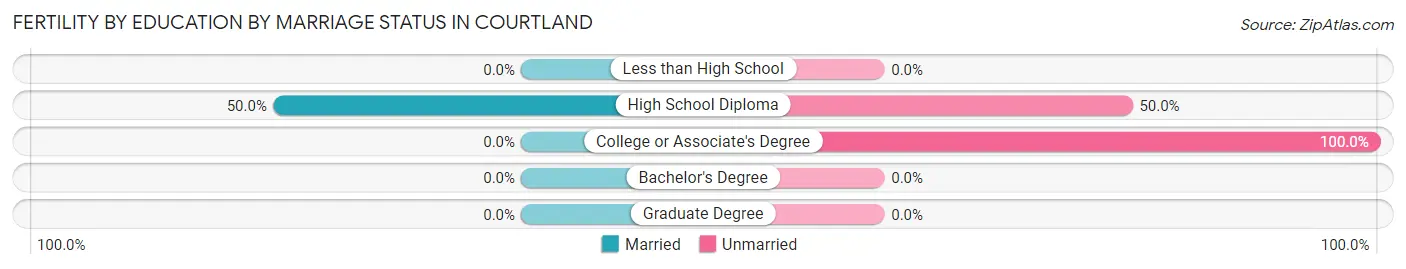
Female Fertility in Courtland
Fertility by Age in Courtland
Average fertility rate in Courtland is 238.0 births per 1,000 women. Women in the age bracket of 20 to 34 years have the highest fertility rate with 486.0 births per 1,000 women. Women in the age bracket of 20 to 34 years acount for 100.0% of all women with births.
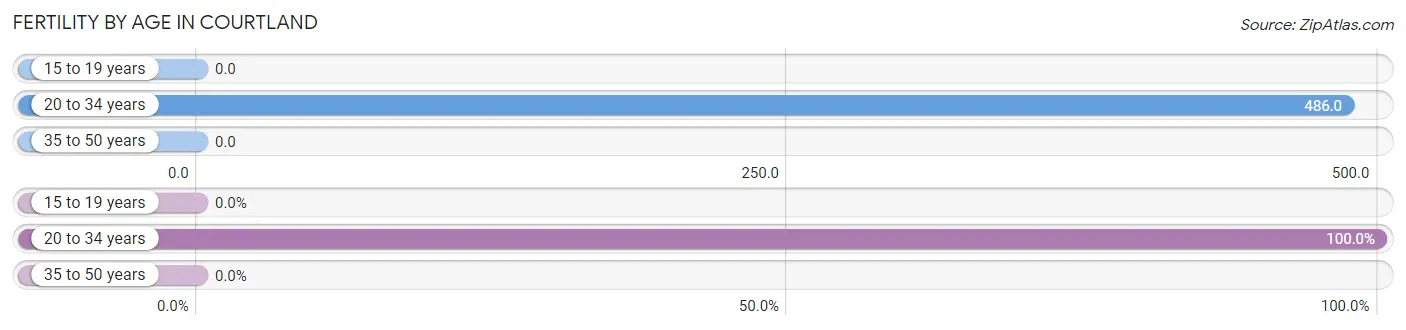
| Age Bracket | Women with Births | Births / 1,000 Women |
| 15 to 19 years | 0 (0.0%) | 0.0 |
| 20 to 34 years | 53 (100.0%) | 486.0 |
| 35 to 50 years | 0 (0.0%) | 0.0 |
| Total | 53 (100.0%) | 238.0 |
Fertility by Age by Marriage Status in Courtland
3.8% of women with births (53) in Courtland are married. The highest percentage of unmarried women with births falls into 20 to 34 years age bracket with 96.2% of them unmarried at the time of birth, while the lowest percentage of unmarried women with births belong to 20 to 34 years age bracket with 96.2% of them unmarried.
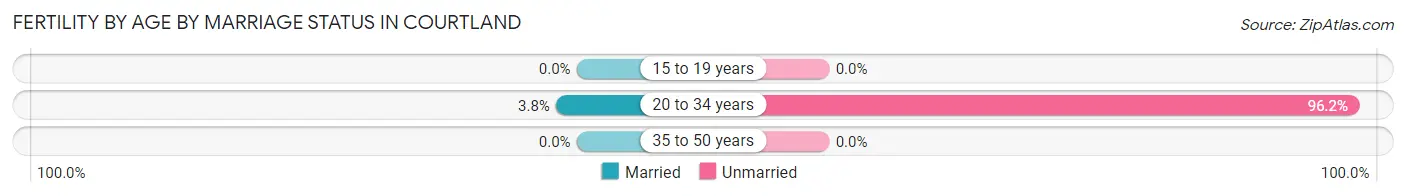
| Age Bracket | Married | Unmarried |
| 15 to 19 years | 0 (0.0%) | 0 (0.0%) |
| 20 to 34 years | 2 (3.8%) | 51 (96.2%) |
| 35 to 50 years | 0 (0.0%) | 0 (0.0%) |
| Total | 2 (3.8%) | 51 (96.2%) |
Fertility by Education in Courtland
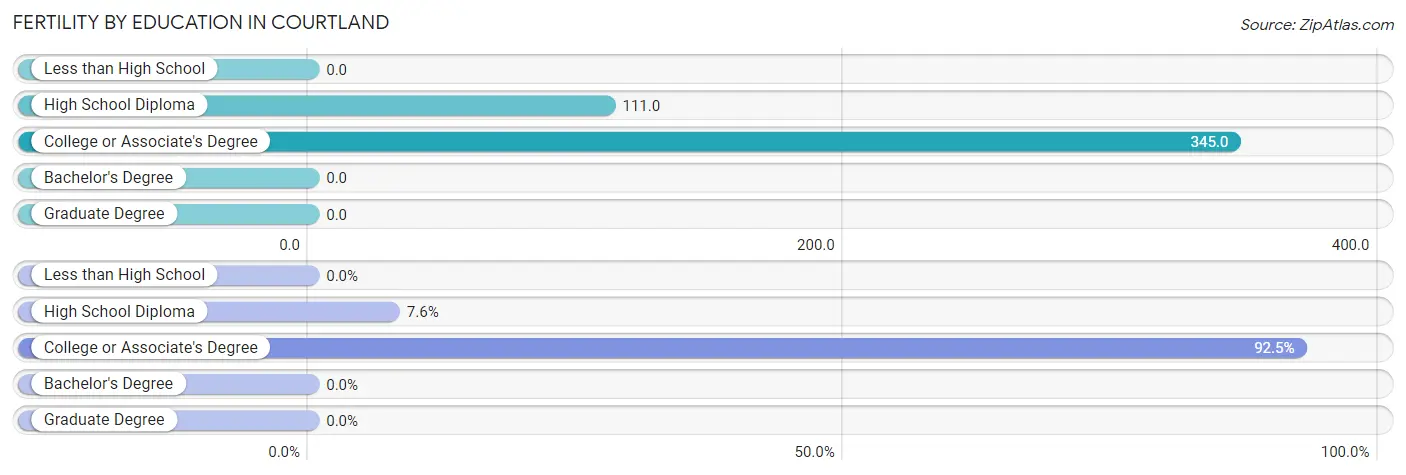
| Educational Attainment | Women with Births | Births / 1,000 Women |
| Less than High School | 0 (0.0%) | 0.0 |
| High School Diploma | 4 (7.5%) | 111.0 |
| College or Associate's Degree | 49 (92.4%) | 345.0 |
| Bachelor's Degree | 0 (0.0%) | 0.0 |
| Graduate Degree | 0 (0.0%) | 0.0 |
| Total | 53 (100.0%) | 238.0 |
Fertility by Education by Marriage Status in Courtland
96.2% of women with births in Courtland are unmarried. Women with the educational attainment of high school diploma are most likely to be married with 50.0% of them married at childbirth, while women with the educational attainment of college or associate's degree are least likely to be married with 100.0% of them unmarried at childbirth.
| Educational Attainment | Married | Unmarried |
| Less than High School | 0 (0.0%) | 0 (0.0%) |
| High School Diploma | 2 (50.0%) | 2 (50.0%) |
| College or Associate's Degree | 0 (0.0%) | 49 (100.0%) |
| Bachelor's Degree | 0 (0.0%) | 0 (0.0%) |
| Graduate Degree | 0 (0.0%) | 0 (0.0%) |
| Total | 2 (3.8%) | 51 (96.2%) |
Employment Characteristics in Courtland
Employment by Class of Employer in Courtland
Among the 193 employed individuals in Courtland, private company employees (149 | 77.2%), federal government employees (15 | 7.8%), and local government employees (11 | 5.7%) make up the most common classes of employment.
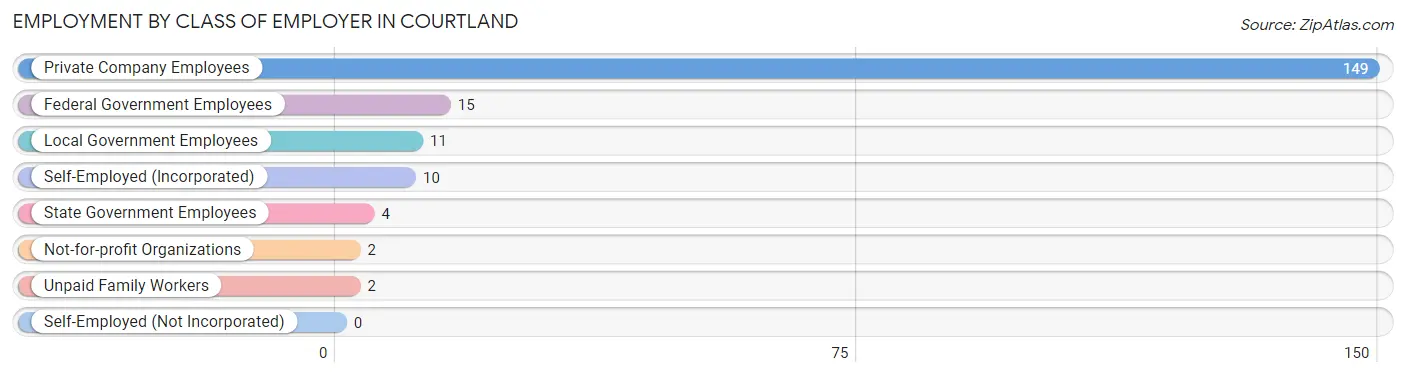
| Employer Class | # Employees | % Employees |
| Private Company Employees | 149 | 77.2% |
| Self-Employed (Incorporated) | 10 | 5.2% |
| Self-Employed (Not Incorporated) | 0 | 0.0% |
| Not-for-profit Organizations | 2 | 1.0% |
| Local Government Employees | 11 | 5.7% |
| State Government Employees | 4 | 2.1% |
| Federal Government Employees | 15 | 7.8% |
| Unpaid Family Workers | 2 | 1.0% |
| Total | 193 | 100.0% |
Employment Status by Age in Courtland
According to the labor force statistics for Courtland, out of the total population over 16 years of age (614), 32.2% or 198 individuals are in the labor force, with 2.5% or 5 of them unemployed. The age group with the highest labor force participation rate is 30 to 34 years, with 83.9% or 26 individuals in the labor force. Within the labor force, the 55 to 59 years age range has the highest percentage of unemployed individuals, with 14.3% or 1 of them being unemployed.
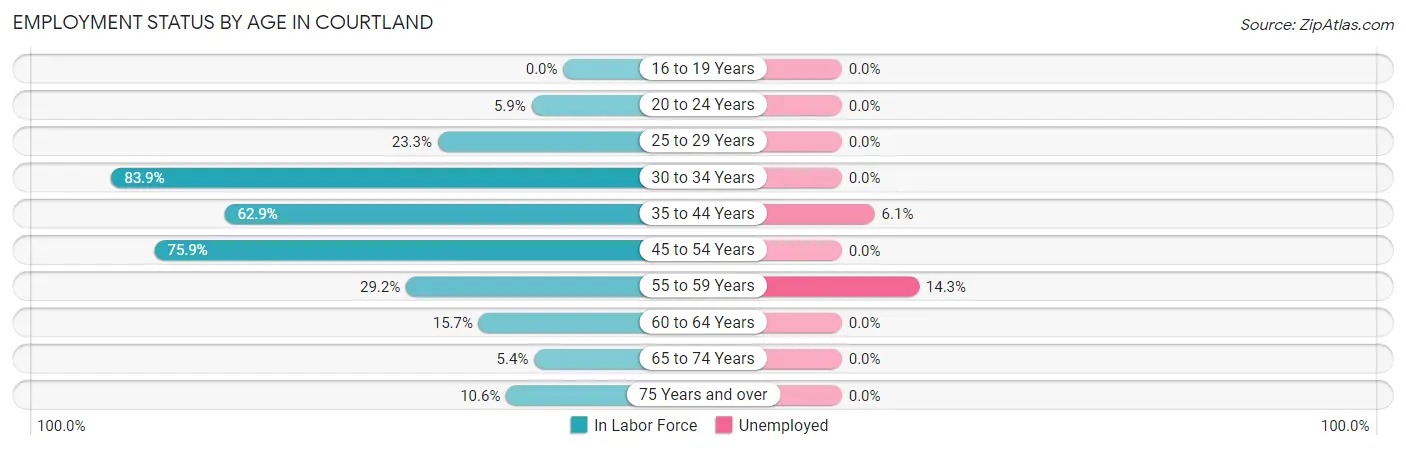
| Age Bracket | In Labor Force | Unemployed |
| 16 to 19 Years | 0 (0.0%) | 0 (0.0%) |
| 20 to 24 Years | 4 (5.9%) | 0 (0.0%) |
| 25 to 29 Years | 14 (23.3%) | 0 (0.0%) |
| 30 to 34 Years | 26 (83.9%) | 0 (0.0%) |
| 35 to 44 Years | 66 (62.9%) | 4 (6.1%) |
| 45 to 54 Years | 60 (75.9%) | 0 (0.0%) |
| 55 to 59 Years | 7 (29.2%) | 1 (14.3%) |
| 60 to 64 Years | 8 (15.7%) | 0 (0.0%) |
| 65 to 74 Years | 6 (5.4%) | 0 (0.0%) |
| 75 Years and over | 7 (10.6%) | 0 (0.0%) |
| Total | 198 (32.2%) | 5 (2.5%) |
Employment Status by Educational Attainment in Courtland
According to labor force statistics for Courtland, 51.7% of individuals (181) out of the total population between 25 and 64 years of age (350) are in the labor force, with 2.8% or 5 of them being unemployed. The group with the highest labor force participation rate are those with the educational attainment of bachelor's degree or higher, with 70.5% or 31 individuals in the labor force. Within the labor force, individuals with high school diploma education have the highest percentage of unemployment, with 6.3% or 4 of them being unemployed.
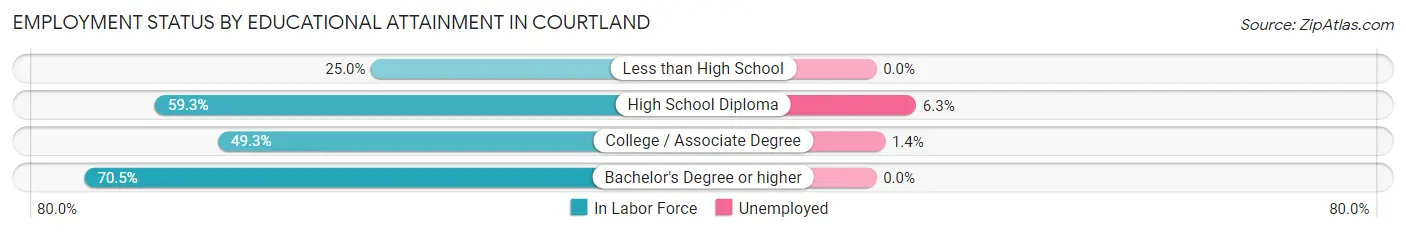
| Educational Attainment | In Labor Force | Unemployed |
| Less than High School | 12 (25.0%) | 0 (0.0%) |
| High School Diploma | 64 (59.3%) | 7 (6.3%) |
| College / Associate Degree | 74 (49.3%) | 2 (1.4%) |
| Bachelor's Degree or higher | 31 (70.5%) | 0 (0.0%) |
| Total | 181 (51.7%) | 10 (2.8%) |
Employment Occupations by Sex in Courtland
Management, Business, Science and Arts Occupations
The most common Management, Business, Science and Arts occupations in Courtland are Health Diagnosing & Treating (19 | 9.8%), Community & Social Service (10 | 5.2%), Legal Services & Support (10 | 5.2%), Management (5 | 2.6%), and Business & Financial (2 | 1.0%).
Management, Business, Science and Arts Occupations by Sex
Within the Management, Business, Science and Arts occupations in Courtland, the most male-oriented occupations are Management (100.0%), Community & Social Service (100.0%), and Legal Services & Support (100.0%), while the most female-oriented occupations are Business & Financial (100.0%), Health Diagnosing & Treating (100.0%), and Health Technologists (100.0%).
| Occupation | Male | Female |
| Management | 5 (100.0%) | 0 (0.0%) |
| Business & Financial | 0 (0.0%) | 2 (100.0%) |
| Computers, Engineering & Science | 0 (0.0%) | 0 (0.0%) |
| Computers & Mathematics | 0 (0.0%) | 0 (0.0%) |
| Architecture & Engineering | 0 (0.0%) | 0 (0.0%) |
| Life, Physical & Social Science | 0 (0.0%) | 0 (0.0%) |
| Community & Social Service | 10 (100.0%) | 0 (0.0%) |
| Education, Arts & Media | 0 (0.0%) | 0 (0.0%) |
| Legal Services & Support | 10 (100.0%) | 0 (0.0%) |
| Education Instruction & Library | 0 (0.0%) | 0 (0.0%) |
| Arts, Media & Entertainment | 0 (0.0%) | 0 (0.0%) |
| Health Diagnosing & Treating | 0 (0.0%) | 19 (100.0%) |
| Health Technologists | 0 (0.0%) | 2 (100.0%) |
| Total (Category) | 15 (41.7%) | 21 (58.3%) |
| Total (Overall) | 98 (50.8%) | 95 (49.2%) |
Services Occupations
The most common Services occupations in Courtland are Healthcare Support (2 | 1.0%), and Food Preparation & Serving (1 | 0.5%).
Services Occupations by Sex
| Occupation | Male | Female |
| Healthcare Support | 0 (0.0%) | 2 (100.0%) |
| Security & Protection | 0 (0.0%) | 0 (0.0%) |
| Firefighting & Prevention | 0 (0.0%) | 0 (0.0%) |
| Law Enforcement | 0 (0.0%) | 0 (0.0%) |
| Food Preparation & Serving | 0 (0.0%) | 1 (100.0%) |
| Cleaning & Maintenance | 0 (0.0%) | 0 (0.0%) |
| Personal Care & Service | 0 (0.0%) | 0 (0.0%) |
| Total (Category) | 0 (0.0%) | 3 (100.0%) |
| Total (Overall) | 98 (50.8%) | 95 (49.2%) |
Sales and Office Occupations
The most common Sales and Office occupations in Courtland are Office & Administration (33 | 17.1%), and Sales & Related (4 | 2.1%).
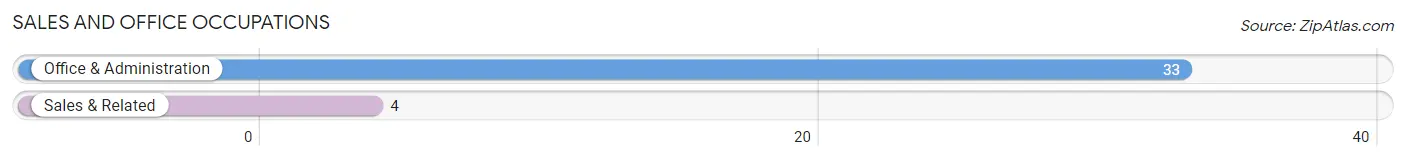
Sales and Office Occupations by Sex
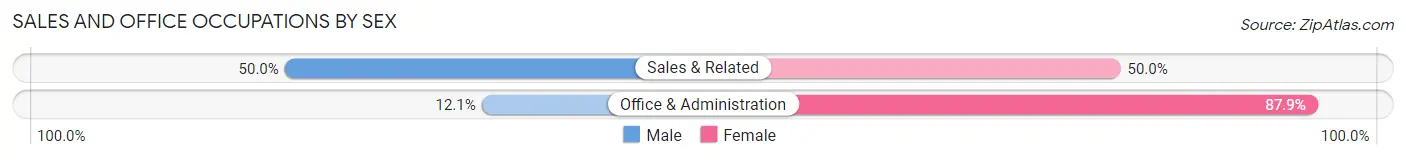
| Occupation | Male | Female |
| Sales & Related | 2 (50.0%) | 2 (50.0%) |
| Office & Administration | 4 (12.1%) | 29 (87.9%) |
| Total (Category) | 6 (16.2%) | 31 (83.8%) |
| Total (Overall) | 98 (50.8%) | 95 (49.2%) |
Natural Resources, Construction and Maintenance Occupations
The most common Natural Resources, Construction and Maintenance occupations in Courtland are Construction & Extraction (7 | 3.6%), Installation, Maintenance & Repair (6 | 3.1%), and Farming, Fishing & Forestry (2 | 1.0%).
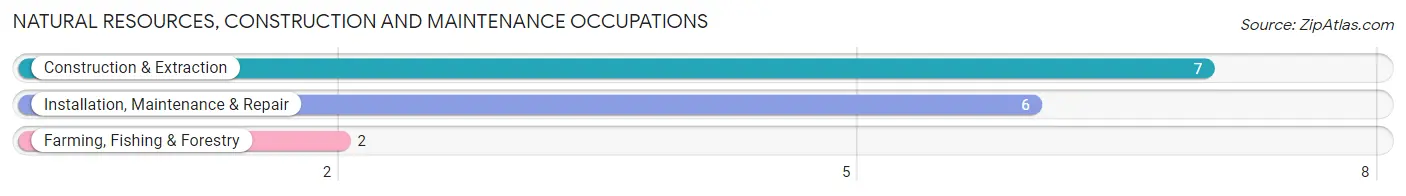
Natural Resources, Construction and Maintenance Occupations by Sex
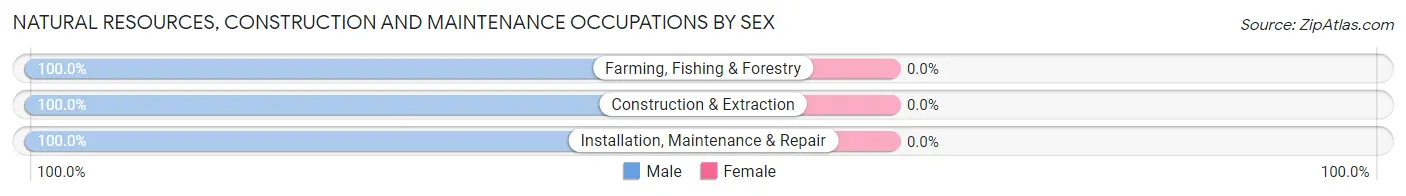
| Occupation | Male | Female |
| Farming, Fishing & Forestry | 2 (100.0%) | 0 (0.0%) |
| Construction & Extraction | 7 (100.0%) | 0 (0.0%) |
| Installation, Maintenance & Repair | 6 (100.0%) | 0 (0.0%) |
| Total (Category) | 15 (100.0%) | 0 (0.0%) |
| Total (Overall) | 98 (50.8%) | 95 (49.2%) |
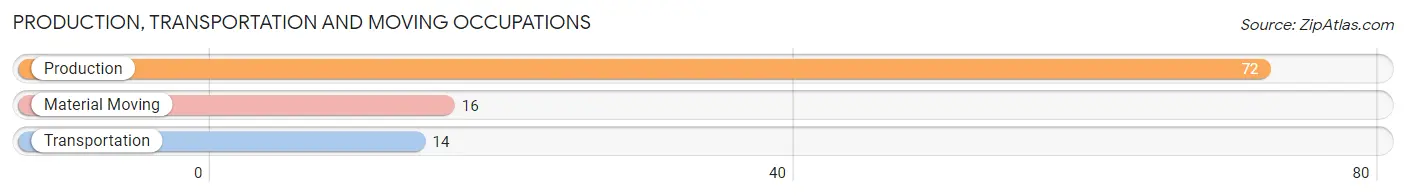
Production, Transportation and Moving Occupations
The most common Production, Transportation and Moving occupations in Courtland are Production (72 | 37.3%), Material Moving (16 | 8.3%), and Transportation (14 | 7.2%).
Production, Transportation and Moving Occupations by Sex
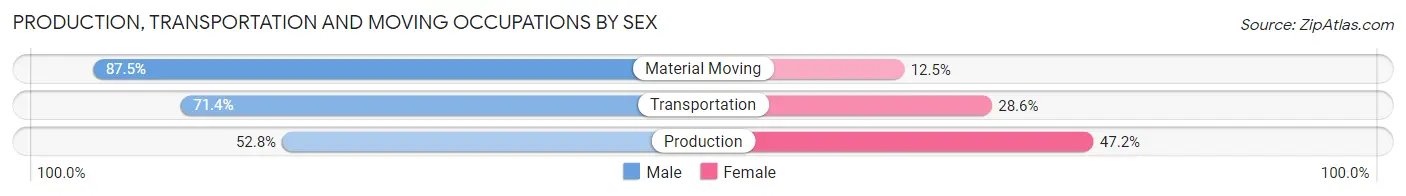
| Occupation | Male | Female |
| Production | 38 (52.8%) | 34 (47.2%) |
| Transportation | 10 (71.4%) | 4 (28.6%) |
| Material Moving | 14 (87.5%) | 2 (12.5%) |
| Total (Category) | 62 (60.8%) | 40 (39.2%) |
| Total (Overall) | 98 (50.8%) | 95 (49.2%) |
Employment Industries by Sex in Courtland
Employment Industries in Courtland
The major employment industries in Courtland include Manufacturing (68 | 35.2%), Transportation & Warehousing (33 | 17.1%), Retail Trade (24 | 12.4%), Public Administration (19 | 9.8%), and Construction (16 | 8.3%).
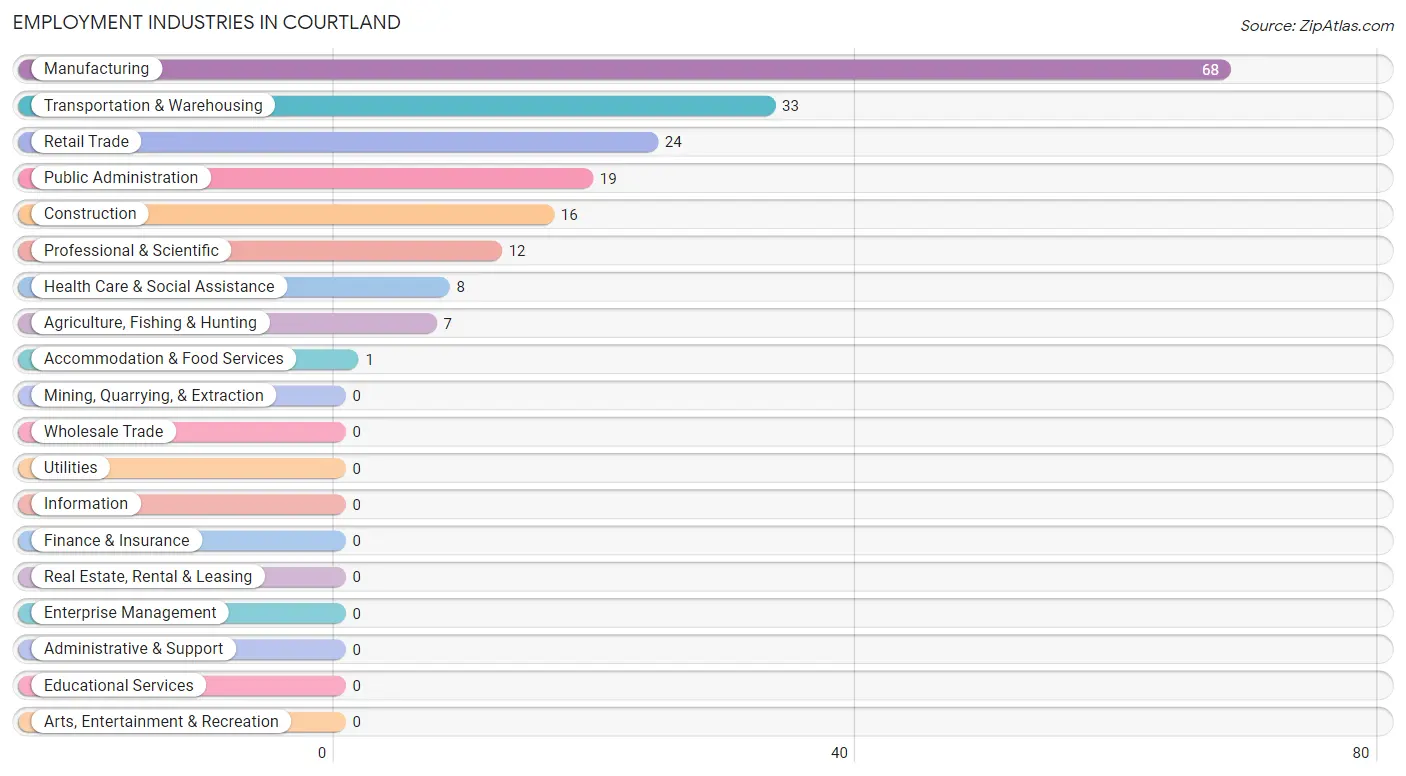
Employment Industries by Sex in Courtland
The Courtland industries that see more men than women are Agriculture, Fishing & Hunting (100.0%), Construction (100.0%), and Retail Trade (83.3%), whereas the industries that tend to have a higher number of women are Health Care & Social Assistance (100.0%), Accommodation & Food Services (100.0%), and Public Administration (100.0%).
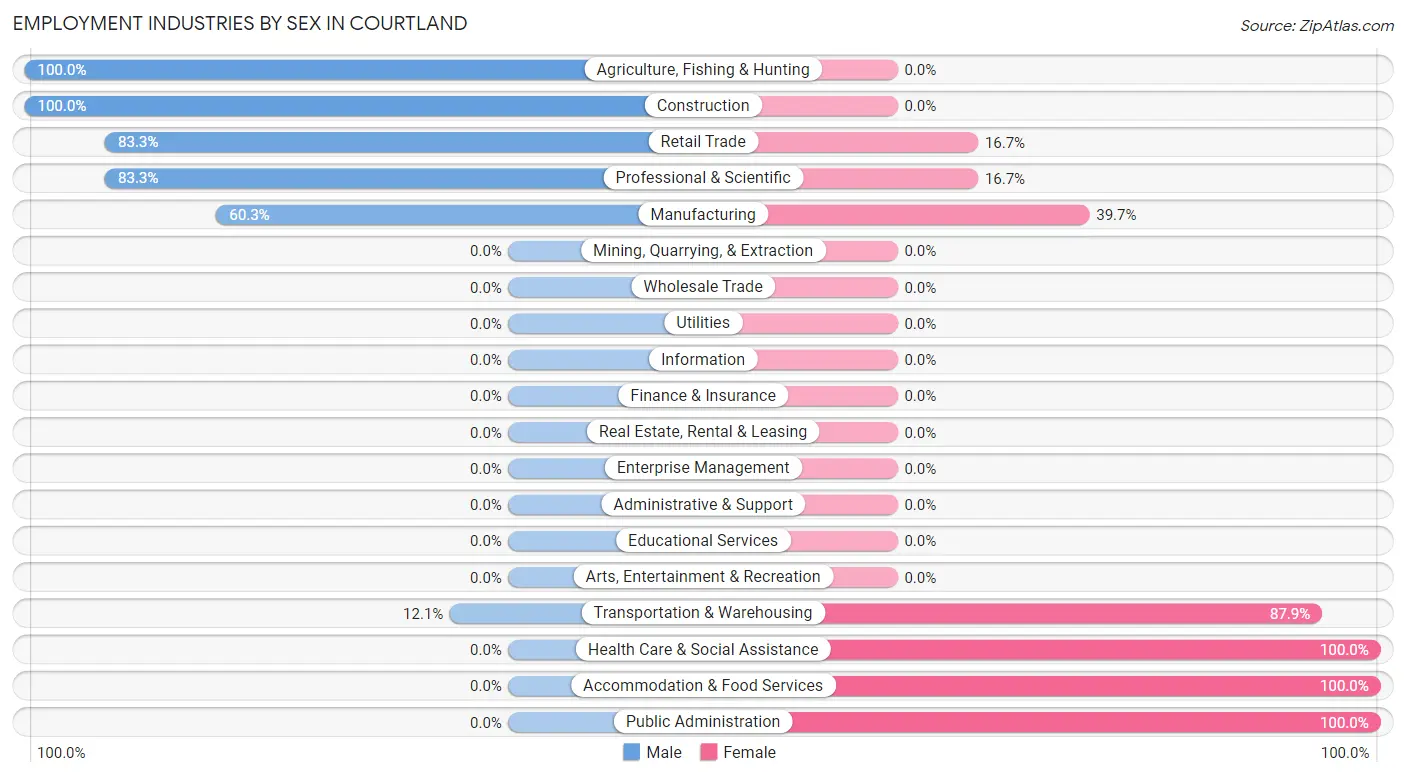
| Industry | Male | Female |
| Agriculture, Fishing & Hunting | 7 (100.0%) | 0 (0.0%) |
| Mining, Quarrying, & Extraction | 0 (0.0%) | 0 (0.0%) |
| Construction | 16 (100.0%) | 0 (0.0%) |
| Manufacturing | 41 (60.3%) | 27 (39.7%) |
| Wholesale Trade | 0 (0.0%) | 0 (0.0%) |
| Retail Trade | 20 (83.3%) | 4 (16.7%) |
| Transportation & Warehousing | 4 (12.1%) | 29 (87.9%) |
| Utilities | 0 (0.0%) | 0 (0.0%) |
| Information | 0 (0.0%) | 0 (0.0%) |
| Finance & Insurance | 0 (0.0%) | 0 (0.0%) |
| Real Estate, Rental & Leasing | 0 (0.0%) | 0 (0.0%) |
| Professional & Scientific | 10 (83.3%) | 2 (16.7%) |
| Enterprise Management | 0 (0.0%) | 0 (0.0%) |
| Administrative & Support | 0 (0.0%) | 0 (0.0%) |
| Educational Services | 0 (0.0%) | 0 (0.0%) |
| Health Care & Social Assistance | 0 (0.0%) | 8 (100.0%) |
| Arts, Entertainment & Recreation | 0 (0.0%) | 0 (0.0%) |
| Accommodation & Food Services | 0 (0.0%) | 1 (100.0%) |
| Public Administration | 0 (0.0%) | 19 (100.0%) |
| Total | 98 (50.8%) | 95 (49.2%) |
Education in Courtland
School Enrollment in Courtland
The most common levels of schooling among the 202 students in Courtland are elementary school (67 | 33.2%), college / undergraduate (62 | 30.7%), and high school (61 | 30.2%).
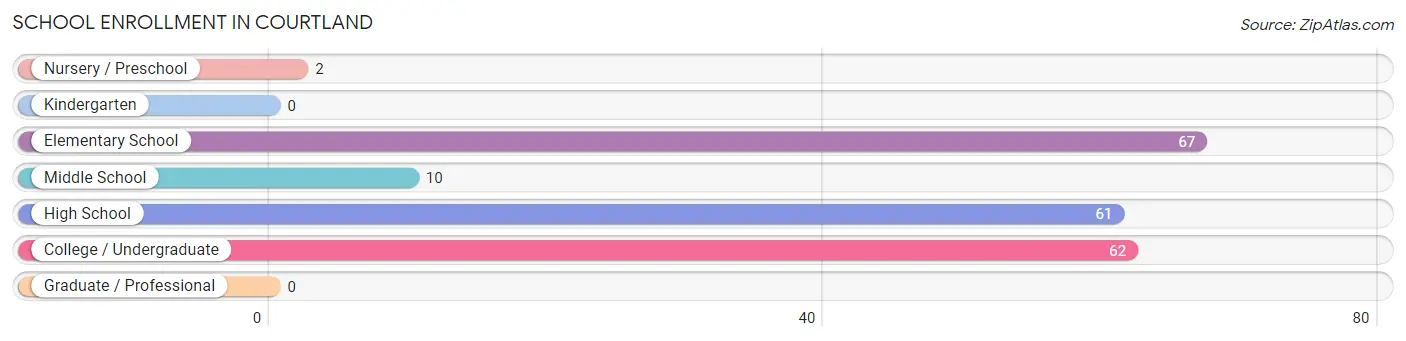
| School Level | # Students | % Students |
| Nursery / Preschool | 2 | 1.0% |
| Kindergarten | 0 | 0.0% |
| Elementary School | 67 | 33.2% |
| Middle School | 10 | 5.0% |
| High School | 61 | 30.2% |
| College / Undergraduate | 62 | 30.7% |
| Graduate / Professional | 0 | 0.0% |
| Total | 202 | 100.0% |
School Enrollment by Age by Funding Source in Courtland
Out of a total of 202 students who are enrolled in schools in Courtland, 49 (24.3%) attend a private institution, while the remaining 153 (75.7%) are enrolled in public schools. The age group of 10 to 14 year olds has the highest likelihood of being enrolled in private schools, with 42 (56.0% in the age bracket) enrolled. Conversely, the age group of 3 to 4 year olds has the lowest likelihood of being enrolled in a private school, with 2 (100.0% in the age bracket) attending a public institution.
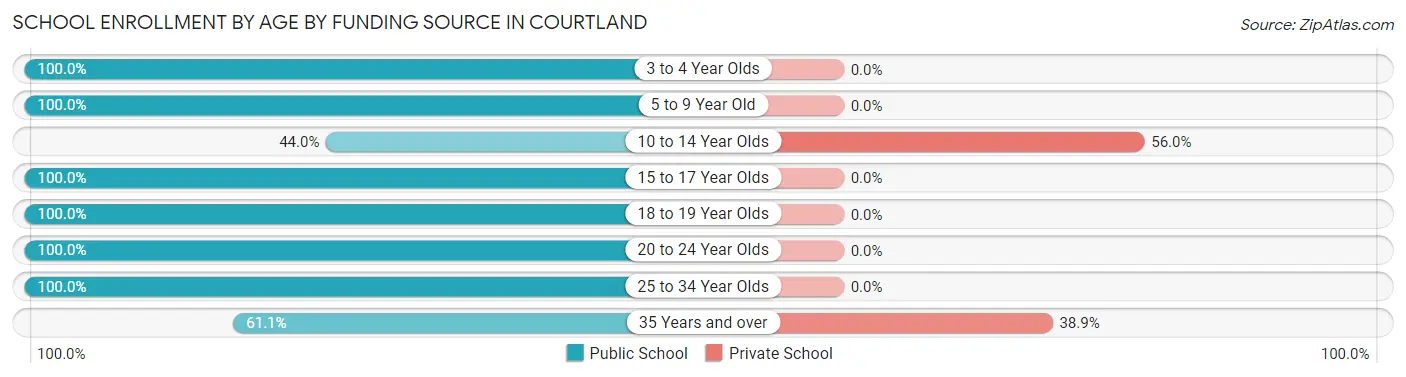
| Age Bracket | Public School | Private School |
| 3 to 4 Year Olds | 2 (100.0%) | 0 (0.0%) |
| 5 to 9 Year Old | 25 (100.0%) | 0 (0.0%) |
| 10 to 14 Year Olds | 33 (44.0%) | 42 (56.0%) |
| 15 to 17 Year Olds | 13 (100.0%) | 0 (0.0%) |
| 18 to 19 Year Olds | 3 (100.0%) | 0 (0.0%) |
| 20 to 24 Year Olds | 64 (100.0%) | 0 (0.0%) |
| 25 to 34 Year Olds | 2 (100.0%) | 0 (0.0%) |
| 35 Years and over | 11 (61.1%) | 7 (38.9%) |
| Total | 153 (75.7%) | 49 (24.3%) |
Educational Attainment by Field of Study in Courtland
Arts & humanities (25 | 33.8%), business (18 | 24.3%), psychology (13 | 17.6%), education (10 | 13.5%), and social sciences (4 | 5.4%) are the most common fields of study among 74 individuals in Courtland who have obtained a bachelor's degree or higher.
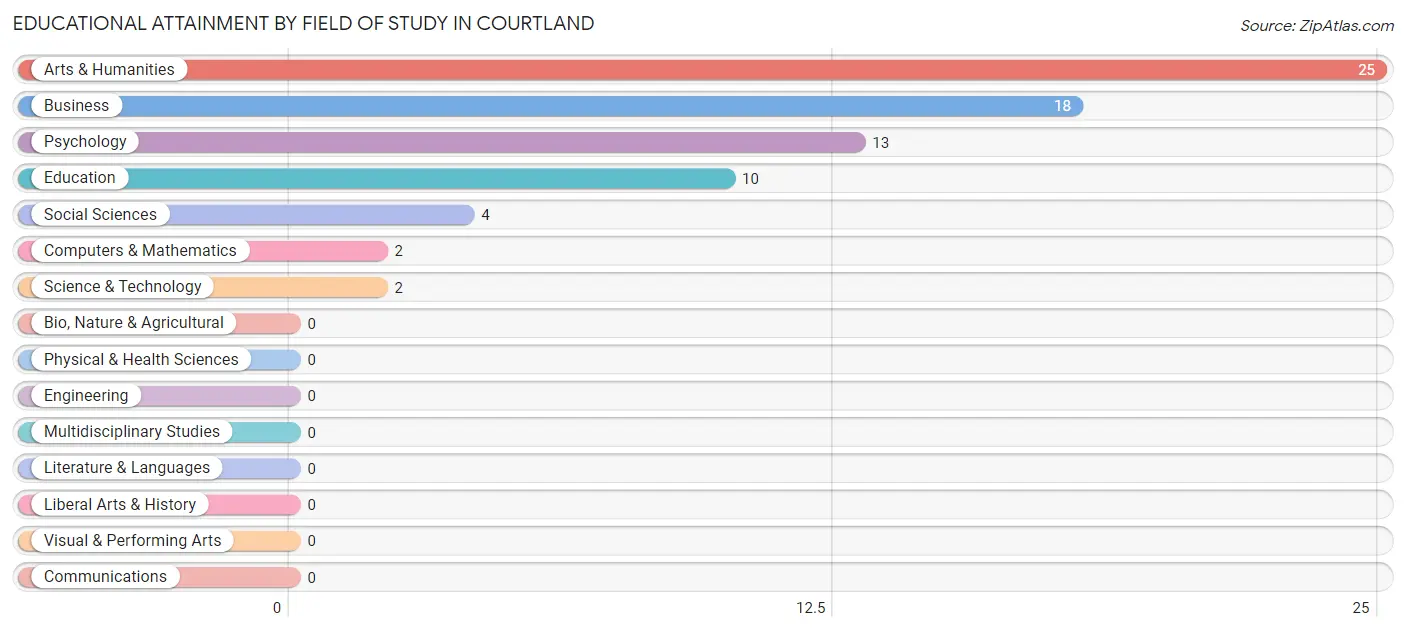
| Field of Study | # Graduates | % Graduates |
| Computers & Mathematics | 2 | 2.7% |
| Bio, Nature & Agricultural | 0 | 0.0% |
| Physical & Health Sciences | 0 | 0.0% |
| Psychology | 13 | 17.6% |
| Social Sciences | 4 | 5.4% |
| Engineering | 0 | 0.0% |
| Multidisciplinary Studies | 0 | 0.0% |
| Science & Technology | 2 | 2.7% |
| Business | 18 | 24.3% |
| Education | 10 | 13.5% |
| Literature & Languages | 0 | 0.0% |
| Liberal Arts & History | 0 | 0.0% |
| Visual & Performing Arts | 0 | 0.0% |
| Communications | 0 | 0.0% |
| Arts & Humanities | 25 | 33.8% |
| Total | 74 | 100.0% |
Transportation & Commute in Courtland
Vehicle Availability by Sex in Courtland
The most prevalent vehicle ownership categories in Courtland are males with 2 vehicles (75, accounting for 76.5%) and females with 2 vehicles (28, making up 78.9%).
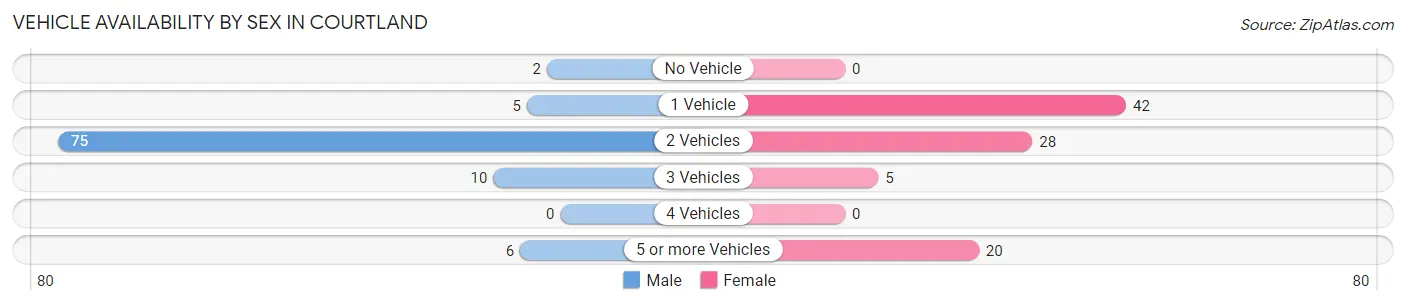
| Vehicles Available | Male | Female |
| No Vehicle | 2 (2.0%) | 0 (0.0%) |
| 1 Vehicle | 5 (5.1%) | 42 (44.2%) |
| 2 Vehicles | 75 (76.5%) | 28 (29.5%) |
| 3 Vehicles | 10 (10.2%) | 5 (5.3%) |
| 4 Vehicles | 0 (0.0%) | 0 (0.0%) |
| 5 or more Vehicles | 6 (6.1%) | 20 (21.0%) |
| Total | 98 (100.0%) | 95 (100.0%) |
Commute Time in Courtland
The most frequently occuring commute durations in Courtland are 30 to 34 minutes (62 commuters, 32.1%), 20 to 24 minutes (36 commuters, 18.6%), and 60 to 89 minutes (19 commuters, 9.8%).
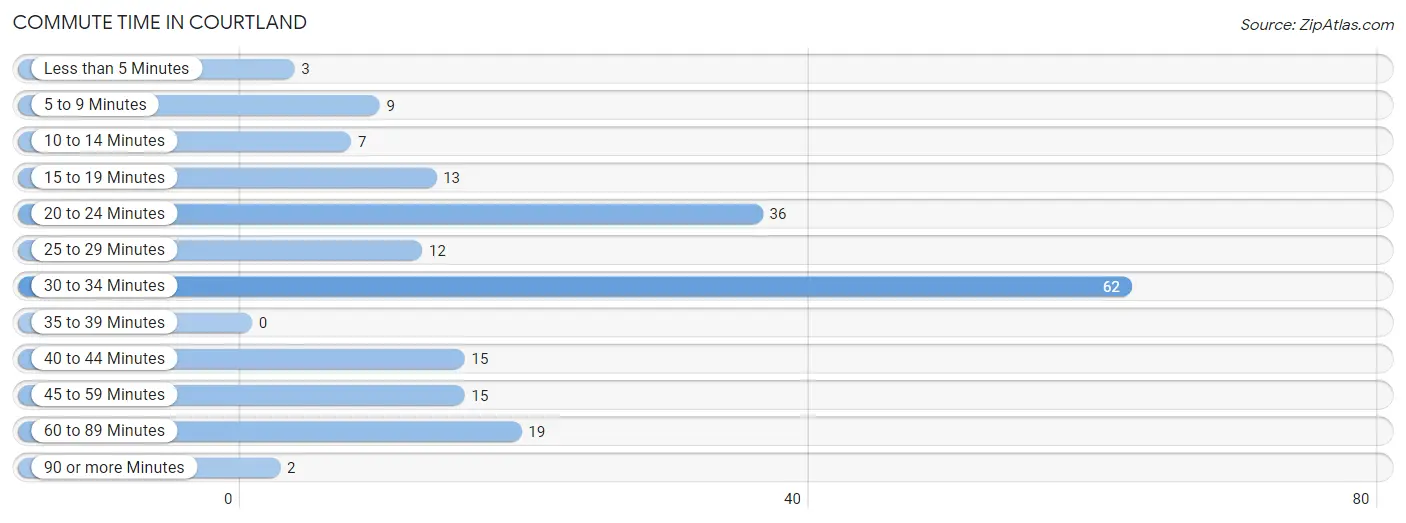
| Commute Time | # Commuters | % Commuters |
| Less than 5 Minutes | 3 | 1.5% |
| 5 to 9 Minutes | 9 | 4.7% |
| 10 to 14 Minutes | 7 | 3.6% |
| 15 to 19 Minutes | 13 | 6.7% |
| 20 to 24 Minutes | 36 | 18.6% |
| 25 to 29 Minutes | 12 | 6.2% |
| 30 to 34 Minutes | 62 | 32.1% |
| 35 to 39 Minutes | 0 | 0.0% |
| 40 to 44 Minutes | 15 | 7.8% |
| 45 to 59 Minutes | 15 | 7.8% |
| 60 to 89 Minutes | 19 | 9.8% |
| 90 or more Minutes | 2 | 1.0% |
Commute Time by Sex in Courtland
The most common commute times in Courtland are 60 to 89 minutes (19 commuters, 19.4%) for males and 30 to 34 minutes (49 commuters, 51.6%) for females.
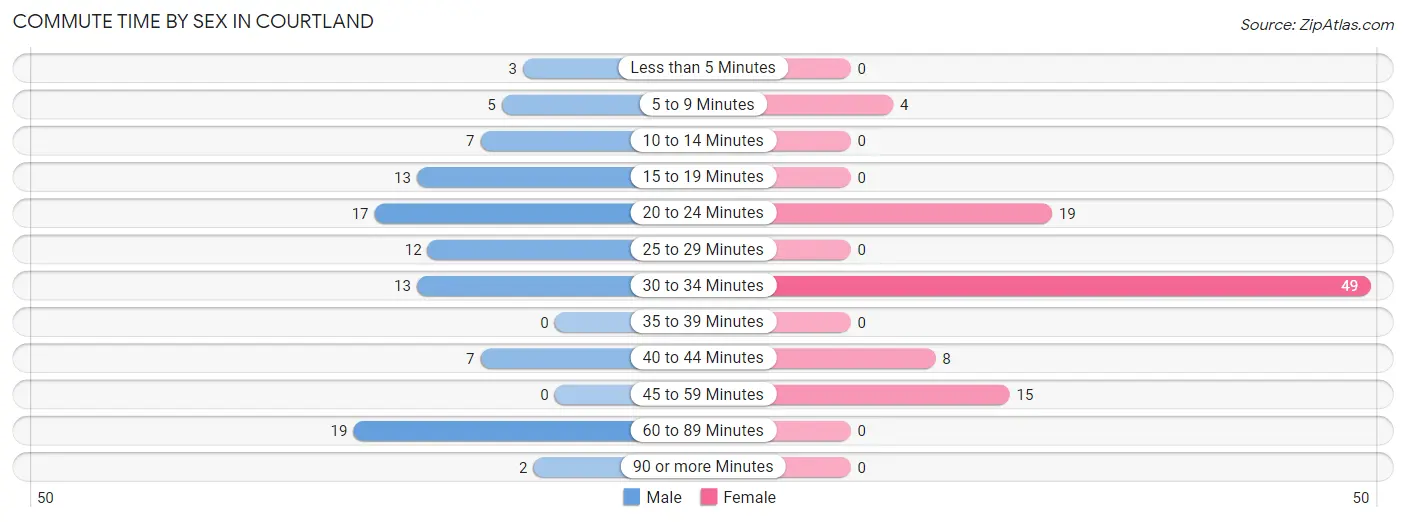
| Commute Time | Male | Female |
| Less than 5 Minutes | 3 (3.1%) | 0 (0.0%) |
| 5 to 9 Minutes | 5 (5.1%) | 4 (4.2%) |
| 10 to 14 Minutes | 7 (7.1%) | 0 (0.0%) |
| 15 to 19 Minutes | 13 (13.3%) | 0 (0.0%) |
| 20 to 24 Minutes | 17 (17.3%) | 19 (20.0%) |
| 25 to 29 Minutes | 12 (12.2%) | 0 (0.0%) |
| 30 to 34 Minutes | 13 (13.3%) | 49 (51.6%) |
| 35 to 39 Minutes | 0 (0.0%) | 0 (0.0%) |
| 40 to 44 Minutes | 7 (7.1%) | 8 (8.4%) |
| 45 to 59 Minutes | 0 (0.0%) | 15 (15.8%) |
| 60 to 89 Minutes | 19 (19.4%) | 0 (0.0%) |
| 90 or more Minutes | 2 (2.0%) | 0 (0.0%) |
Time of Departure to Work by Sex in Courtland
The most frequent times of departure to work in Courtland are 12:00 AM to 4:59 AM (28, 28.6%) for males and 6:30 AM to 6:59 AM (39, 41.0%) for females.
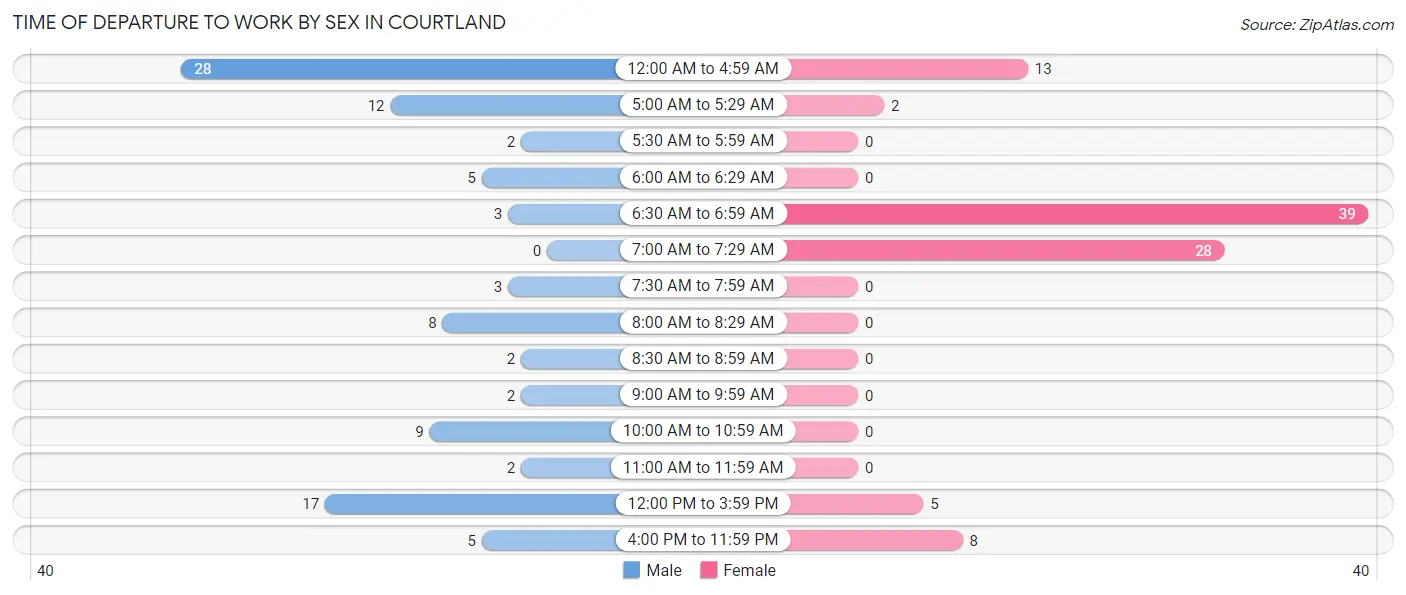
| Time of Departure | Male | Female |
| 12:00 AM to 4:59 AM | 28 (28.6%) | 13 (13.7%) |
| 5:00 AM to 5:29 AM | 12 (12.2%) | 2 (2.1%) |
| 5:30 AM to 5:59 AM | 2 (2.0%) | 0 (0.0%) |
| 6:00 AM to 6:29 AM | 5 (5.1%) | 0 (0.0%) |
| 6:30 AM to 6:59 AM | 3 (3.1%) | 39 (41.0%) |
| 7:00 AM to 7:29 AM | 0 (0.0%) | 28 (29.5%) |
| 7:30 AM to 7:59 AM | 3 (3.1%) | 0 (0.0%) |
| 8:00 AM to 8:29 AM | 8 (8.2%) | 0 (0.0%) |
| 8:30 AM to 8:59 AM | 2 (2.0%) | 0 (0.0%) |
| 9:00 AM to 9:59 AM | 2 (2.0%) | 0 (0.0%) |
| 10:00 AM to 10:59 AM | 9 (9.2%) | 0 (0.0%) |
| 11:00 AM to 11:59 AM | 2 (2.0%) | 0 (0.0%) |
| 12:00 PM to 3:59 PM | 17 (17.3%) | 5 (5.3%) |
| 4:00 PM to 11:59 PM | 5 (5.1%) | 8 (8.4%) |
| Total | 98 (100.0%) | 95 (100.0%) |
Housing Occupancy in Courtland
Occupancy by Ownership in Courtland
Of the total 314 dwellings in Courtland, owner-occupied units account for 215 (68.5%), while renter-occupied units make up 99 (31.5%).
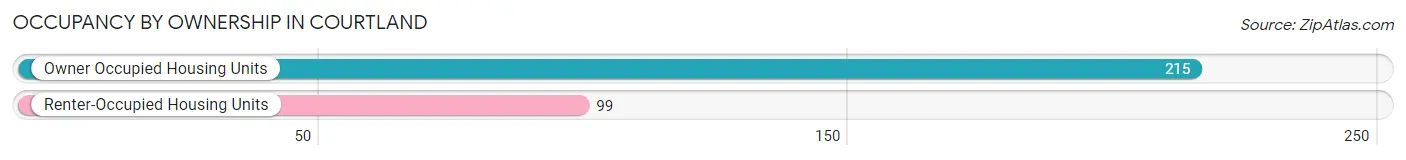
| Occupancy | # Housing Units | % Housing Units |
| Owner Occupied Housing Units | 215 | 68.5% |
| Renter-Occupied Housing Units | 99 | 31.5% |
| Total Occupied Housing Units | 314 | 100.0% |
Occupancy by Household Size in Courtland
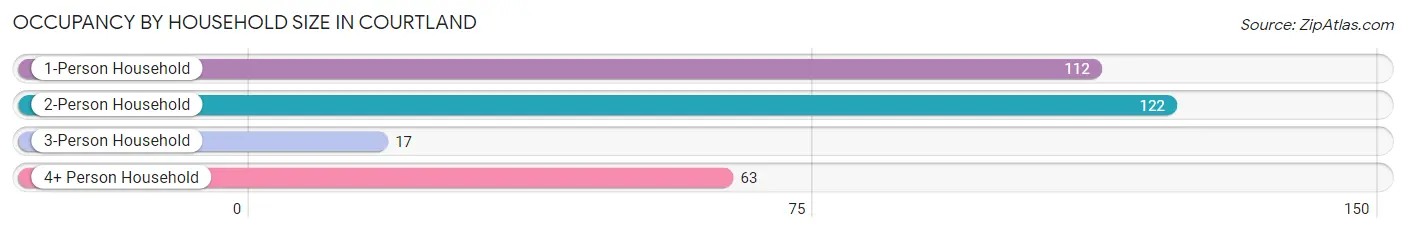
| Household Size | # Housing Units | % Housing Units |
| 1-Person Household | 112 | 35.7% |
| 2-Person Household | 122 | 38.9% |
| 3-Person Household | 17 | 5.4% |
| 4+ Person Household | 63 | 20.1% |
| Total Housing Units | 314 | 100.0% |
Occupancy by Ownership by Household Size in Courtland
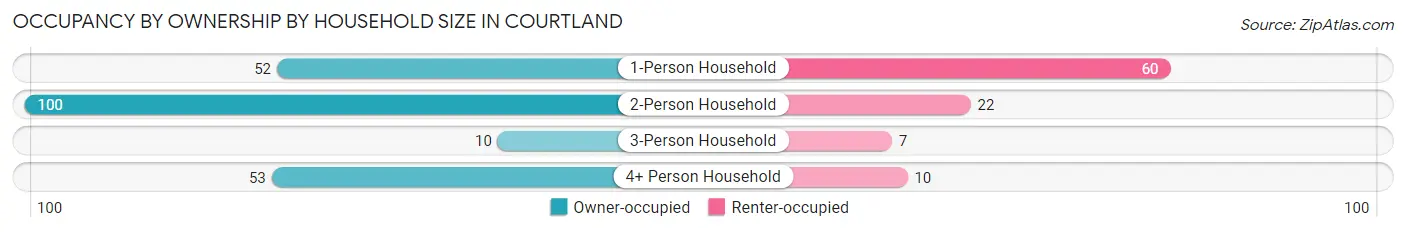
| Household Size | Owner-occupied | Renter-occupied |
| 1-Person Household | 52 (46.4%) | 60 (53.6%) |
| 2-Person Household | 100 (82.0%) | 22 (18.0%) |
| 3-Person Household | 10 (58.8%) | 7 (41.2%) |
| 4+ Person Household | 53 (84.1%) | 10 (15.9%) |
| Total Housing Units | 215 (68.5%) | 99 (31.5%) |
Occupancy by Educational Attainment in Courtland
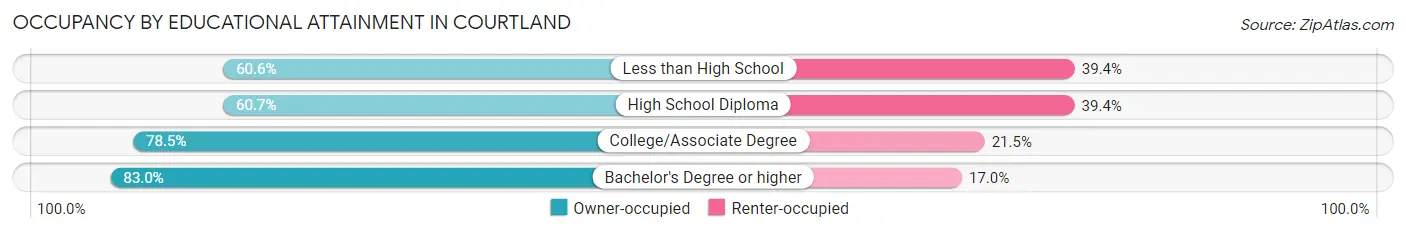
| Household Size | Owner-occupied | Renter-occupied |
| Less than High School | 20 (60.6%) | 13 (39.4%) |
| High School Diploma | 94 (60.7%) | 61 (39.4%) |
| College/Associate Degree | 62 (78.5%) | 17 (21.5%) |
| Bachelor's Degree or higher | 39 (83.0%) | 8 (17.0%) |
Occupancy by Age of Householder in Courtland
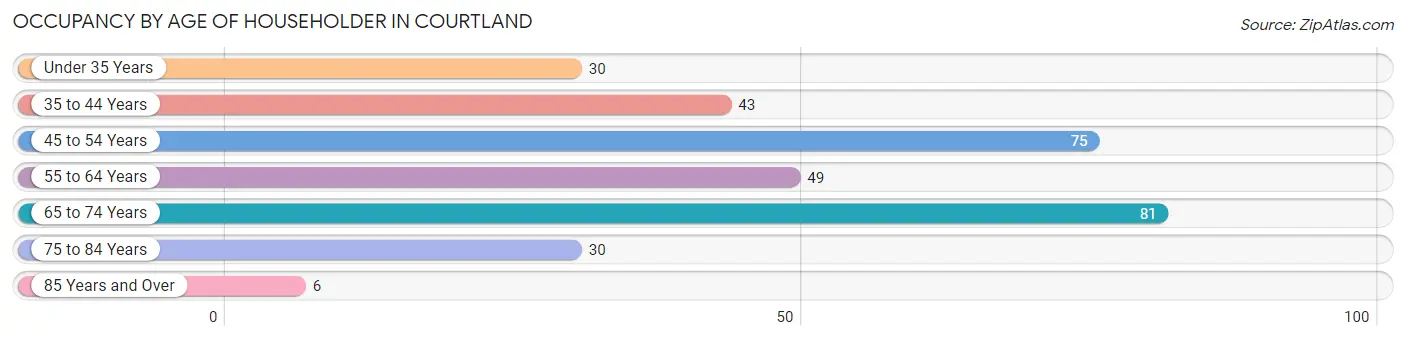
| Age Bracket | # Households | % Households |
| Under 35 Years | 30 | 9.6% |
| 35 to 44 Years | 43 | 13.7% |
| 45 to 54 Years | 75 | 23.9% |
| 55 to 64 Years | 49 | 15.6% |
| 65 to 74 Years | 81 | 25.8% |
| 75 to 84 Years | 30 | 9.6% |
| 85 Years and Over | 6 | 1.9% |
| Total | 314 | 100.0% |
Housing Finances in Courtland
Median Income by Occupancy in Courtland
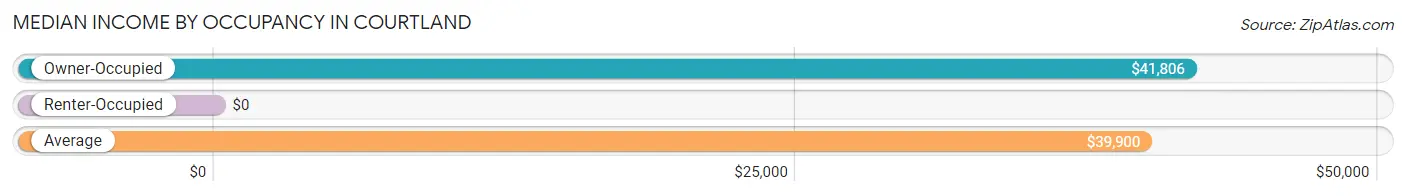
| Occupancy Type | # Households | Median Income |
| Owner-Occupied | 215 (68.5%) | $41,806 |
| Renter-Occupied | 99 (31.5%) | $0 |
| Average | 314 (100.0%) | $39,900 |
Occupancy by Householder Income Bracket in Courtland
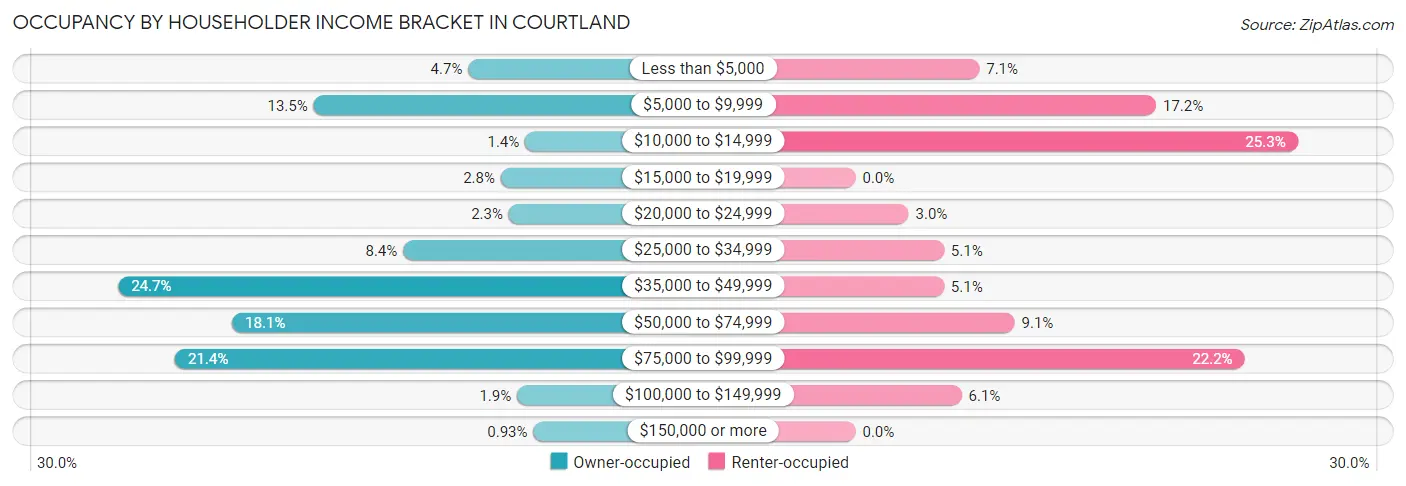
| Income Bracket | Owner-occupied | Renter-occupied |
| Less than $5,000 | 10 (4.6%) | 7 (7.1%) |
| $5,000 to $9,999 | 29 (13.5%) | 17 (17.2%) |
| $10,000 to $14,999 | 3 (1.4%) | 25 (25.3%) |
| $15,000 to $19,999 | 6 (2.8%) | 0 (0.0%) |
| $20,000 to $24,999 | 5 (2.3%) | 3 (3.0%) |
| $25,000 to $34,999 | 18 (8.4%) | 5 (5.1%) |
| $35,000 to $49,999 | 53 (24.6%) | 5 (5.1%) |
| $50,000 to $74,999 | 39 (18.1%) | 9 (9.1%) |
| $75,000 to $99,999 | 46 (21.4%) | 22 (22.2%) |
| $100,000 to $149,999 | 4 (1.9%) | 6 (6.1%) |
| $150,000 or more | 2 (0.9%) | 0 (0.0%) |
| Total | 215 (100.0%) | 99 (100.0%) |
Monthly Housing Cost Tiers in Courtland
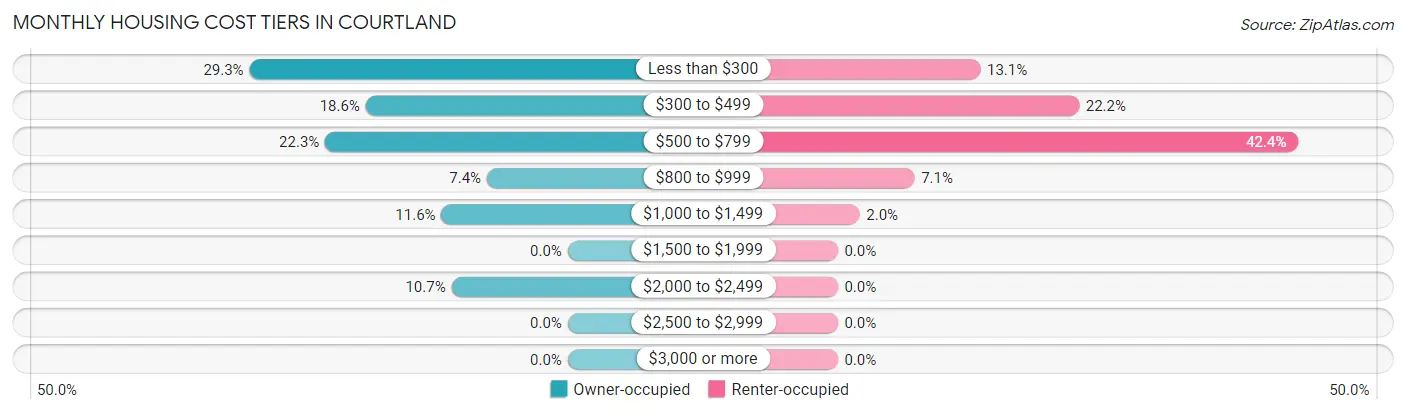
| Monthly Cost | Owner-occupied | Renter-occupied |
| Less than $300 | 63 (29.3%) | 13 (13.1%) |
| $300 to $499 | 40 (18.6%) | 22 (22.2%) |
| $500 to $799 | 48 (22.3%) | 42 (42.4%) |
| $800 to $999 | 16 (7.4%) | 7 (7.1%) |
| $1,000 to $1,499 | 25 (11.6%) | 2 (2.0%) |
| $1,500 to $1,999 | 0 (0.0%) | 0 (0.0%) |
| $2,000 to $2,499 | 23 (10.7%) | 0 (0.0%) |
| $2,500 to $2,999 | 0 (0.0%) | 0 (0.0%) |
| $3,000 or more | 0 (0.0%) | 0 (0.0%) |
| Total | 215 (100.0%) | 99 (100.0%) |
Physical Housing Characteristics in Courtland
Housing Structures in Courtland
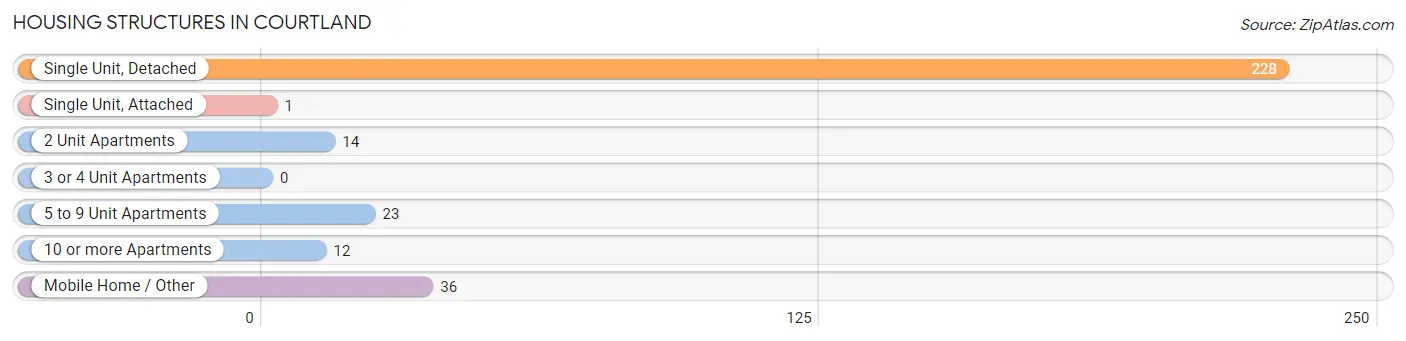
| Structure Type | # Housing Units | % Housing Units |
| Single Unit, Detached | 228 | 72.6% |
| Single Unit, Attached | 1 | 0.3% |
| 2 Unit Apartments | 14 | 4.5% |
| 3 or 4 Unit Apartments | 0 | 0.0% |
| 5 to 9 Unit Apartments | 23 | 7.3% |
| 10 or more Apartments | 12 | 3.8% |
| Mobile Home / Other | 36 | 11.5% |
| Total | 314 | 100.0% |
Housing Structures by Occupancy in Courtland
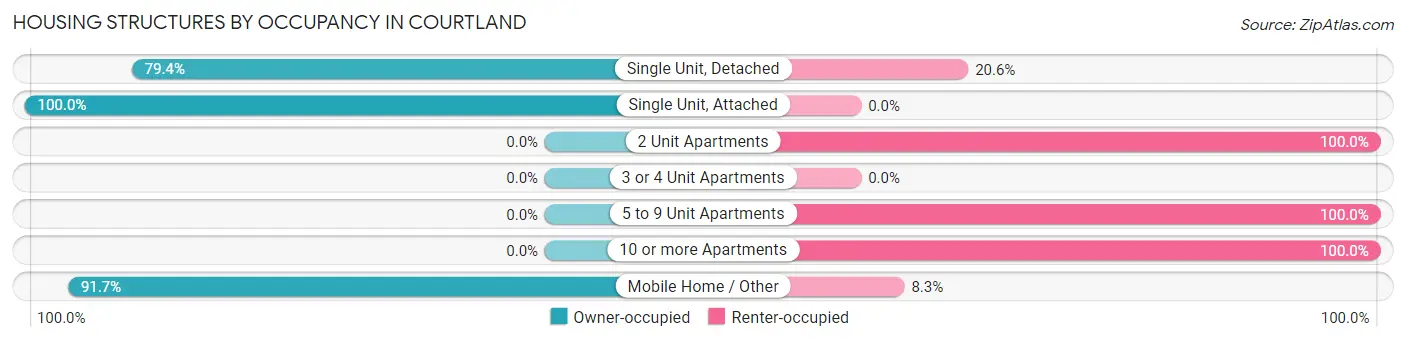
| Structure Type | Owner-occupied | Renter-occupied |
| Single Unit, Detached | 181 (79.4%) | 47 (20.6%) |
| Single Unit, Attached | 1 (100.0%) | 0 (0.0%) |
| 2 Unit Apartments | 0 (0.0%) | 14 (100.0%) |
| 3 or 4 Unit Apartments | 0 (0.0%) | 0 (0.0%) |
| 5 to 9 Unit Apartments | 0 (0.0%) | 23 (100.0%) |
| 10 or more Apartments | 0 (0.0%) | 12 (100.0%) |
| Mobile Home / Other | 33 (91.7%) | 3 (8.3%) |
| Total | 215 (68.5%) | 99 (31.5%) |
Housing Structures by Number of Rooms in Courtland
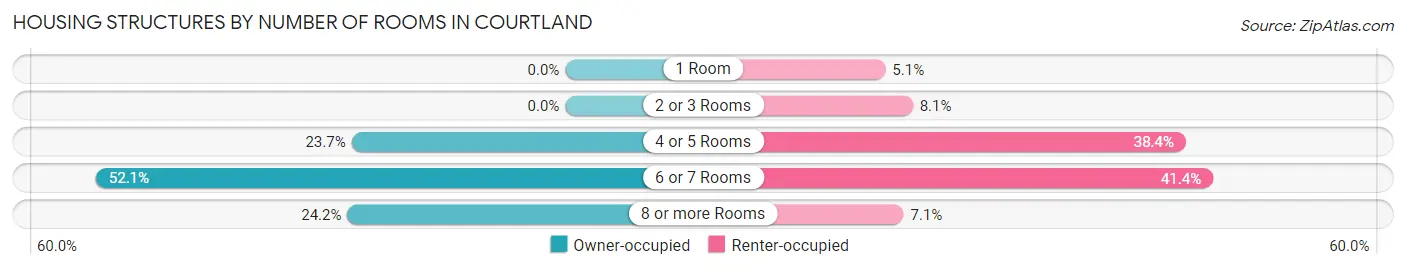
| Number of Rooms | Owner-occupied | Renter-occupied |
| 1 Room | 0 (0.0%) | 5 (5.1%) |
| 2 or 3 Rooms | 0 (0.0%) | 8 (8.1%) |
| 4 or 5 Rooms | 51 (23.7%) | 38 (38.4%) |
| 6 or 7 Rooms | 112 (52.1%) | 41 (41.4%) |
| 8 or more Rooms | 52 (24.2%) | 7 (7.1%) |
| Total | 215 (100.0%) | 99 (100.0%) |
Housing Structure by Heating Type in Courtland
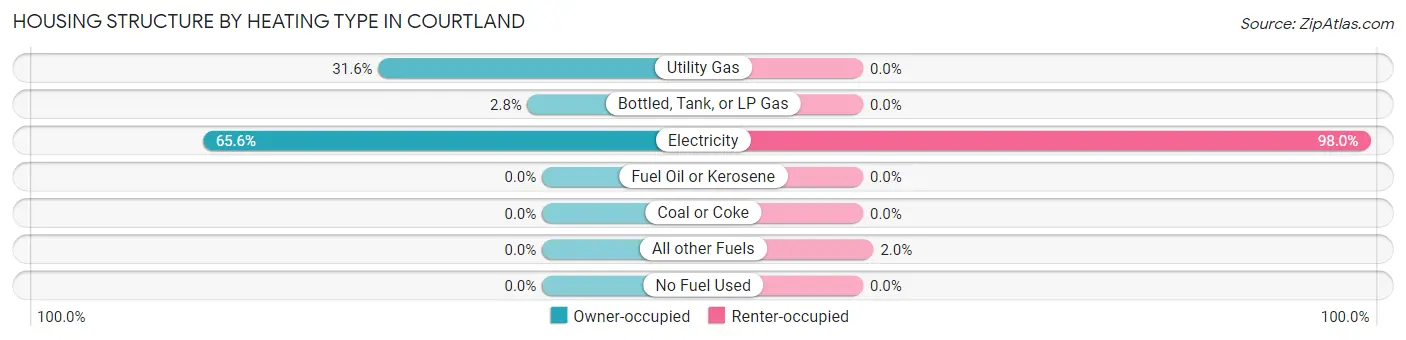
| Heating Type | Owner-occupied | Renter-occupied |
| Utility Gas | 68 (31.6%) | 0 (0.0%) |
| Bottled, Tank, or LP Gas | 6 (2.8%) | 0 (0.0%) |
| Electricity | 141 (65.6%) | 97 (98.0%) |
| Fuel Oil or Kerosene | 0 (0.0%) | 0 (0.0%) |
| Coal or Coke | 0 (0.0%) | 0 (0.0%) |
| All other Fuels | 0 (0.0%) | 2 (2.0%) |
| No Fuel Used | 0 (0.0%) | 0 (0.0%) |
| Total | 215 (100.0%) | 99 (100.0%) |
Household Vehicle Usage in Courtland
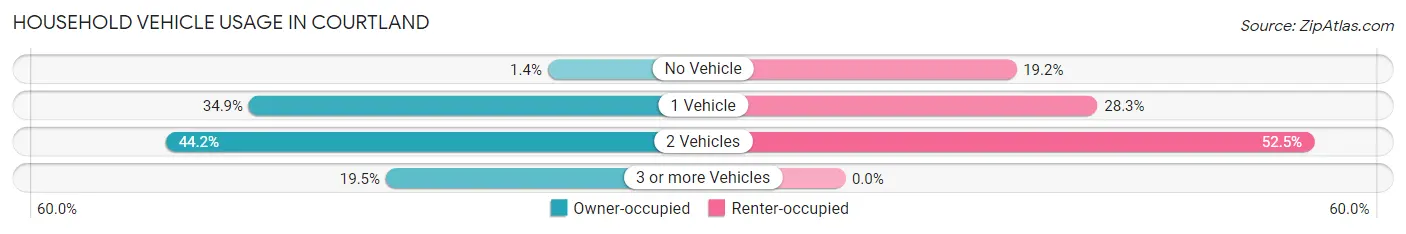
| Vehicles per Household | Owner-occupied | Renter-occupied |
| No Vehicle | 3 (1.4%) | 19 (19.2%) |
| 1 Vehicle | 75 (34.9%) | 28 (28.3%) |
| 2 Vehicles | 95 (44.2%) | 52 (52.5%) |
| 3 or more Vehicles | 42 (19.5%) | 0 (0.0%) |
| Total | 215 (100.0%) | 99 (100.0%) |
Real Estate & Mortgages in Courtland
Real Estate and Mortgage Overview in Courtland
| Characteristic | Without Mortgage | With Mortgage |
| Housing Units | 123 | 92 |
| Median Property Value | $62,300 | $136,700 |
| Median Household Income | $35,750 | $2 |
| Monthly Housing Costs | $296 | $0 |
| Real Estate Taxes | $379 | $38 |
Property Value by Mortgage Status in Courtland
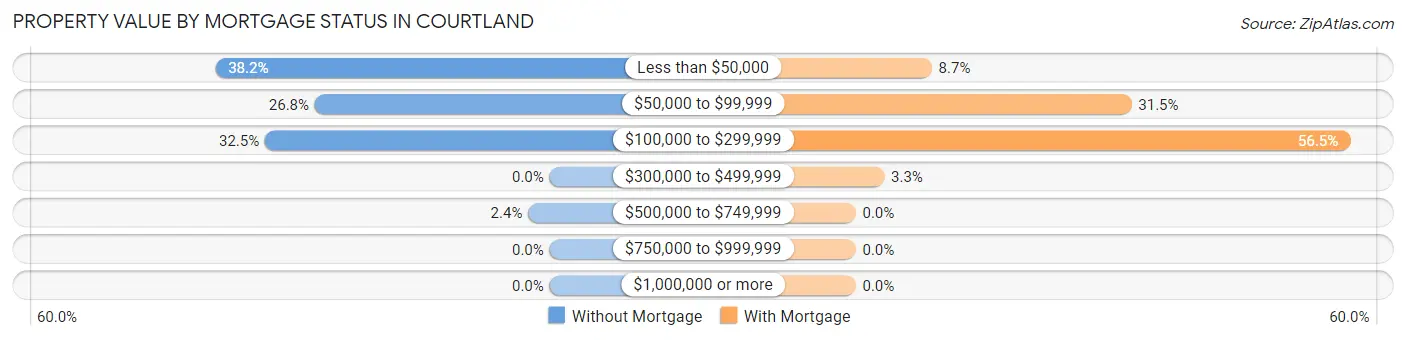
| Property Value | Without Mortgage | With Mortgage |
| Less than $50,000 | 47 (38.2%) | 8 (8.7%) |
| $50,000 to $99,999 | 33 (26.8%) | 29 (31.5%) |
| $100,000 to $299,999 | 40 (32.5%) | 52 (56.5%) |
| $300,000 to $499,999 | 0 (0.0%) | 3 (3.3%) |
| $500,000 to $749,999 | 3 (2.4%) | 0 (0.0%) |
| $750,000 to $999,999 | 0 (0.0%) | 0 (0.0%) |
| $1,000,000 or more | 0 (0.0%) | 0 (0.0%) |
| Total | 123 (100.0%) | 92 (100.0%) |
Household Income by Mortgage Status in Courtland
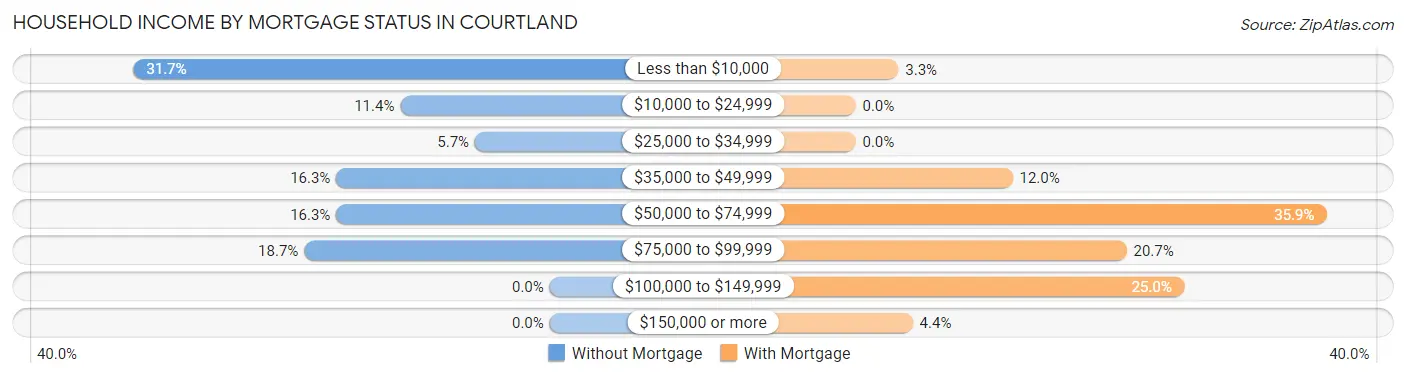
| Household Income | Without Mortgage | With Mortgage |
| Less than $10,000 | 39 (31.7%) | 3 (3.3%) |
| $10,000 to $24,999 | 14 (11.4%) | 0 (0.0%) |
| $25,000 to $34,999 | 7 (5.7%) | 0 (0.0%) |
| $35,000 to $49,999 | 20 (16.3%) | 11 (12.0%) |
| $50,000 to $74,999 | 20 (16.3%) | 33 (35.9%) |
| $75,000 to $99,999 | 23 (18.7%) | 19 (20.6%) |
| $100,000 to $149,999 | 0 (0.0%) | 23 (25.0%) |
| $150,000 or more | 0 (0.0%) | 4 (4.3%) |
| Total | 123 (100.0%) | 92 (100.0%) |
Property Value to Household Income Ratio in Courtland
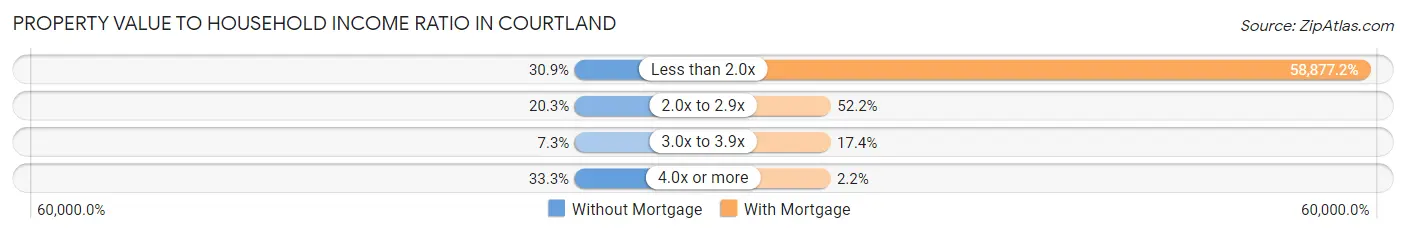
| Value-to-Income Ratio | Without Mortgage | With Mortgage |
| Less than 2.0x | 38 (30.9%) | 54,167 (58,877.2%) |
| 2.0x to 2.9x | 25 (20.3%) | 48 (52.2%) |
| 3.0x to 3.9x | 9 (7.3%) | 16 (17.4%) |
| 4.0x or more | 41 (33.3%) | 2 (2.2%) |
| Total | 123 (100.0%) | 92 (100.0%) |
Real Estate Taxes by Mortgage Status in Courtland
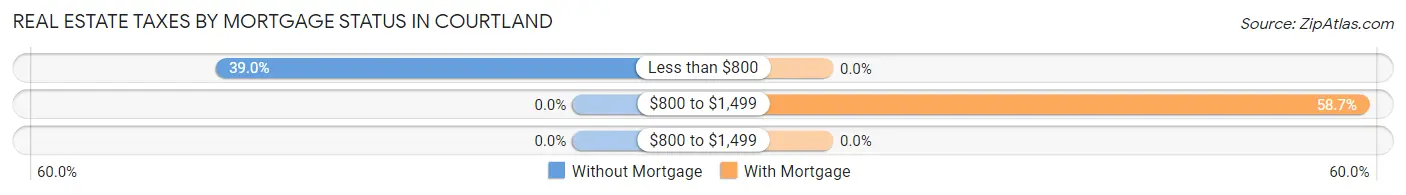
| Property Taxes | Without Mortgage | With Mortgage |
| Less than $800 | 48 (39.0%) | 0 (0.0%) |
| $800 to $1,499 | 0 (0.0%) | 54 (58.7%) |
| $800 to $1,499 | 0 (0.0%) | 0 (0.0%) |
| Total | 123 (100.0%) | 92 (100.0%) |
Health & Disability in Courtland
Health Insurance Coverage by Age in Courtland
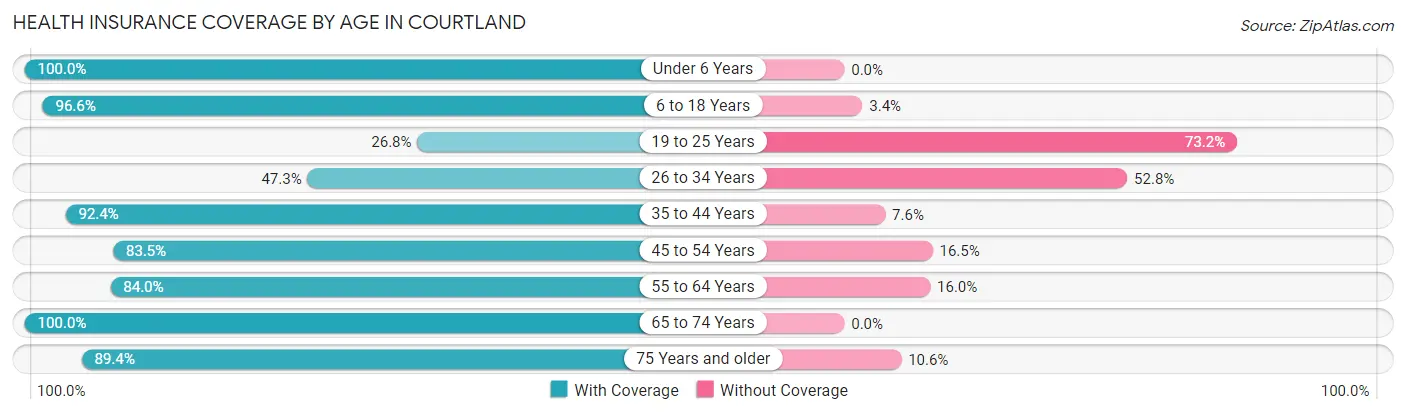
| Age Bracket | With Coverage | Without Coverage |
| Under 6 Years | 52 (100.0%) | 0 (0.0%) |
| 6 to 18 Years | 115 (96.6%) | 4 (3.4%) |
| 19 to 25 Years | 19 (26.8%) | 52 (73.2%) |
| 26 to 34 Years | 43 (47.2%) | 48 (52.7%) |
| 35 to 44 Years | 97 (92.4%) | 8 (7.6%) |
| 45 to 54 Years | 66 (83.5%) | 13 (16.5%) |
| 55 to 64 Years | 63 (84.0%) | 12 (16.0%) |
| 65 to 74 Years | 111 (100.0%) | 0 (0.0%) |
| 75 Years and older | 59 (89.4%) | 7 (10.6%) |
| Total | 625 (81.3%) | 144 (18.7%) |
Health Insurance Coverage by Citizenship Status in Courtland
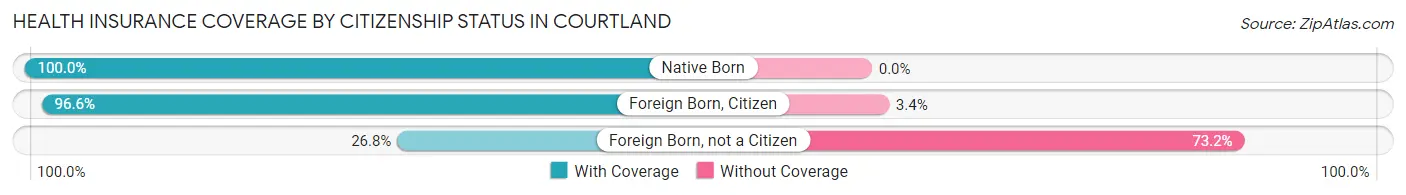
| Citizenship Status | With Coverage | Without Coverage |
| Native Born | 52 (100.0%) | 0 (0.0%) |
| Foreign Born, Citizen | 115 (96.6%) | 4 (3.4%) |
| Foreign Born, not a Citizen | 19 (26.8%) | 52 (73.2%) |
Health Insurance Coverage by Household Income in Courtland
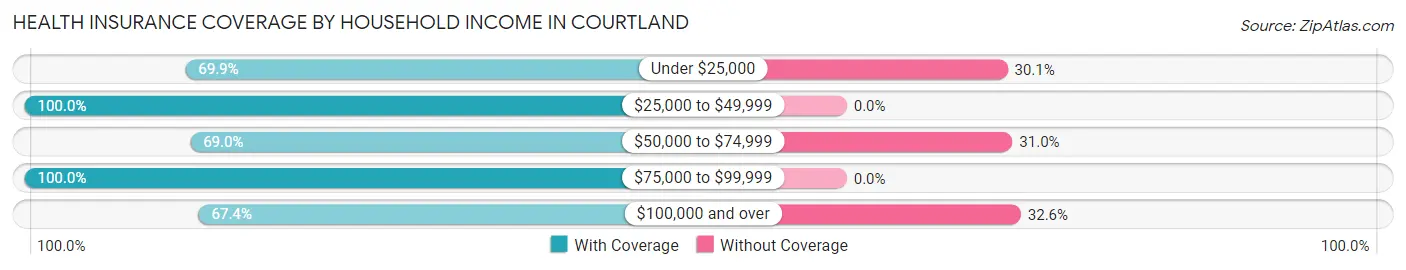
| Household Income | With Coverage | Without Coverage |
| Under $25,000 | 174 (69.9%) | 75 (30.1%) |
| $25,000 to $49,999 | 176 (100.0%) | 0 (0.0%) |
| $50,000 to $74,999 | 120 (69.0%) | 54 (31.0%) |
| $75,000 to $99,999 | 124 (100.0%) | 0 (0.0%) |
| $100,000 and over | 31 (67.4%) | 15 (32.6%) |
Public vs Private Health Insurance Coverage by Age in Courtland
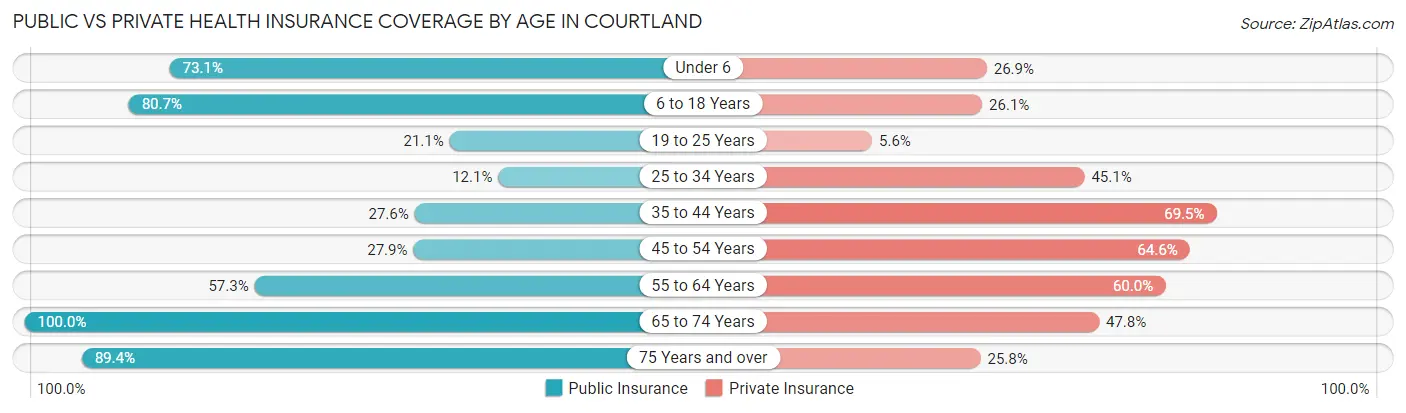
| Age Bracket | Public Insurance | Private Insurance |
| Under 6 | 38 (73.1%) | 14 (26.9%) |
| 6 to 18 Years | 96 (80.7%) | 31 (26.1%) |
| 19 to 25 Years | 15 (21.1%) | 4 (5.6%) |
| 25 to 34 Years | 11 (12.1%) | 41 (45.1%) |
| 35 to 44 Years | 29 (27.6%) | 73 (69.5%) |
| 45 to 54 Years | 22 (27.9%) | 51 (64.6%) |
| 55 to 64 Years | 43 (57.3%) | 45 (60.0%) |
| 65 to 74 Years | 111 (100.0%) | 53 (47.7%) |
| 75 Years and over | 59 (89.4%) | 17 (25.8%) |
| Total | 424 (55.1%) | 329 (42.8%) |
Disability Status by Sex by Age in Courtland
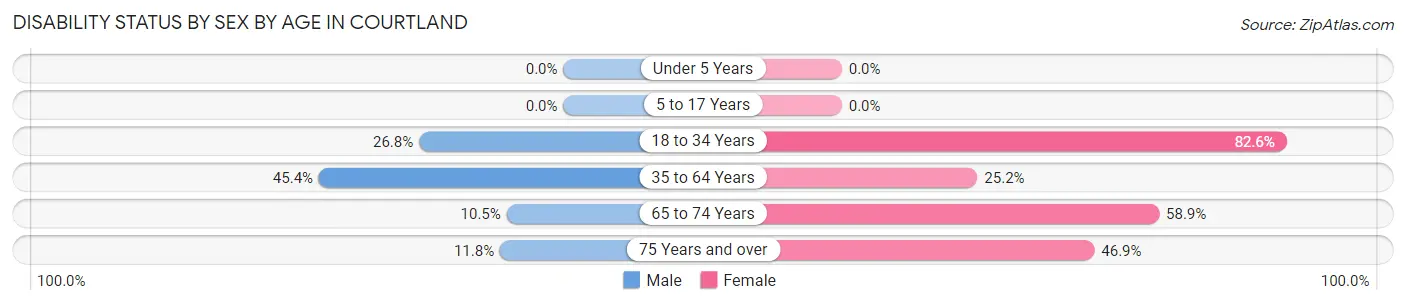
| Age Bracket | Male | Female |
| Under 5 Years | 0 (0.0%) | 0 (0.0%) |
| 5 to 17 Years | 0 (0.0%) | 0 (0.0%) |
| 18 to 34 Years | 15 (26.8%) | 90 (82.6%) |
| 35 to 64 Years | 49 (45.4%) | 38 (25.2%) |
| 65 to 74 Years | 4 (10.5%) | 43 (58.9%) |
| 75 Years and over | 4 (11.8%) | 15 (46.9%) |
Disability Class by Sex by Age in Courtland
Disability Class: Hearing Difficulty
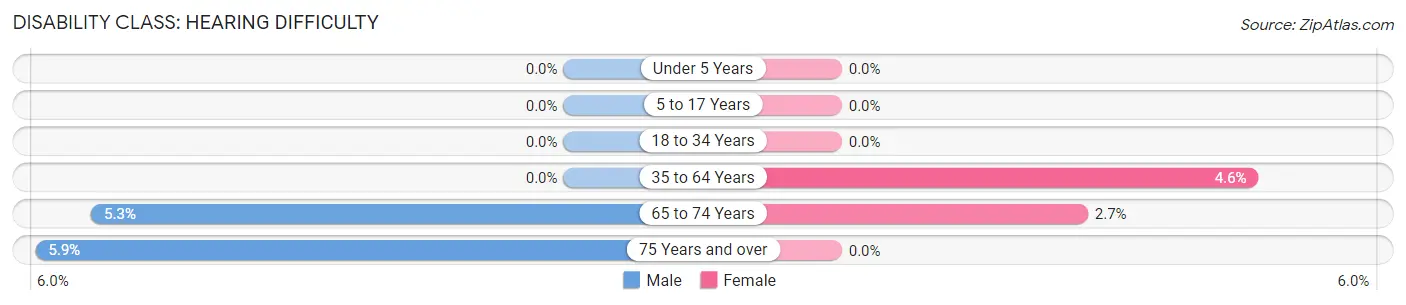
| Age Bracket | Male | Female |
| Under 5 Years | 0 (0.0%) | 0 (0.0%) |
| 5 to 17 Years | 0 (0.0%) | 0 (0.0%) |
| 18 to 34 Years | 0 (0.0%) | 0 (0.0%) |
| 35 to 64 Years | 0 (0.0%) | 7 (4.6%) |
| 65 to 74 Years | 2 (5.3%) | 2 (2.7%) |
| 75 Years and over | 2 (5.9%) | 0 (0.0%) |
Disability Class: Vision Difficulty
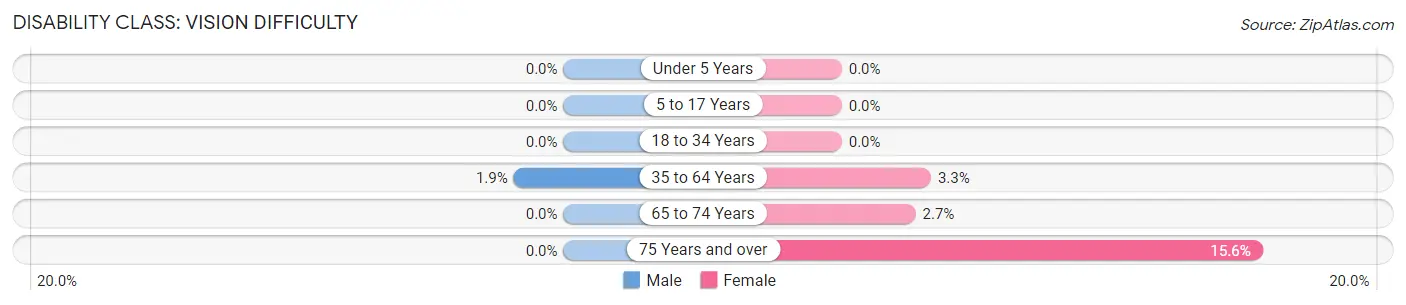
| Age Bracket | Male | Female |
| Under 5 Years | 0 (0.0%) | 0 (0.0%) |
| 5 to 17 Years | 0 (0.0%) | 0 (0.0%) |
| 18 to 34 Years | 0 (0.0%) | 0 (0.0%) |
| 35 to 64 Years | 2 (1.8%) | 5 (3.3%) |
| 65 to 74 Years | 0 (0.0%) | 2 (2.7%) |
| 75 Years and over | 0 (0.0%) | 5 (15.6%) |
Disability Class: Cognitive Difficulty
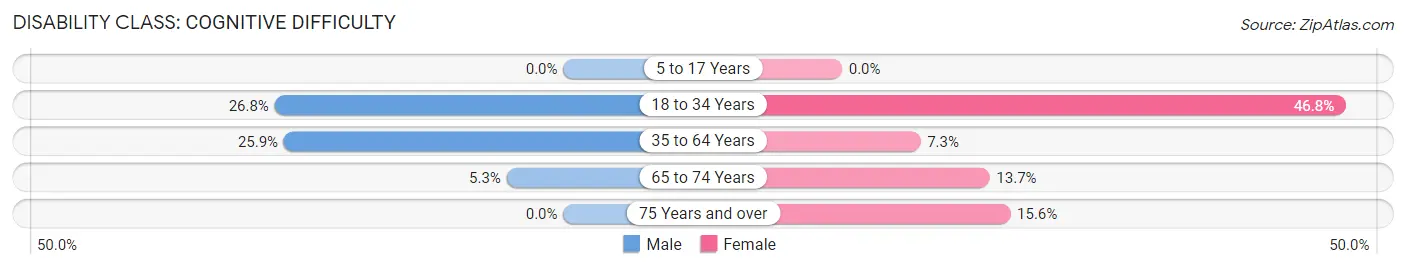
| Age Bracket | Male | Female |
| 5 to 17 Years | 0 (0.0%) | 0 (0.0%) |
| 18 to 34 Years | 15 (26.8%) | 51 (46.8%) |
| 35 to 64 Years | 28 (25.9%) | 11 (7.3%) |
| 65 to 74 Years | 2 (5.3%) | 10 (13.7%) |
| 75 Years and over | 0 (0.0%) | 5 (15.6%) |
Disability Class: Ambulatory Difficulty
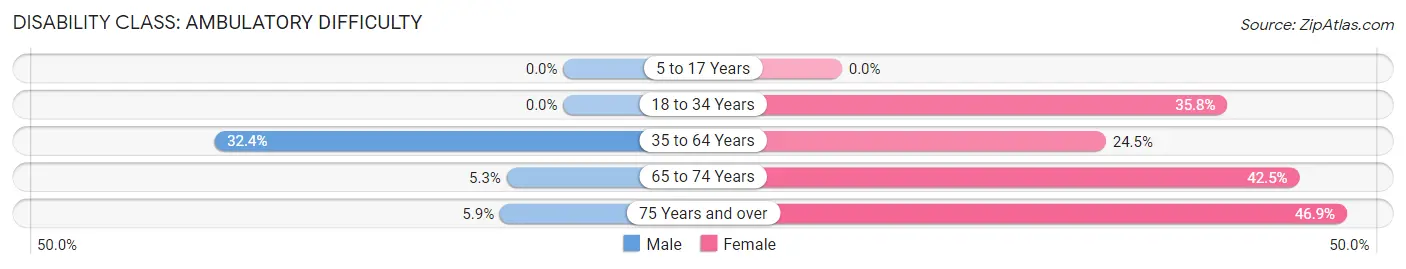
| Age Bracket | Male | Female |
| 5 to 17 Years | 0 (0.0%) | 0 (0.0%) |
| 18 to 34 Years | 0 (0.0%) | 39 (35.8%) |
| 35 to 64 Years | 35 (32.4%) | 37 (24.5%) |
| 65 to 74 Years | 2 (5.3%) | 31 (42.5%) |
| 75 Years and over | 2 (5.9%) | 15 (46.9%) |
Disability Class: Self-Care Difficulty
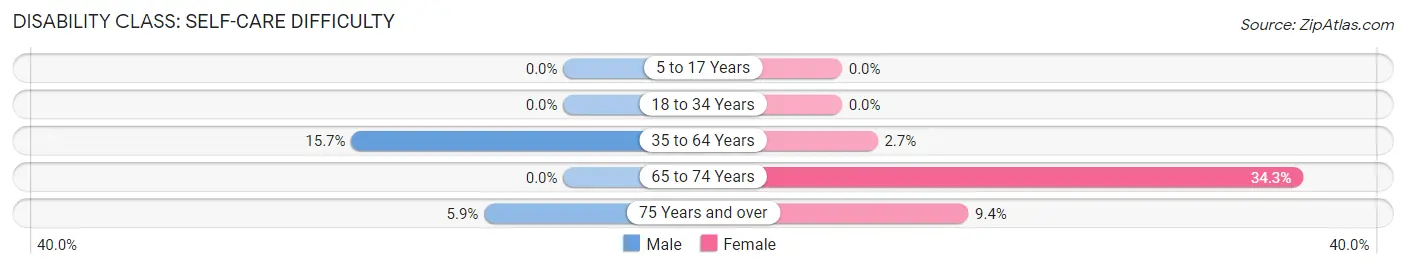
| Age Bracket | Male | Female |
| 5 to 17 Years | 0 (0.0%) | 0 (0.0%) |
| 18 to 34 Years | 0 (0.0%) | 0 (0.0%) |
| 35 to 64 Years | 17 (15.7%) | 4 (2.6%) |
| 65 to 74 Years | 0 (0.0%) | 25 (34.3%) |
| 75 Years and over | 2 (5.9%) | 3 (9.4%) |
Technology Access in Courtland
Computing Device Access in Courtland
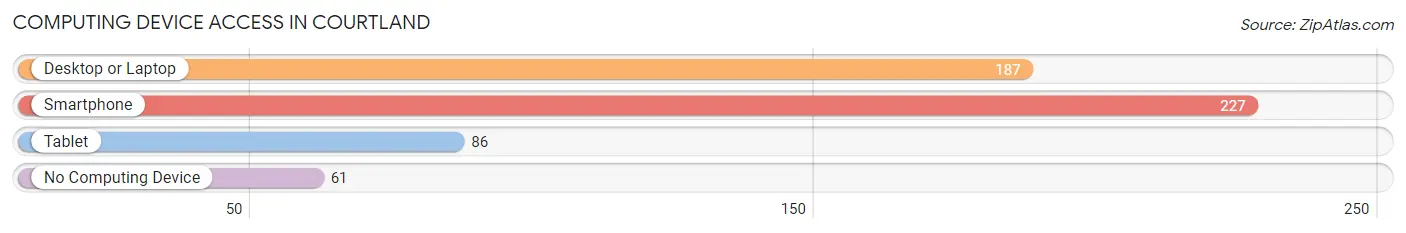
| Device Type | # Households | % Households |
| Desktop or Laptop | 187 | 59.6% |
| Smartphone | 227 | 72.3% |
| Tablet | 86 | 27.4% |
| No Computing Device | 61 | 19.4% |
| Total | 314 | 100.0% |
Internet Access in Courtland
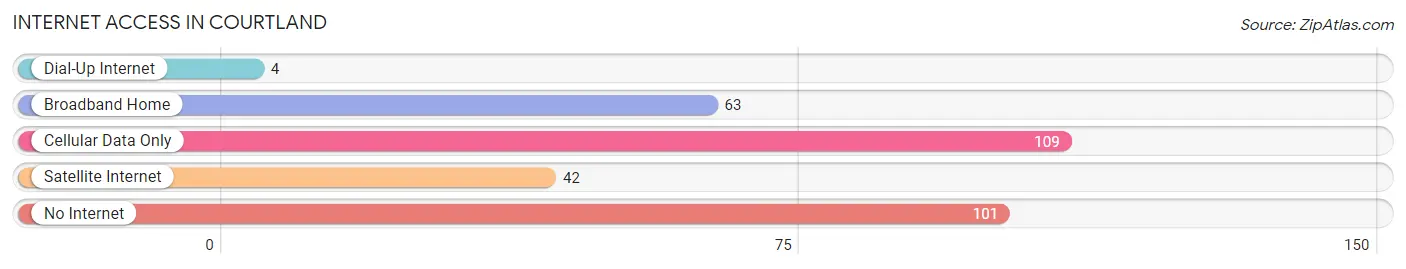
| Internet Type | # Households | % Households |
| Dial-Up Internet | 4 | 1.3% |
| Broadband Home | 63 | 20.1% |
| Cellular Data Only | 109 | 34.7% |
| Satellite Internet | 42 | 13.4% |
| No Internet | 101 | 32.2% |
| Total | 314 | 100.0% |
Courtland Summary
History
Courtland, Alabama is a small town located in Lawrence County, Alabama. It was founded in 1818 and is the county seat of Lawrence County. The town was named after the Courtland family, who were early settlers in the area. The town was originally known as Courtlandville, but the name was changed to Courtland in 1820.
The town was an important trading center in the early 19th century, and it was the site of the first courthouse in Lawrence County. The town was also the site of the first post office in the county, which was established in 1821.
The town was an important stop on the stagecoach route between Nashville and Huntsville, and it was also a stop on the railroad line between Decatur and Florence. The town was also the site of the first school in Lawrence County, which was established in 1825.
The town was an important center of the cotton industry in the 19th century, and it was the site of the first cotton gin in the county. The town was also the site of the first bank in the county, which was established in 1837.
The town was an important center of the Civil War in the state of Alabama. The town was the site of the Battle of Courtland, which was fought on April 10, 1862. The battle was a Confederate victory, and it was the first major battle of the war in the state of Alabama.
The town was also the site of the first Confederate hospital in the state of Alabama, which was established in 1862. The town was also the site of the first Confederate cemetery in the state of Alabama, which was established in 1863.
The town was an important center of the Reconstruction era in the state of Alabama. The town was the site of the first African-American school in the county, which was established in 1868. The town was also the site of the first African-American church in the county, which was established in 1869.
The town was an important center of the industrial revolution in the state of Alabama. The town was the site of the first cotton mill in the county, which was established in 1872. The town was also the site of the first electric power plant in the county, which was established in 1887.
The town was an important center of the civil rights movement in the state of Alabama. The town was the site of the first civil rights march in the county, which was held in 1965. The town was also the site of the first civil rights sit-in in the county, which was held in 1966.
Geography
Courtland is located in the northwest corner of Lawrence County, Alabama. The town is situated on the banks of the Tennessee River, and it is located about 25 miles south of Florence and about 40 miles north of Huntsville. The town is located in the foothills of the Appalachian Mountains, and it is surrounded by rolling hills and forests.
The climate in Courtland is humid subtropical, with hot summers and mild winters. The average annual temperature is around 68 degrees Fahrenheit, and the average annual precipitation is around 50 inches.
Economy
The economy of Courtland is largely based on agriculture and manufacturing. The town is home to several large farms, and it is also home to several manufacturing plants. The town is also home to several small businesses, including restaurants, retail stores, and service providers.
The town is also home to several educational institutions, including the Courtland High School, the Courtland Middle School, and the Courtland Elementary School.
Demographics
As of the 2010 census, the population of Courtland was 1,845. The racial makeup of the town was 95.3% White, 2.2% African American, 0.3% Native American, 0.3% Asian, 0.1% Pacific Islander, 0.7% from other races, and 0.9% from two or more races. Hispanic or Latino of any race were 1.7% of the population.
The median household income in Courtland was $35,938, and the median family income was $41,250. The per capita income in Courtland was $17,845. About 16.2% of families and 19.2% of the population were below the poverty line, including 25.2% of those under age 18 and 14.2% of those age 65 or over.
Common Questions
What is Per Capita Income in Courtland?
Per Capita income in Courtland is $18,360.
What is the Median Family Income in Courtland?
Median Family Income in Courtland is $54,886.
What is the Median Household income in Courtland?
Median Household Income in Courtland is $39,900.
What is Income or Wage Gap in Courtland?
Income or Wage Gap in Courtland is 26.5%.
Women in Courtland earn 73.5 cents for every dollar earned by a man.
What is Inequality or Gini Index in Courtland?
Inequality or Gini Index in Courtland is 0.42.
What is the Total Population of Courtland?
Total Population of Courtland is 769.
What is the Total Male Population of Courtland?
Total Male Population of Courtland is 305.
What is the Total Female Population of Courtland?
Total Female Population of Courtland is 464.
What is the Ratio of Males per 100 Females in Courtland?
There are 65.73 Males per 100 Females in Courtland.
What is the Ratio of Females per 100 Males in Courtland?
There are 152.13 Females per 100 Males in Courtland.
What is the Median Population Age in Courtland?
Median Population Age in Courtland is 42.4 Years.
What is the Average Family Size in Courtland
Average Family Size in Courtland is 3.3 People.
What is the Average Household Size in Courtland
Average Household Size in Courtland is 2.5 People.
How Large is the Labor Force in Courtland?
There are 198 People in the Labor Forcein in Courtland.
What is the Percentage of People in the Labor Force in Courtland?
32.2% of People are in the Labor Force in Courtland.
What is the Unemployment Rate in Courtland?
Unemployment Rate in Courtland is 2.5%.