Centre, AL Map & Demographics
Centre Map
Centre Overview
$27,887
PER CAPITA INCOME
$63,207
AVG FAMILY INCOME
$41,924
AVG HOUSEHOLD INCOME
1.3%
WAGE / INCOME GAP [ % ]
98.7¢/ $1
WAGE / INCOME GAP [ $ ]
0.42
INEQUALITY / GINI INDEX
3,609
TOTAL POPULATION
1,522
MALE POPULATION
2,087
FEMALE POPULATION
72.93
MALES / 100 FEMALES
137.12
FEMALES / 100 MALES
54.5
MEDIAN AGE
2.8
AVG FAMILY SIZE
2.2
AVG HOUSEHOLD SIZE
1,393
LABOR FORCE [ PEOPLE ]
43.3%
PERCENT IN LABOR FORCE
7.5%
UNEMPLOYMENT RATE
Centre Zip Codes
Centre Area Codes
Income in Centre
Income Overview in Centre
Per Capita Income in Centre is $27,887, while median incomes of families and households are $63,207 and $41,924 respectively.
| Characteristic | Number | Measure |
| Per Capita Income | 3,609 | $27,887 |
| Median Family Income | 898 | $63,207 |
| Mean Family Income | 898 | $75,045 |
| Median Household Income | 1,505 | $41,924 |
| Mean Household Income | 1,505 | $59,888 |
| Income Deficit | 898 | $0 |
| Wage / Income Gap (%) | 3,609 | 1.35% |
| Wage / Income Gap ($) | 3,609 | 98.65¢ per $1 |
| Gini / Inequality Index | 3,609 | 0.42 |
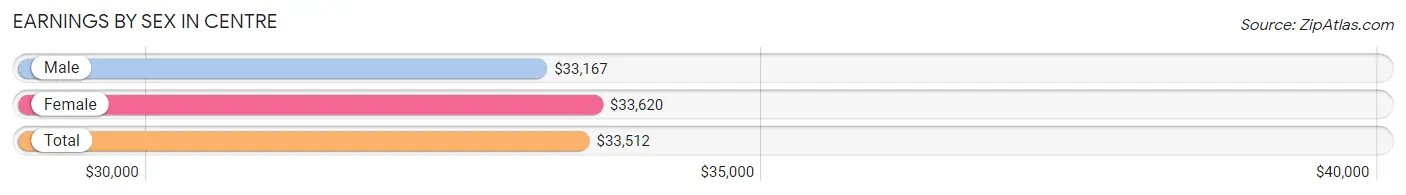
Earnings by Sex in Centre
Average Earnings in Centre are $33,512, $33,167 for men and $33,620 for women, a difference of 1.3%.
| Sex | Number | Average Earnings |
| Male | 764 (50.8%) | $33,167 |
| Female | 739 (49.2%) | $33,620 |
| Total | 1,503 (100.0%) | $33,512 |
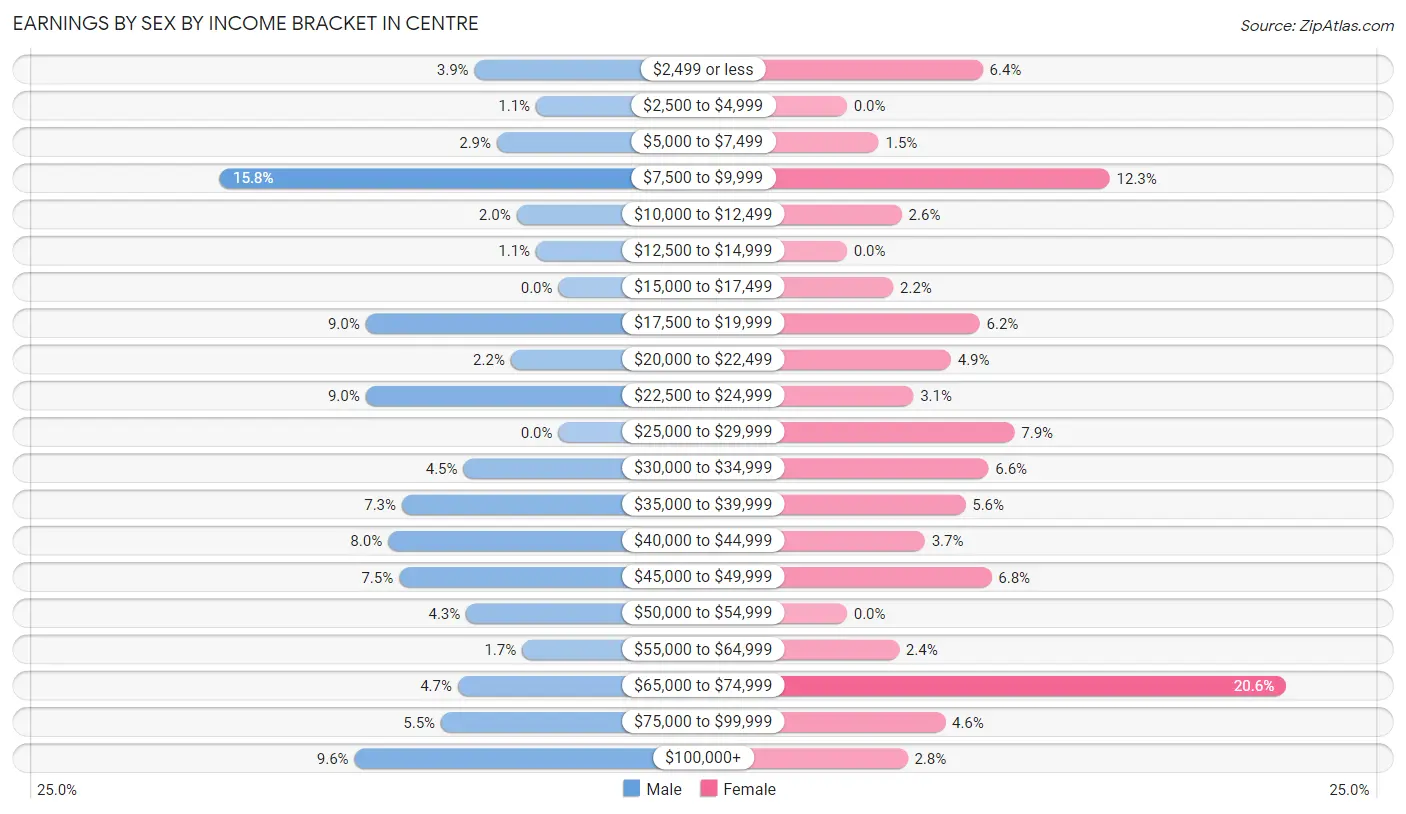
Earnings by Sex by Income Bracket in Centre
The most common earnings brackets in Centre are $7,500 to $9,999 for men (121 | 15.8%) and $65,000 to $74,999 for women (152 | 20.6%).
| Income | Male | Female |
| $2,499 or less | 30 (3.9%) | 47 (6.4%) |
| $2,500 to $4,999 | 8 (1.1%) | 0 (0.0%) |
| $5,000 to $7,499 | 22 (2.9%) | 11 (1.5%) |
| $7,500 to $9,999 | 121 (15.8%) | 91 (12.3%) |
| $10,000 to $12,499 | 15 (2.0%) | 19 (2.6%) |
| $12,500 to $14,999 | 8 (1.1%) | 0 (0.0%) |
| $15,000 to $17,499 | 0 (0.0%) | 16 (2.2%) |
| $17,500 to $19,999 | 69 (9.0%) | 46 (6.2%) |
| $20,000 to $22,499 | 17 (2.2%) | 36 (4.9%) |
| $22,500 to $24,999 | 69 (9.0%) | 23 (3.1%) |
| $25,000 to $29,999 | 0 (0.0%) | 58 (7.9%) |
| $30,000 to $34,999 | 34 (4.4%) | 49 (6.6%) |
| $35,000 to $39,999 | 56 (7.3%) | 41 (5.6%) |
| $40,000 to $44,999 | 61 (8.0%) | 27 (3.6%) |
| $45,000 to $49,999 | 57 (7.5%) | 50 (6.8%) |
| $50,000 to $54,999 | 33 (4.3%) | 0 (0.0%) |
| $55,000 to $64,999 | 13 (1.7%) | 18 (2.4%) |
| $65,000 to $74,999 | 36 (4.7%) | 152 (20.6%) |
| $75,000 to $99,999 | 42 (5.5%) | 34 (4.6%) |
| $100,000+ | 73 (9.6%) | 21 (2.8%) |
| Total | 764 (100.0%) | 739 (100.0%) |
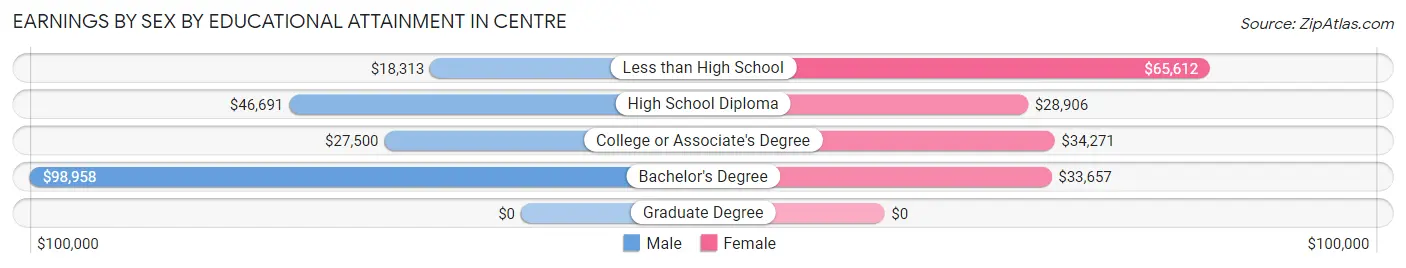
Earnings by Sex by Educational Attainment in Centre
Average earnings in Centre are $37,297 for men and $35,259 for women, a difference of 5.5%. Men with an educational attainment of bachelor's degree enjoy the highest average annual earnings of $98,958, while those with less than high school education earn the least with $18,313. Women with an educational attainment of less than high school earn the most with the average annual earnings of $65,612, while those with high school diploma education have the smallest earnings of $28,906.
| Educational Attainment | Male Income | Female Income |
| Less than High School | $18,313 | $65,612 |
| High School Diploma | $46,691 | $28,906 |
| College or Associate's Degree | $27,500 | $34,271 |
| Bachelor's Degree | $98,958 | $33,657 |
| Graduate Degree | - | - |
| Total | $37,297 | $35,259 |
Family Income in Centre
Family Income Brackets in Centre
According to the Centre family income data, there are 242 families falling into the $75,000 to $99,999 income range, which is the most common income bracket and makes up 27.0% of all families. Conversely, the less than $10,000 income bracket is the least frequent group with only 11 families (1.2%) belonging to this category.
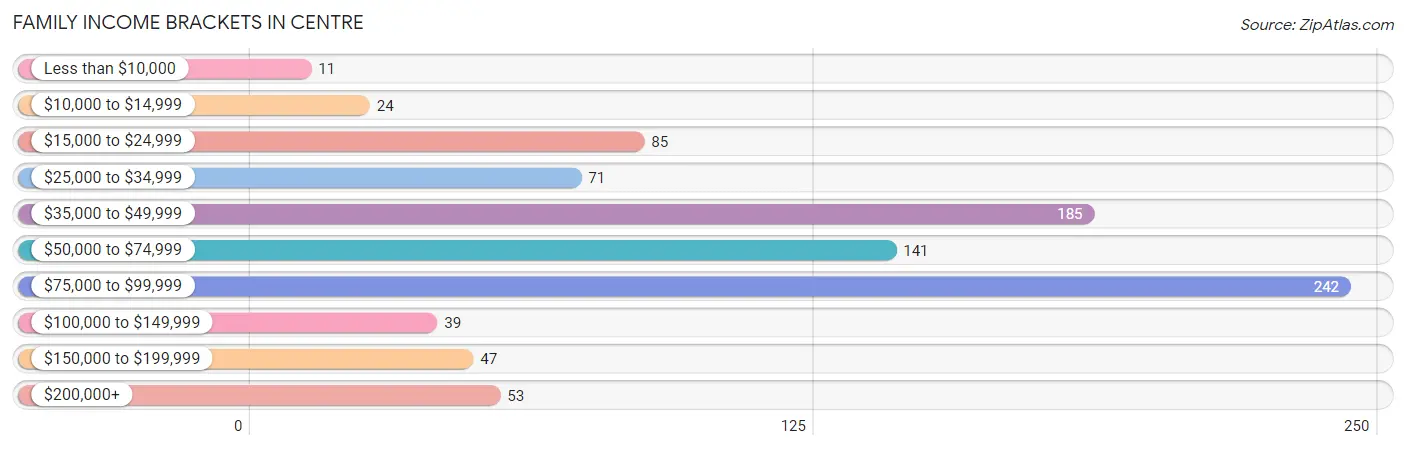
| Income Bracket | # Families | % Families |
| Less than $10,000 | 11 | 1.2% |
| $10,000 to $14,999 | 24 | 2.7% |
| $15,000 to $24,999 | 85 | 9.5% |
| $25,000 to $34,999 | 71 | 7.9% |
| $35,000 to $49,999 | 185 | 20.6% |
| $50,000 to $74,999 | 141 | 15.7% |
| $75,000 to $99,999 | 242 | 26.9% |
| $100,000 to $149,999 | 39 | 4.3% |
| $150,000 to $199,999 | 47 | 5.2% |
| $200,000+ | 53 | 5.9% |
Family Income by Famaliy Size in Centre
5-person families (50 | 5.6%) account for the highest median family income in Centre with $230,484 per family, while 5-person families (50 | 5.6%) have the highest median income of $46,097 per family member.
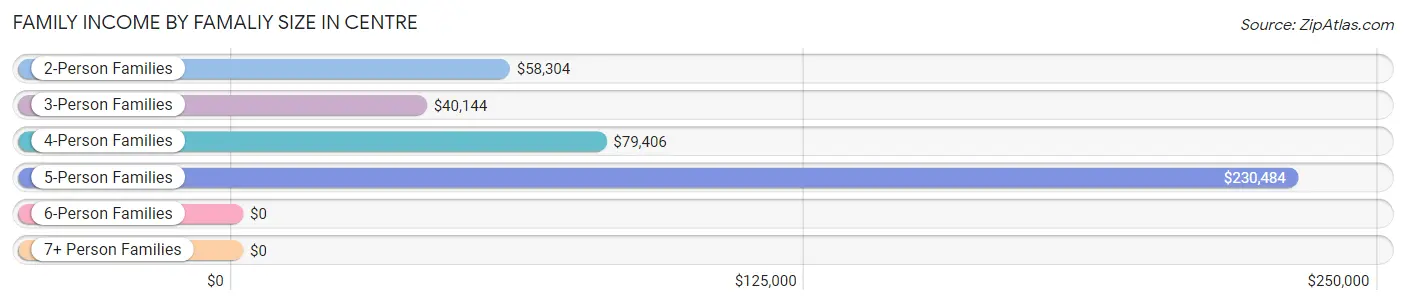
| Income Bracket | # Families | Median Income |
| 2-Person Families | 618 (68.8%) | $58,304 |
| 3-Person Families | 117 (13.0%) | $40,144 |
| 4-Person Families | 113 (12.6%) | $79,406 |
| 5-Person Families | 50 (5.6%) | $230,484 |
| 6-Person Families | 0 (0.0%) | $0 |
| 7+ Person Families | 0 (0.0%) | $0 |
| Total | 898 (100.0%) | $63,207 |
Family Income by Number of Earners in Centre
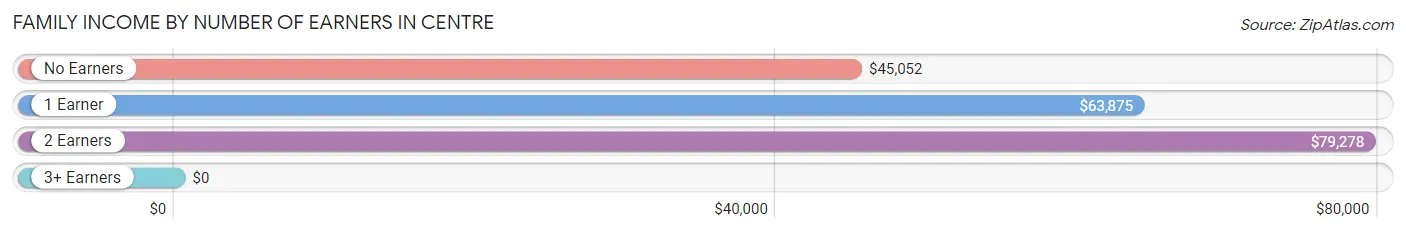
| Number of Earners | # Families | Median Income |
| No Earners | 239 (26.6%) | $45,052 |
| 1 Earner | 366 (40.8%) | $63,875 |
| 2 Earners | 255 (28.4%) | $79,278 |
| 3+ Earners | 38 (4.2%) | $0 |
| Total | 898 (100.0%) | $63,207 |
Household Income in Centre
Household Income Brackets in Centre
With 340 households falling in the category, the $35,000 to $49,999 income range is the most frequent in Centre, accounting for 22.6% of all households. In contrast, only 47 households (3.1%) fall into the $150,000 to $199,999 income bracket, making it the least populous group.
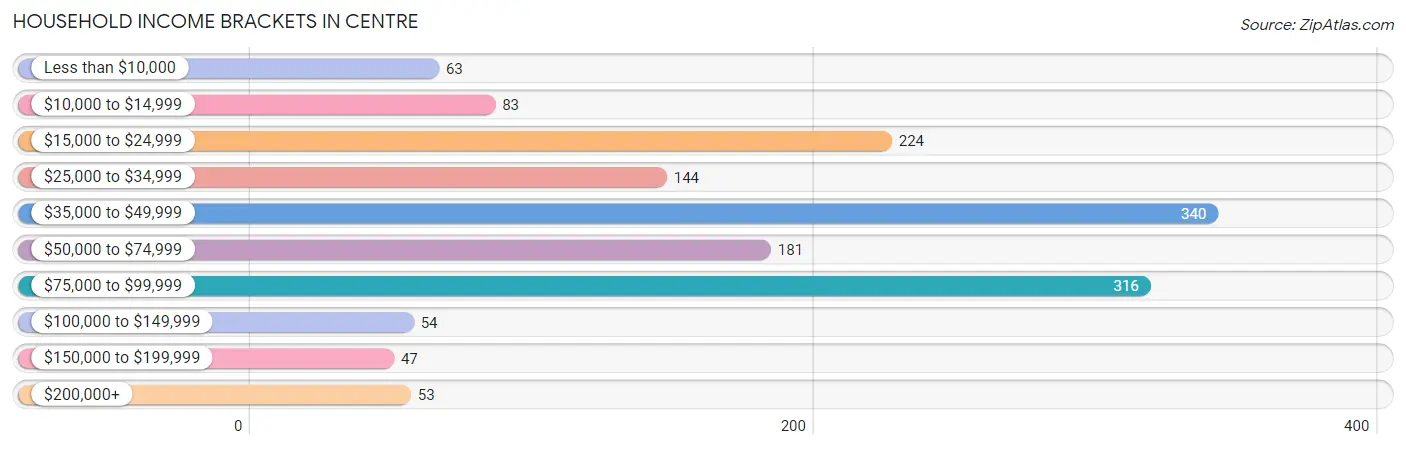
| Income Bracket | # Households | % Households |
| Less than $10,000 | 63 | 4.2% |
| $10,000 to $14,999 | 83 | 5.5% |
| $15,000 to $24,999 | 224 | 14.9% |
| $25,000 to $34,999 | 144 | 9.6% |
| $35,000 to $49,999 | 340 | 22.6% |
| $50,000 to $74,999 | 181 | 12.0% |
| $75,000 to $99,999 | 316 | 21.0% |
| $100,000 to $149,999 | 54 | 3.6% |
| $150,000 to $199,999 | 47 | 3.1% |
| $200,000+ | 53 | 3.5% |
Household Income by Householder Age in Centre
The median household income in Centre is $41,924, with the highest median household income of $55,147 found in the 25 to 44 years age bracket for the primary householder. A total of 262 households (17.4%) fall into this category. Meanwhile, the 15 to 24 years age bracket for the primary householder has the lowest median household income of $0, with 19 households (1.3%) in this group.
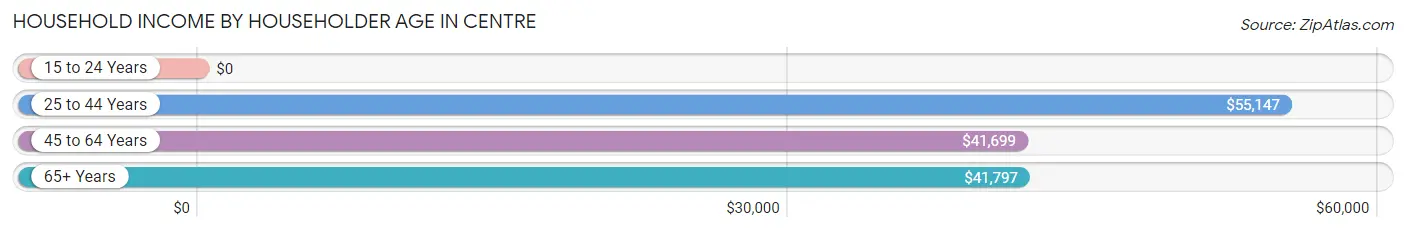
| Income Bracket | # Households | Median Income |
| 15 to 24 Years | 19 (1.3%) | $0 |
| 25 to 44 Years | 262 (17.4%) | $55,147 |
| 45 to 64 Years | 576 (38.3%) | $41,699 |
| 65+ Years | 648 (43.1%) | $41,797 |
| Total | 1,505 (100.0%) | $41,924 |
Poverty in Centre
Income Below Poverty by Sex and Age in Centre
With 9.6% poverty level for males and 15.1% for females among the residents of Centre, 6 to 11 year old males and 12 to 14 year old females are the most vulnerable to poverty, with 26 males (53.1%) and 23 females (41.8%) in their respective age groups living below the poverty level.
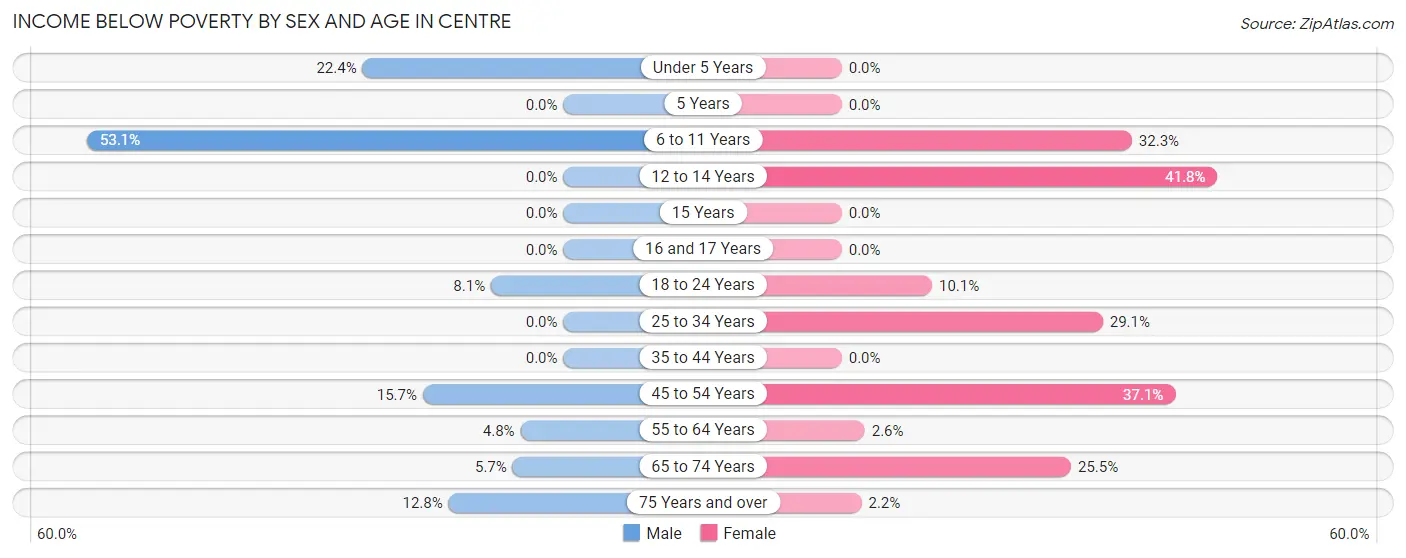
| Age Bracket | Male | Female |
| Under 5 Years | 17 (22.4%) | 0 (0.0%) |
| 5 Years | 0 (0.0%) | 0 (0.0%) |
| 6 to 11 Years | 26 (53.1%) | 21 (32.3%) |
| 12 to 14 Years | 0 (0.0%) | 23 (41.8%) |
| 15 Years | 0 (0.0%) | 0 (0.0%) |
| 16 and 17 Years | 0 (0.0%) | 0 (0.0%) |
| 18 to 24 Years | 10 (8.1%) | 19 (10.1%) |
| 25 to 34 Years | 0 (0.0%) | 50 (29.1%) |
| 35 to 44 Years | 0 (0.0%) | 0 (0.0%) |
| 45 to 54 Years | 36 (15.7%) | 98 (37.1%) |
| 55 to 64 Years | 11 (4.8%) | 9 (2.6%) |
| 65 to 74 Years | 7 (5.7%) | 60 (25.5%) |
| 75 Years and over | 28 (12.8%) | 9 (2.2%) |
| Total | 135 (9.6%) | 289 (15.1%) |
Income Above Poverty by Sex and Age in Centre
According to the poverty statistics in Centre, males aged 12 to 14 years and females aged under 5 years are the age groups that are most secure financially, with 100.0% of males and 100.0% of females in these age groups living above the poverty line.
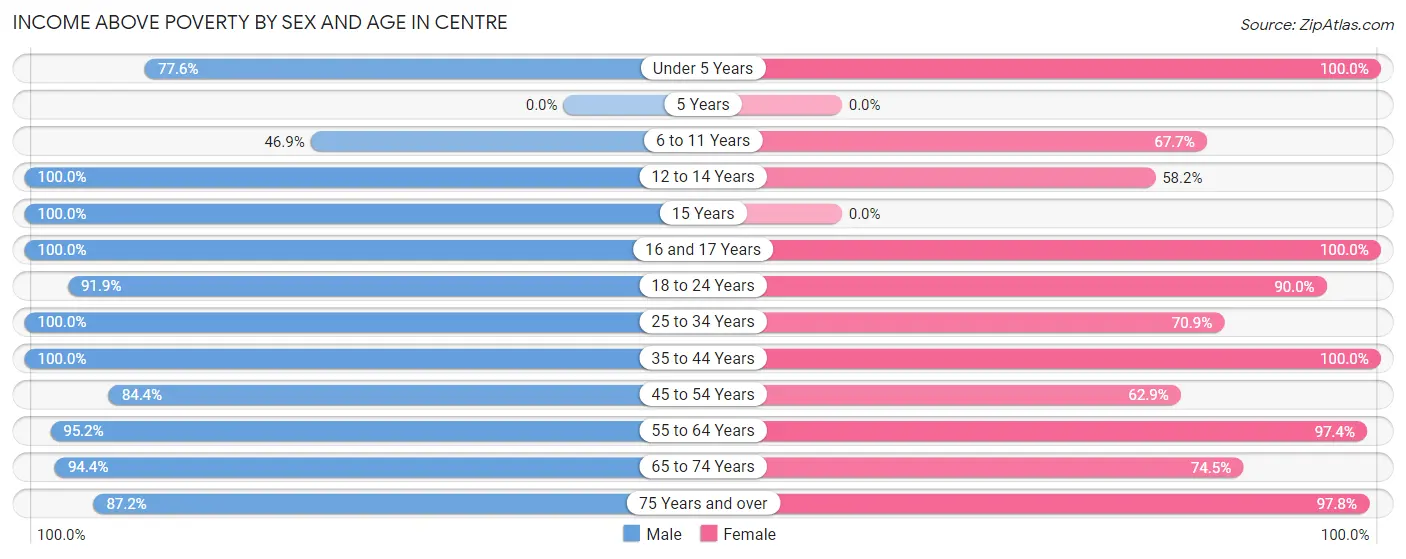
| Age Bracket | Male | Female |
| Under 5 Years | 59 (77.6%) | 24 (100.0%) |
| 5 Years | 0 (0.0%) | 0 (0.0%) |
| 6 to 11 Years | 23 (46.9%) | 44 (67.7%) |
| 12 to 14 Years | 96 (100.0%) | 32 (58.2%) |
| 15 Years | 24 (100.0%) | 0 (0.0%) |
| 16 and 17 Years | 19 (100.0%) | 54 (100.0%) |
| 18 to 24 Years | 114 (91.9%) | 170 (89.9%) |
| 25 to 34 Years | 148 (100.0%) | 122 (70.9%) |
| 35 to 44 Years | 69 (100.0%) | 89 (100.0%) |
| 45 to 54 Years | 194 (84.4%) | 166 (62.9%) |
| 55 to 64 Years | 219 (95.2%) | 342 (97.4%) |
| 65 to 74 Years | 117 (94.4%) | 175 (74.5%) |
| 75 Years and over | 191 (87.2%) | 400 (97.8%) |
| Total | 1,273 (90.4%) | 1,618 (84.9%) |
Income Below Poverty Among Married-Couple Families in Centre
The poverty statistics for married-couple families in Centre show that 4.4% or 24 of the total 539 families live below the poverty line. Families with no children have the highest poverty rate of 6.9%, comprising of 24 families. On the other hand, families with 1 or 2 children have the lowest poverty rate of 0.0%, which includes 0 families.
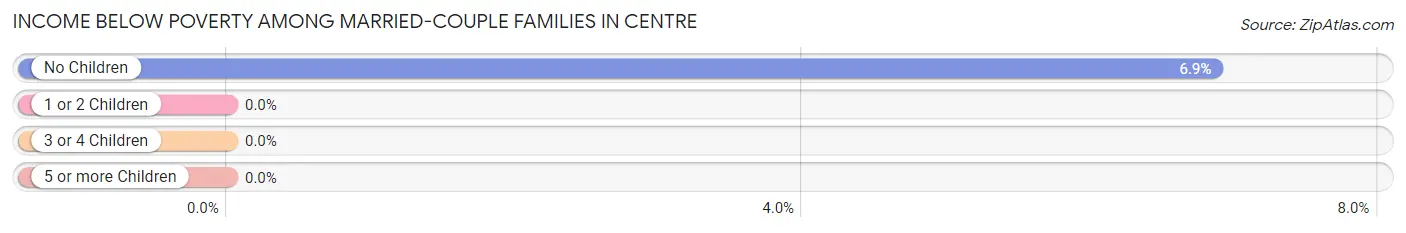
| Children | Above Poverty | Below Poverty |
| No Children | 326 (93.1%) | 24 (6.9%) |
| 1 or 2 Children | 177 (100.0%) | 0 (0.0%) |
| 3 or 4 Children | 12 (100.0%) | 0 (0.0%) |
| 5 or more Children | 0 (0.0%) | 0 (0.0%) |
| Total | 515 (95.6%) | 24 (4.4%) |
Income Below Poverty Among Single-Parent Households in Centre
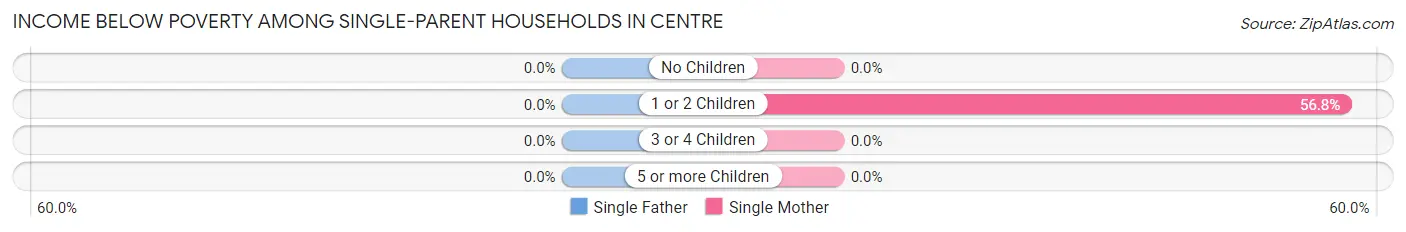
| Children | Single Father | Single Mother |
| No Children | 0 (0.0%) | 0 (0.0%) |
| 1 or 2 Children | 0 (0.0%) | 50 (56.8%) |
| 3 or 4 Children | 0 (0.0%) | 0 (0.0%) |
| 5 or more Children | 0 (0.0%) | 0 (0.0%) |
| Total | 0 (0.0%) | 50 (17.9%) |
Income Below Poverty Among Married-Couple vs Single-Parent Households in Centre
The poverty data for Centre shows that 24 of the married-couple family households (4.4%) and 50 of the single-parent households (13.9%) are living below the poverty level. Within the married-couple family households, those with no children have the highest poverty rate, with 24 households (6.9%) falling below the poverty line. Among the single-parent households, those with 1 or 2 children have the highest poverty rate, with 50 household (49.5%) living below poverty.
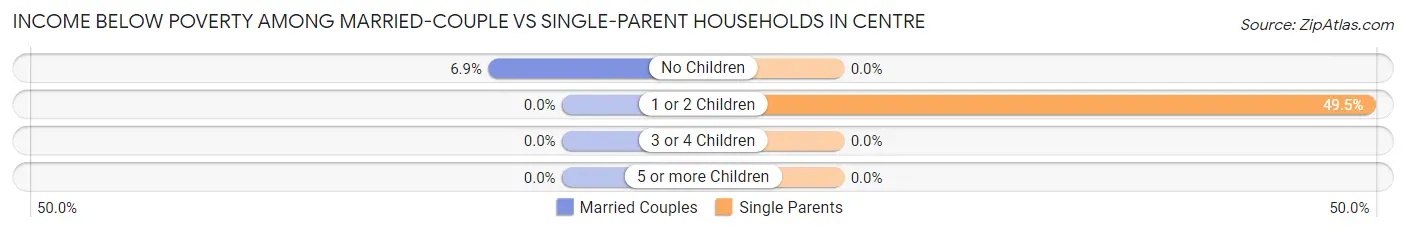
| Children | Married-Couple Families | Single-Parent Households |
| No Children | 24 (6.9%) | 0 (0.0%) |
| 1 or 2 Children | 0 (0.0%) | 50 (49.5%) |
| 3 or 4 Children | 0 (0.0%) | 0 (0.0%) |
| 5 or more Children | 0 (0.0%) | 0 (0.0%) |
| Total | 24 (4.4%) | 50 (13.9%) |
Race in Centre
The most populous races in Centre are White / Caucasian (2,976 | 82.5%), Black / African American (534 | 14.8%), and Two or more Races (99 | 2.7%).
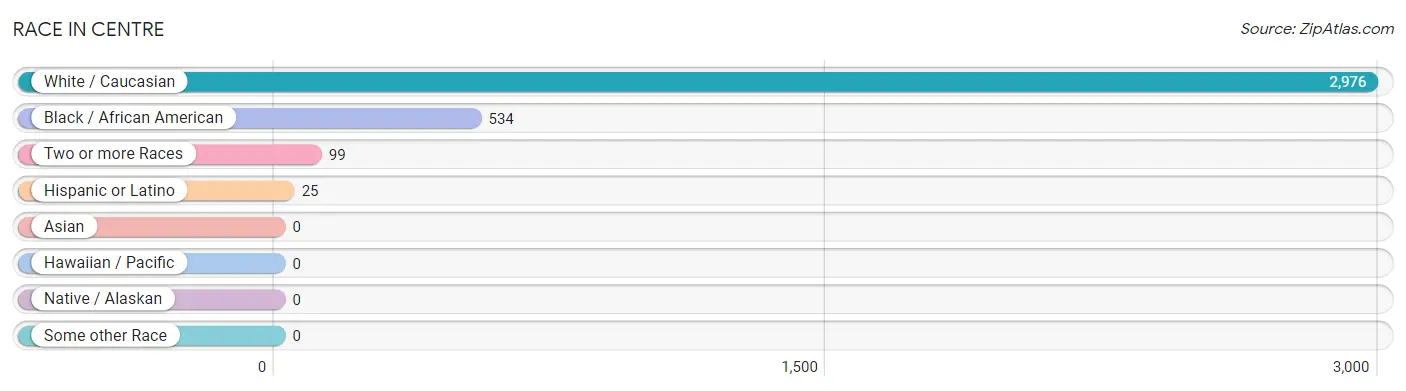
| Race | # Population | % Population |
| Asian | 0 | 0.0% |
| Black / African American | 534 | 14.8% |
| Hawaiian / Pacific | 0 | 0.0% |
| Hispanic or Latino | 25 | 0.7% |
| Native / Alaskan | 0 | 0.0% |
| White / Caucasian | 2,976 | 82.5% |
| Two or more Races | 99 | 2.7% |
| Some other Race | 0 | 0.0% |
| Total | 3,609 | 100.0% |
Ancestry in Centre
The most populous ancestries reported in Centre are English (399 | 11.1%), American (362 | 10.0%), Irish (340 | 9.4%), German (136 | 3.8%), and French (113 | 3.1%), together accounting for 37.4% of all Centre residents.
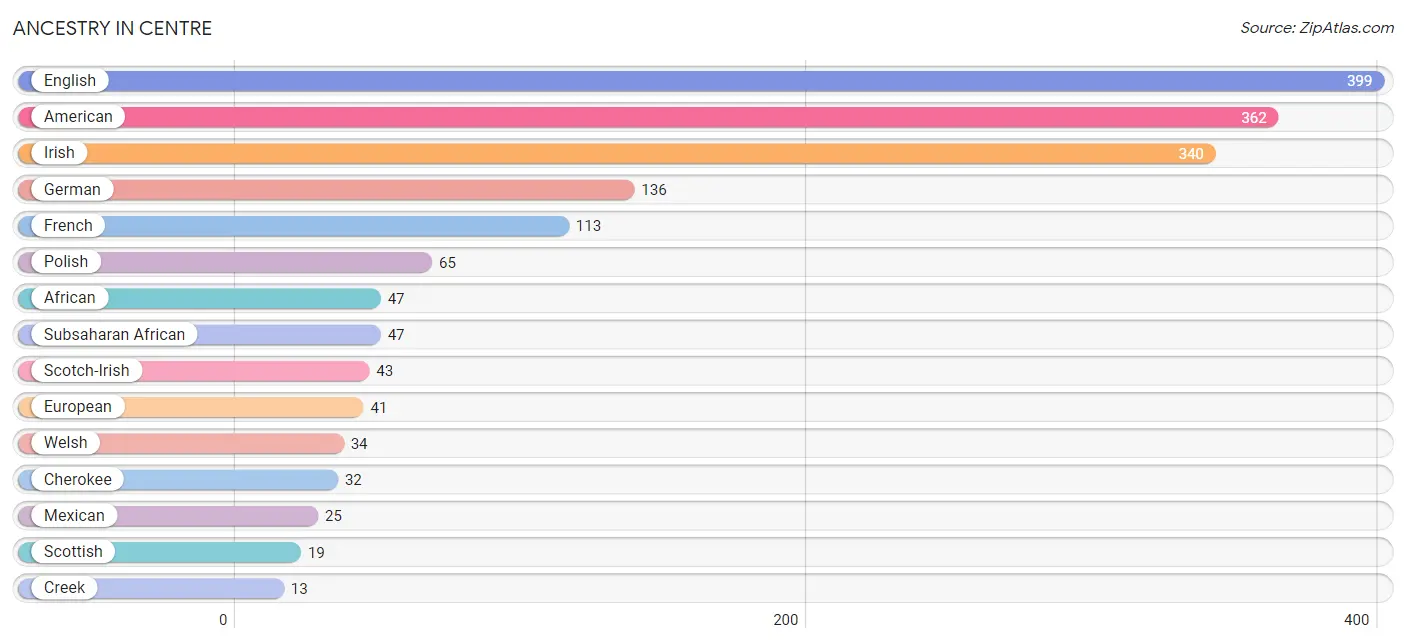
| Ancestry | # Population | % Population |
| African | 47 | 1.3% |
| American | 362 | 10.0% |
| Cherokee | 32 | 0.9% |
| Creek | 13 | 0.4% |
| English | 399 | 11.1% |
| European | 41 | 1.1% |
| French | 113 | 3.1% |
| German | 136 | 3.8% |
| Irish | 340 | 9.4% |
| Italian | 6 | 0.2% |
| Mexican | 25 | 0.7% |
| Native Hawaiian | 13 | 0.4% |
| Polish | 65 | 1.8% |
| Scotch-Irish | 43 | 1.2% |
| Scottish | 19 | 0.5% |
| Subsaharan African | 47 | 1.3% |
| Welsh | 34 | 0.9% | View All 17 Rows |
Immigrants in Centre
The most numerous immigrant groups reported in Centre came from Central America (12 | 0.3%), Latin America (12 | 0.3%), and Mexico (12 | 0.3%), together accounting for 1.0% of all Centre residents.
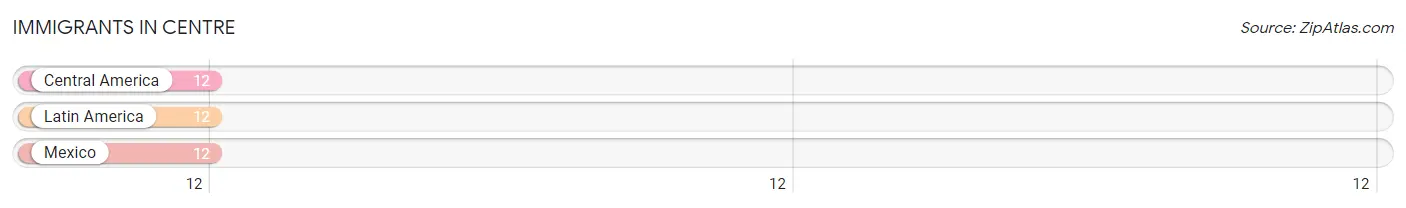
| Immigration Origin | # Population | % Population |
| Central America | 12 | 0.3% |
| Latin America | 12 | 0.3% |
| Mexico | 12 | 0.3% | View All 3 Rows |
Sex and Age in Centre
Sex and Age in Centre
The most populous age groups in Centre are 55 to 59 Years (165 | 10.8%) for men and 85 Years and over (323 | 15.5%) for women.
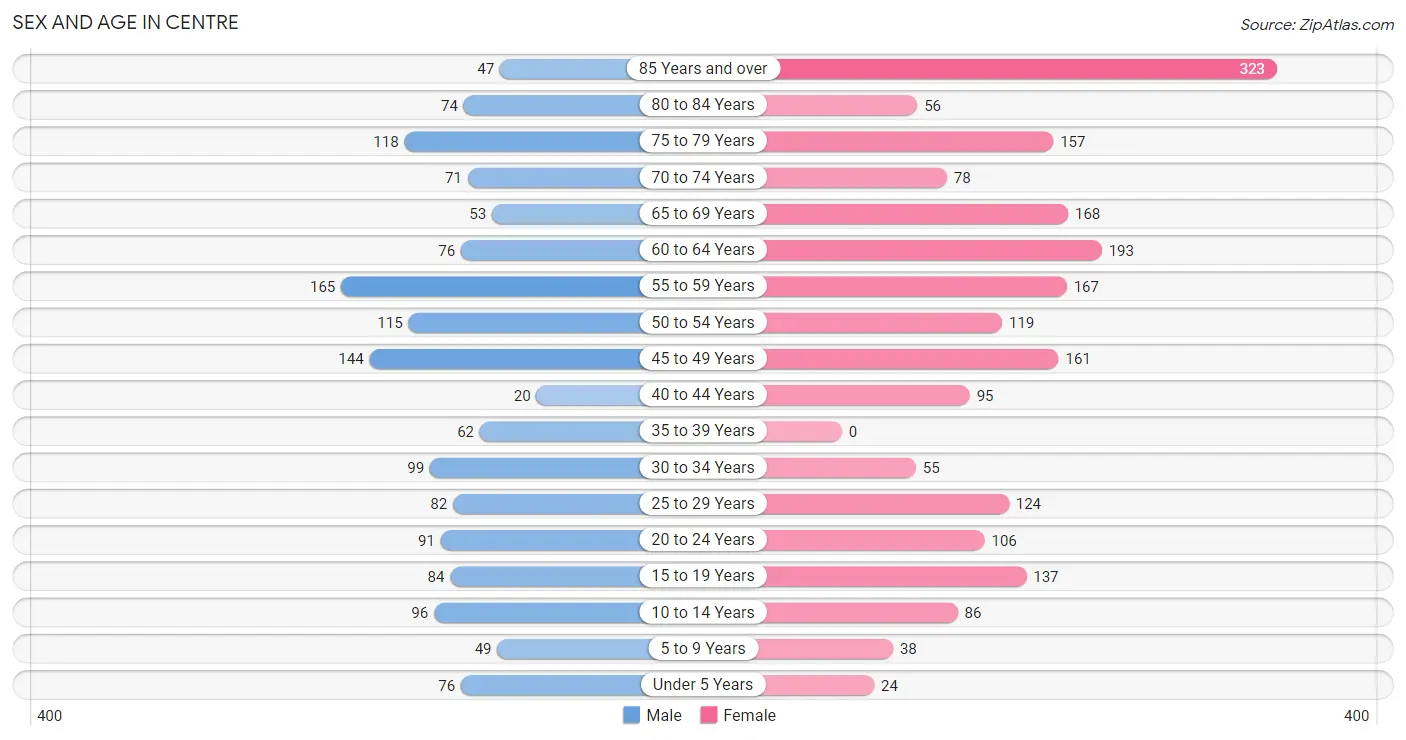
| Age Bracket | Male | Female |
| Under 5 Years | 76 (5.0%) | 24 (1.1%) |
| 5 to 9 Years | 49 (3.2%) | 38 (1.8%) |
| 10 to 14 Years | 96 (6.3%) | 86 (4.1%) |
| 15 to 19 Years | 84 (5.5%) | 137 (6.6%) |
| 20 to 24 Years | 91 (6.0%) | 106 (5.1%) |
| 25 to 29 Years | 82 (5.4%) | 124 (5.9%) |
| 30 to 34 Years | 99 (6.5%) | 55 (2.6%) |
| 35 to 39 Years | 62 (4.1%) | 0 (0.0%) |
| 40 to 44 Years | 20 (1.3%) | 95 (4.5%) |
| 45 to 49 Years | 144 (9.5%) | 161 (7.7%) |
| 50 to 54 Years | 115 (7.6%) | 119 (5.7%) |
| 55 to 59 Years | 165 (10.8%) | 167 (8.0%) |
| 60 to 64 Years | 76 (5.0%) | 193 (9.2%) |
| 65 to 69 Years | 53 (3.5%) | 168 (8.1%) |
| 70 to 74 Years | 71 (4.7%) | 78 (3.7%) |
| 75 to 79 Years | 118 (7.7%) | 157 (7.5%) |
| 80 to 84 Years | 74 (4.9%) | 56 (2.7%) |
| 85 Years and over | 47 (3.1%) | 323 (15.5%) |
| Total | 1,522 (100.0%) | 2,087 (100.0%) |
Families and Households in Centre
Median Family Size in Centre
The median family size in Centre is 2.83 persons per family, with married-couple families (539 | 60.0%) accounting for the largest median family size of 2.99 persons per family. On the other hand, single male/father families (79 | 8.8%) represent the smallest median family size with 2.54 persons per family.
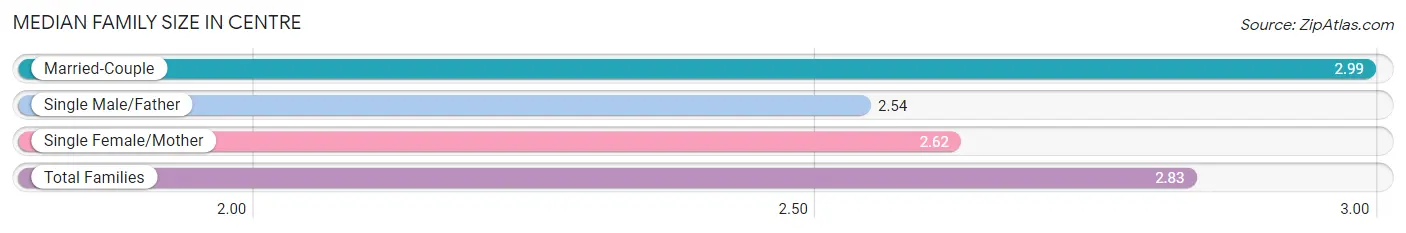
| Family Type | # Families | Family Size |
| Married-Couple | 539 (60.0%) | 2.99 |
| Single Male/Father | 79 (8.8%) | 2.54 |
| Single Female/Mother | 280 (31.2%) | 2.62 |
| Total Families | 898 (100.0%) | 2.83 |
Median Household Size in Centre
The median household size in Centre is 2.20 persons per household, with single male/father households (79 | 5.2%) accounting for the largest median household size of 3.04 persons per household. non-family households (607 | 40.3%) represent the smallest median household size with 1.18 persons per household.
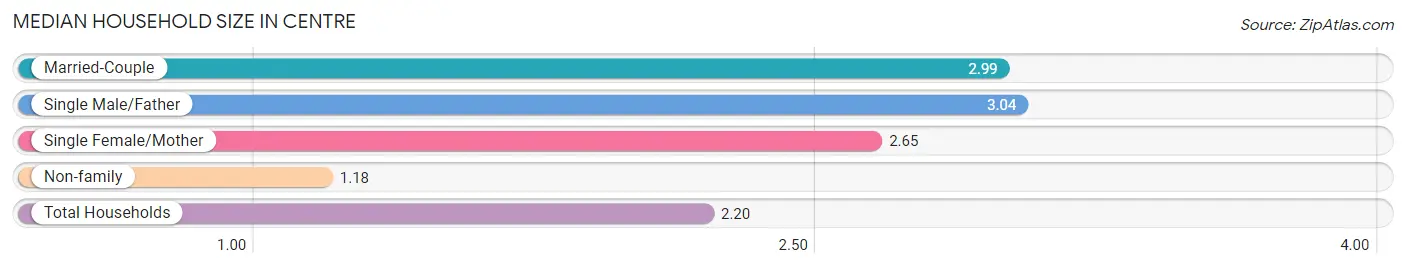
| Household Type | # Households | Household Size |
| Married-Couple | 539 (35.8%) | 2.99 |
| Single Male/Father | 79 (5.2%) | 3.04 |
| Single Female/Mother | 280 (18.6%) | 2.65 |
| Non-family | 607 (40.3%) | 1.18 |
| Total Households | 1,505 (100.0%) | 2.20 |
Household Size by Marriage Status in Centre
Out of a total of 1,505 households in Centre, 898 (59.7%) are family households, while 607 (40.3%) are nonfamily households. The most numerous type of family households are 2-person households, comprising 593, and the most common type of nonfamily households are 1-person households, comprising 536.
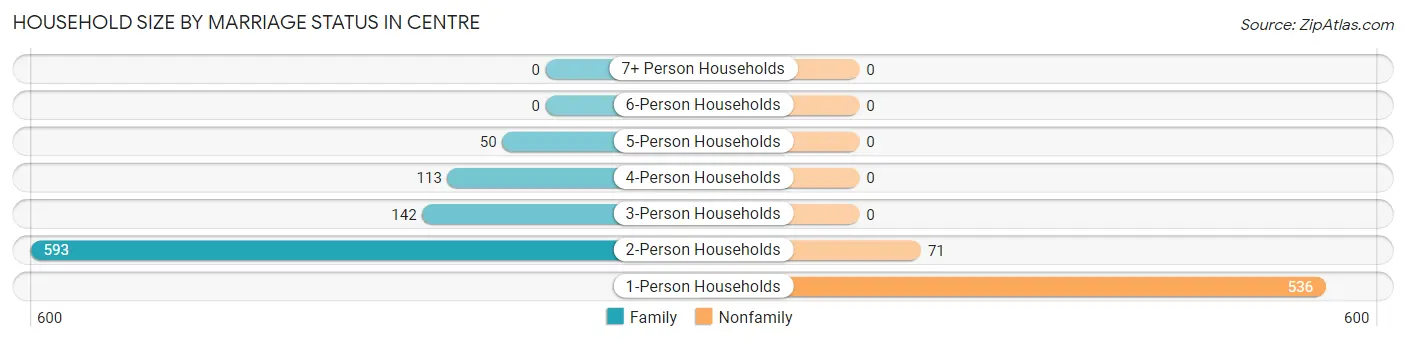
| Household Size | Family Households | Nonfamily Households |
| 1-Person Households | - | 536 (35.6%) |
| 2-Person Households | 593 (39.4%) | 71 (4.7%) |
| 3-Person Households | 142 (9.4%) | 0 (0.0%) |
| 4-Person Households | 113 (7.5%) | 0 (0.0%) |
| 5-Person Households | 50 (3.3%) | 0 (0.0%) |
| 6-Person Households | 0 (0.0%) | 0 (0.0%) |
| 7+ Person Households | 0 (0.0%) | 0 (0.0%) |
| Total | 898 (59.7%) | 607 (40.3%) |
Female Fertility in Centre
Fertility by Age in Centre
Average fertility rate in Centre is 17.0 births per 1,000 women. Women in the age bracket of 20 to 34 years have the highest fertility rate with 42.0 births per 1,000 women. Women in the age bracket of 20 to 34 years acount for 100.0% of all women with births.
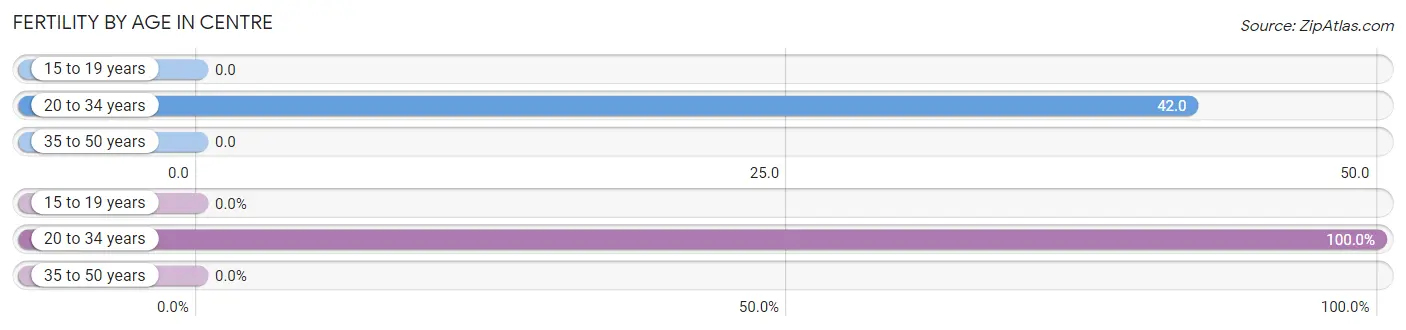
| Age Bracket | Women with Births | Births / 1,000 Women |
| 15 to 19 years | 0 (0.0%) | 0.0 |
| 20 to 34 years | 12 (100.0%) | 42.0 |
| 35 to 50 years | 0 (0.0%) | 0.0 |
| Total | 12 (100.0%) | 17.0 |
Fertility by Age by Marriage Status in Centre
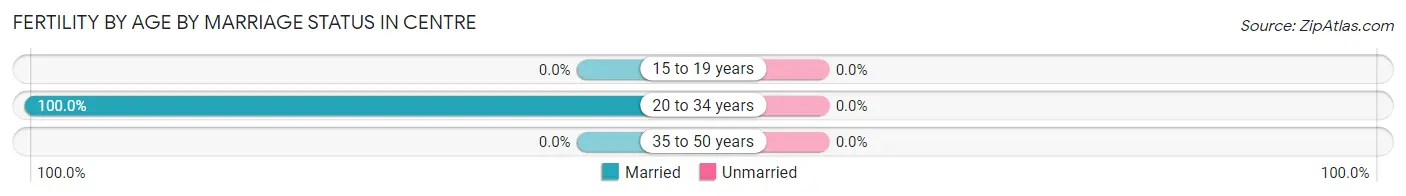
| Age Bracket | Married | Unmarried |
| 15 to 19 years | 0 (0.0%) | 0 (0.0%) |
| 20 to 34 years | 12 (100.0%) | 0 (0.0%) |
| 35 to 50 years | 0 (0.0%) | 0 (0.0%) |
| Total | 12 (100.0%) | 0 (0.0%) |
Fertility by Education in Centre
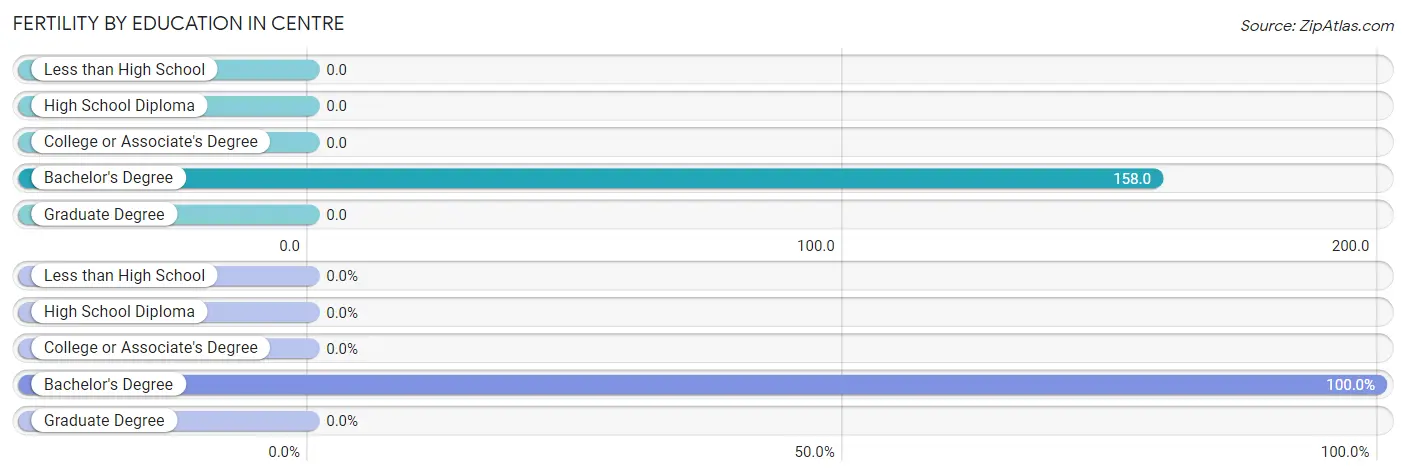
| Educational Attainment | Women with Births | Births / 1,000 Women |
| Less than High School | 0 (0.0%) | 0.0 |
| High School Diploma | 0 (0.0%) | 0.0 |
| College or Associate's Degree | 0 (0.0%) | 0.0 |
| Bachelor's Degree | 12 (100.0%) | 158.0 |
| Graduate Degree | 0 (0.0%) | 0.0 |
| Total | 12 (100.0%) | 17.0 |
Fertility by Education by Marriage Status in Centre
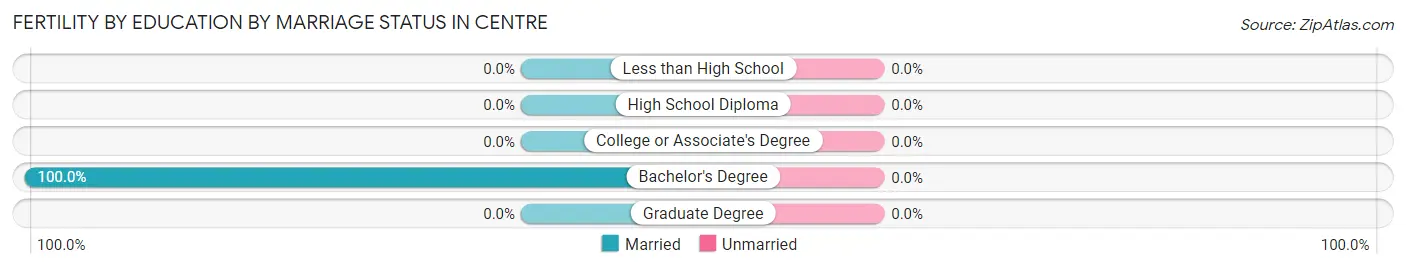
| Educational Attainment | Married | Unmarried |
| Less than High School | 0 (0.0%) | 0 (0.0%) |
| High School Diploma | 0 (0.0%) | 0 (0.0%) |
| College or Associate's Degree | 0 (0.0%) | 0 (0.0%) |
| Bachelor's Degree | 12 (100.0%) | 0 (0.0%) |
| Graduate Degree | 0 (0.0%) | 0 (0.0%) |
| Total | 12 (100.0%) | 0 (0.0%) |
Employment Characteristics in Centre
Employment by Class of Employer in Centre
Among the 1,277 employed individuals in Centre, private company employees (693 | 54.3%), state government employees (214 | 16.8%), and local government employees (122 | 9.6%) make up the most common classes of employment.
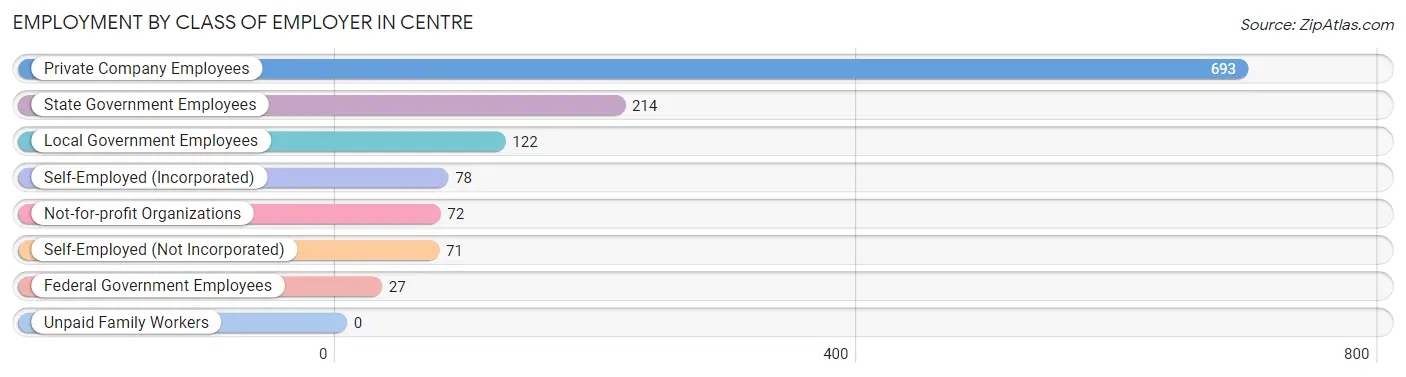
| Employer Class | # Employees | % Employees |
| Private Company Employees | 693 | 54.3% |
| Self-Employed (Incorporated) | 78 | 6.1% |
| Self-Employed (Not Incorporated) | 71 | 5.6% |
| Not-for-profit Organizations | 72 | 5.6% |
| Local Government Employees | 122 | 9.6% |
| State Government Employees | 214 | 16.8% |
| Federal Government Employees | 27 | 2.1% |
| Unpaid Family Workers | 0 | 0.0% |
| Total | 1,277 | 100.0% |
Employment Status by Age in Centre
According to the labor force statistics for Centre, out of the total population over 16 years of age (3,216), 43.3% or 1,393 individuals are in the labor force, with 7.5% or 104 of them unemployed. The age group with the highest labor force participation rate is 25 to 29 years, with 92.7% or 191 individuals in the labor force. Within the labor force, the 20 to 24 years age range has the highest percentage of unemployed individuals, with 63.3% or 50 of them being unemployed.
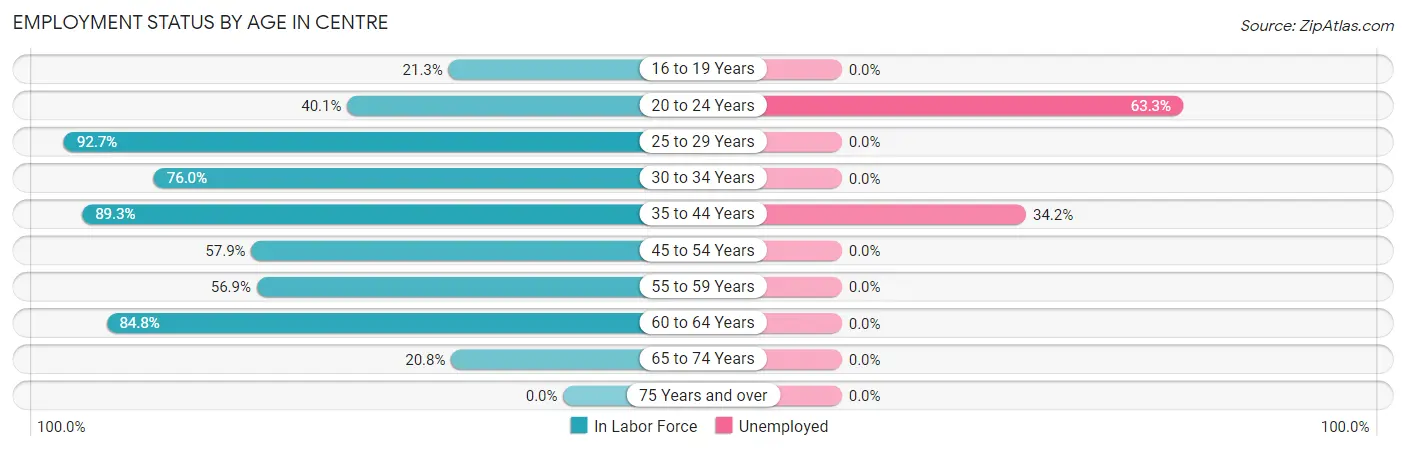
| Age Bracket | In Labor Force | Unemployed |
| 16 to 19 Years | 42 (21.3%) | 0 (0.0%) |
| 20 to 24 Years | 79 (40.1%) | 50 (63.3%) |
| 25 to 29 Years | 191 (92.7%) | 0 (0.0%) |
| 30 to 34 Years | 117 (76.0%) | 0 (0.0%) |
| 35 to 44 Years | 158 (89.3%) | 54 (34.2%) |
| 45 to 54 Years | 312 (57.9%) | 0 (0.0%) |
| 55 to 59 Years | 189 (56.9%) | 0 (0.0%) |
| 60 to 64 Years | 228 (84.8%) | 0 (0.0%) |
| 65 to 74 Years | 77 (20.8%) | 0 (0.0%) |
| 75 Years and over | 0 (0.0%) | 0 (0.0%) |
| Total | 1,393 (43.3%) | 104 (7.5%) |
Employment Status by Educational Attainment in Centre
According to labor force statistics for Centre, 71.3% of individuals (1,196) out of the total population between 25 and 64 years of age (1,677) are in the labor force, with 4.5% or 54 of them being unemployed. The group with the highest labor force participation rate are those with the educational attainment of college / associate degree, with 82.7% or 582 individuals in the labor force. Within the labor force, individuals with less than high school education have the highest percentage of unemployment, with 18.3% or 40 of them being unemployed.
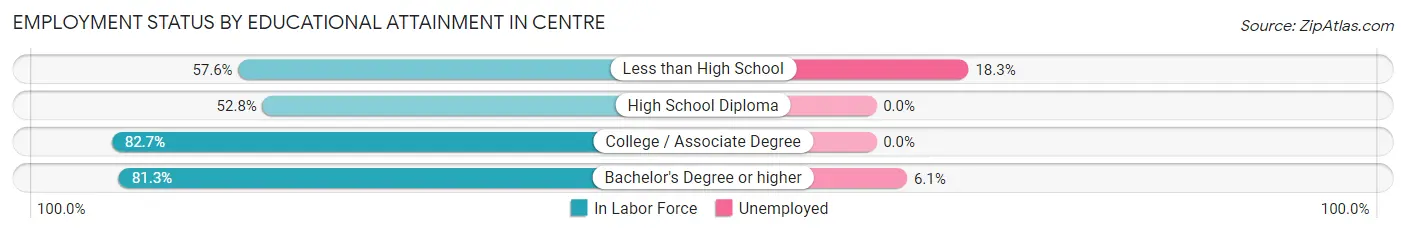
| Educational Attainment | In Labor Force | Unemployed |
| Less than High School | 219 (57.6%) | 70 (18.3%) |
| High School Diploma | 163 (52.8%) | 0 (0.0%) |
| College / Associate Degree | 582 (82.7%) | 0 (0.0%) |
| Bachelor's Degree or higher | 231 (81.3%) | 17 (6.1%) |
| Total | 1,196 (71.3%) | 75 (4.5%) |
Employment Occupations by Sex in Centre
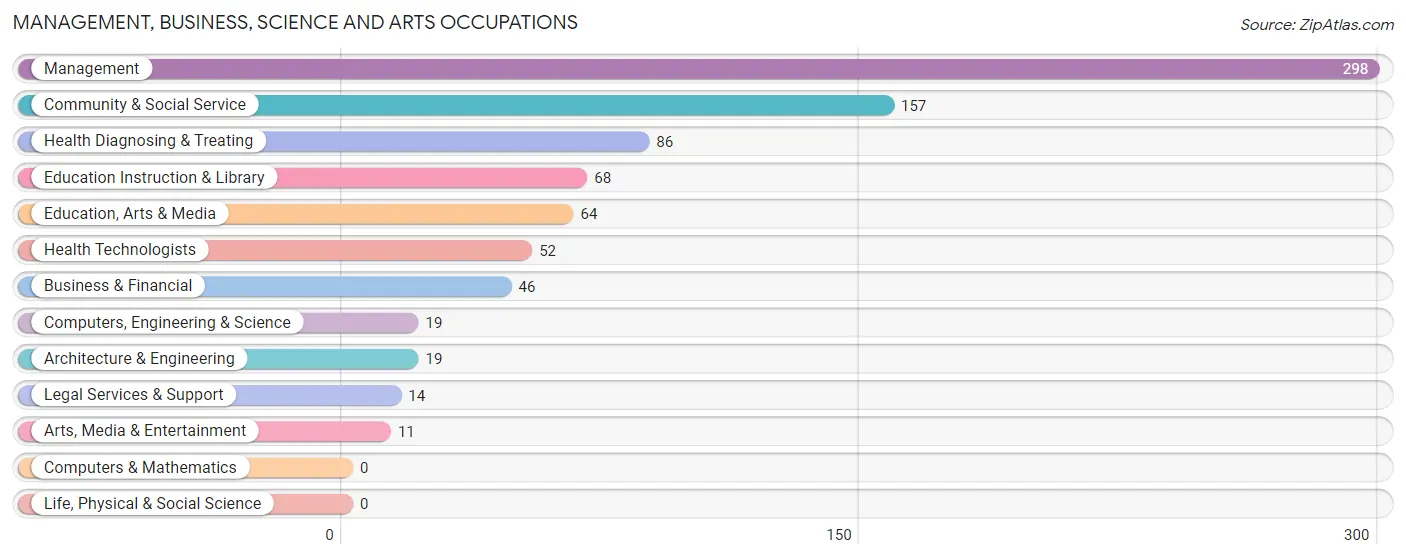
Management, Business, Science and Arts Occupations
The most common Management, Business, Science and Arts occupations in Centre are Management (298 | 23.1%), Community & Social Service (157 | 12.2%), Health Diagnosing & Treating (86 | 6.7%), Education Instruction & Library (68 | 5.3%), and Education, Arts & Media (64 | 5.0%).
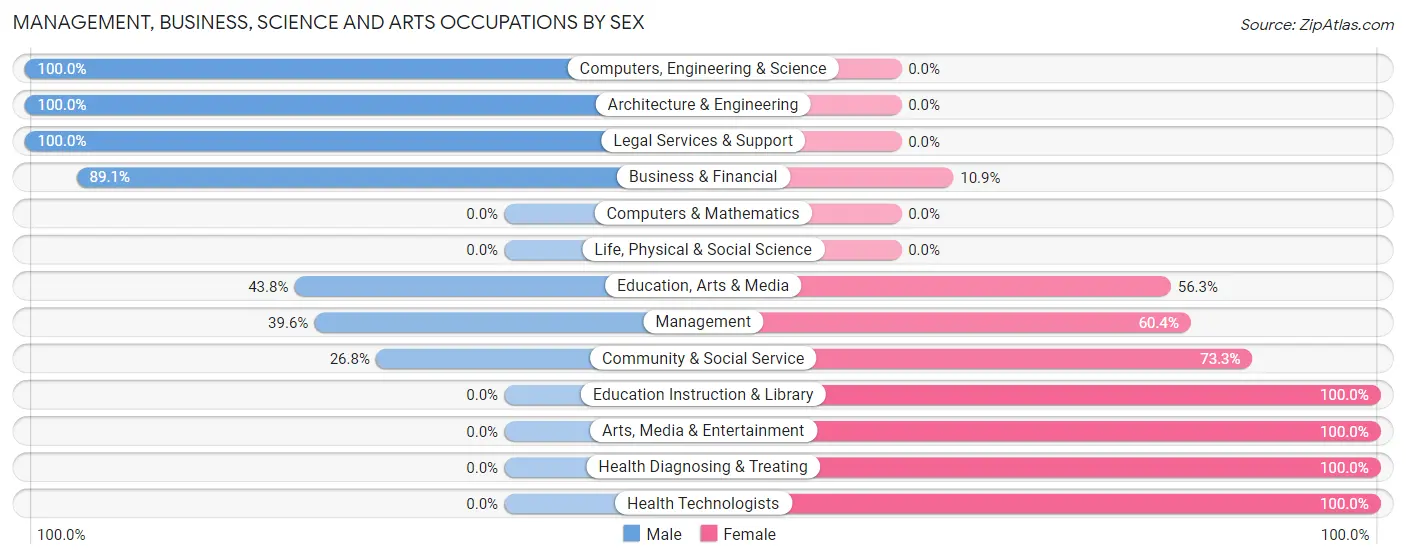
Management, Business, Science and Arts Occupations by Sex
Within the Management, Business, Science and Arts occupations in Centre, the most male-oriented occupations are Computers, Engineering & Science (100.0%), Architecture & Engineering (100.0%), and Legal Services & Support (100.0%), while the most female-oriented occupations are Education Instruction & Library (100.0%), Arts, Media & Entertainment (100.0%), and Health Diagnosing & Treating (100.0%).
| Occupation | Male | Female |
| Management | 118 (39.6%) | 180 (60.4%) |
| Business & Financial | 41 (89.1%) | 5 (10.9%) |
| Computers, Engineering & Science | 19 (100.0%) | 0 (0.0%) |
| Computers & Mathematics | 0 (0.0%) | 0 (0.0%) |
| Architecture & Engineering | 19 (100.0%) | 0 (0.0%) |
| Life, Physical & Social Science | 0 (0.0%) | 0 (0.0%) |
| Community & Social Service | 42 (26.8%) | 115 (73.3%) |
| Education, Arts & Media | 28 (43.8%) | 36 (56.2%) |
| Legal Services & Support | 14 (100.0%) | 0 (0.0%) |
| Education Instruction & Library | 0 (0.0%) | 68 (100.0%) |
| Arts, Media & Entertainment | 0 (0.0%) | 11 (100.0%) |
| Health Diagnosing & Treating | 0 (0.0%) | 86 (100.0%) |
| Health Technologists | 0 (0.0%) | 52 (100.0%) |
| Total (Category) | 220 (36.3%) | 386 (63.7%) |
| Total (Overall) | 605 (46.9%) | 684 (53.1%) |
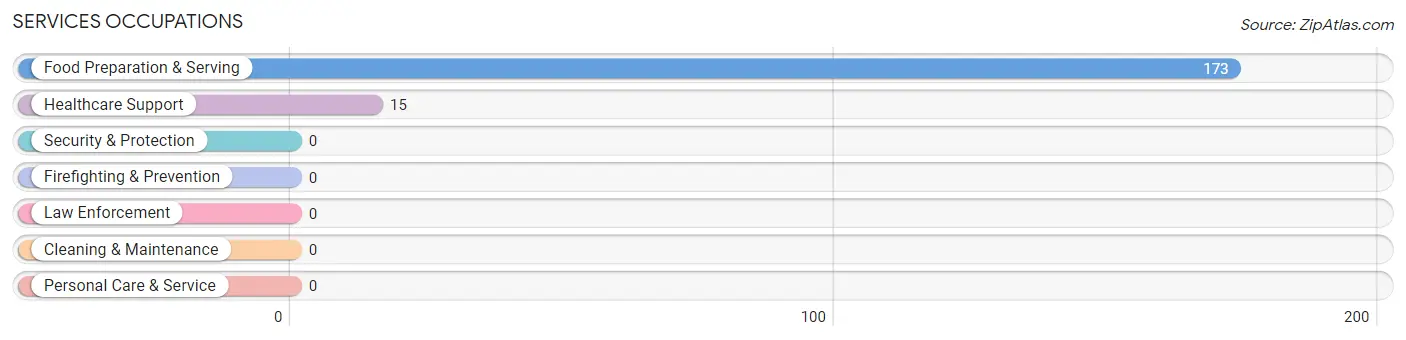
Services Occupations
The most common Services occupations in Centre are Food Preparation & Serving (173 | 13.4%), and Healthcare Support (15 | 1.2%).
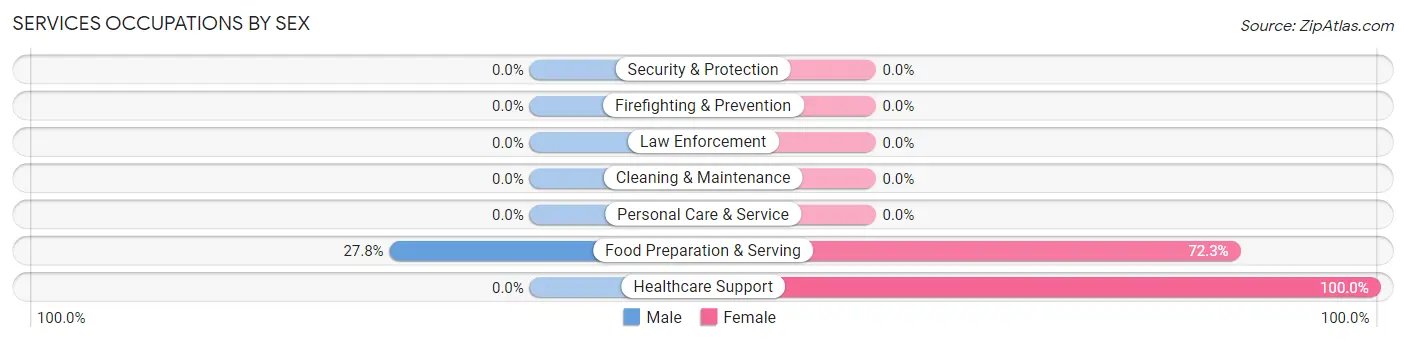
Services Occupations by Sex
| Occupation | Male | Female |
| Healthcare Support | 0 (0.0%) | 15 (100.0%) |
| Security & Protection | 0 (0.0%) | 0 (0.0%) |
| Firefighting & Prevention | 0 (0.0%) | 0 (0.0%) |
| Law Enforcement | 0 (0.0%) | 0 (0.0%) |
| Food Preparation & Serving | 48 (27.8%) | 125 (72.3%) |
| Cleaning & Maintenance | 0 (0.0%) | 0 (0.0%) |
| Personal Care & Service | 0 (0.0%) | 0 (0.0%) |
| Total (Category) | 48 (25.5%) | 140 (74.5%) |
| Total (Overall) | 605 (46.9%) | 684 (53.1%) |
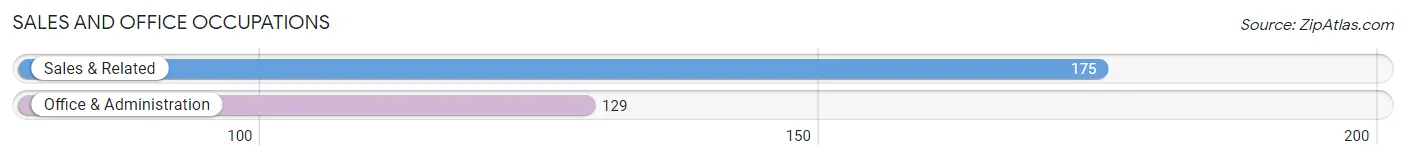
Sales and Office Occupations
The most common Sales and Office occupations in Centre are Sales & Related (175 | 13.6%), and Office & Administration (129 | 10.0%).
Sales and Office Occupations by Sex
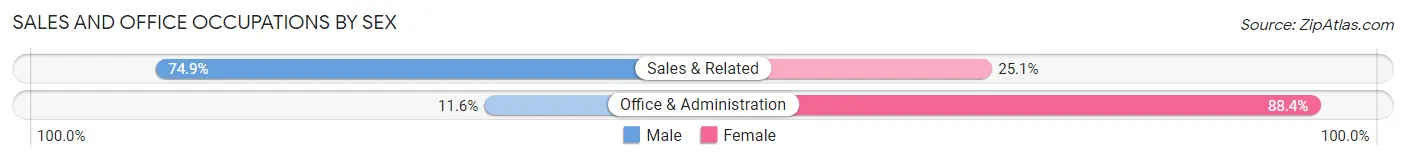
| Occupation | Male | Female |
| Sales & Related | 131 (74.9%) | 44 (25.1%) |
| Office & Administration | 15 (11.6%) | 114 (88.4%) |
| Total (Category) | 146 (48.0%) | 158 (52.0%) |
| Total (Overall) | 605 (46.9%) | 684 (53.1%) |
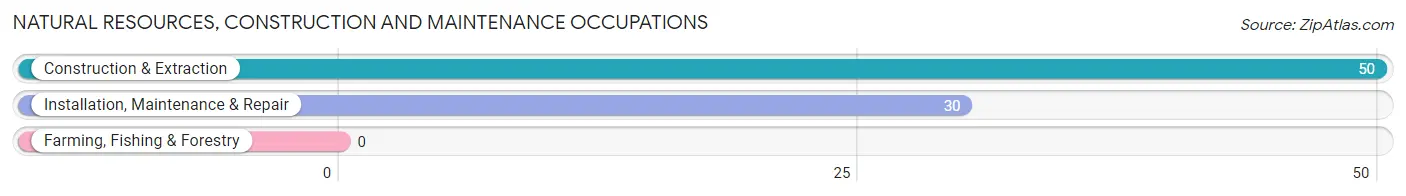
Natural Resources, Construction and Maintenance Occupations
The most common Natural Resources, Construction and Maintenance occupations in Centre are Construction & Extraction (50 | 3.9%), and Installation, Maintenance & Repair (30 | 2.3%).
Natural Resources, Construction and Maintenance Occupations by Sex
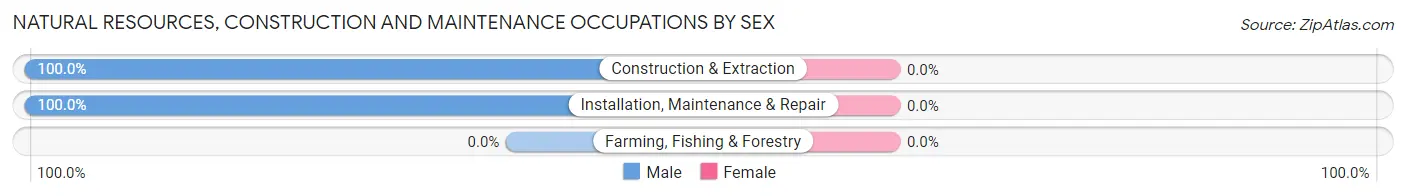
| Occupation | Male | Female |
| Farming, Fishing & Forestry | 0 (0.0%) | 0 (0.0%) |
| Construction & Extraction | 50 (100.0%) | 0 (0.0%) |
| Installation, Maintenance & Repair | 30 (100.0%) | 0 (0.0%) |
| Total (Category) | 80 (100.0%) | 0 (0.0%) |
| Total (Overall) | 605 (46.9%) | 684 (53.1%) |
Production, Transportation and Moving Occupations
The most common Production, Transportation and Moving occupations in Centre are Production (59 | 4.6%), and Material Moving (52 | 4.0%).
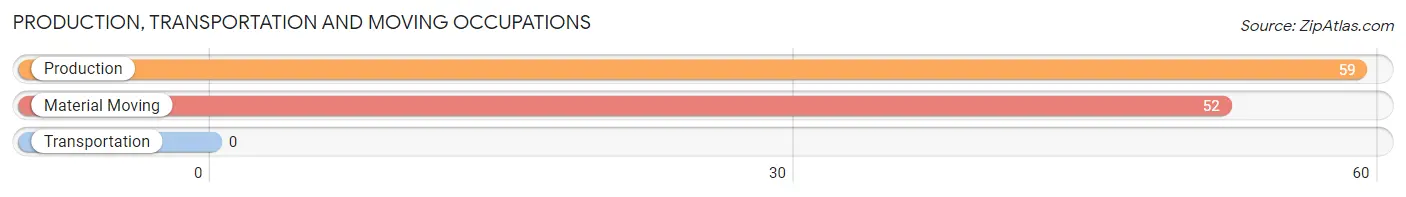
Production, Transportation and Moving Occupations by Sex
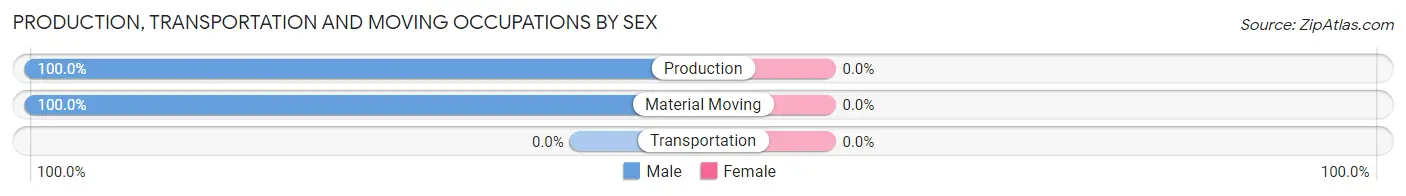
| Occupation | Male | Female |
| Production | 59 (100.0%) | 0 (0.0%) |
| Transportation | 0 (0.0%) | 0 (0.0%) |
| Material Moving | 52 (100.0%) | 0 (0.0%) |
| Total (Category) | 111 (100.0%) | 0 (0.0%) |
| Total (Overall) | 605 (46.9%) | 684 (53.1%) |
Employment Industries by Sex in Centre
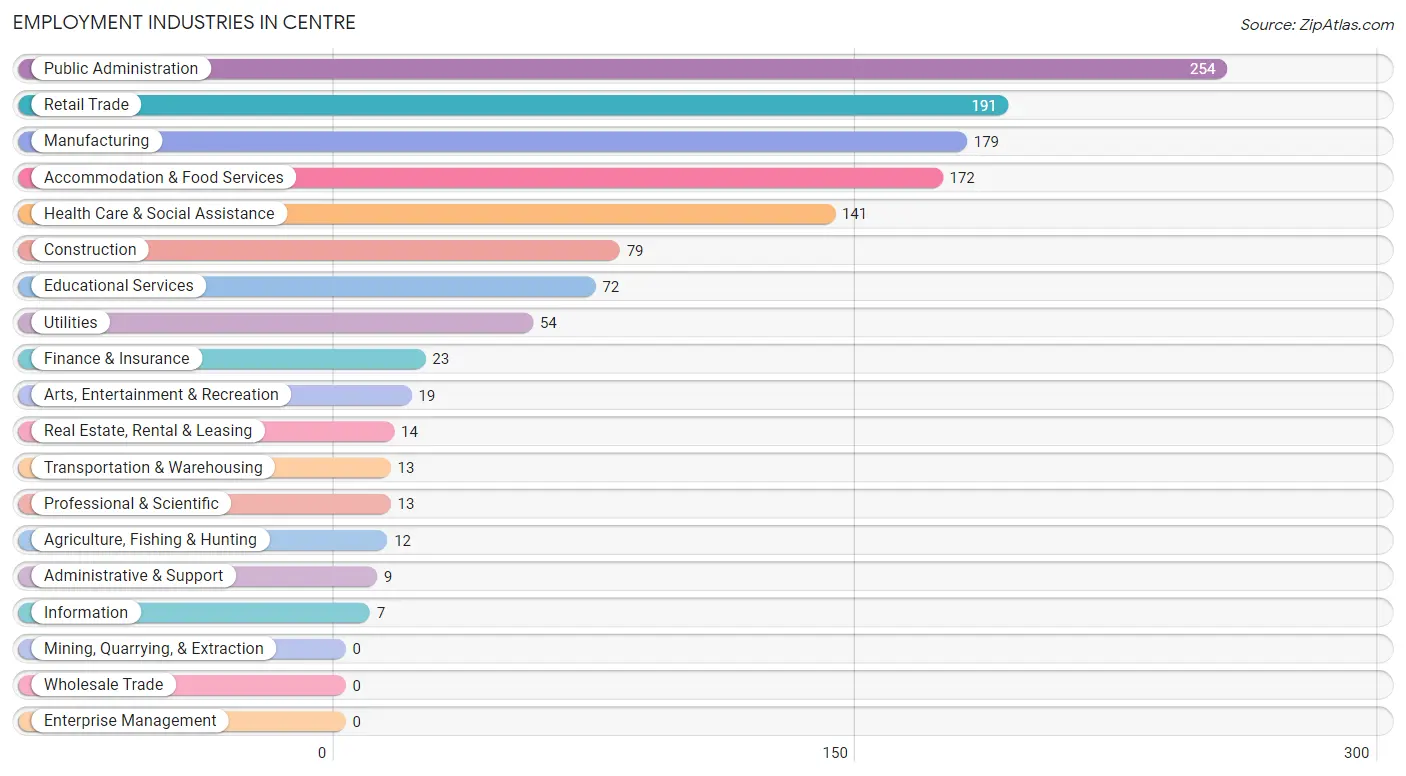
Employment Industries in Centre
The major employment industries in Centre include Public Administration (254 | 19.7%), Retail Trade (191 | 14.8%), Manufacturing (179 | 13.9%), Accommodation & Food Services (172 | 13.3%), and Health Care & Social Assistance (141 | 10.9%).
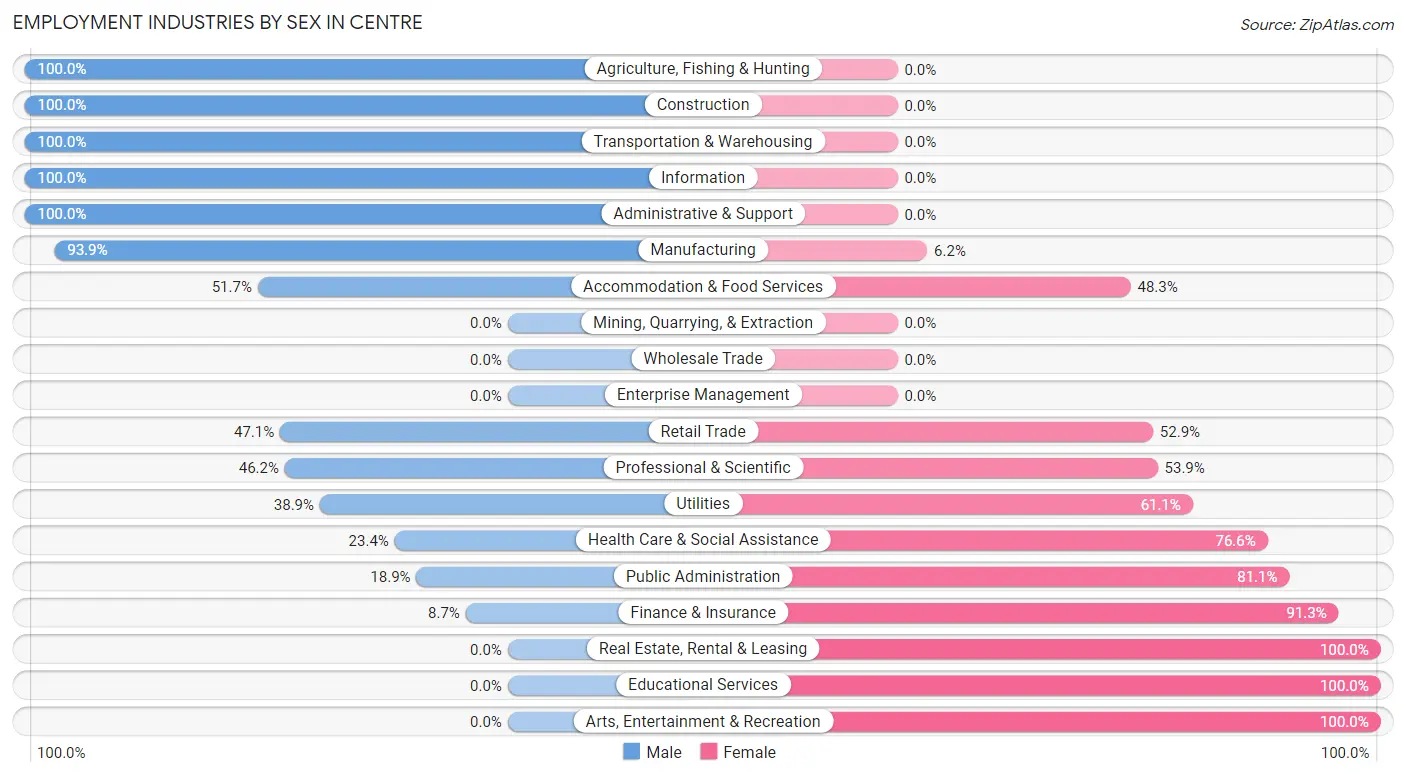
Employment Industries by Sex in Centre
The Centre industries that see more men than women are Agriculture, Fishing & Hunting (100.0%), Construction (100.0%), and Transportation & Warehousing (100.0%), whereas the industries that tend to have a higher number of women are Real Estate, Rental & Leasing (100.0%), Educational Services (100.0%), and Arts, Entertainment & Recreation (100.0%).
| Industry | Male | Female |
| Agriculture, Fishing & Hunting | 12 (100.0%) | 0 (0.0%) |
| Mining, Quarrying, & Extraction | 0 (0.0%) | 0 (0.0%) |
| Construction | 79 (100.0%) | 0 (0.0%) |
| Manufacturing | 168 (93.9%) | 11 (6.1%) |
| Wholesale Trade | 0 (0.0%) | 0 (0.0%) |
| Retail Trade | 90 (47.1%) | 101 (52.9%) |
| Transportation & Warehousing | 13 (100.0%) | 0 (0.0%) |
| Utilities | 21 (38.9%) | 33 (61.1%) |
| Information | 7 (100.0%) | 0 (0.0%) |
| Finance & Insurance | 2 (8.7%) | 21 (91.3%) |
| Real Estate, Rental & Leasing | 0 (0.0%) | 14 (100.0%) |
| Professional & Scientific | 6 (46.2%) | 7 (53.8%) |
| Enterprise Management | 0 (0.0%) | 0 (0.0%) |
| Administrative & Support | 9 (100.0%) | 0 (0.0%) |
| Educational Services | 0 (0.0%) | 72 (100.0%) |
| Health Care & Social Assistance | 33 (23.4%) | 108 (76.6%) |
| Arts, Entertainment & Recreation | 0 (0.0%) | 19 (100.0%) |
| Accommodation & Food Services | 89 (51.7%) | 83 (48.3%) |
| Public Administration | 48 (18.9%) | 206 (81.1%) |
| Total | 605 (46.9%) | 684 (53.1%) |
Education in Centre
School Enrollment in Centre
The most common levels of schooling among the 583 students in Centre are college / undergraduate (226 | 38.8%), high school (147 | 25.2%), and middle school (94 | 16.1%).
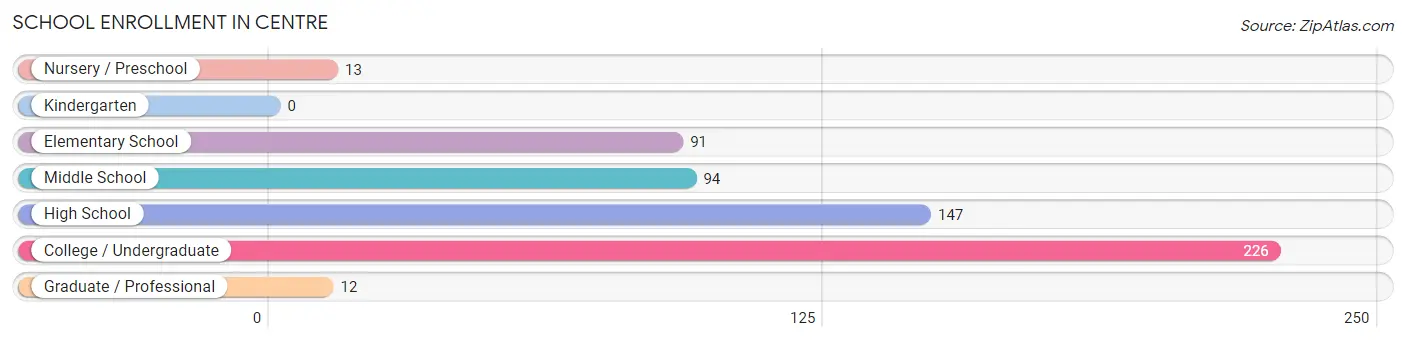
| School Level | # Students | % Students |
| Nursery / Preschool | 13 | 2.2% |
| Kindergarten | 0 | 0.0% |
| Elementary School | 91 | 15.6% |
| Middle School | 94 | 16.1% |
| High School | 147 | 25.2% |
| College / Undergraduate | 226 | 38.8% |
| Graduate / Professional | 12 | 2.1% |
| Total | 583 | 100.0% |
School Enrollment by Age by Funding Source in Centre
Out of a total of 583 students who are enrolled in schools in Centre, 37 (6.3%) attend a private institution, while the remaining 546 (93.7%) are enrolled in public schools. The age group of 10 to 14 year olds has the highest likelihood of being enrolled in private schools, with 27 (18.2% in the age bracket) enrolled. Conversely, the age group of 3 to 4 year olds has the lowest likelihood of being enrolled in a private school, with 13 (100.0% in the age bracket) attending a public institution.
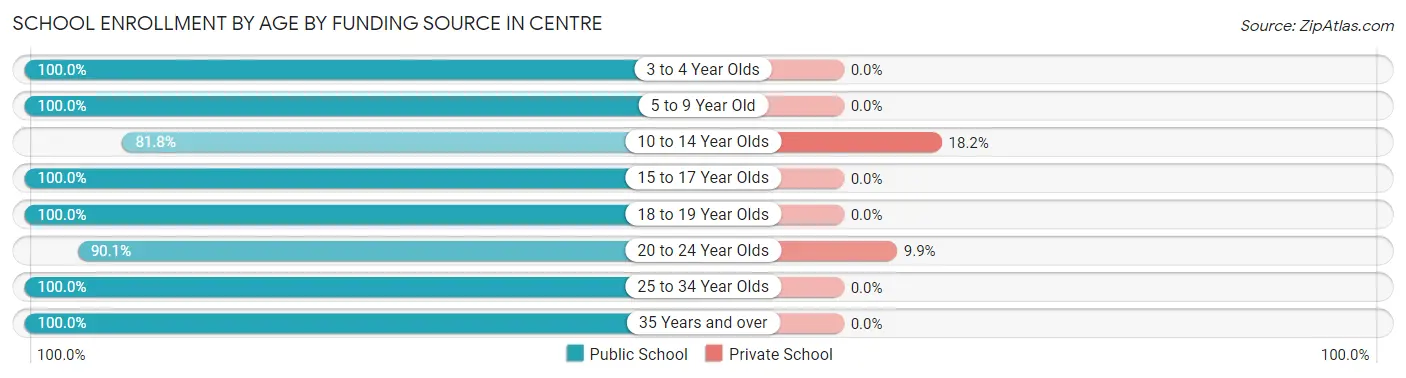
| Age Bracket | Public School | Private School |
| 3 to 4 Year Olds | 13 (100.0%) | 0 (0.0%) |
| 5 to 9 Year Old | 87 (100.0%) | 0 (0.0%) |
| 10 to 14 Year Olds | 121 (81.8%) | 27 (18.2%) |
| 15 to 17 Year Olds | 97 (100.0%) | 0 (0.0%) |
| 18 to 19 Year Olds | 83 (100.0%) | 0 (0.0%) |
| 20 to 24 Year Olds | 91 (90.1%) | 10 (9.9%) |
| 25 to 34 Year Olds | 36 (100.0%) | 0 (0.0%) |
| 35 Years and over | 18 (100.0%) | 0 (0.0%) |
| Total | 546 (93.7%) | 37 (6.3%) |
Educational Attainment by Field of Study in Centre
Education (76 | 17.6%), business (65 | 15.0%), arts & humanities (55 | 12.7%), science & technology (47 | 10.9%), and bio, nature & agricultural (45 | 10.4%) are the most common fields of study among 432 individuals in Centre who have obtained a bachelor's degree or higher.
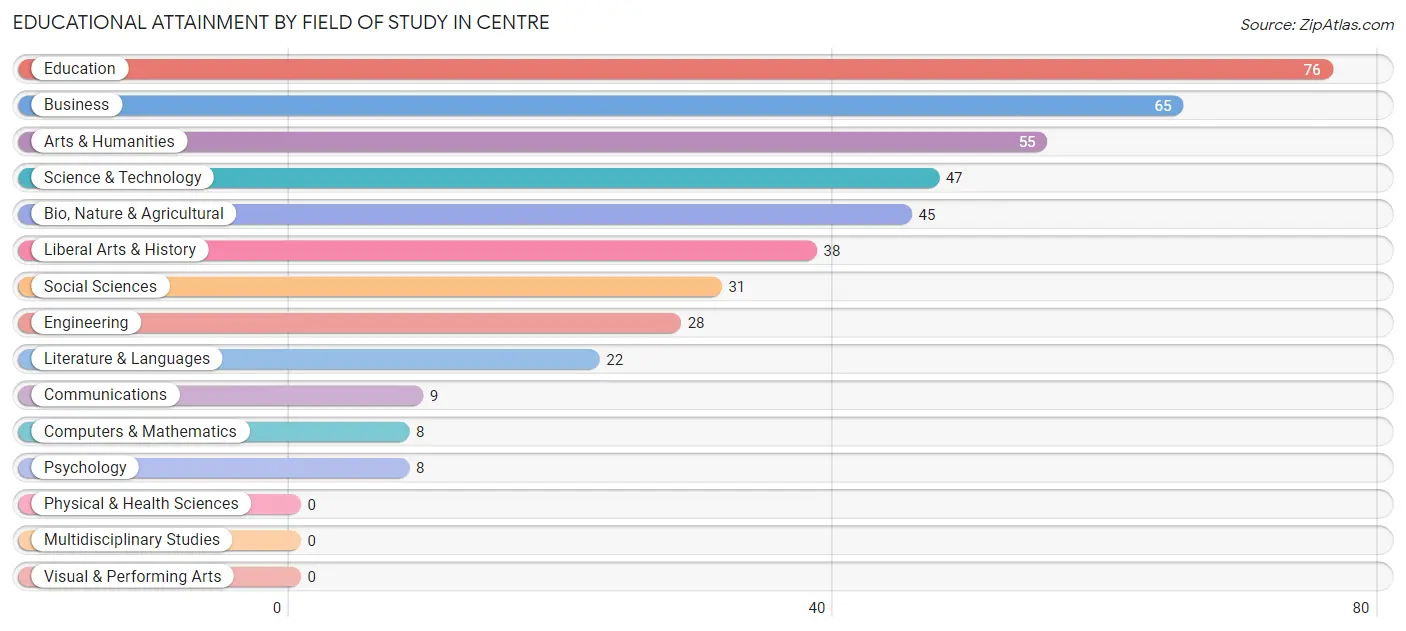
| Field of Study | # Graduates | % Graduates |
| Computers & Mathematics | 8 | 1.8% |
| Bio, Nature & Agricultural | 45 | 10.4% |
| Physical & Health Sciences | 0 | 0.0% |
| Psychology | 8 | 1.8% |
| Social Sciences | 31 | 7.2% |
| Engineering | 28 | 6.5% |
| Multidisciplinary Studies | 0 | 0.0% |
| Science & Technology | 47 | 10.9% |
| Business | 65 | 15.0% |
| Education | 76 | 17.6% |
| Literature & Languages | 22 | 5.1% |
| Liberal Arts & History | 38 | 8.8% |
| Visual & Performing Arts | 0 | 0.0% |
| Communications | 9 | 2.1% |
| Arts & Humanities | 55 | 12.7% |
| Total | 432 | 100.0% |
Transportation & Commute in Centre
Vehicle Availability by Sex in Centre
The most prevalent vehicle ownership categories in Centre are males with 2 vehicles (279, accounting for 46.1%) and females with 2 vehicles (193, making up 41.5%).
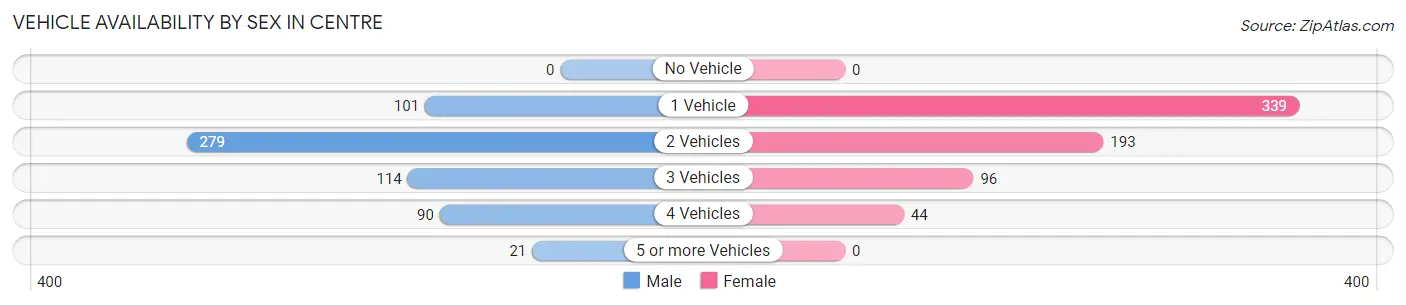
| Vehicles Available | Male | Female |
| No Vehicle | 0 (0.0%) | 0 (0.0%) |
| 1 Vehicle | 101 (16.7%) | 339 (50.4%) |
| 2 Vehicles | 279 (46.1%) | 193 (28.7%) |
| 3 Vehicles | 114 (18.8%) | 96 (14.3%) |
| 4 Vehicles | 90 (14.9%) | 44 (6.6%) |
| 5 or more Vehicles | 21 (3.5%) | 0 (0.0%) |
| Total | 605 (100.0%) | 672 (100.0%) |
Commute Time in Centre
The most frequently occuring commute durations in Centre are 10 to 14 minutes (345 commuters, 29.1%), 5 to 9 minutes (282 commuters, 23.8%), and 30 to 34 minutes (104 commuters, 8.8%).
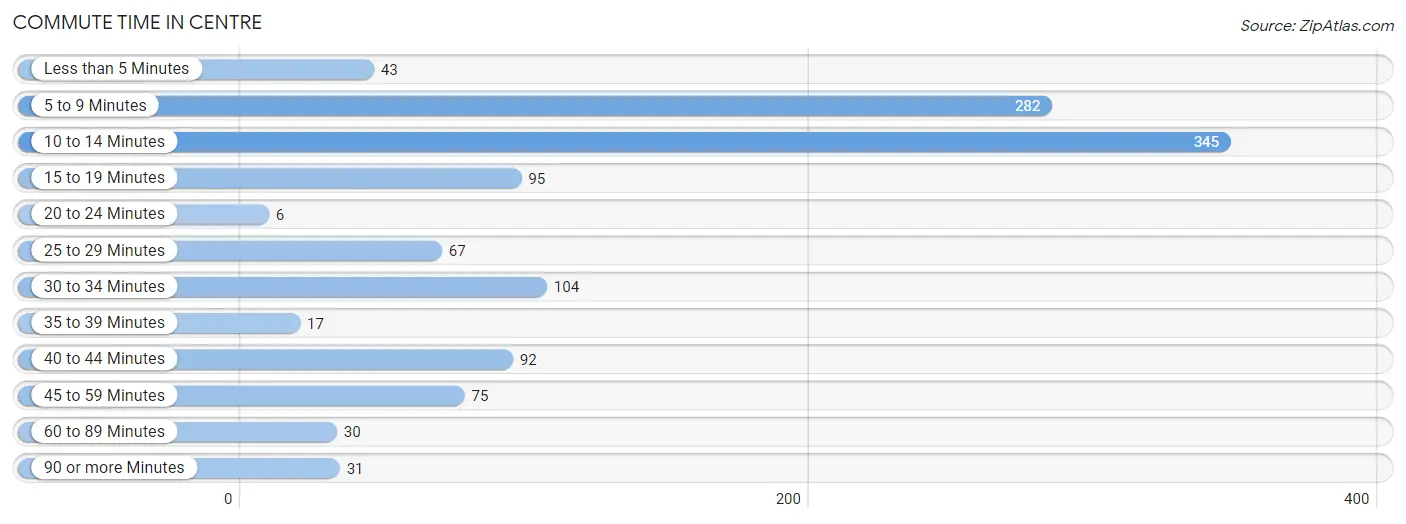
| Commute Time | # Commuters | % Commuters |
| Less than 5 Minutes | 43 | 3.6% |
| 5 to 9 Minutes | 282 | 23.8% |
| 10 to 14 Minutes | 345 | 29.1% |
| 15 to 19 Minutes | 95 | 8.0% |
| 20 to 24 Minutes | 6 | 0.5% |
| 25 to 29 Minutes | 67 | 5.6% |
| 30 to 34 Minutes | 104 | 8.8% |
| 35 to 39 Minutes | 17 | 1.4% |
| 40 to 44 Minutes | 92 | 7.7% |
| 45 to 59 Minutes | 75 | 6.3% |
| 60 to 89 Minutes | 30 | 2.5% |
| 90 or more Minutes | 31 | 2.6% |
Commute Time by Sex in Centre
The most common commute times in Centre are 5 to 9 minutes (149 commuters, 27.1%) for males and 10 to 14 minutes (243 commuters, 38.1%) for females.
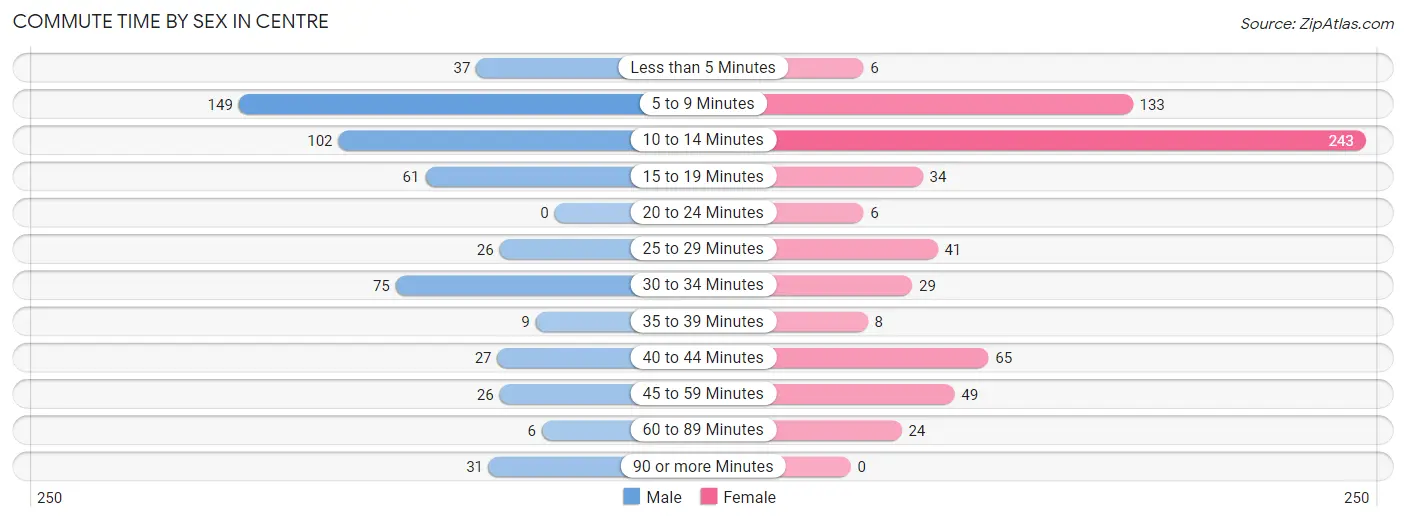
| Commute Time | Male | Female |
| Less than 5 Minutes | 37 (6.7%) | 6 (0.9%) |
| 5 to 9 Minutes | 149 (27.1%) | 133 (20.8%) |
| 10 to 14 Minutes | 102 (18.6%) | 243 (38.1%) |
| 15 to 19 Minutes | 61 (11.1%) | 34 (5.3%) |
| 20 to 24 Minutes | 0 (0.0%) | 6 (0.9%) |
| 25 to 29 Minutes | 26 (4.7%) | 41 (6.4%) |
| 30 to 34 Minutes | 75 (13.7%) | 29 (4.5%) |
| 35 to 39 Minutes | 9 (1.6%) | 8 (1.3%) |
| 40 to 44 Minutes | 27 (4.9%) | 65 (10.2%) |
| 45 to 59 Minutes | 26 (4.7%) | 49 (7.7%) |
| 60 to 89 Minutes | 6 (1.1%) | 24 (3.8%) |
| 90 or more Minutes | 31 (5.7%) | 0 (0.0%) |
Time of Departure to Work by Sex in Centre
The most frequent times of departure to work in Centre are 8:00 AM to 8:29 AM (127, 23.1%) for males and 9:00 AM to 9:59 AM (156, 24.4%) for females.
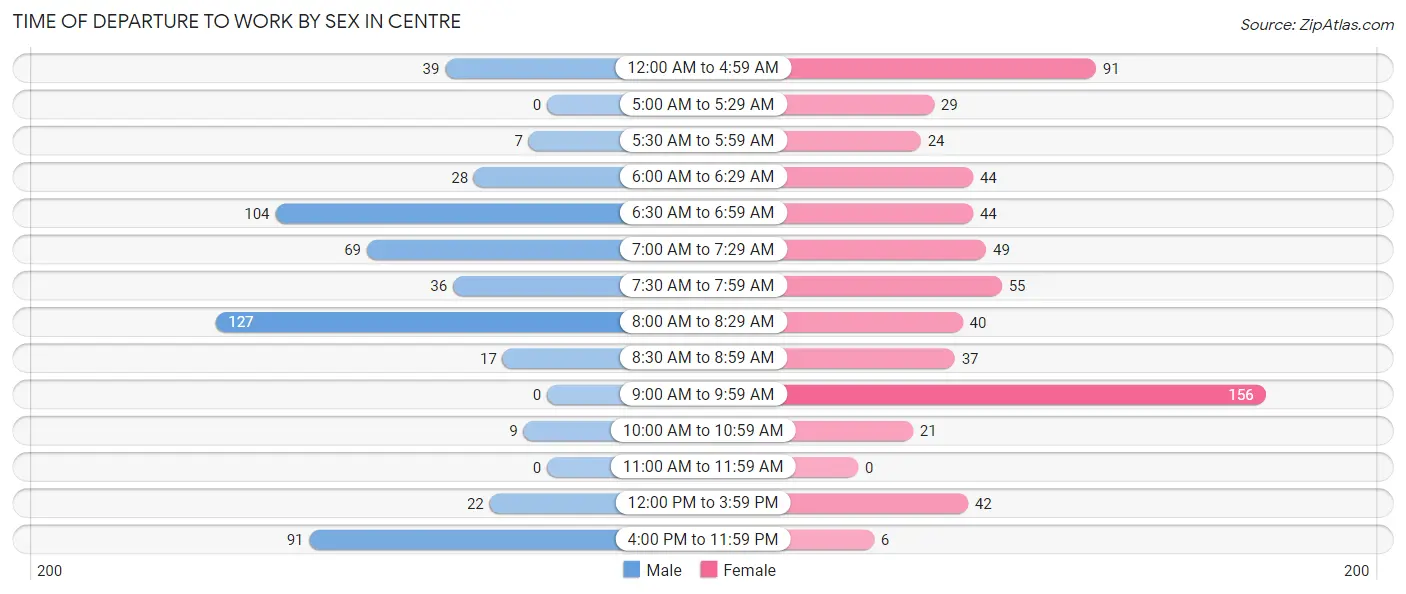
| Time of Departure | Male | Female |
| 12:00 AM to 4:59 AM | 39 (7.1%) | 91 (14.3%) |
| 5:00 AM to 5:29 AM | 0 (0.0%) | 29 (4.5%) |
| 5:30 AM to 5:59 AM | 7 (1.3%) | 24 (3.8%) |
| 6:00 AM to 6:29 AM | 28 (5.1%) | 44 (6.9%) |
| 6:30 AM to 6:59 AM | 104 (18.9%) | 44 (6.9%) |
| 7:00 AM to 7:29 AM | 69 (12.6%) | 49 (7.7%) |
| 7:30 AM to 7:59 AM | 36 (6.6%) | 55 (8.6%) |
| 8:00 AM to 8:29 AM | 127 (23.1%) | 40 (6.3%) |
| 8:30 AM to 8:59 AM | 17 (3.1%) | 37 (5.8%) |
| 9:00 AM to 9:59 AM | 0 (0.0%) | 156 (24.4%) |
| 10:00 AM to 10:59 AM | 9 (1.6%) | 21 (3.3%) |
| 11:00 AM to 11:59 AM | 0 (0.0%) | 0 (0.0%) |
| 12:00 PM to 3:59 PM | 22 (4.0%) | 42 (6.6%) |
| 4:00 PM to 11:59 PM | 91 (16.6%) | 6 (0.9%) |
| Total | 549 (100.0%) | 638 (100.0%) |
Housing Occupancy in Centre
Occupancy by Ownership in Centre
Of the total 1,505 dwellings in Centre, owner-occupied units account for 1,000 (66.4%), while renter-occupied units make up 505 (33.6%).
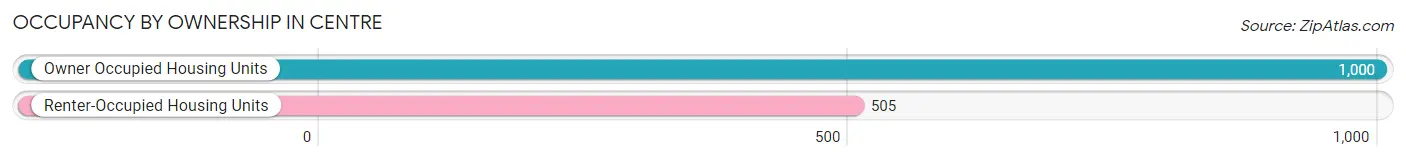
| Occupancy | # Housing Units | % Housing Units |
| Owner Occupied Housing Units | 1,000 | 66.4% |
| Renter-Occupied Housing Units | 505 | 33.6% |
| Total Occupied Housing Units | 1,505 | 100.0% |
Occupancy by Household Size in Centre
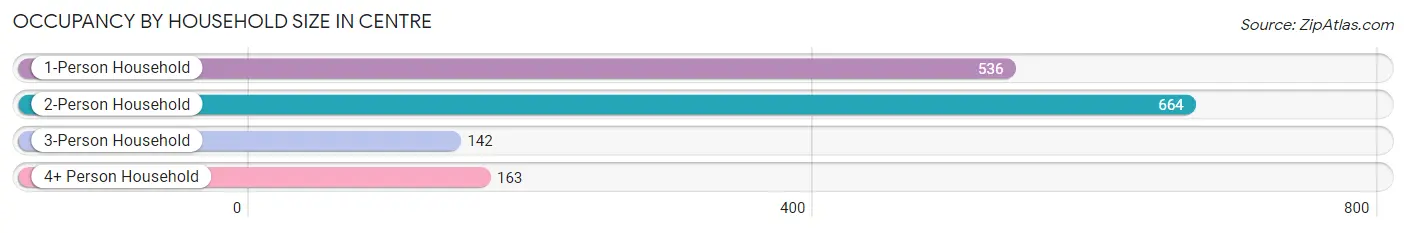
| Household Size | # Housing Units | % Housing Units |
| 1-Person Household | 536 | 35.6% |
| 2-Person Household | 664 | 44.1% |
| 3-Person Household | 142 | 9.4% |
| 4+ Person Household | 163 | 10.8% |
| Total Housing Units | 1,505 | 100.0% |
Occupancy by Ownership by Household Size in Centre
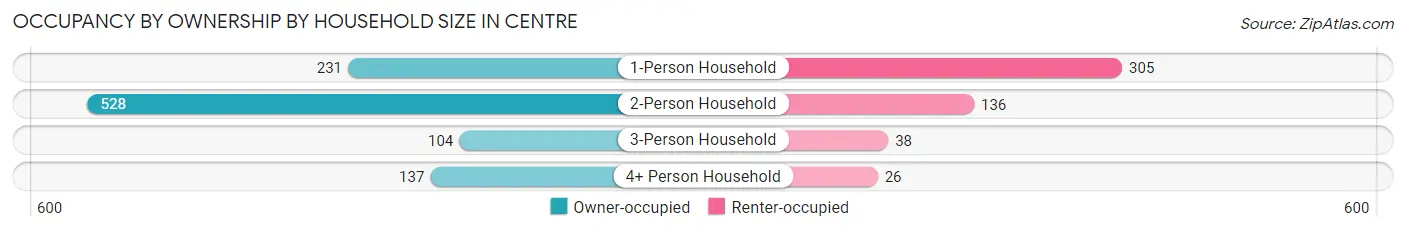
| Household Size | Owner-occupied | Renter-occupied |
| 1-Person Household | 231 (43.1%) | 305 (56.9%) |
| 2-Person Household | 528 (79.5%) | 136 (20.5%) |
| 3-Person Household | 104 (73.2%) | 38 (26.8%) |
| 4+ Person Household | 137 (84.1%) | 26 (16.0%) |
| Total Housing Units | 1,000 (66.4%) | 505 (33.6%) |
Occupancy by Educational Attainment in Centre
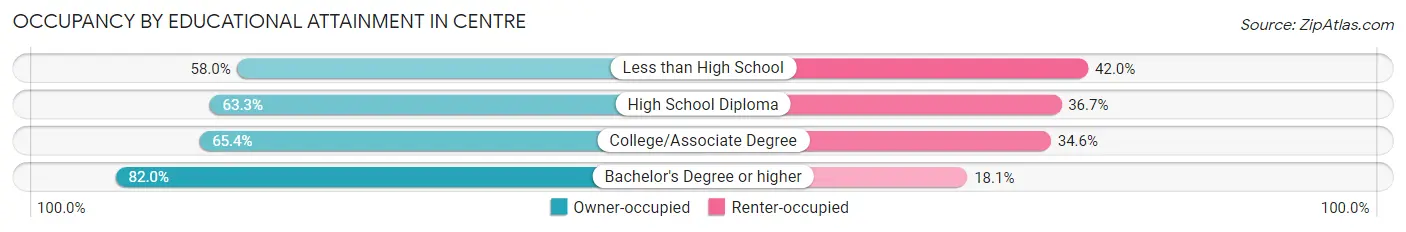
| Household Size | Owner-occupied | Renter-occupied |
| Less than High School | 189 (58.0%) | 137 (42.0%) |
| High School Diploma | 176 (63.3%) | 102 (36.7%) |
| College/Associate Degree | 408 (65.4%) | 216 (34.6%) |
| Bachelor's Degree or higher | 227 (82.0%) | 50 (18.0%) |
Occupancy by Age of Householder in Centre
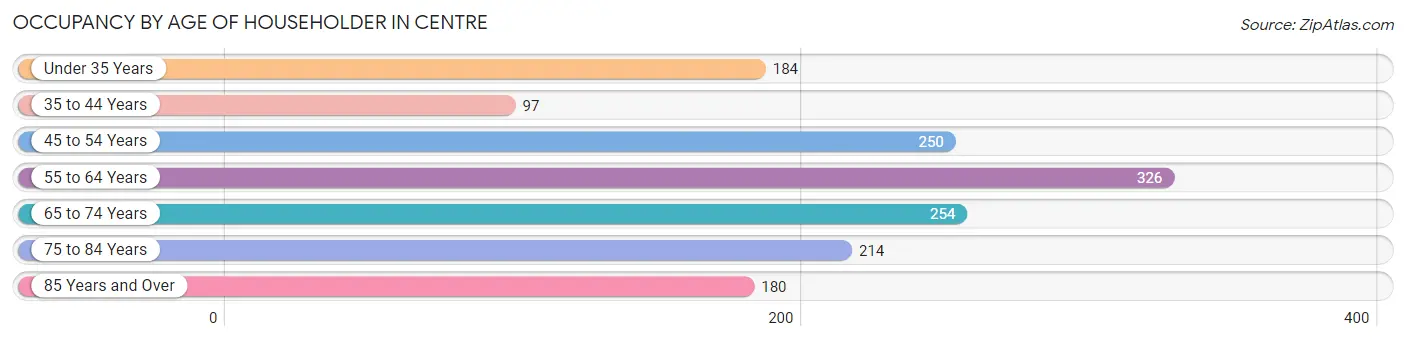
| Age Bracket | # Households | % Households |
| Under 35 Years | 184 | 12.2% |
| 35 to 44 Years | 97 | 6.5% |
| 45 to 54 Years | 250 | 16.6% |
| 55 to 64 Years | 326 | 21.7% |
| 65 to 74 Years | 254 | 16.9% |
| 75 to 84 Years | 214 | 14.2% |
| 85 Years and Over | 180 | 12.0% |
| Total | 1,505 | 100.0% |
Housing Finances in Centre
Median Income by Occupancy in Centre
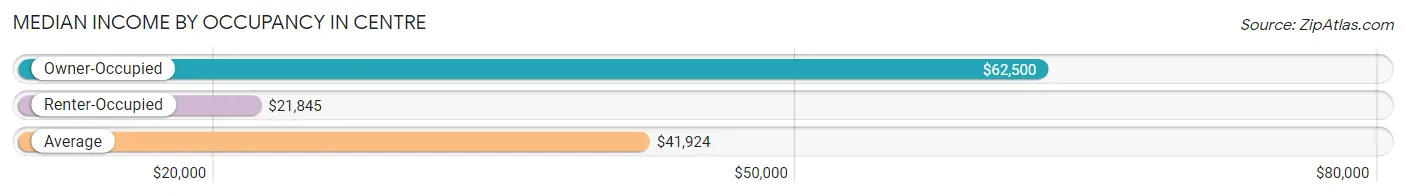
| Occupancy Type | # Households | Median Income |
| Owner-Occupied | 1,000 (66.4%) | $62,500 |
| Renter-Occupied | 505 (33.6%) | $21,845 |
| Average | 1,505 (100.0%) | $41,924 |
Occupancy by Householder Income Bracket in Centre
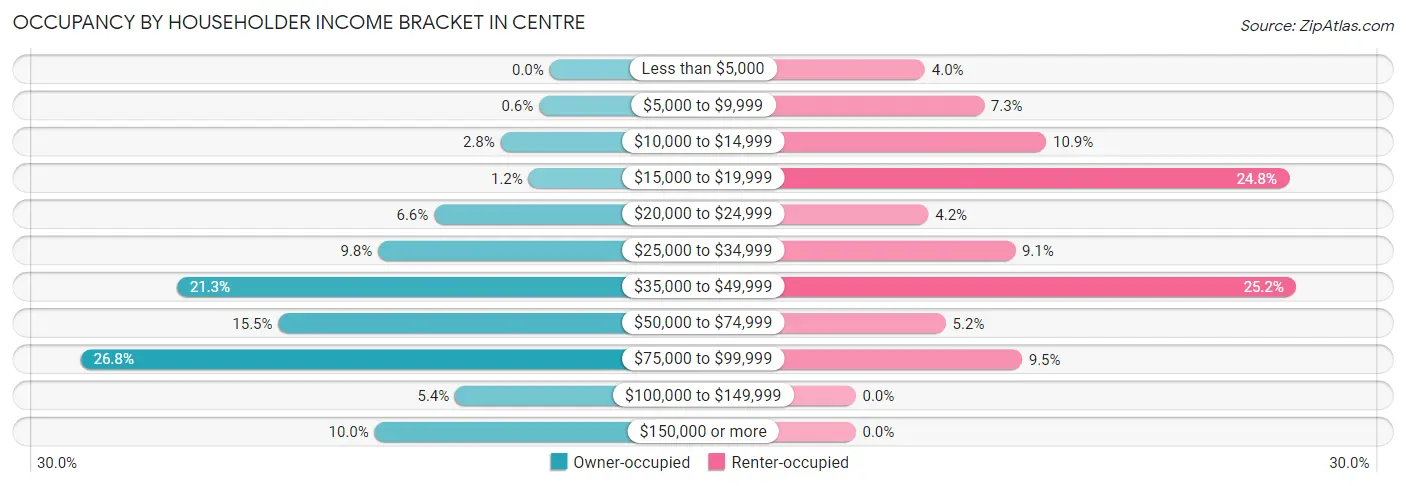
| Income Bracket | Owner-occupied | Renter-occupied |
| Less than $5,000 | 0 (0.0%) | 20 (4.0%) |
| $5,000 to $9,999 | 6 (0.6%) | 37 (7.3%) |
| $10,000 to $14,999 | 28 (2.8%) | 55 (10.9%) |
| $15,000 to $19,999 | 12 (1.2%) | 125 (24.7%) |
| $20,000 to $24,999 | 66 (6.6%) | 21 (4.2%) |
| $25,000 to $34,999 | 98 (9.8%) | 46 (9.1%) |
| $35,000 to $49,999 | 213 (21.3%) | 127 (25.2%) |
| $50,000 to $74,999 | 155 (15.5%) | 26 (5.1%) |
| $75,000 to $99,999 | 268 (26.8%) | 48 (9.5%) |
| $100,000 to $149,999 | 54 (5.4%) | 0 (0.0%) |
| $150,000 or more | 100 (10.0%) | 0 (0.0%) |
| Total | 1,000 (100.0%) | 505 (100.0%) |
Monthly Housing Cost Tiers in Centre
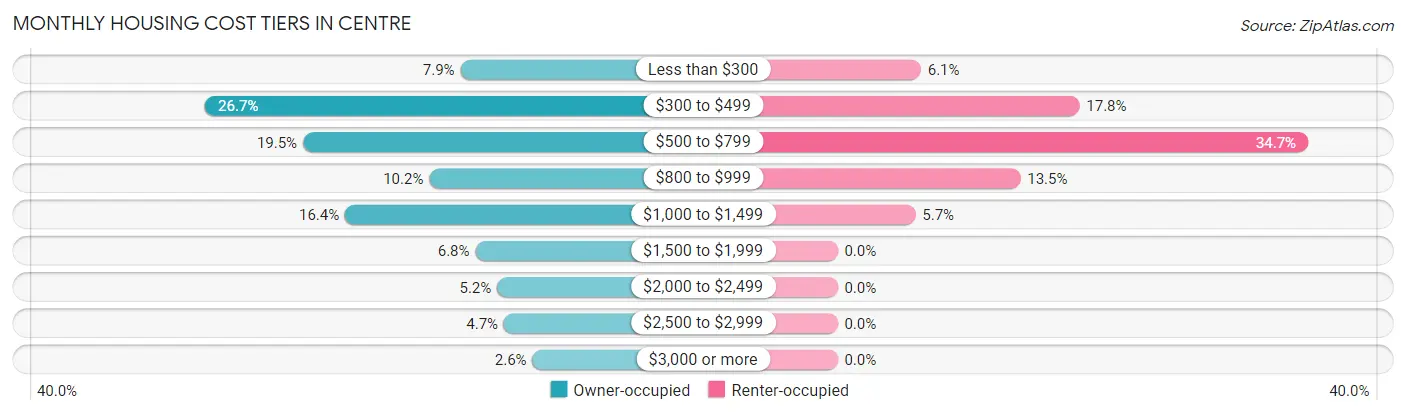
| Monthly Cost | Owner-occupied | Renter-occupied |
| Less than $300 | 79 (7.9%) | 31 (6.1%) |
| $300 to $499 | 267 (26.7%) | 90 (17.8%) |
| $500 to $799 | 195 (19.5%) | 175 (34.6%) |
| $800 to $999 | 102 (10.2%) | 68 (13.5%) |
| $1,000 to $1,499 | 164 (16.4%) | 29 (5.7%) |
| $1,500 to $1,999 | 68 (6.8%) | 0 (0.0%) |
| $2,000 to $2,499 | 52 (5.2%) | 0 (0.0%) |
| $2,500 to $2,999 | 47 (4.7%) | 0 (0.0%) |
| $3,000 or more | 26 (2.6%) | 0 (0.0%) |
| Total | 1,000 (100.0%) | 505 (100.0%) |
Physical Housing Characteristics in Centre
Housing Structures in Centre
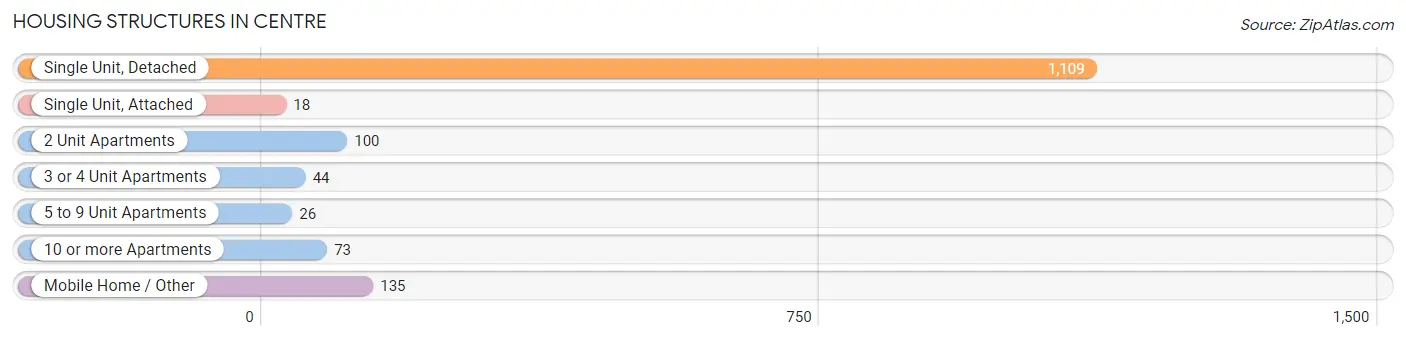
| Structure Type | # Housing Units | % Housing Units |
| Single Unit, Detached | 1,109 | 73.7% |
| Single Unit, Attached | 18 | 1.2% |
| 2 Unit Apartments | 100 | 6.6% |
| 3 or 4 Unit Apartments | 44 | 2.9% |
| 5 to 9 Unit Apartments | 26 | 1.7% |
| 10 or more Apartments | 73 | 4.9% |
| Mobile Home / Other | 135 | 9.0% |
| Total | 1,505 | 100.0% |
Housing Structures by Occupancy in Centre
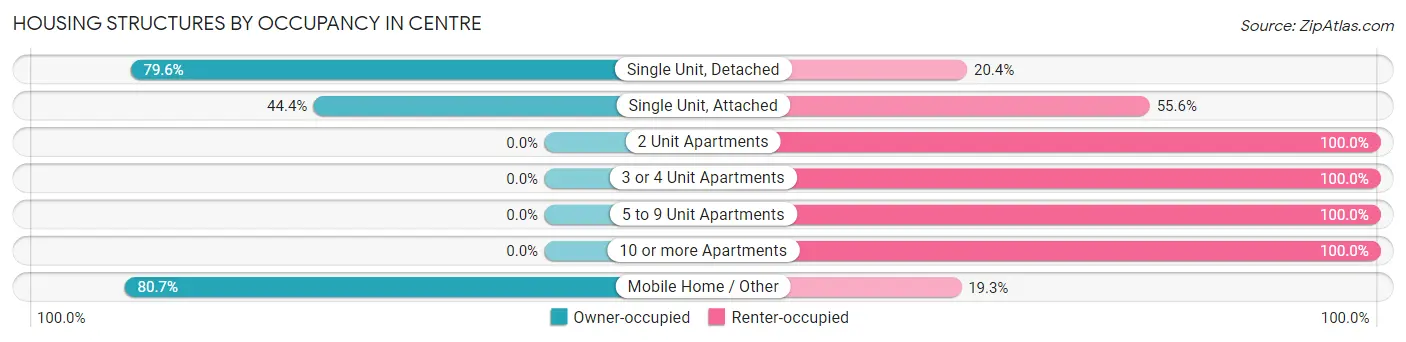
| Structure Type | Owner-occupied | Renter-occupied |
| Single Unit, Detached | 883 (79.6%) | 226 (20.4%) |
| Single Unit, Attached | 8 (44.4%) | 10 (55.6%) |
| 2 Unit Apartments | 0 (0.0%) | 100 (100.0%) |
| 3 or 4 Unit Apartments | 0 (0.0%) | 44 (100.0%) |
| 5 to 9 Unit Apartments | 0 (0.0%) | 26 (100.0%) |
| 10 or more Apartments | 0 (0.0%) | 73 (100.0%) |
| Mobile Home / Other | 109 (80.7%) | 26 (19.3%) |
| Total | 1,000 (66.4%) | 505 (33.6%) |
Housing Structures by Number of Rooms in Centre
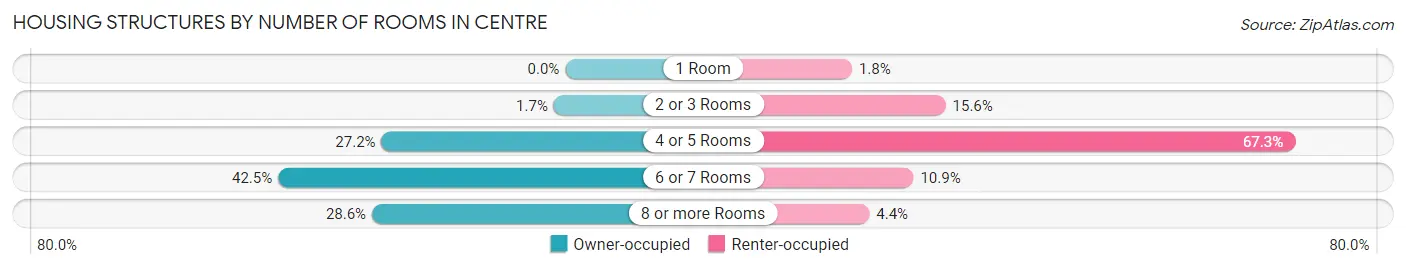
| Number of Rooms | Owner-occupied | Renter-occupied |
| 1 Room | 0 (0.0%) | 9 (1.8%) |
| 2 or 3 Rooms | 17 (1.7%) | 79 (15.6%) |
| 4 or 5 Rooms | 272 (27.2%) | 340 (67.3%) |
| 6 or 7 Rooms | 425 (42.5%) | 55 (10.9%) |
| 8 or more Rooms | 286 (28.6%) | 22 (4.4%) |
| Total | 1,000 (100.0%) | 505 (100.0%) |
Housing Structure by Heating Type in Centre
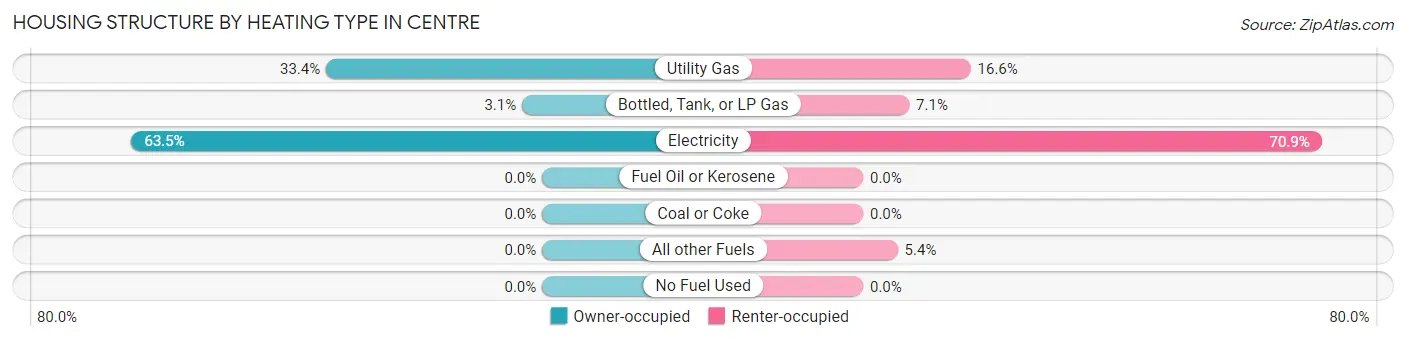
| Heating Type | Owner-occupied | Renter-occupied |
| Utility Gas | 334 (33.4%) | 84 (16.6%) |
| Bottled, Tank, or LP Gas | 31 (3.1%) | 36 (7.1%) |
| Electricity | 635 (63.5%) | 358 (70.9%) |
| Fuel Oil or Kerosene | 0 (0.0%) | 0 (0.0%) |
| Coal or Coke | 0 (0.0%) | 0 (0.0%) |
| All other Fuels | 0 (0.0%) | 27 (5.3%) |
| No Fuel Used | 0 (0.0%) | 0 (0.0%) |
| Total | 1,000 (100.0%) | 505 (100.0%) |
Household Vehicle Usage in Centre
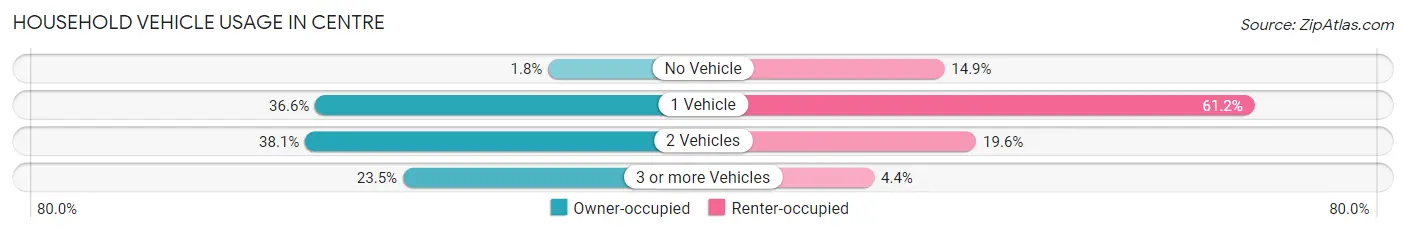
| Vehicles per Household | Owner-occupied | Renter-occupied |
| No Vehicle | 18 (1.8%) | 75 (14.8%) |
| 1 Vehicle | 366 (36.6%) | 309 (61.2%) |
| 2 Vehicles | 381 (38.1%) | 99 (19.6%) |
| 3 or more Vehicles | 235 (23.5%) | 22 (4.4%) |
| Total | 1,000 (100.0%) | 505 (100.0%) |
Real Estate & Mortgages in Centre
Real Estate and Mortgage Overview in Centre
| Characteristic | Without Mortgage | With Mortgage |
| Housing Units | 532 | 468 |
| Median Property Value | $160,800 | $195,200 |
| Median Household Income | $59,375 | $81 |
| Monthly Housing Costs | $447 | $26 |
| Real Estate Taxes | $702 | $77 |
Property Value by Mortgage Status in Centre
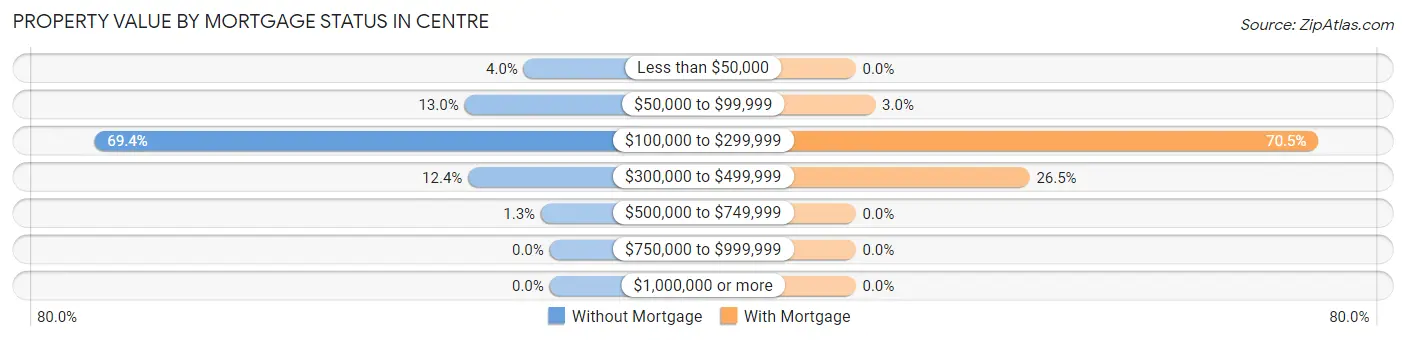
| Property Value | Without Mortgage | With Mortgage |
| Less than $50,000 | 21 (4.0%) | 0 (0.0%) |
| $50,000 to $99,999 | 69 (13.0%) | 14 (3.0%) |
| $100,000 to $299,999 | 369 (69.4%) | 330 (70.5%) |
| $300,000 to $499,999 | 66 (12.4%) | 124 (26.5%) |
| $500,000 to $749,999 | 7 (1.3%) | 0 (0.0%) |
| $750,000 to $999,999 | 0 (0.0%) | 0 (0.0%) |
| $1,000,000 or more | 0 (0.0%) | 0 (0.0%) |
| Total | 532 (100.0%) | 468 (100.0%) |
Household Income by Mortgage Status in Centre
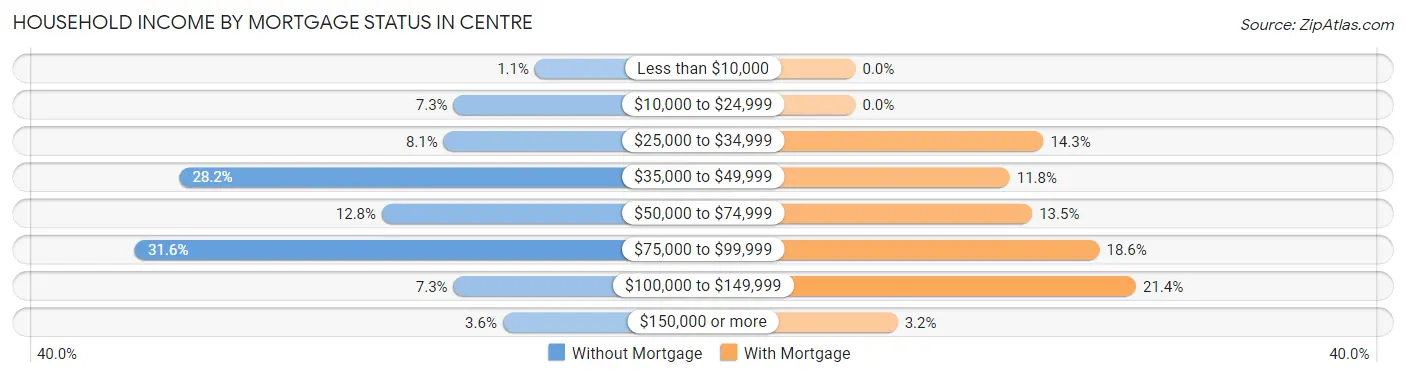
| Household Income | Without Mortgage | With Mortgage |
| Less than $10,000 | 6 (1.1%) | 0 (0.0%) |
| $10,000 to $24,999 | 39 (7.3%) | 0 (0.0%) |
| $25,000 to $34,999 | 43 (8.1%) | 67 (14.3%) |
| $35,000 to $49,999 | 150 (28.2%) | 55 (11.7%) |
| $50,000 to $74,999 | 68 (12.8%) | 63 (13.5%) |
| $75,000 to $99,999 | 168 (31.6%) | 87 (18.6%) |
| $100,000 to $149,999 | 39 (7.3%) | 100 (21.4%) |
| $150,000 or more | 19 (3.6%) | 15 (3.2%) |
| Total | 532 (100.0%) | 468 (100.0%) |
Property Value to Household Income Ratio in Centre
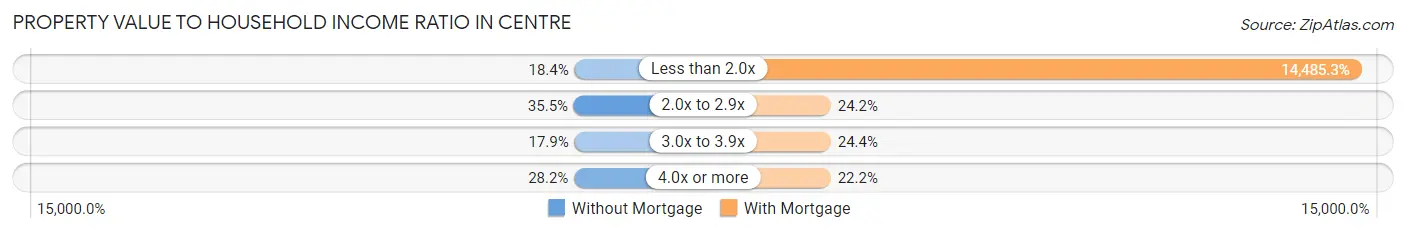
| Value-to-Income Ratio | Without Mortgage | With Mortgage |
| Less than 2.0x | 98 (18.4%) | 67,791 (14,485.3%) |
| 2.0x to 2.9x | 189 (35.5%) | 113 (24.1%) |
| 3.0x to 3.9x | 95 (17.9%) | 114 (24.4%) |
| 4.0x or more | 150 (28.2%) | 104 (22.2%) |
| Total | 532 (100.0%) | 468 (100.0%) |
Real Estate Taxes by Mortgage Status in Centre
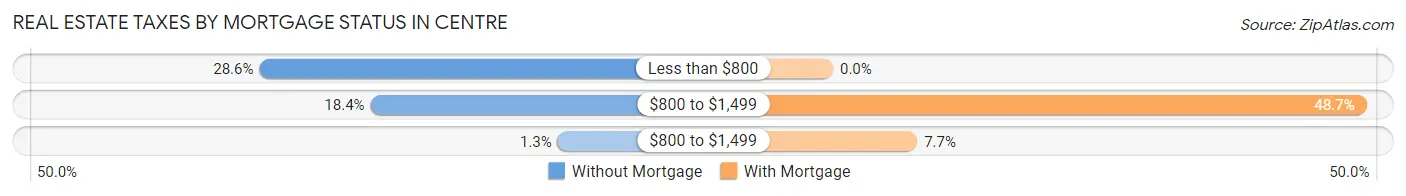
| Property Taxes | Without Mortgage | With Mortgage |
| Less than $800 | 152 (28.6%) | 0 (0.0%) |
| $800 to $1,499 | 98 (18.4%) | 228 (48.7%) |
| $800 to $1,499 | 7 (1.3%) | 36 (7.7%) |
| Total | 532 (100.0%) | 468 (100.0%) |
Health & Disability in Centre
Health Insurance Coverage by Age in Centre
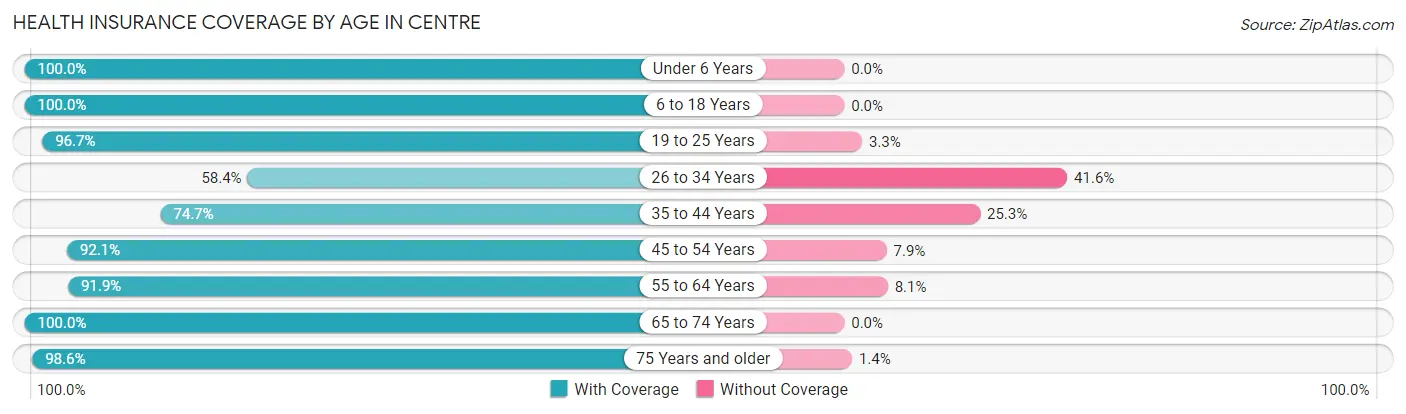
| Age Bracket | With Coverage | Without Coverage |
| Under 6 Years | 100 (100.0%) | 0 (0.0%) |
| 6 to 18 Years | 375 (100.0%) | 0 (0.0%) |
| 19 to 25 Years | 294 (96.7%) | 10 (3.3%) |
| 26 to 34 Years | 187 (58.4%) | 133 (41.6%) |
| 35 to 44 Years | 118 (74.7%) | 40 (25.3%) |
| 45 to 54 Years | 455 (92.1%) | 39 (7.9%) |
| 55 to 64 Years | 534 (91.9%) | 47 (8.1%) |
| 65 to 74 Years | 359 (100.0%) | 0 (0.0%) |
| 75 Years and older | 619 (98.6%) | 9 (1.4%) |
| Total | 3,041 (91.6%) | 278 (8.4%) |
Health Insurance Coverage by Citizenship Status in Centre
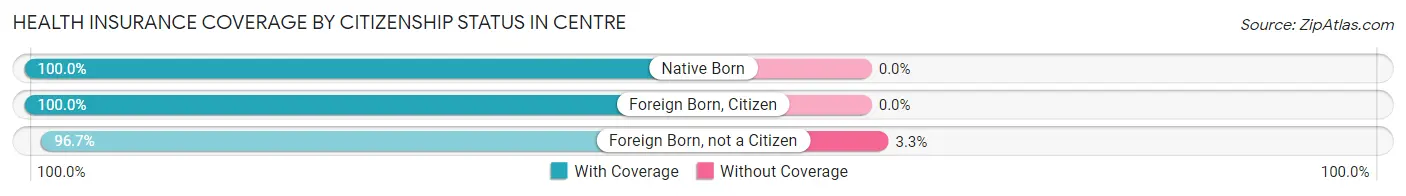
| Citizenship Status | With Coverage | Without Coverage |
| Native Born | 100 (100.0%) | 0 (0.0%) |
| Foreign Born, Citizen | 375 (100.0%) | 0 (0.0%) |
| Foreign Born, not a Citizen | 294 (96.7%) | 10 (3.3%) |
Health Insurance Coverage by Household Income in Centre
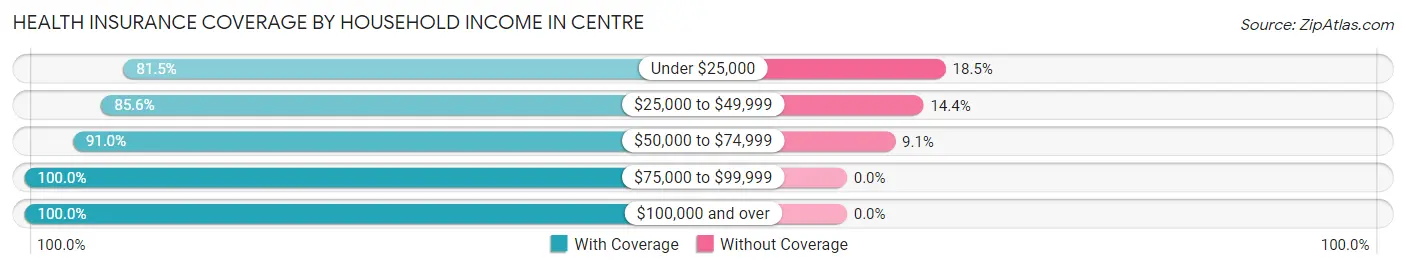
| Household Income | With Coverage | Without Coverage |
| Under $25,000 | 484 (81.5%) | 110 (18.5%) |
| $25,000 to $49,999 | 751 (85.6%) | 126 (14.4%) |
| $50,000 to $74,999 | 412 (90.9%) | 41 (9.0%) |
| $75,000 to $99,999 | 828 (100.0%) | 0 (0.0%) |
| $100,000 and over | 559 (100.0%) | 0 (0.0%) |
Public vs Private Health Insurance Coverage by Age in Centre
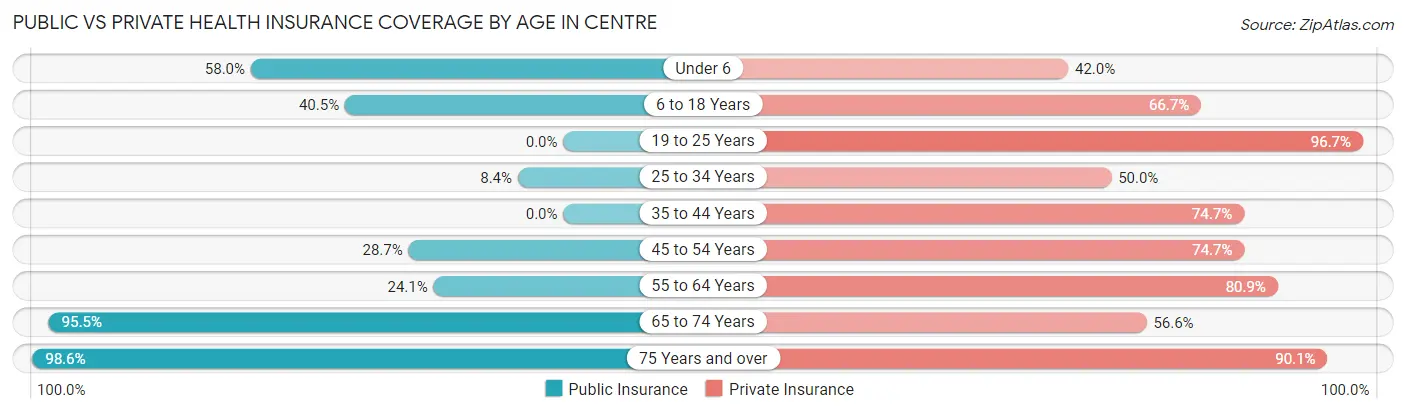
| Age Bracket | Public Insurance | Private Insurance |
| Under 6 | 58 (58.0%) | 42 (42.0%) |
| 6 to 18 Years | 152 (40.5%) | 250 (66.7%) |
| 19 to 25 Years | 0 (0.0%) | 294 (96.7%) |
| 25 to 34 Years | 27 (8.4%) | 160 (50.0%) |
| 35 to 44 Years | 0 (0.0%) | 118 (74.7%) |
| 45 to 54 Years | 142 (28.7%) | 369 (74.7%) |
| 55 to 64 Years | 140 (24.1%) | 470 (80.9%) |
| 65 to 74 Years | 343 (95.5%) | 203 (56.6%) |
| 75 Years and over | 619 (98.6%) | 566 (90.1%) |
| Total | 1,481 (44.6%) | 2,472 (74.5%) |
Disability Status by Sex by Age in Centre
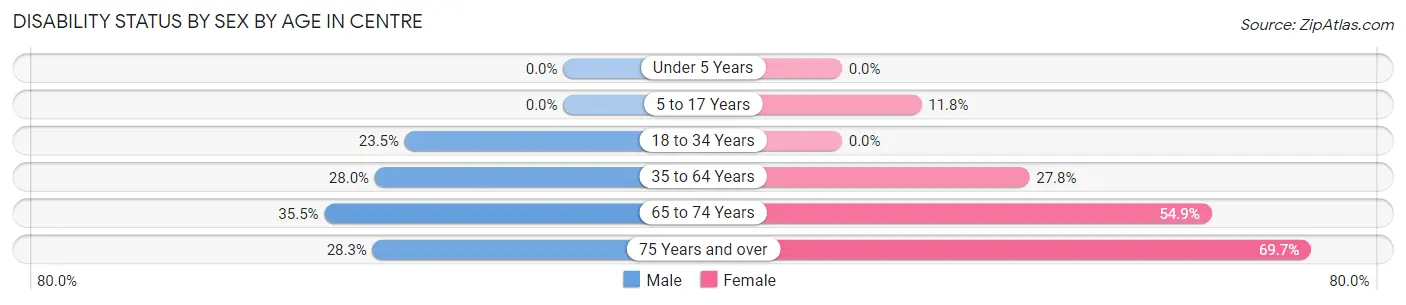
| Age Bracket | Male | Female |
| Under 5 Years | 0 (0.0%) | 0 (0.0%) |
| 5 to 17 Years | 0 (0.0%) | 21 (11.8%) |
| 18 to 34 Years | 64 (23.5%) | 0 (0.0%) |
| 35 to 64 Years | 148 (28.0%) | 196 (27.8%) |
| 65 to 74 Years | 44 (35.5%) | 129 (54.9%) |
| 75 Years and over | 62 (28.3%) | 285 (69.7%) |
Disability Class by Sex by Age in Centre
Disability Class: Hearing Difficulty
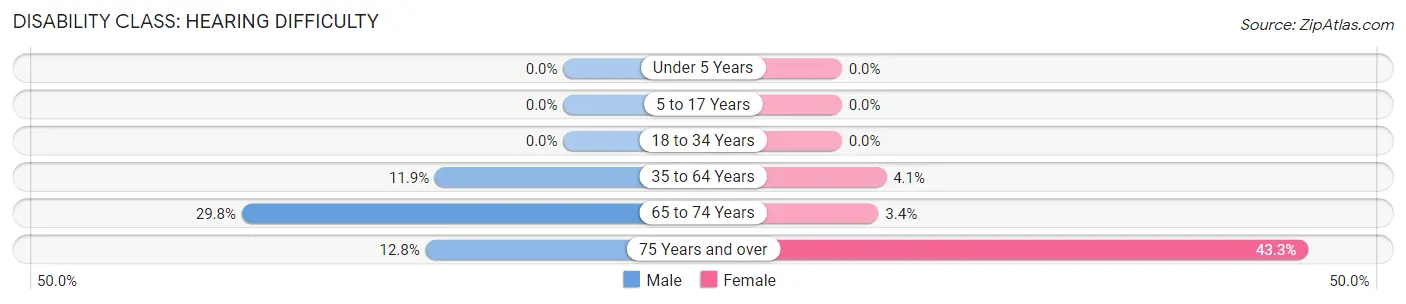
| Age Bracket | Male | Female |
| Under 5 Years | 0 (0.0%) | 0 (0.0%) |
| 5 to 17 Years | 0 (0.0%) | 0 (0.0%) |
| 18 to 34 Years | 0 (0.0%) | 0 (0.0%) |
| 35 to 64 Years | 63 (11.9%) | 29 (4.1%) |
| 65 to 74 Years | 37 (29.8%) | 8 (3.4%) |
| 75 Years and over | 28 (12.8%) | 177 (43.3%) |
Disability Class: Vision Difficulty
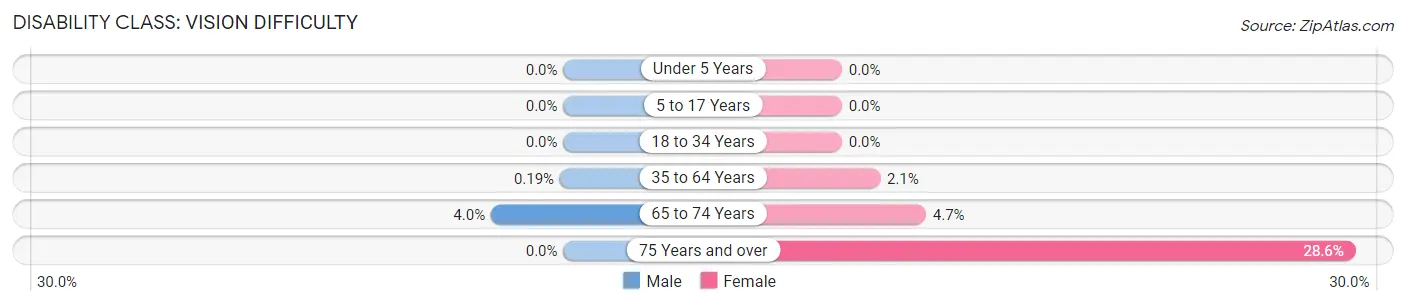
| Age Bracket | Male | Female |
| Under 5 Years | 0 (0.0%) | 0 (0.0%) |
| 5 to 17 Years | 0 (0.0%) | 0 (0.0%) |
| 18 to 34 Years | 0 (0.0%) | 0 (0.0%) |
| 35 to 64 Years | 1 (0.2%) | 15 (2.1%) |
| 65 to 74 Years | 5 (4.0%) | 11 (4.7%) |
| 75 Years and over | 0 (0.0%) | 117 (28.6%) |
Disability Class: Cognitive Difficulty
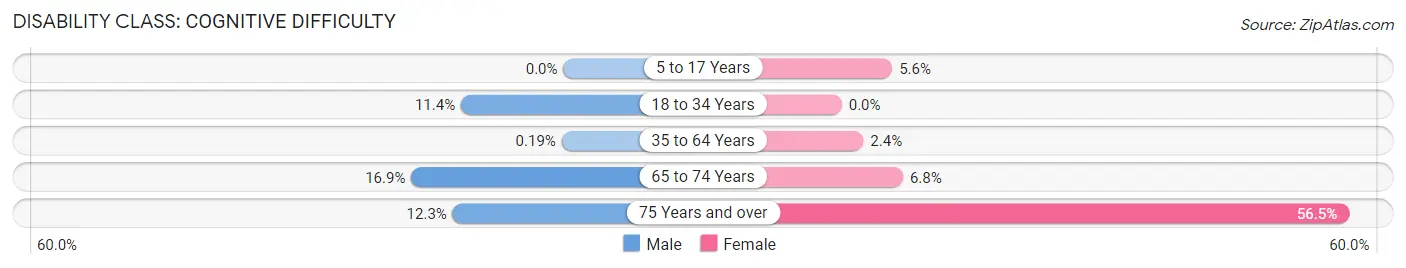
| Age Bracket | Male | Female |
| 5 to 17 Years | 0 (0.0%) | 10 (5.6%) |
| 18 to 34 Years | 31 (11.4%) | 0 (0.0%) |
| 35 to 64 Years | 1 (0.2%) | 17 (2.4%) |
| 65 to 74 Years | 21 (16.9%) | 16 (6.8%) |
| 75 Years and over | 27 (12.3%) | 231 (56.5%) |
Disability Class: Ambulatory Difficulty
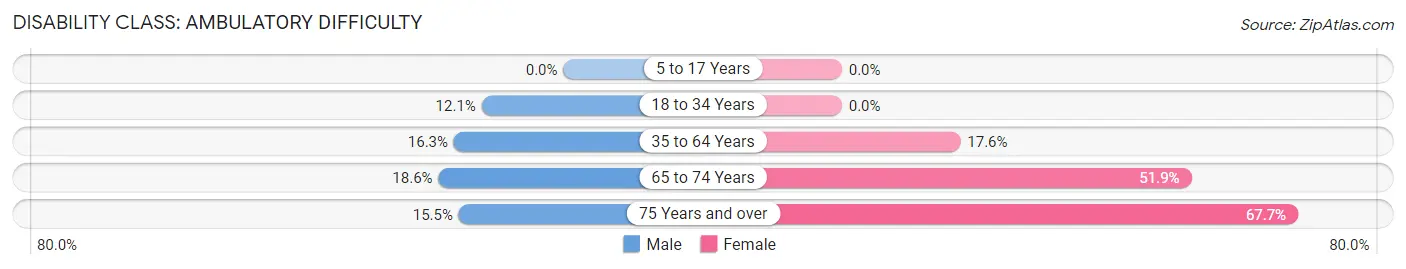
| Age Bracket | Male | Female |
| 5 to 17 Years | 0 (0.0%) | 0 (0.0%) |
| 18 to 34 Years | 33 (12.1%) | 0 (0.0%) |
| 35 to 64 Years | 86 (16.3%) | 124 (17.6%) |
| 65 to 74 Years | 23 (18.5%) | 122 (51.9%) |
| 75 Years and over | 34 (15.5%) | 277 (67.7%) |
Disability Class: Self-Care Difficulty
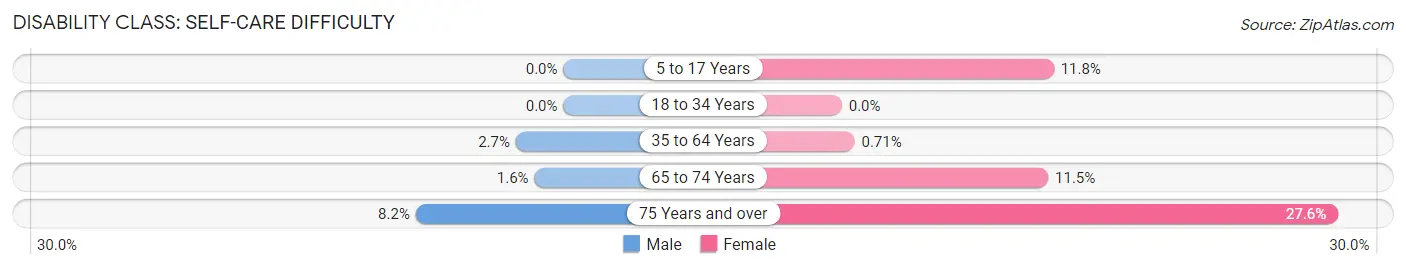
| Age Bracket | Male | Female |
| 5 to 17 Years | 0 (0.0%) | 21 (11.8%) |
| 18 to 34 Years | 0 (0.0%) | 0 (0.0%) |
| 35 to 64 Years | 14 (2.6%) | 5 (0.7%) |
| 65 to 74 Years | 2 (1.6%) | 27 (11.5%) |
| 75 Years and over | 18 (8.2%) | 113 (27.6%) |
Technology Access in Centre
Computing Device Access in Centre
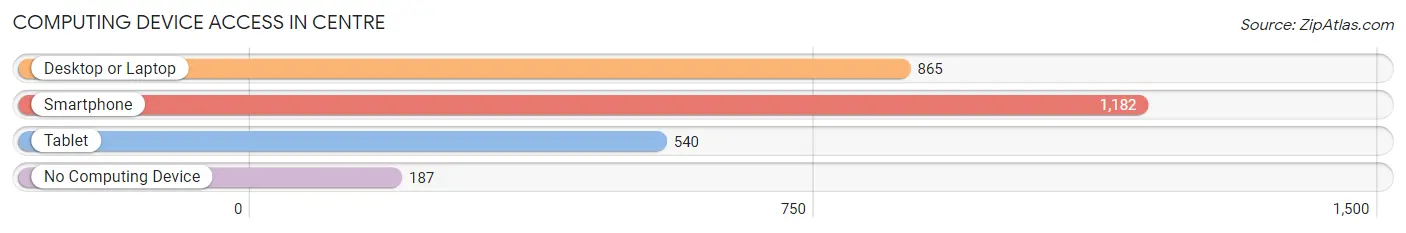
| Device Type | # Households | % Households |
| Desktop or Laptop | 865 | 57.5% |
| Smartphone | 1,182 | 78.5% |
| Tablet | 540 | 35.9% |
| No Computing Device | 187 | 12.4% |
| Total | 1,505 | 100.0% |
Internet Access in Centre
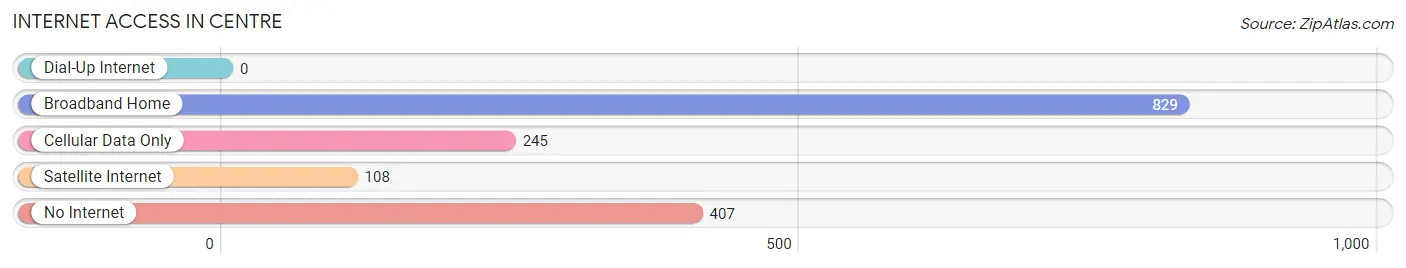
| Internet Type | # Households | % Households |
| Dial-Up Internet | 0 | 0.0% |
| Broadband Home | 829 | 55.1% |
| Cellular Data Only | 245 | 16.3% |
| Satellite Internet | 108 | 7.2% |
| No Internet | 407 | 27.0% |
| Total | 1,505 | 100.0% |
Centre Summary
Centre is a city located in Cherokee County, Alabama, United States. It is the county seat of Cherokee County and is located in the foothills of the Appalachian Mountains. The population was 3,489 at the 2010 census.
History
Centre was founded in 1833 and was originally known as Cedar Bluff. The town was renamed Centre in 1837, and it was incorporated in 1841. The name Centre was chosen because the town is located at the geographic center of Cherokee County.
The town was a major trading center for the Cherokee Indians prior to the Indian Removal Act of 1830. The town was also a major stop on the Trail of Tears, as the Cherokee were forcibly removed from their ancestral lands in the southeastern United States and relocated to Indian Territory (now Oklahoma).
The town was also a major stop on the stagecoach route between Rome, Georgia and Chattanooga, Tennessee. The town was also a major stop on the railroad line between Rome and Chattanooga.
Geography
Centre is located at 34°14'25" North, 85°41'17" West (34.240278, -85.688056). According to the United States Census Bureau, the city has a total area of 5.2 square miles (13.4 km2), all land.
Economy
Centre's economy is largely based on agriculture and manufacturing. The town is home to several large poultry processing plants, as well as a number of smaller businesses. The town is also home to a number of retail stores, restaurants, and other businesses.
Demographics
As of the census of 2000, there were 3,717 people, 1,541 households, and 990 families residing in the city. The population density was 717.2 people per square mile (277.2/km2). There were 1,717 housing units at an average density of 332.2 per square mile (128.2/km2). The racial makeup of the city was 79.45% White, 18.90% Black or African American, 0.19% Native American, 0.19% Asian, 0.05% Pacific Islander, 0.37% from other races, and 0.85% from two or more races. 1.08% of the population were Hispanic or Latino of any race.
There were 1,541 households, out of which 28.2% had children under the age of 18 living with them, 44.2% were married couples living together, 17.2% had a female householder with no husband present, and 34.7% were non-families. 32.2% of all households were made up of individuals, and 16.2% had someone living alone who was 65 years of age or older. The average household size was 2.35 and the average family size was 2.96.
In the city, the population was spread out, with 24.2% under the age of 18, 8.3% from 18 to 24, 25.2% from 25 to 44, 22.2% from 45 to 64, and 20.1% who were 65 years of age or older. The median age was 39 years. For every 100 females, there were 84.2 males. For every 100 females age 18 and over, there were 79.2 males.
The median income for a household in the city was $25,938, and the median income for a family was $32,917. Males had a median income of $27,917 versus $20,000 for females. The per capita income for the city was $14,945. About 17.2% of families and 20.2% of the population were below the poverty line, including 28.2% of those under age 18 and 17.2% of those age 65 or over.
Common Questions
What is Per Capita Income in Centre?
Per Capita income in Centre is $27,887.
What is the Median Family Income in Centre?
Median Family Income in Centre is $63,207.
What is the Median Household income in Centre?
Median Household Income in Centre is $41,924.
What is Income or Wage Gap in Centre?
Income or Wage Gap in Centre is 1.3%.
Women in Centre earn 98.7 cents for every dollar earned by a man.
What is Inequality or Gini Index in Centre?
Inequality or Gini Index in Centre is 0.42.
What is the Total Population of Centre?
Total Population of Centre is 3,609.
What is the Total Male Population of Centre?
Total Male Population of Centre is 1,522.
What is the Total Female Population of Centre?
Total Female Population of Centre is 2,087.
What is the Ratio of Males per 100 Females in Centre?
There are 72.93 Males per 100 Females in Centre.
What is the Ratio of Females per 100 Males in Centre?
There are 137.12 Females per 100 Males in Centre.
What is the Median Population Age in Centre?
Median Population Age in Centre is 54.5 Years.
What is the Average Family Size in Centre
Average Family Size in Centre is 2.8 People.
What is the Average Household Size in Centre
Average Household Size in Centre is 2.2 People.
How Large is the Labor Force in Centre?
There are 1,393 People in the Labor Forcein in Centre.
What is the Percentage of People in the Labor Force in Centre?
43.3% of People are in the Labor Force in Centre.
What is the Unemployment Rate in Centre?
Unemployment Rate in Centre is 7.5%.