Camp Hill, AL Map & Demographics
Camp Hill Map
Camp Hill Overview
$16,513
PER CAPITA INCOME
$32,420
AVG FAMILY INCOME
$30,931
AVG HOUSEHOLD INCOME
0.46
INEQUALITY / GINI INDEX
1,321
TOTAL POPULATION
623
MALE POPULATION
698
FEMALE POPULATION
89.26
MALES / 100 FEMALES
112.04
FEMALES / 100 MALES
40.0
MEDIAN AGE
3.3
AVG FAMILY SIZE
2.7
AVG HOUSEHOLD SIZE
308
LABOR FORCE [ PEOPLE ]
31.0%
PERCENT IN LABOR FORCE
21.8%
UNEMPLOYMENT RATE
Camp Hill Zip Codes
Income in Camp Hill
Income Overview in Camp Hill
Per Capita Income in Camp Hill is $16,513, while median incomes of families and households are $32,420 and $30,931 respectively.
| Characteristic | Number | Measure |
| Per Capita Income | 1,321 | $16,513 |
| Median Family Income | 331 | $32,420 |
| Mean Family Income | 331 | $43,089 |
| Median Household Income | 483 | $30,931 |
| Mean Household Income | 483 | $41,907 |
| Income Deficit | 331 | $0 |
| Wage / Income Gap (%) | 1,321 | 0.00% |
| Wage / Income Gap ($) | 1,321 | 100.00¢ per $1 |
| Gini / Inequality Index | 1,321 | 0.46 |
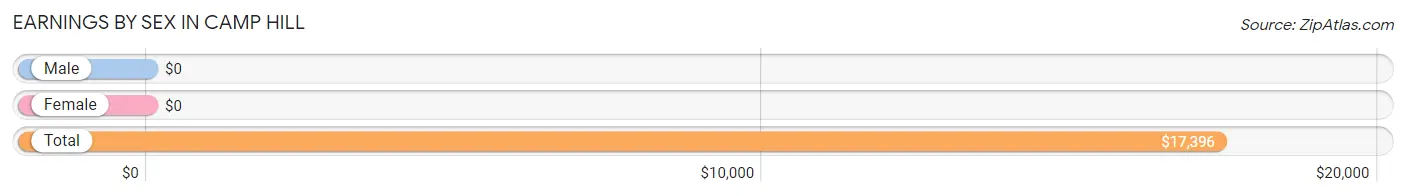
Earnings by Sex in Camp Hill
| Sex | Number | Average Earnings |
| Male | 128 (37.3%) | $0 |
| Female | 215 (62.7%) | $0 |
| Total | 343 (100.0%) | $17,396 |
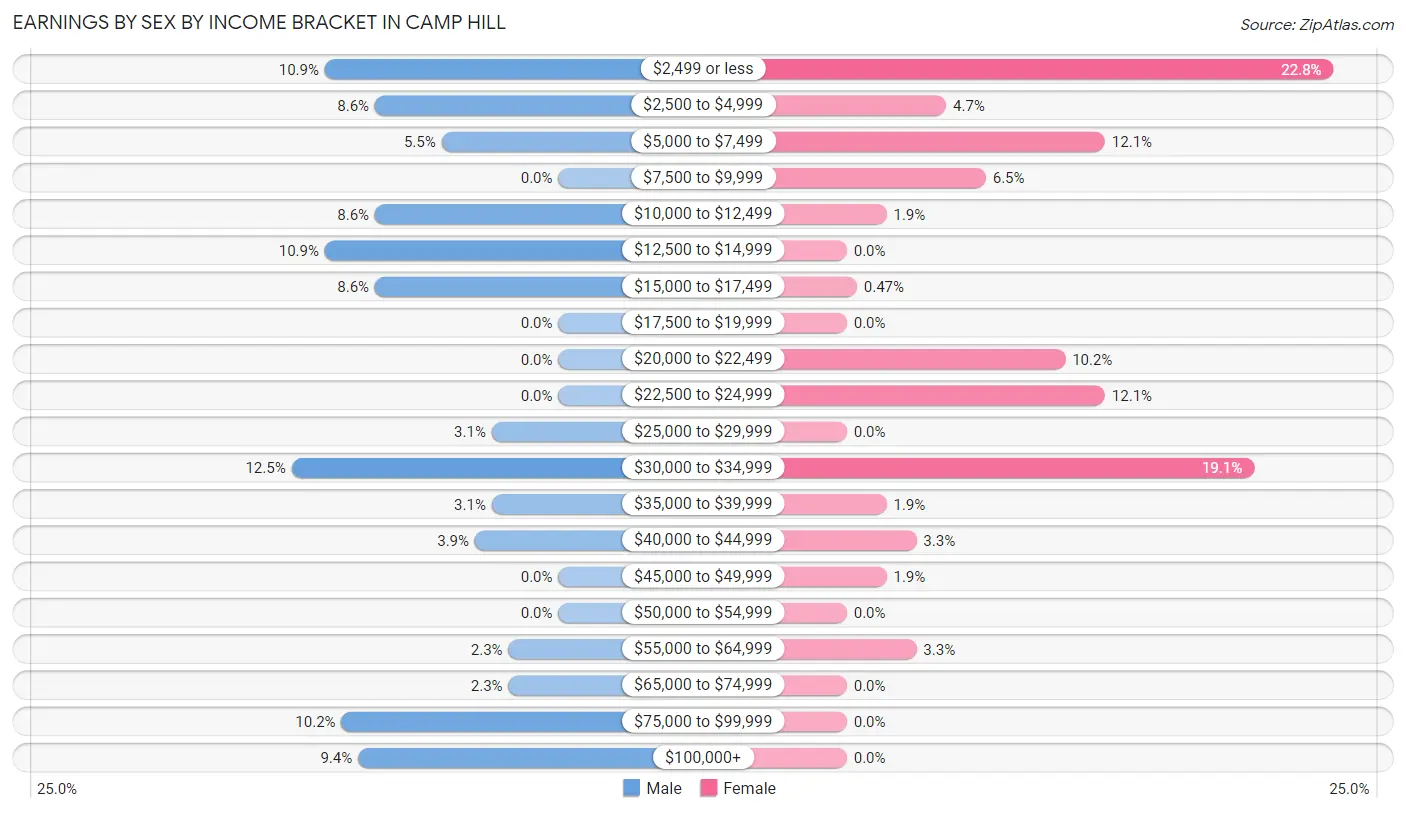
Earnings by Sex by Income Bracket in Camp Hill
The most common earnings brackets in Camp Hill are $30,000 to $34,999 for men (16 | 12.5%) and $2,499 or less for women (49 | 22.8%).
| Income | Male | Female |
| $2,499 or less | 14 (10.9%) | 49 (22.8%) |
| $2,500 to $4,999 | 11 (8.6%) | 10 (4.6%) |
| $5,000 to $7,499 | 7 (5.5%) | 26 (12.1%) |
| $7,500 to $9,999 | 0 (0.0%) | 14 (6.5%) |
| $10,000 to $12,499 | 11 (8.6%) | 4 (1.9%) |
| $12,500 to $14,999 | 14 (10.9%) | 0 (0.0%) |
| $15,000 to $17,499 | 11 (8.6%) | 1 (0.5%) |
| $17,500 to $19,999 | 0 (0.0%) | 0 (0.0%) |
| $20,000 to $22,499 | 0 (0.0%) | 22 (10.2%) |
| $22,500 to $24,999 | 0 (0.0%) | 26 (12.1%) |
| $25,000 to $29,999 | 4 (3.1%) | 0 (0.0%) |
| $30,000 to $34,999 | 16 (12.5%) | 41 (19.1%) |
| $35,000 to $39,999 | 4 (3.1%) | 4 (1.9%) |
| $40,000 to $44,999 | 5 (3.9%) | 7 (3.3%) |
| $45,000 to $49,999 | 0 (0.0%) | 4 (1.9%) |
| $50,000 to $54,999 | 0 (0.0%) | 0 (0.0%) |
| $55,000 to $64,999 | 3 (2.3%) | 7 (3.3%) |
| $65,000 to $74,999 | 3 (2.3%) | 0 (0.0%) |
| $75,000 to $99,999 | 13 (10.2%) | 0 (0.0%) |
| $100,000+ | 12 (9.4%) | 0 (0.0%) |
| Total | 128 (100.0%) | 215 (100.0%) |
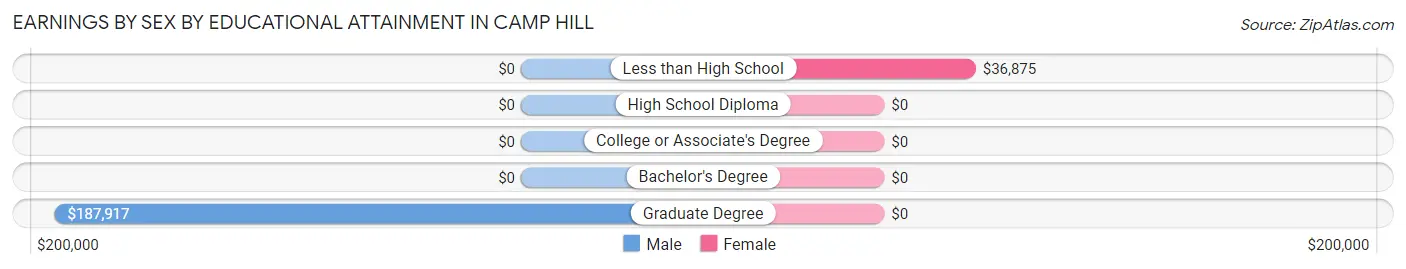
Earnings by Sex by Educational Attainment in Camp Hill
| Educational Attainment | Male Income | Female Income |
| Less than High School | - | - |
| High School Diploma | - | - |
| College or Associate's Degree | - | - |
| Bachelor's Degree | - | - |
| Graduate Degree | $187,917 | $0 |
| Total | $30,391 | $0 |
Family Income in Camp Hill
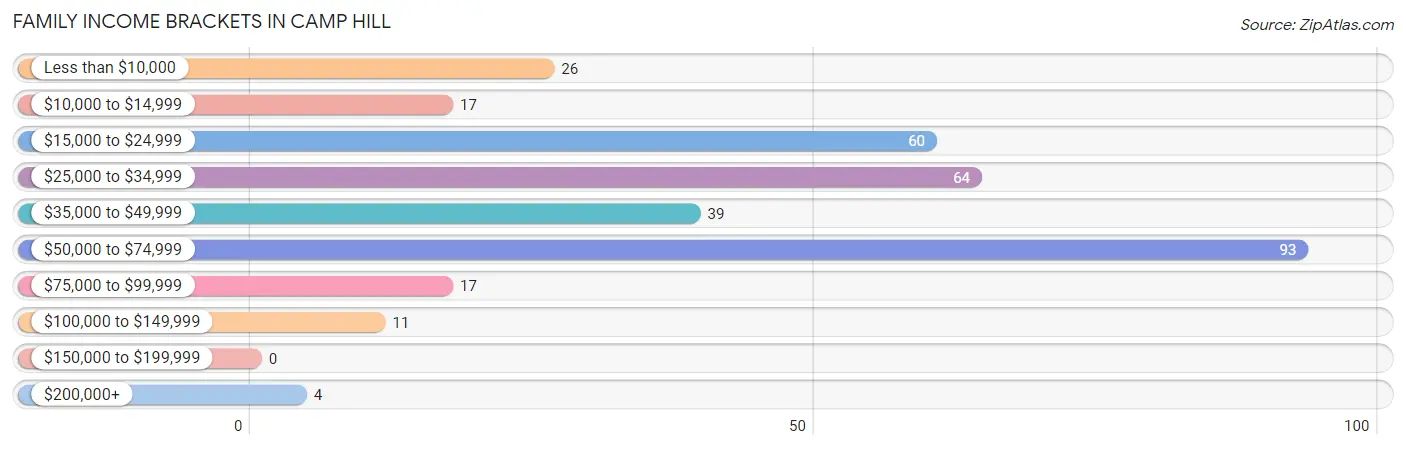
Family Income Brackets in Camp Hill
According to the Camp Hill family income data, there are 93 families falling into the $50,000 to $74,999 income range, which is the most common income bracket and makes up 28.1% of all families.
| Income Bracket | # Families | % Families |
| Less than $10,000 | 26 | 7.9% |
| $10,000 to $14,999 | 17 | 5.1% |
| $15,000 to $24,999 | 60 | 18.1% |
| $25,000 to $34,999 | 64 | 19.3% |
| $35,000 to $49,999 | 39 | 11.8% |
| $50,000 to $74,999 | 93 | 28.1% |
| $75,000 to $99,999 | 17 | 5.1% |
| $100,000 to $149,999 | 11 | 3.3% |
| $150,000 to $199,999 | 0 | 0.0% |
| $200,000+ | 4 | 1.2% |
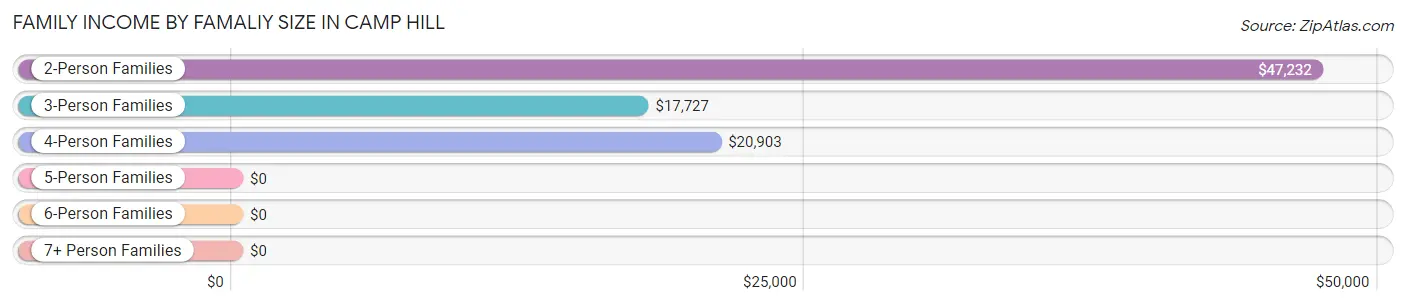
Family Income by Famaliy Size in Camp Hill
2-person families (201 | 60.7%) account for the highest median family income in Camp Hill with $47,232 per family, while 2-person families (201 | 60.7%) have the highest median income of $23,616 per family member.
| Income Bracket | # Families | Median Income |
| 2-Person Families | 201 (60.7%) | $47,232 |
| 3-Person Families | 54 (16.3%) | $17,727 |
| 4-Person Families | 37 (11.2%) | $20,903 |
| 5-Person Families | 39 (11.8%) | $0 |
| 6-Person Families | 0 (0.0%) | $0 |
| 7+ Person Families | 0 (0.0%) | $0 |
| Total | 331 (100.0%) | $32,420 |
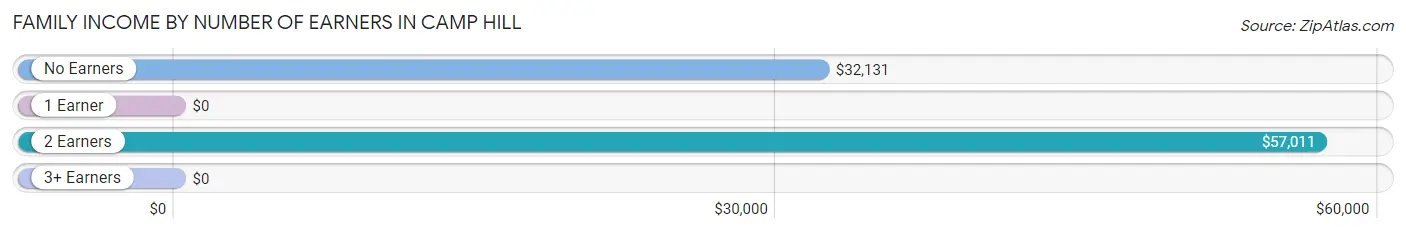
Family Income by Number of Earners in Camp Hill
| Number of Earners | # Families | Median Income |
| No Earners | 177 (53.5%) | $32,131 |
| 1 Earner | 106 (32.0%) | $0 |
| 2 Earners | 37 (11.2%) | $57,011 |
| 3+ Earners | 11 (3.3%) | $0 |
| Total | 331 (100.0%) | $32,420 |
Household Income in Camp Hill
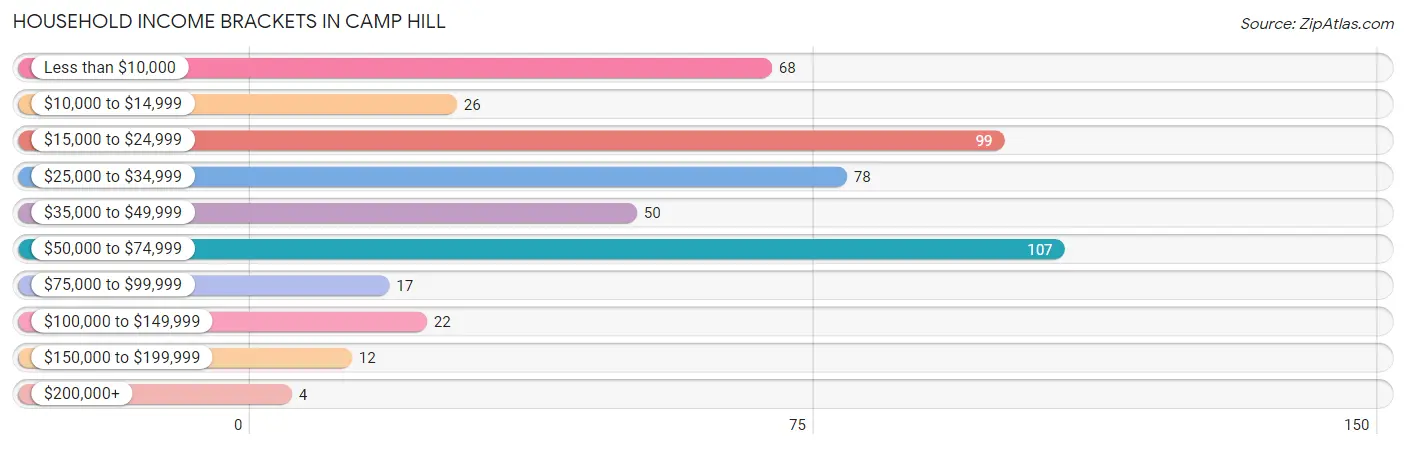
Household Income Brackets in Camp Hill
With 107 households falling in the category, the $50,000 to $74,999 income range is the most frequent in Camp Hill, accounting for 22.2% of all households. In contrast, only 4 households (0.8%) fall into the $200,000+ income bracket, making it the least populous group.
| Income Bracket | # Households | % Households |
| Less than $10,000 | 68 | 14.1% |
| $10,000 to $14,999 | 26 | 5.4% |
| $15,000 to $24,999 | 99 | 20.5% |
| $25,000 to $34,999 | 78 | 16.1% |
| $35,000 to $49,999 | 50 | 10.4% |
| $50,000 to $74,999 | 107 | 22.2% |
| $75,000 to $99,999 | 17 | 3.5% |
| $100,000 to $149,999 | 22 | 4.6% |
| $150,000 to $199,999 | 12 | 2.5% |
| $200,000+ | 4 | 0.8% |
Household Income by Householder Age in Camp Hill
The median household income in Camp Hill is $30,931, with the highest median household income of $57,065 found in the 45 to 64 years age bracket for the primary householder. A total of 204 households (42.2%) fall into this category.
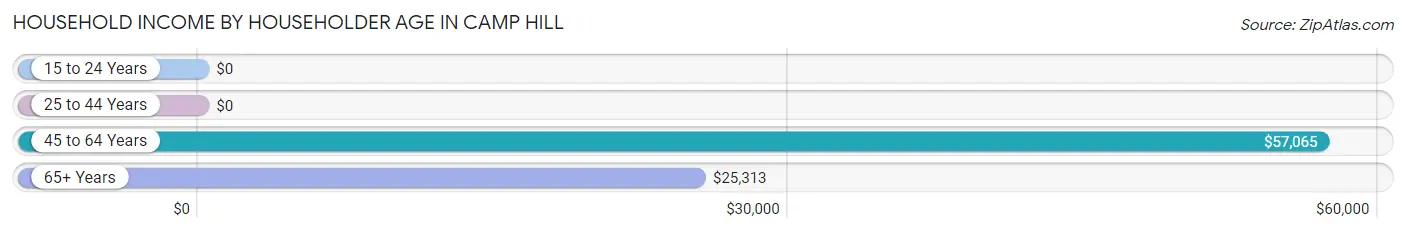
| Income Bracket | # Households | Median Income |
| 15 to 24 Years | 0 (0.0%) | $0 |
| 25 to 44 Years | 157 (32.5%) | $0 |
| 45 to 64 Years | 204 (42.2%) | $57,065 |
| 65+ Years | 122 (25.3%) | $25,313 |
| Total | 483 (100.0%) | $30,931 |
Poverty in Camp Hill
Income Below Poverty by Sex and Age in Camp Hill
With 48.0% poverty level for males and 35.2% for females among the residents of Camp Hill, 18 to 24 year old males and under 5 year old females are the most vulnerable to poverty, with 26 males (100.0%) and 48 females (73.9%) in their respective age groups living below the poverty level.
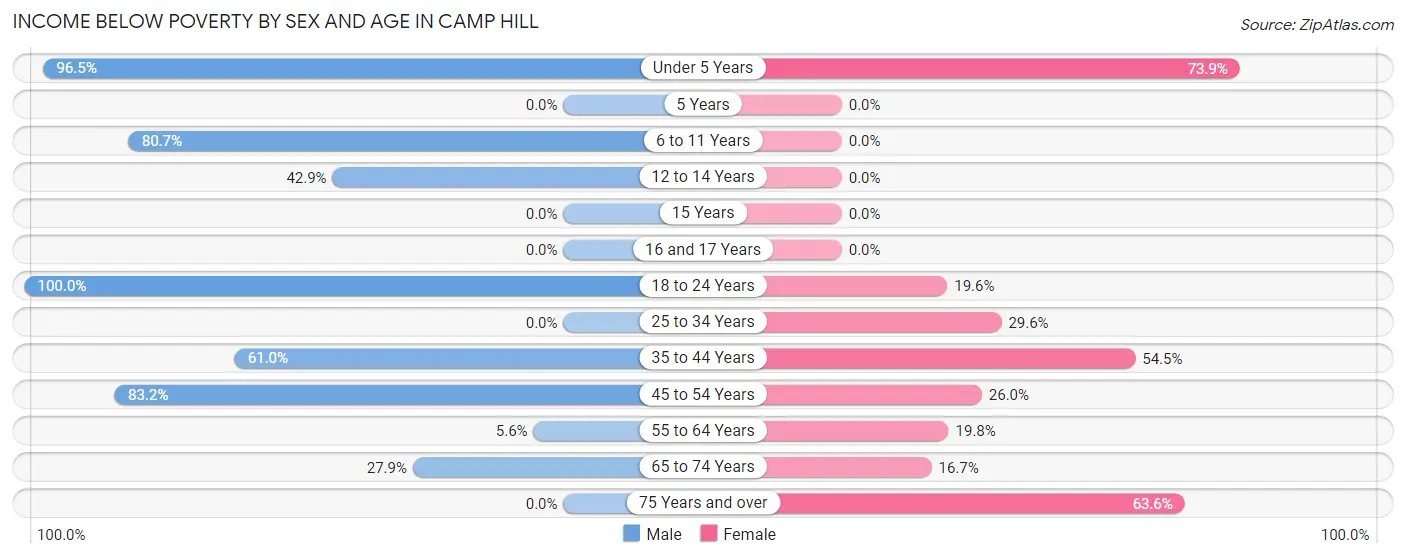
| Age Bracket | Male | Female |
| Under 5 Years | 55 (96.5%) | 48 (73.9%) |
| 5 Years | 0 (0.0%) | 0 (0.0%) |
| 6 to 11 Years | 50 (80.6%) | 0 (0.0%) |
| 12 to 14 Years | 12 (42.9%) | 0 (0.0%) |
| 15 Years | 0 (0.0%) | 0 (0.0%) |
| 16 and 17 Years | 0 (0.0%) | 0 (0.0%) |
| 18 to 24 Years | 26 (100.0%) | 19 (19.6%) |
| 25 to 34 Years | 0 (0.0%) | 16 (29.6%) |
| 35 to 44 Years | 25 (61.0%) | 79 (54.5%) |
| 45 to 54 Years | 104 (83.2%) | 13 (26.0%) |
| 55 to 64 Years | 4 (5.6%) | 24 (19.8%) |
| 65 to 74 Years | 19 (27.9%) | 13 (16.7%) |
| 75 Years and over | 0 (0.0%) | 28 (63.6%) |
| Total | 295 (48.0%) | 240 (35.2%) |
Income Above Poverty by Sex and Age in Camp Hill
According to the poverty statistics in Camp Hill, males aged 15 years and females aged 5 years are the age groups that are most secure financially, with 100.0% of males and 100.0% of females in these age groups living above the poverty line.
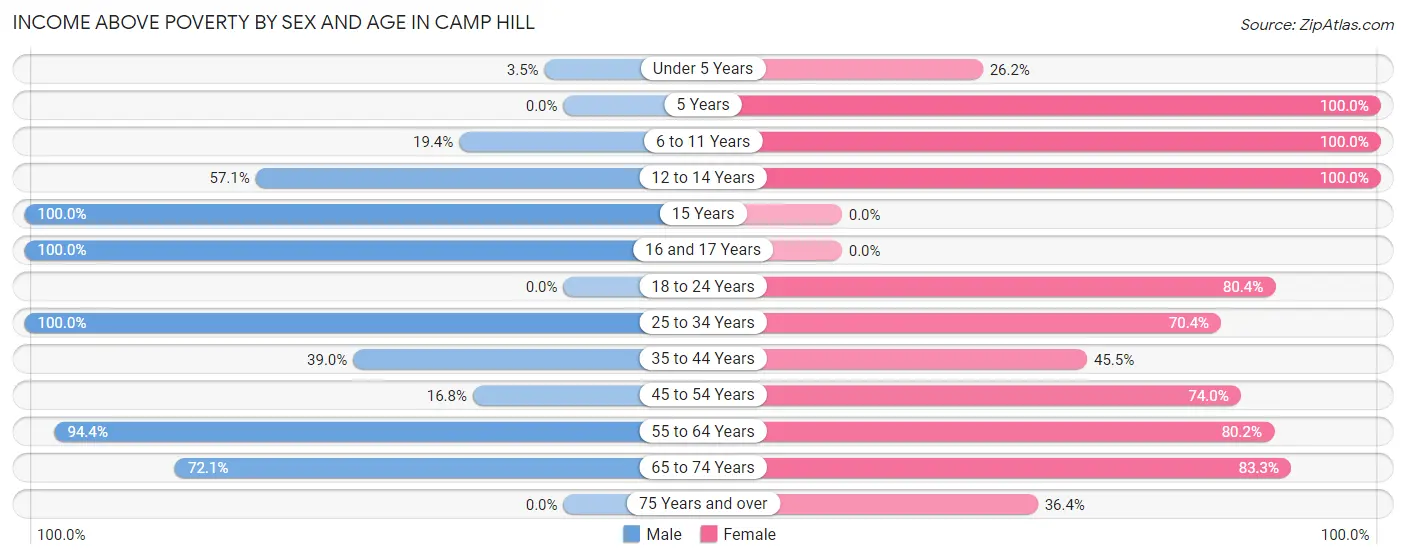
| Age Bracket | Male | Female |
| Under 5 Years | 2 (3.5%) | 17 (26.2%) |
| 5 Years | 0 (0.0%) | 7 (100.0%) |
| 6 to 11 Years | 12 (19.4%) | 2 (100.0%) |
| 12 to 14 Years | 16 (57.1%) | 19 (100.0%) |
| 15 Years | 71 (100.0%) | 0 (0.0%) |
| 16 and 17 Years | 18 (100.0%) | 0 (0.0%) |
| 18 to 24 Years | 0 (0.0%) | 78 (80.4%) |
| 25 to 34 Years | 46 (100.0%) | 38 (70.4%) |
| 35 to 44 Years | 16 (39.0%) | 66 (45.5%) |
| 45 to 54 Years | 21 (16.8%) | 37 (74.0%) |
| 55 to 64 Years | 68 (94.4%) | 97 (80.2%) |
| 65 to 74 Years | 49 (72.1%) | 65 (83.3%) |
| 75 Years and over | 0 (0.0%) | 16 (36.4%) |
| Total | 319 (51.9%) | 442 (64.8%) |
Income Below Poverty Among Married-Couple Families in Camp Hill
The poverty statistics for married-couple families in Camp Hill show that 12.2% or 11 of the total 90 families live below the poverty line. Families with no children have the highest poverty rate of 14.3%, comprising of 11 families. On the other hand, families with 1 or 2 children have the lowest poverty rate of 0.0%, which includes 0 families.
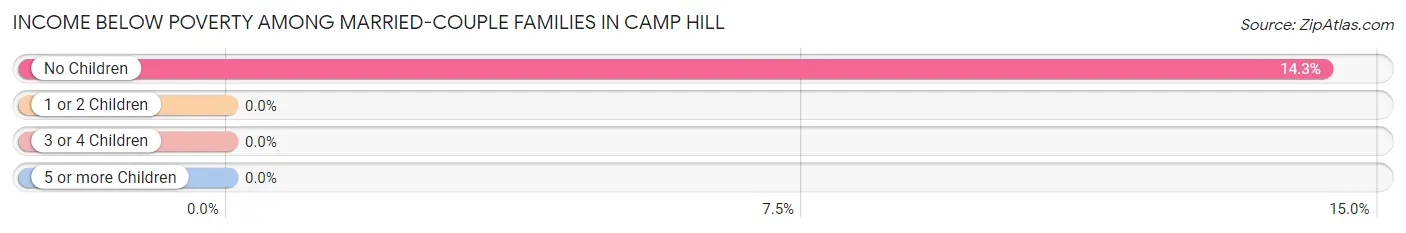
| Children | Above Poverty | Below Poverty |
| No Children | 66 (85.7%) | 11 (14.3%) |
| 1 or 2 Children | 8 (100.0%) | 0 (0.0%) |
| 3 or 4 Children | 5 (100.0%) | 0 (0.0%) |
| 5 or more Children | 0 (0.0%) | 0 (0.0%) |
| Total | 79 (87.8%) | 11 (12.2%) |
Income Below Poverty Among Single-Parent Households in Camp Hill
According to the poverty data in Camp Hill, 100.0% or 6 single-father households and 34.5% or 81 single-mother households are living below the poverty line. Among single-father households, those with 1 or 2 children have the highest poverty rate, with 6 households (100.0%) experiencing poverty. Likewise, among single-mother households, those with 3 or 4 children have the highest poverty rate, with 16 households (80.0%) falling below the poverty line.
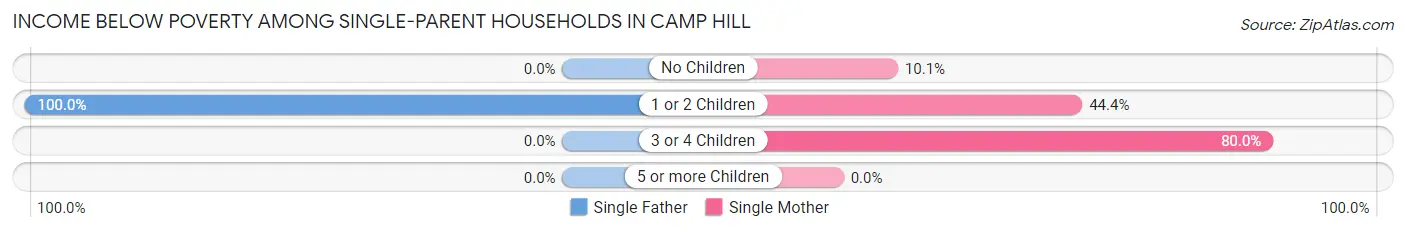
| Children | Single Father | Single Mother |
| No Children | 0 (0.0%) | 9 (10.1%) |
| 1 or 2 Children | 6 (100.0%) | 56 (44.4%) |
| 3 or 4 Children | 0 (0.0%) | 16 (80.0%) |
| 5 or more Children | 0 (0.0%) | 0 (0.0%) |
| Total | 6 (100.0%) | 81 (34.5%) |
Income Below Poverty Among Married-Couple vs Single-Parent Households in Camp Hill
The poverty data for Camp Hill shows that 11 of the married-couple family households (12.2%) and 87 of the single-parent households (36.1%) are living below the poverty level. Within the married-couple family households, those with no children have the highest poverty rate, with 11 households (14.3%) falling below the poverty line. Among the single-parent households, those with 3 or 4 children have the highest poverty rate, with 16 household (80.0%) living below poverty.
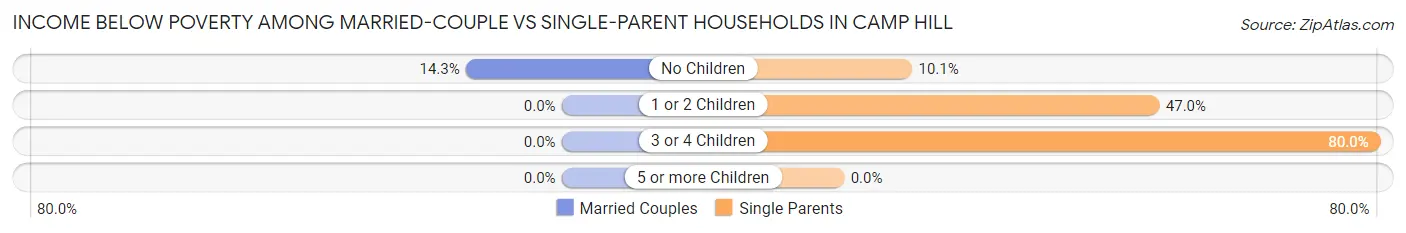
| Children | Married-Couple Families | Single-Parent Households |
| No Children | 11 (14.3%) | 9 (10.1%) |
| 1 or 2 Children | 0 (0.0%) | 62 (47.0%) |
| 3 or 4 Children | 0 (0.0%) | 16 (80.0%) |
| 5 or more Children | 0 (0.0%) | 0 (0.0%) |
| Total | 11 (12.2%) | 87 (36.1%) |
Race in Camp Hill
The most populous races in Camp Hill are Black / African American (1,187 | 89.9%), White / Caucasian (118 | 8.9%), and Hispanic or Latino (28 | 2.1%).
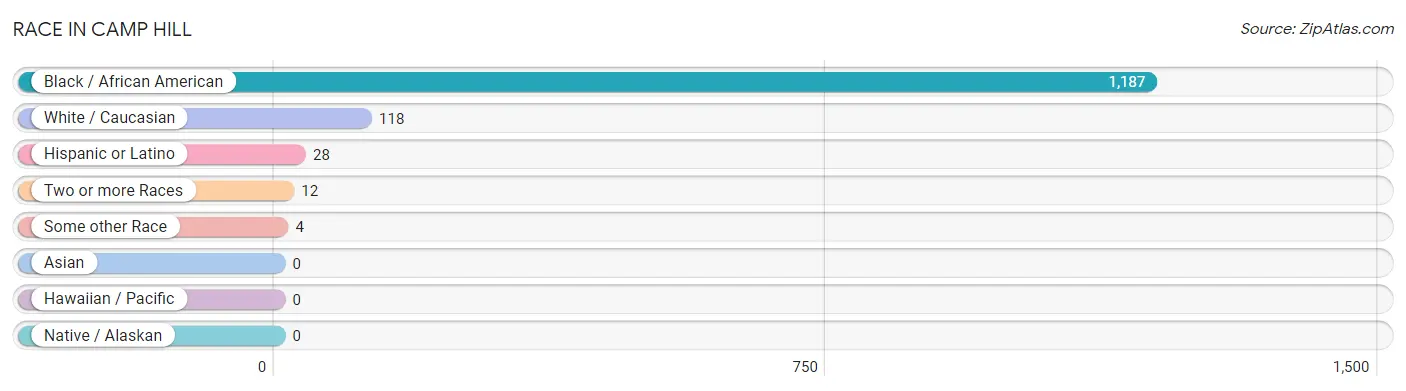
| Race | # Population | % Population |
| Asian | 0 | 0.0% |
| Black / African American | 1,187 | 89.9% |
| Hawaiian / Pacific | 0 | 0.0% |
| Hispanic or Latino | 28 | 2.1% |
| Native / Alaskan | 0 | 0.0% |
| White / Caucasian | 118 | 8.9% |
| Two or more Races | 12 | 0.9% |
| Some other Race | 4 | 0.3% |
| Total | 1,321 | 100.0% |
Ancestry in Camp Hill
The most populous ancestries reported in Camp Hill are English (29 | 2.2%), German (26 | 2.0%), Irish (26 | 2.0%), Welsh (16 | 1.2%), and American (9 | 0.7%), together accounting for 8.0% of all Camp Hill residents.
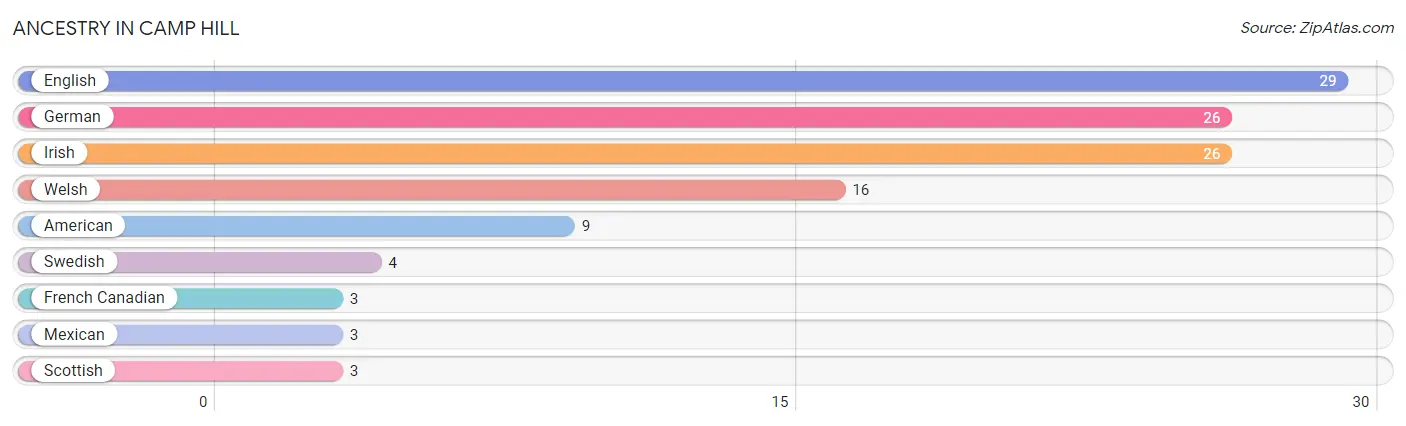
| Ancestry | # Population | % Population |
| American | 9 | 0.7% |
| English | 29 | 2.2% |
| French Canadian | 3 | 0.2% |
| German | 26 | 2.0% |
| Irish | 26 | 2.0% |
| Mexican | 3 | 0.2% |
| Scottish | 3 | 0.2% |
| Swedish | 4 | 0.3% |
| Welsh | 16 | 1.2% | View All 9 Rows |
Immigrants in Camp Hill
The most numerous immigrant groups reported in Camp Hill came from Central America (13 | 1.0%), Latin America (13 | 1.0%), and Mexico (13 | 1.0%), together accounting for 2.9% of all Camp Hill residents.
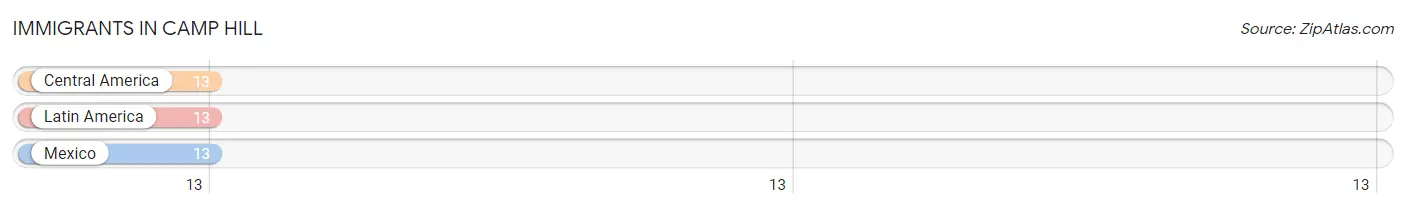
| Immigration Origin | # Population | % Population |
| Central America | 13 | 1.0% |
| Latin America | 13 | 1.0% |
| Mexico | 13 | 1.0% | View All 3 Rows |
Sex and Age in Camp Hill
Sex and Age in Camp Hill
The most populous age groups in Camp Hill are 15 to 19 Years (115 | 18.5%) for men and 40 to 44 Years (81 | 11.6%) for women.
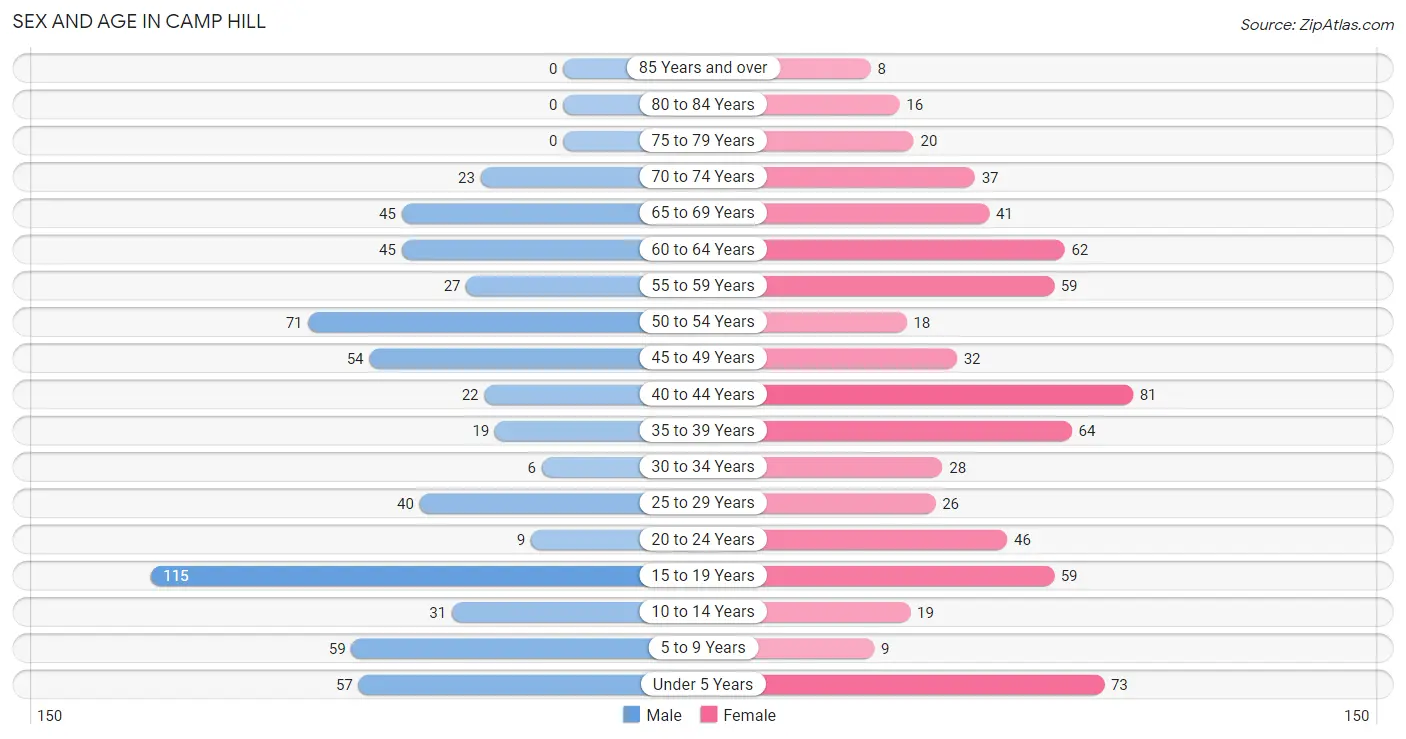
| Age Bracket | Male | Female |
| Under 5 Years | 57 (9.1%) | 73 (10.5%) |
| 5 to 9 Years | 59 (9.5%) | 9 (1.3%) |
| 10 to 14 Years | 31 (5.0%) | 19 (2.7%) |
| 15 to 19 Years | 115 (18.5%) | 59 (8.5%) |
| 20 to 24 Years | 9 (1.4%) | 46 (6.6%) |
| 25 to 29 Years | 40 (6.4%) | 26 (3.7%) |
| 30 to 34 Years | 6 (1.0%) | 28 (4.0%) |
| 35 to 39 Years | 19 (3.0%) | 64 (9.2%) |
| 40 to 44 Years | 22 (3.5%) | 81 (11.6%) |
| 45 to 49 Years | 54 (8.7%) | 32 (4.6%) |
| 50 to 54 Years | 71 (11.4%) | 18 (2.6%) |
| 55 to 59 Years | 27 (4.3%) | 59 (8.5%) |
| 60 to 64 Years | 45 (7.2%) | 62 (8.9%) |
| 65 to 69 Years | 45 (7.2%) | 41 (5.9%) |
| 70 to 74 Years | 23 (3.7%) | 37 (5.3%) |
| 75 to 79 Years | 0 (0.0%) | 20 (2.9%) |
| 80 to 84 Years | 0 (0.0%) | 16 (2.3%) |
| 85 Years and over | 0 (0.0%) | 8 (1.1%) |
| Total | 623 (100.0%) | 698 (100.0%) |
Families and Households in Camp Hill
Median Family Size in Camp Hill
The median family size in Camp Hill is 3.34 persons per family, with single female/mother families (235 | 71.0%) accounting for the largest median family size of 3.4 persons per family. On the other hand, single male/father families (6 | 1.8%) represent the smallest median family size with 1.67 persons per family.
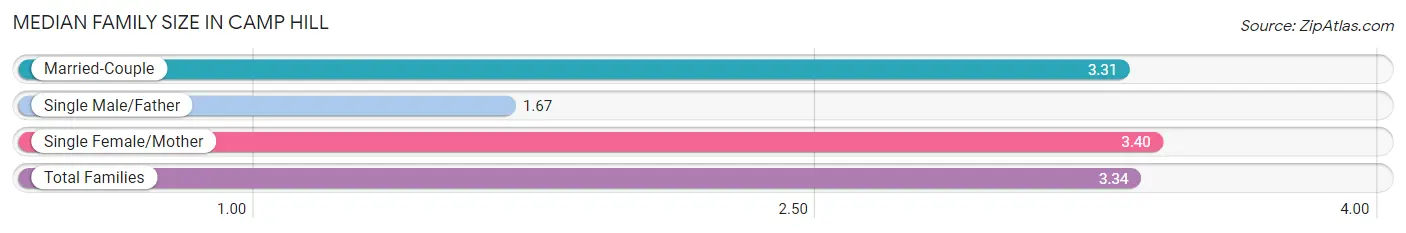
| Family Type | # Families | Family Size |
| Married-Couple | 90 (27.2%) | 3.31 |
| Single Male/Father | 6 (1.8%) | 1.67 |
| Single Female/Mother | 235 (71.0%) | 3.40 |
| Total Families | 331 (100.0%) | 3.34 |
Median Household Size in Camp Hill
The median household size in Camp Hill is 2.68 persons per household, with single female/mother households (235 | 48.6%) accounting for the largest median household size of 3.48 persons per household. non-family households (152 | 31.5%) represent the smallest median household size with 1.10 persons per household.
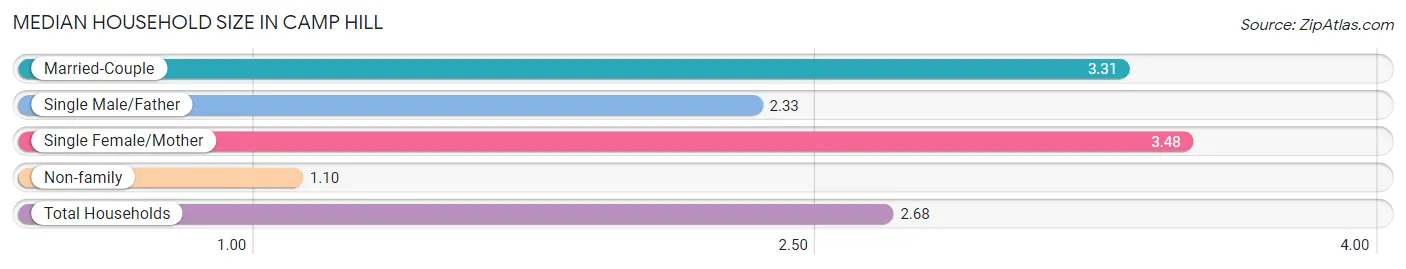
| Household Type | # Households | Household Size |
| Married-Couple | 90 (18.6%) | 3.31 |
| Single Male/Father | 6 (1.2%) | 2.33 |
| Single Female/Mother | 235 (48.6%) | 3.48 |
| Non-family | 152 (31.5%) | 1.10 |
| Total Households | 483 (100.0%) | 2.68 |
Household Size by Marriage Status in Camp Hill
Out of a total of 483 households in Camp Hill, 331 (68.5%) are family households, while 152 (31.5%) are nonfamily households. The most numerous type of family households are 2-person households, comprising 184, and the most common type of nonfamily households are 1-person households, comprising 138.
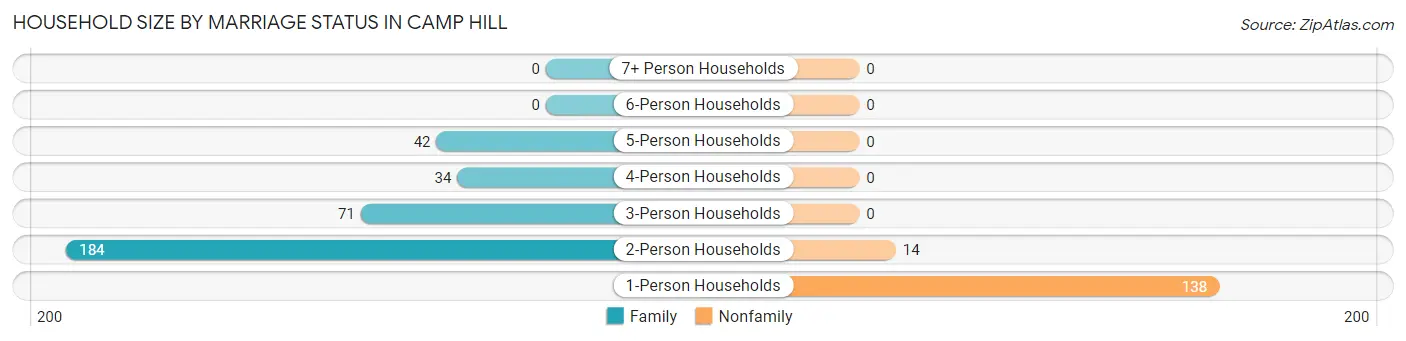
| Household Size | Family Households | Nonfamily Households |
| 1-Person Households | - | 138 (28.6%) |
| 2-Person Households | 184 (38.1%) | 14 (2.9%) |
| 3-Person Households | 71 (14.7%) | 0 (0.0%) |
| 4-Person Households | 34 (7.0%) | 0 (0.0%) |
| 5-Person Households | 42 (8.7%) | 0 (0.0%) |
| 6-Person Households | 0 (0.0%) | 0 (0.0%) |
| 7+ Person Households | 0 (0.0%) | 0 (0.0%) |
| Total | 331 (68.5%) | 152 (31.5%) |
Female Fertility in Camp Hill
Fertility by Age in Camp Hill
Average fertility rate in Camp Hill is 104.0 births per 1,000 women. Women in the age bracket of 20 to 34 years have the highest fertility rate with 350.0 births per 1,000 women. Women in the age bracket of 20 to 34 years acount for 100.0% of all women with births.
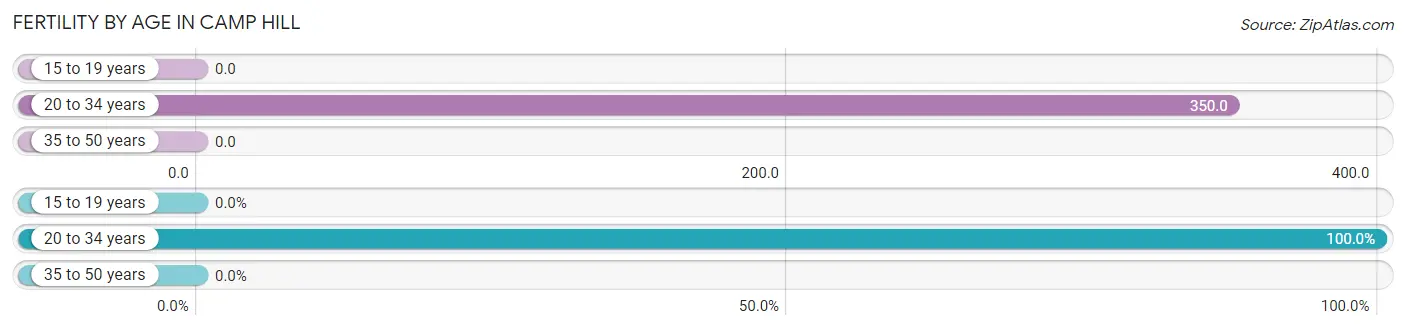
| Age Bracket | Women with Births | Births / 1,000 Women |
| 15 to 19 years | 0 (0.0%) | 0.0 |
| 20 to 34 years | 35 (100.0%) | 350.0 |
| 35 to 50 years | 0 (0.0%) | 0.0 |
| Total | 35 (100.0%) | 104.0 |
Fertility by Age by Marriage Status in Camp Hill
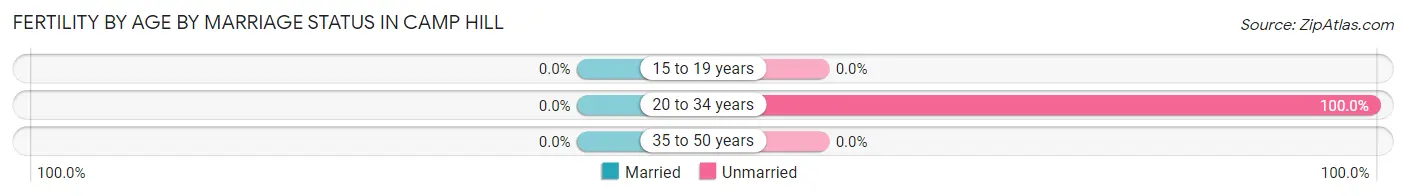
| Age Bracket | Married | Unmarried |
| 15 to 19 years | 0 (0.0%) | 0 (0.0%) |
| 20 to 34 years | 0 (0.0%) | 35 (100.0%) |
| 35 to 50 years | 0 (0.0%) | 0 (0.0%) |
| Total | 0 (0.0%) | 35 (100.0%) |
Fertility by Education in Camp Hill
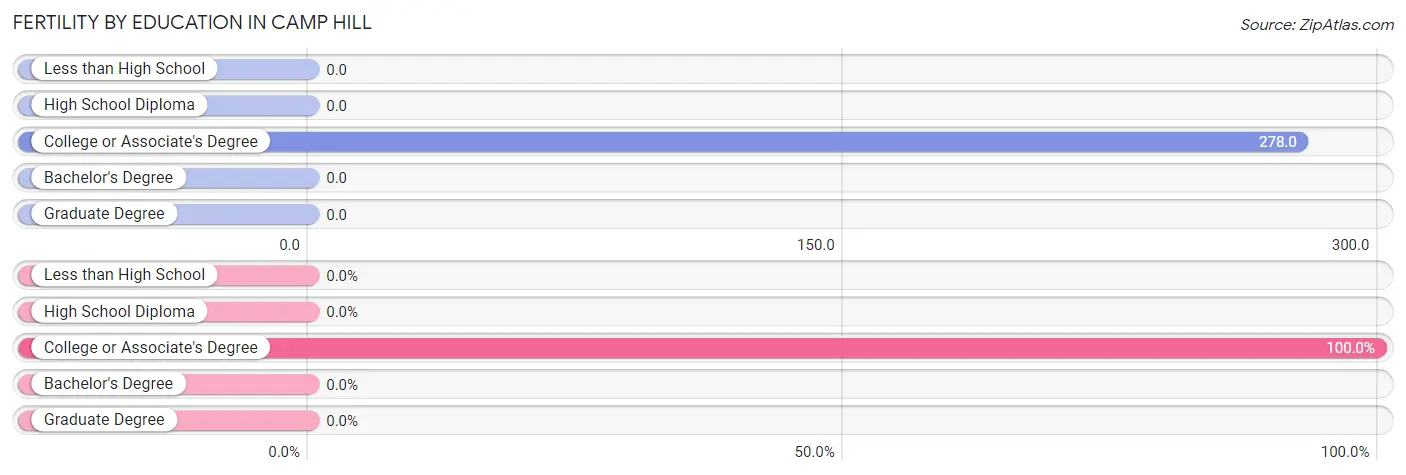
| Educational Attainment | Women with Births | Births / 1,000 Women |
| Less than High School | 0 (0.0%) | 0.0 |
| High School Diploma | 0 (0.0%) | 0.0 |
| College or Associate's Degree | 35 (100.0%) | 278.0 |
| Bachelor's Degree | 0 (0.0%) | 0.0 |
| Graduate Degree | 0 (0.0%) | 0.0 |
| Total | 35 (100.0%) | 104.0 |
Fertility by Education by Marriage Status in Camp Hill
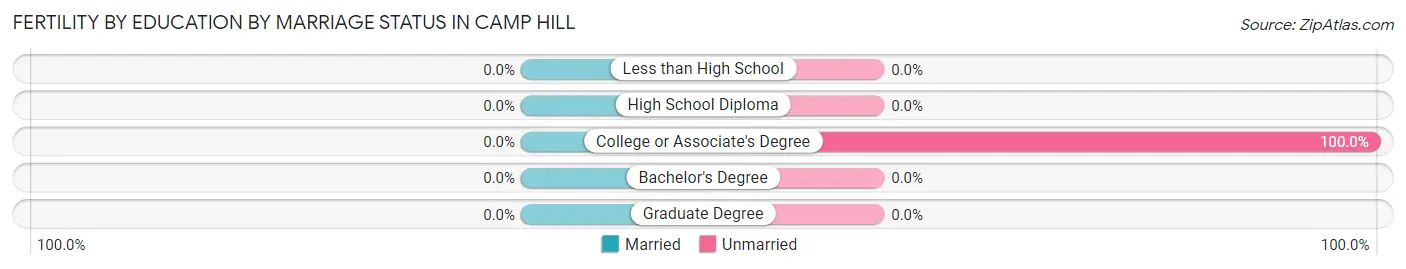
| Educational Attainment | Married | Unmarried |
| Less than High School | 0 (0.0%) | 0 (0.0%) |
| High School Diploma | 0 (0.0%) | 0 (0.0%) |
| College or Associate's Degree | 0 (0.0%) | 35 (100.0%) |
| Bachelor's Degree | 0 (0.0%) | 0 (0.0%) |
| Graduate Degree | 0 (0.0%) | 0 (0.0%) |
| Total | 0 (0.0%) | 35 (100.0%) |
Employment Characteristics in Camp Hill
Employment by Class of Employer in Camp Hill
Among the 215 employed individuals in Camp Hill, private company employees (180 | 83.7%), not-for-profit organizations (20 | 9.3%), and local government employees (6 | 2.8%) make up the most common classes of employment.
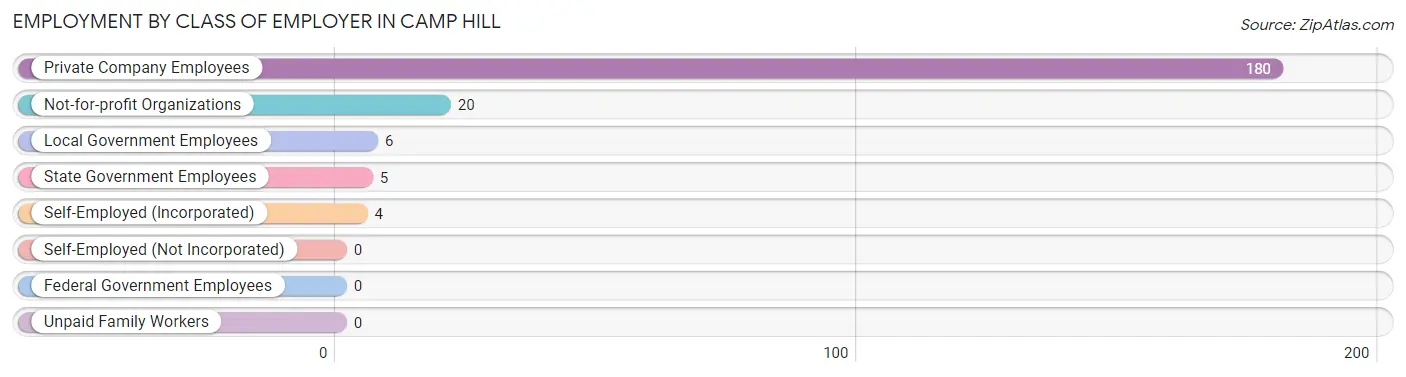
| Employer Class | # Employees | % Employees |
| Private Company Employees | 180 | 83.7% |
| Self-Employed (Incorporated) | 4 | 1.9% |
| Self-Employed (Not Incorporated) | 0 | 0.0% |
| Not-for-profit Organizations | 20 | 9.3% |
| Local Government Employees | 6 | 2.8% |
| State Government Employees | 5 | 2.3% |
| Federal Government Employees | 0 | 0.0% |
| Unpaid Family Workers | 0 | 0.0% |
| Total | 215 | 100.0% |
Employment Status by Age in Camp Hill
According to the labor force statistics for Camp Hill, out of the total population over 16 years of age (993), 31.0% or 308 individuals are in the labor force, with 21.8% or 67 of them unemployed. The age group with the highest labor force participation rate is 25 to 29 years, with 100.0% or 66 individuals in the labor force. Within the labor force, the 25 to 29 years age range has the highest percentage of unemployed individuals, with 83.3% or 55 of them being unemployed.
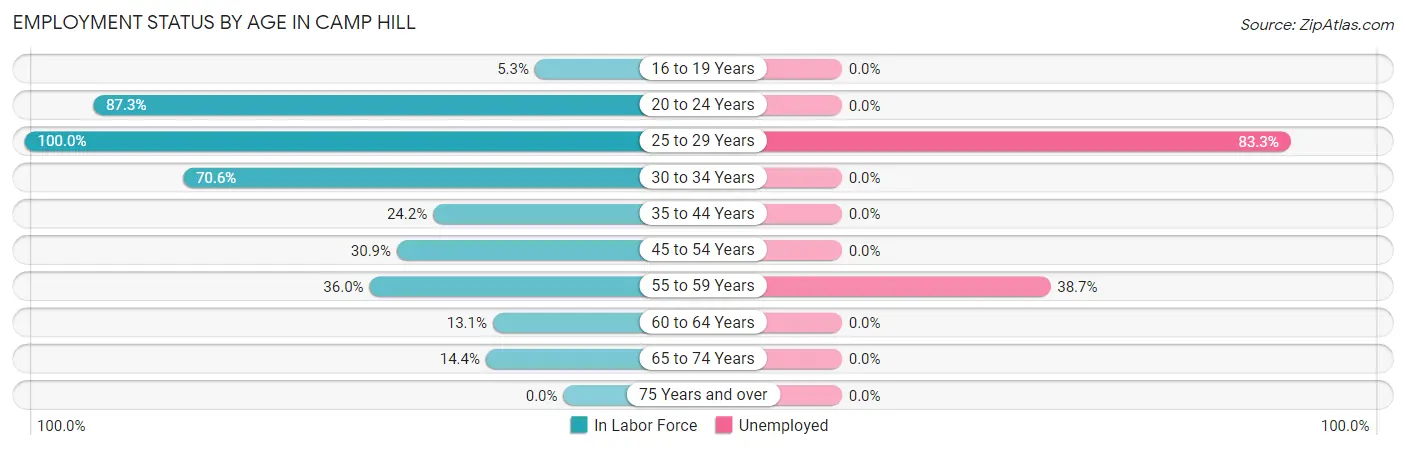
| Age Bracket | In Labor Force | Unemployed |
| 16 to 19 Years | 5 (5.3%) | 0 (0.0%) |
| 20 to 24 Years | 48 (87.3%) | 0 (0.0%) |
| 25 to 29 Years | 66 (100.0%) | 55 (83.3%) |
| 30 to 34 Years | 24 (70.6%) | 0 (0.0%) |
| 35 to 44 Years | 45 (24.2%) | 0 (0.0%) |
| 45 to 54 Years | 54 (30.9%) | 0 (0.0%) |
| 55 to 59 Years | 31 (36.0%) | 12 (38.7%) |
| 60 to 64 Years | 14 (13.1%) | 0 (0.0%) |
| 65 to 74 Years | 21 (14.4%) | 0 (0.0%) |
| 75 Years and over | 0 (0.0%) | 0 (0.0%) |
| Total | 308 (31.0%) | 67 (21.8%) |
Employment Status by Educational Attainment in Camp Hill
According to labor force statistics for Camp Hill, 35.8% of individuals (234) out of the total population between 25 and 64 years of age (654) are in the labor force, with 28.6% or 67 of them being unemployed. The group with the highest labor force participation rate are those with the educational attainment of college / associate degree, with 61.9% or 91 individuals in the labor force. Within the labor force, individuals with bachelor's degree or higher education have the highest percentage of unemployment, with 38.7% or 12 of them being unemployed.
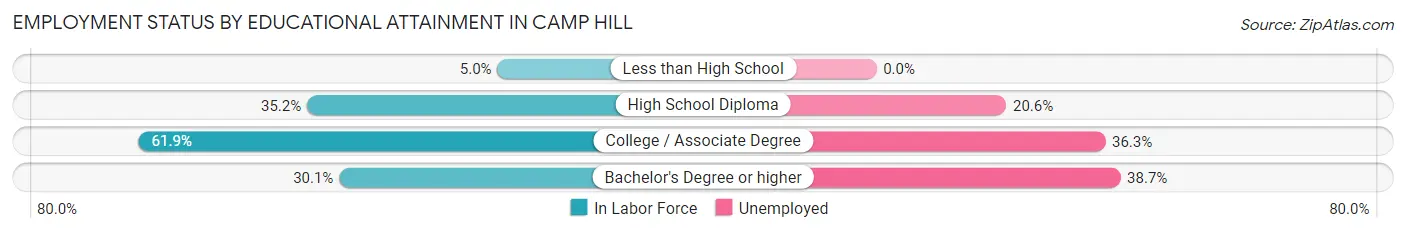
| Educational Attainment | In Labor Force | Unemployed |
| Less than High School | 5 (5.0%) | 0 (0.0%) |
| High School Diploma | 107 (35.2%) | 63 (20.6%) |
| College / Associate Degree | 91 (61.9%) | 53 (36.3%) |
| Bachelor's Degree or higher | 31 (30.1%) | 40 (38.7%) |
| Total | 234 (35.8%) | 187 (28.6%) |
Employment Occupations by Sex in Camp Hill
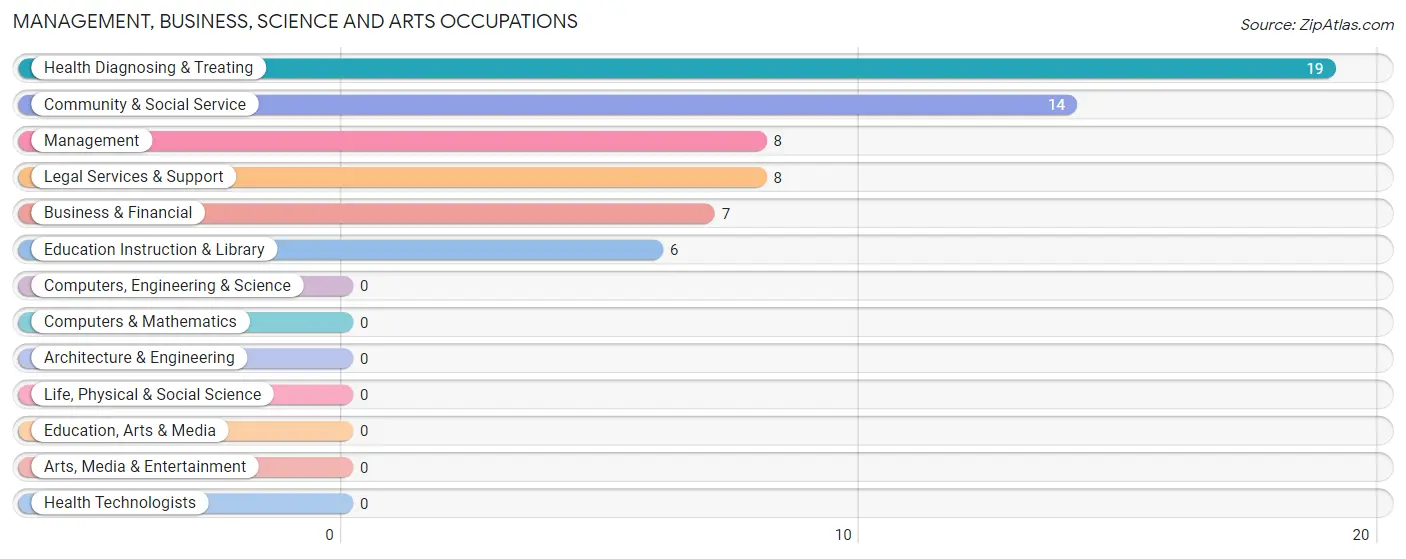
Management, Business, Science and Arts Occupations
The most common Management, Business, Science and Arts occupations in Camp Hill are Health Diagnosing & Treating (19 | 7.9%), Community & Social Service (14 | 5.8%), Management (8 | 3.3%), Legal Services & Support (8 | 3.3%), and Business & Financial (7 | 2.9%).
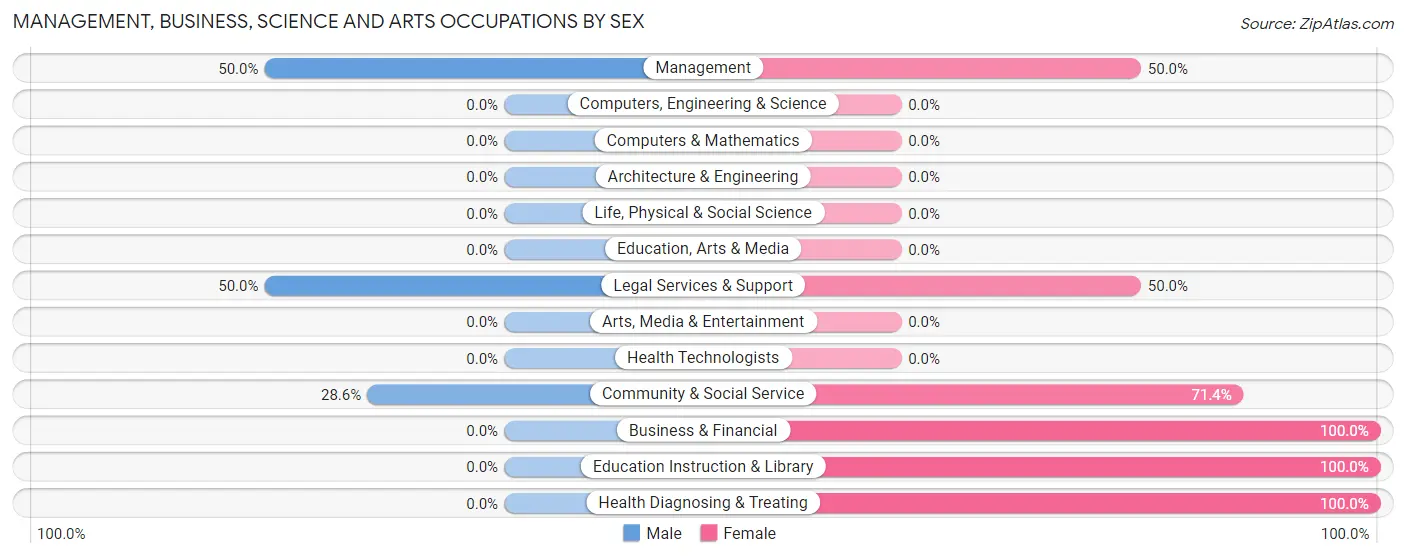
Management, Business, Science and Arts Occupations by Sex
Within the Management, Business, Science and Arts occupations in Camp Hill, the most male-oriented occupations are Management (50.0%), Legal Services & Support (50.0%), and Community & Social Service (28.6%), while the most female-oriented occupations are Business & Financial (100.0%), Education Instruction & Library (100.0%), and Health Diagnosing & Treating (100.0%).
| Occupation | Male | Female |
| Management | 4 (50.0%) | 4 (50.0%) |
| Business & Financial | 0 (0.0%) | 7 (100.0%) |
| Computers, Engineering & Science | 0 (0.0%) | 0 (0.0%) |
| Computers & Mathematics | 0 (0.0%) | 0 (0.0%) |
| Architecture & Engineering | 0 (0.0%) | 0 (0.0%) |
| Life, Physical & Social Science | 0 (0.0%) | 0 (0.0%) |
| Community & Social Service | 4 (28.6%) | 10 (71.4%) |
| Education, Arts & Media | 0 (0.0%) | 0 (0.0%) |
| Legal Services & Support | 4 (50.0%) | 4 (50.0%) |
| Education Instruction & Library | 0 (0.0%) | 6 (100.0%) |
| Arts, Media & Entertainment | 0 (0.0%) | 0 (0.0%) |
| Health Diagnosing & Treating | 0 (0.0%) | 19 (100.0%) |
| Health Technologists | 0 (0.0%) | 0 (0.0%) |
| Total (Category) | 8 (16.7%) | 40 (83.3%) |
| Total (Overall) | 78 (32.4%) | 163 (67.6%) |
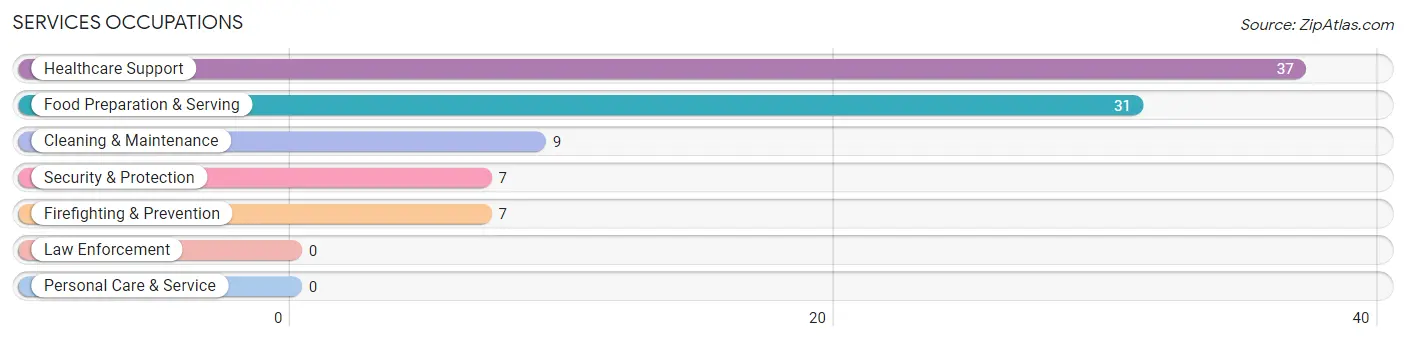
Services Occupations
The most common Services occupations in Camp Hill are Healthcare Support (37 | 15.3%), Food Preparation & Serving (31 | 12.9%), Cleaning & Maintenance (9 | 3.7%), Security & Protection (7 | 2.9%), and Firefighting & Prevention (7 | 2.9%).
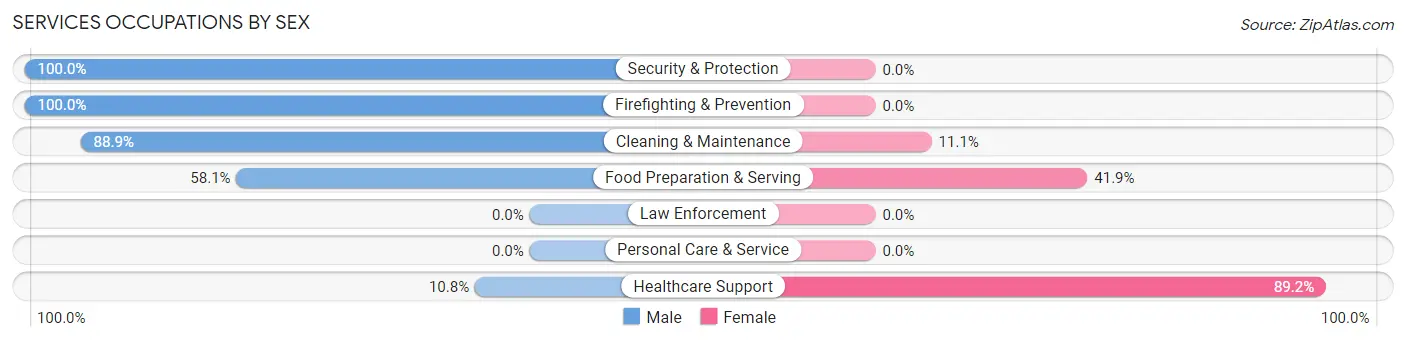
Services Occupations by Sex
Within the Services occupations in Camp Hill, the most male-oriented occupations are Security & Protection (100.0%), Firefighting & Prevention (100.0%), and Cleaning & Maintenance (88.9%), while the most female-oriented occupations are Healthcare Support (89.2%), Food Preparation & Serving (41.9%), and Cleaning & Maintenance (11.1%).
| Occupation | Male | Female |
| Healthcare Support | 4 (10.8%) | 33 (89.2%) |
| Security & Protection | 7 (100.0%) | 0 (0.0%) |
| Firefighting & Prevention | 7 (100.0%) | 0 (0.0%) |
| Law Enforcement | 0 (0.0%) | 0 (0.0%) |
| Food Preparation & Serving | 18 (58.1%) | 13 (41.9%) |
| Cleaning & Maintenance | 8 (88.9%) | 1 (11.1%) |
| Personal Care & Service | 0 (0.0%) | 0 (0.0%) |
| Total (Category) | 37 (44.1%) | 47 (55.9%) |
| Total (Overall) | 78 (32.4%) | 163 (67.6%) |
Sales and Office Occupations
The most common Sales and Office occupations in Camp Hill are Sales & Related (22 | 9.1%), and Office & Administration (21 | 8.7%).
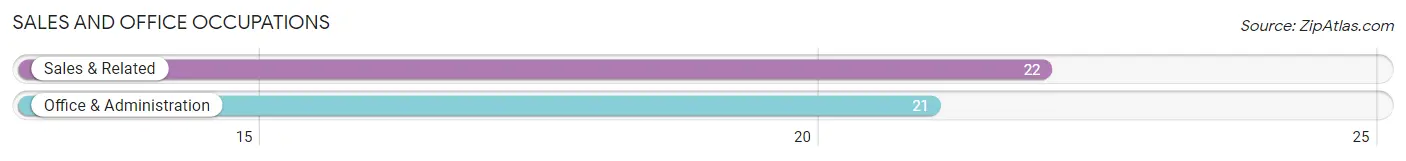
Sales and Office Occupations by Sex
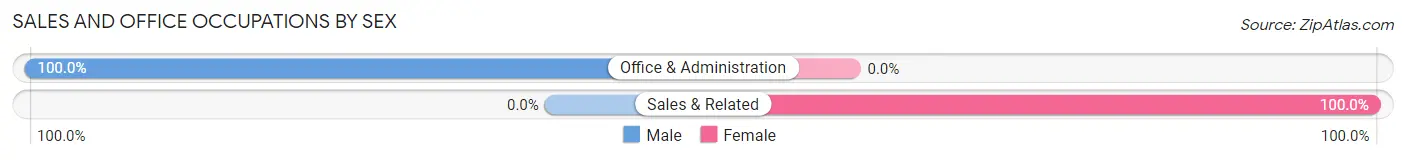
| Occupation | Male | Female |
| Sales & Related | 0 (0.0%) | 22 (100.0%) |
| Office & Administration | 21 (100.0%) | 0 (0.0%) |
| Total (Category) | 21 (48.8%) | 22 (51.2%) |
| Total (Overall) | 78 (32.4%) | 163 (67.6%) |
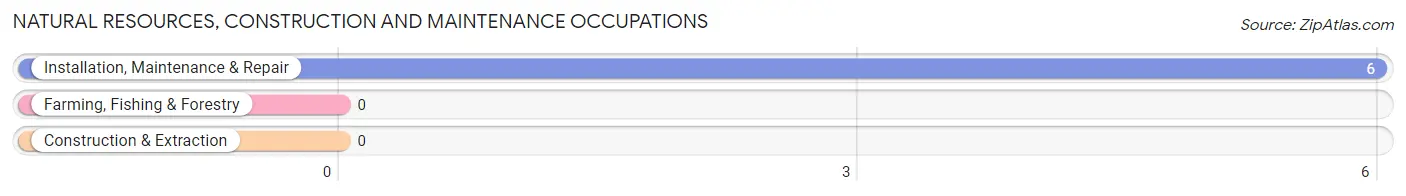
Natural Resources, Construction and Maintenance Occupations
The most common Natural Resources, Construction and Maintenance occupations in Camp Hill are , and Installation, Maintenance & Repair (6 | 2.5%).
Natural Resources, Construction and Maintenance Occupations by Sex
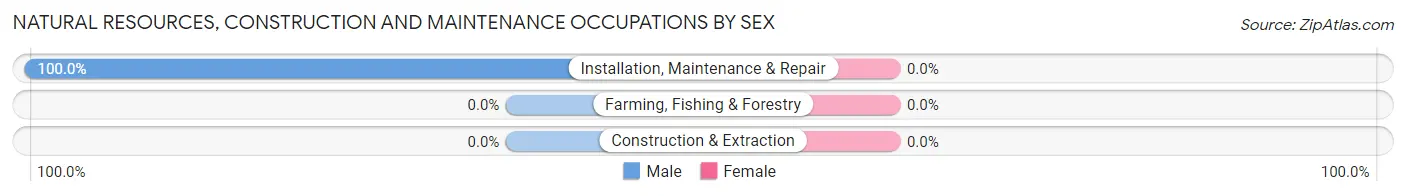
| Occupation | Male | Female |
| Farming, Fishing & Forestry | 0 (0.0%) | 0 (0.0%) |
| Construction & Extraction | 0 (0.0%) | 0 (0.0%) |
| Installation, Maintenance & Repair | 6 (100.0%) | 0 (0.0%) |
| Total (Category) | 6 (100.0%) | 0 (0.0%) |
| Total (Overall) | 78 (32.4%) | 163 (67.6%) |
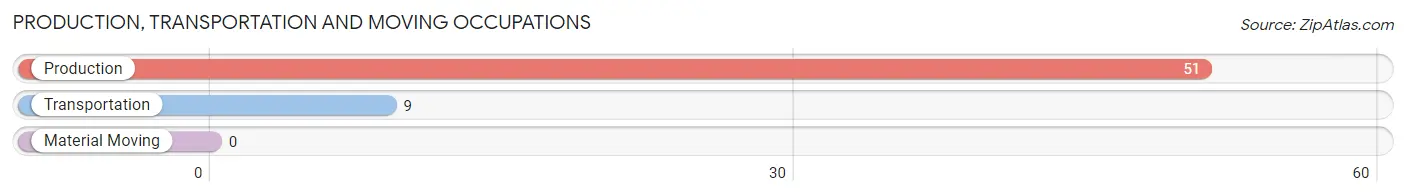
Production, Transportation and Moving Occupations
The most common Production, Transportation and Moving occupations in Camp Hill are Production (51 | 21.2%), and Transportation (9 | 3.7%).
Production, Transportation and Moving Occupations by Sex
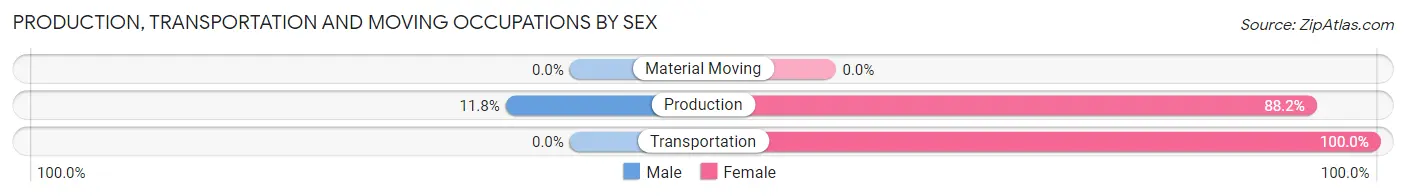
| Occupation | Male | Female |
| Production | 6 (11.8%) | 45 (88.2%) |
| Transportation | 0 (0.0%) | 9 (100.0%) |
| Material Moving | 0 (0.0%) | 0 (0.0%) |
| Total (Category) | 6 (10.0%) | 54 (90.0%) |
| Total (Overall) | 78 (32.4%) | 163 (67.6%) |
Employment Industries by Sex in Camp Hill
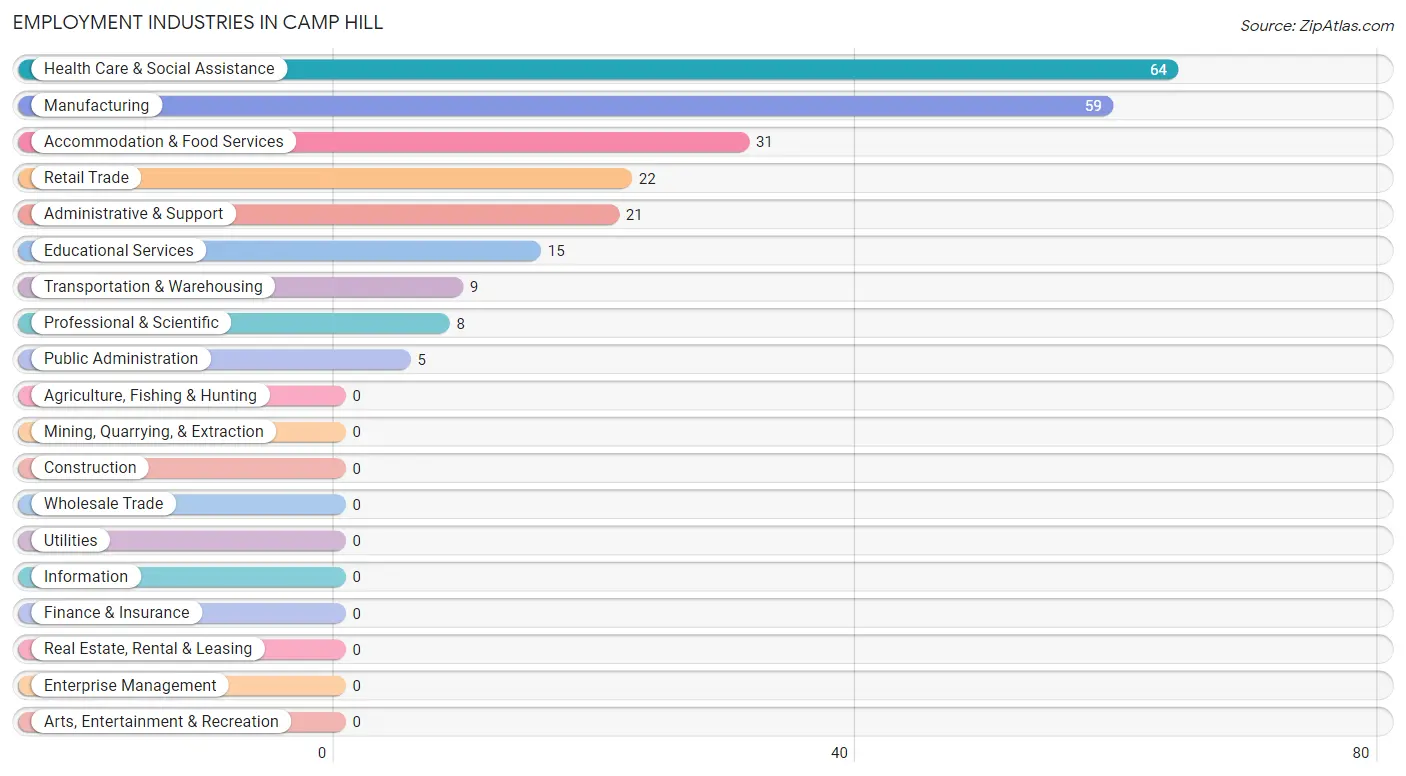
Employment Industries in Camp Hill
The major employment industries in Camp Hill include Health Care & Social Assistance (64 | 26.6%), Manufacturing (59 | 24.5%), Accommodation & Food Services (31 | 12.9%), Retail Trade (22 | 9.1%), and Administrative & Support (21 | 8.7%).
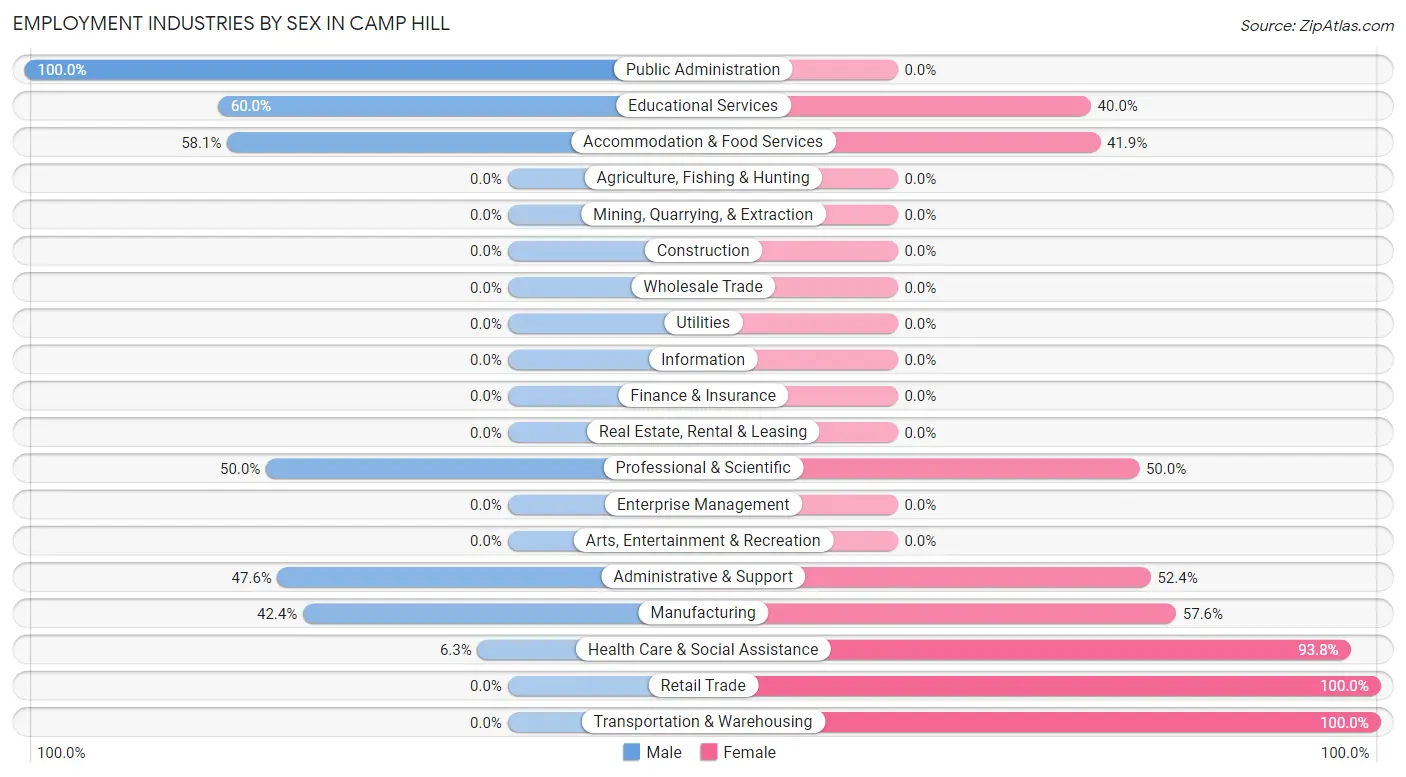
Employment Industries by Sex in Camp Hill
The Camp Hill industries that see more men than women are Public Administration (100.0%), Educational Services (60.0%), and Accommodation & Food Services (58.1%), whereas the industries that tend to have a higher number of women are Retail Trade (100.0%), Transportation & Warehousing (100.0%), and Health Care & Social Assistance (93.8%).
| Industry | Male | Female |
| Agriculture, Fishing & Hunting | 0 (0.0%) | 0 (0.0%) |
| Mining, Quarrying, & Extraction | 0 (0.0%) | 0 (0.0%) |
| Construction | 0 (0.0%) | 0 (0.0%) |
| Manufacturing | 25 (42.4%) | 34 (57.6%) |
| Wholesale Trade | 0 (0.0%) | 0 (0.0%) |
| Retail Trade | 0 (0.0%) | 22 (100.0%) |
| Transportation & Warehousing | 0 (0.0%) | 9 (100.0%) |
| Utilities | 0 (0.0%) | 0 (0.0%) |
| Information | 0 (0.0%) | 0 (0.0%) |
| Finance & Insurance | 0 (0.0%) | 0 (0.0%) |
| Real Estate, Rental & Leasing | 0 (0.0%) | 0 (0.0%) |
| Professional & Scientific | 4 (50.0%) | 4 (50.0%) |
| Enterprise Management | 0 (0.0%) | 0 (0.0%) |
| Administrative & Support | 10 (47.6%) | 11 (52.4%) |
| Educational Services | 9 (60.0%) | 6 (40.0%) |
| Health Care & Social Assistance | 4 (6.2%) | 60 (93.8%) |
| Arts, Entertainment & Recreation | 0 (0.0%) | 0 (0.0%) |
| Accommodation & Food Services | 18 (58.1%) | 13 (41.9%) |
| Public Administration | 5 (100.0%) | 0 (0.0%) |
| Total | 78 (32.4%) | 163 (67.6%) |
Education in Camp Hill
School Enrollment in Camp Hill
The most common levels of schooling among the 361 students in Camp Hill are high school (159 | 44.0%), college / undergraduate (64 | 17.7%), and elementary school (59 | 16.3%).
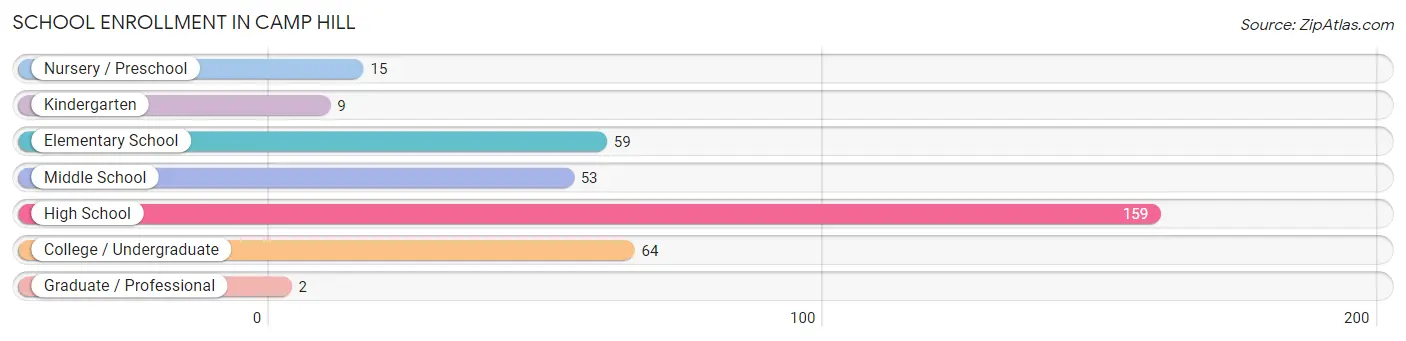
| School Level | # Students | % Students |
| Nursery / Preschool | 15 | 4.2% |
| Kindergarten | 9 | 2.5% |
| Elementary School | 59 | 16.3% |
| Middle School | 53 | 14.7% |
| High School | 159 | 44.0% |
| College / Undergraduate | 64 | 17.7% |
| Graduate / Professional | 2 | 0.5% |
| Total | 361 | 100.0% |
School Enrollment by Age by Funding Source in Camp Hill
Out of a total of 361 students who are enrolled in schools in Camp Hill, 46 (12.7%) attend a private institution, while the remaining 315 (87.3%) are enrolled in public schools. The age group of 20 to 24 year olds has the highest likelihood of being enrolled in private schools, with 22 (45.8% in the age bracket) enrolled. Conversely, the age group of 3 to 4 year olds has the lowest likelihood of being enrolled in a private school, with 15 (100.0% in the age bracket) attending a public institution.
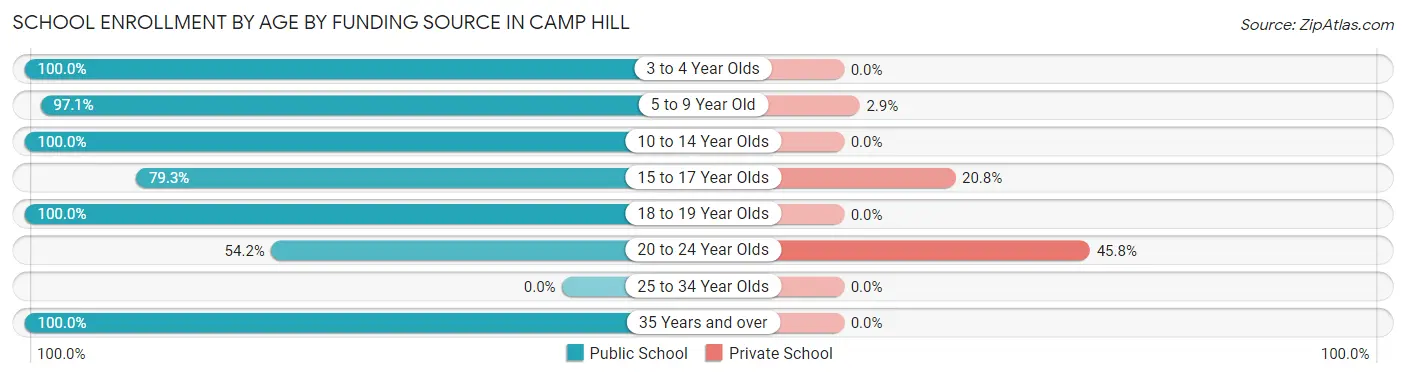
| Age Bracket | Public School | Private School |
| 3 to 4 Year Olds | 15 (100.0%) | 0 (0.0%) |
| 5 to 9 Year Old | 66 (97.1%) | 2 (2.9%) |
| 10 to 14 Year Olds | 50 (100.0%) | 0 (0.0%) |
| 15 to 17 Year Olds | 84 (79.2%) | 22 (20.7%) |
| 18 to 19 Year Olds | 68 (100.0%) | 0 (0.0%) |
| 20 to 24 Year Olds | 26 (54.2%) | 22 (45.8%) |
| 25 to 34 Year Olds | 0 (0.0%) | 0 (0.0%) |
| 35 Years and over | 6 (100.0%) | 0 (0.0%) |
| Total | 315 (87.3%) | 46 (12.7%) |
Educational Attainment by Field of Study in Camp Hill
Communications (43 | 36.7%), education (32 | 27.4%), engineering (16 | 13.7%), liberal arts & history (8 | 6.8%), and computers & mathematics (4 | 3.4%) are the most common fields of study among 117 individuals in Camp Hill who have obtained a bachelor's degree or higher.
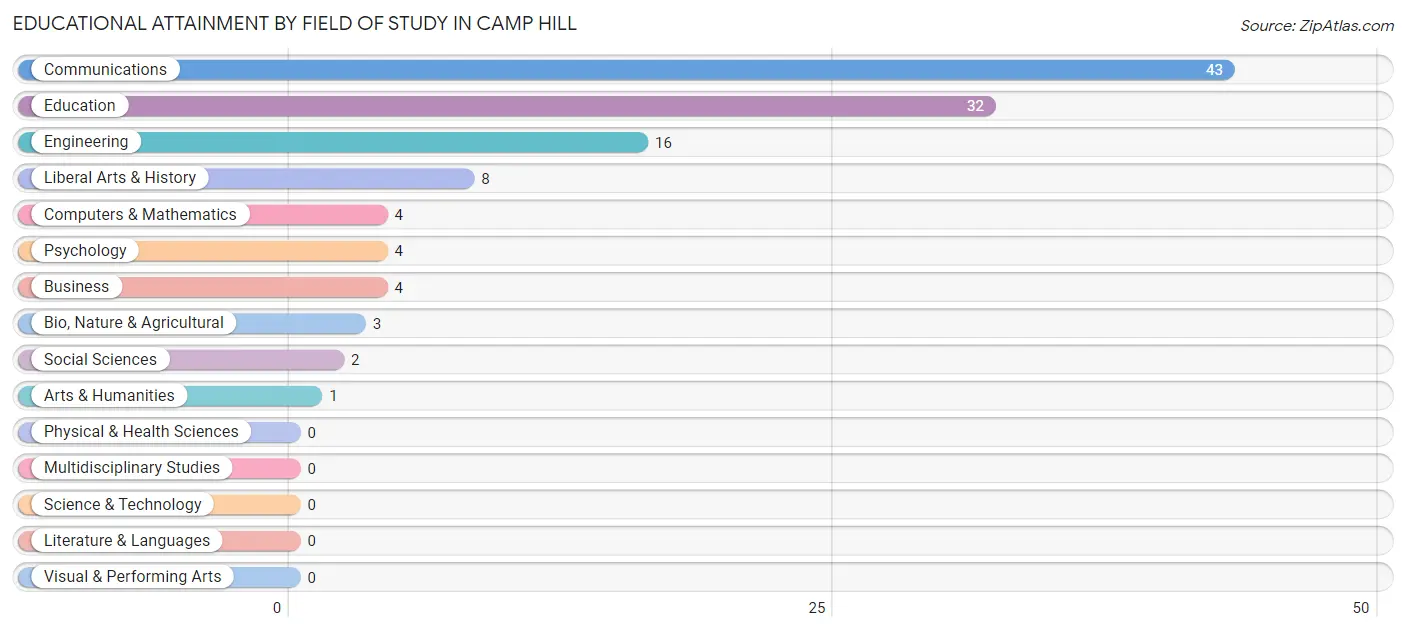
| Field of Study | # Graduates | % Graduates |
| Computers & Mathematics | 4 | 3.4% |
| Bio, Nature & Agricultural | 3 | 2.6% |
| Physical & Health Sciences | 0 | 0.0% |
| Psychology | 4 | 3.4% |
| Social Sciences | 2 | 1.7% |
| Engineering | 16 | 13.7% |
| Multidisciplinary Studies | 0 | 0.0% |
| Science & Technology | 0 | 0.0% |
| Business | 4 | 3.4% |
| Education | 32 | 27.4% |
| Literature & Languages | 0 | 0.0% |
| Liberal Arts & History | 8 | 6.8% |
| Visual & Performing Arts | 0 | 0.0% |
| Communications | 43 | 36.7% |
| Arts & Humanities | 1 | 0.9% |
| Total | 117 | 100.0% |
Transportation & Commute in Camp Hill
Vehicle Availability by Sex in Camp Hill
The most prevalent vehicle ownership categories in Camp Hill are males with 2 vehicles (29, accounting for 37.2%) and females with 2 vehicles (71, making up 21.2%).
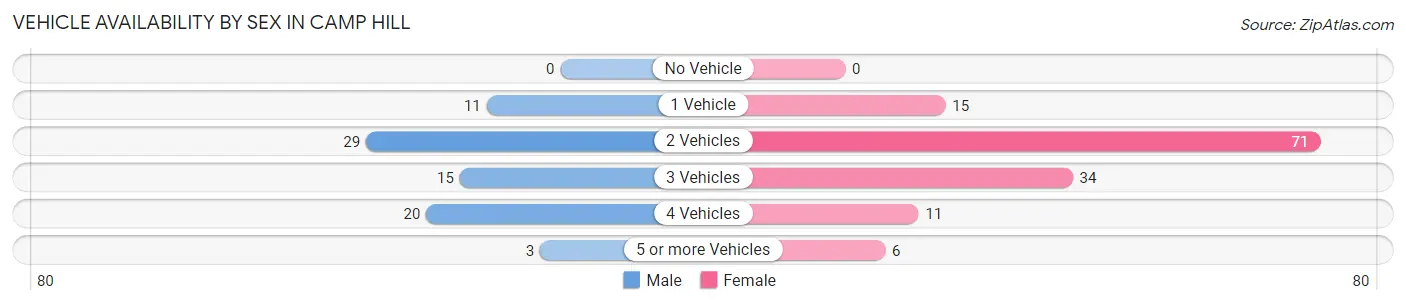
| Vehicles Available | Male | Female |
| No Vehicle | 0 (0.0%) | 0 (0.0%) |
| 1 Vehicle | 11 (14.1%) | 15 (11.0%) |
| 2 Vehicles | 29 (37.2%) | 71 (51.8%) |
| 3 Vehicles | 15 (19.2%) | 34 (24.8%) |
| 4 Vehicles | 20 (25.6%) | 11 (8.0%) |
| 5 or more Vehicles | 3 (3.8%) | 6 (4.4%) |
| Total | 78 (100.0%) | 137 (100.0%) |
Commute Time in Camp Hill
The most frequently occuring commute durations in Camp Hill are 10 to 14 minutes (40 commuters, 18.6%), 25 to 29 minutes (31 commuters, 14.4%), and 15 to 19 minutes (28 commuters, 13.0%).
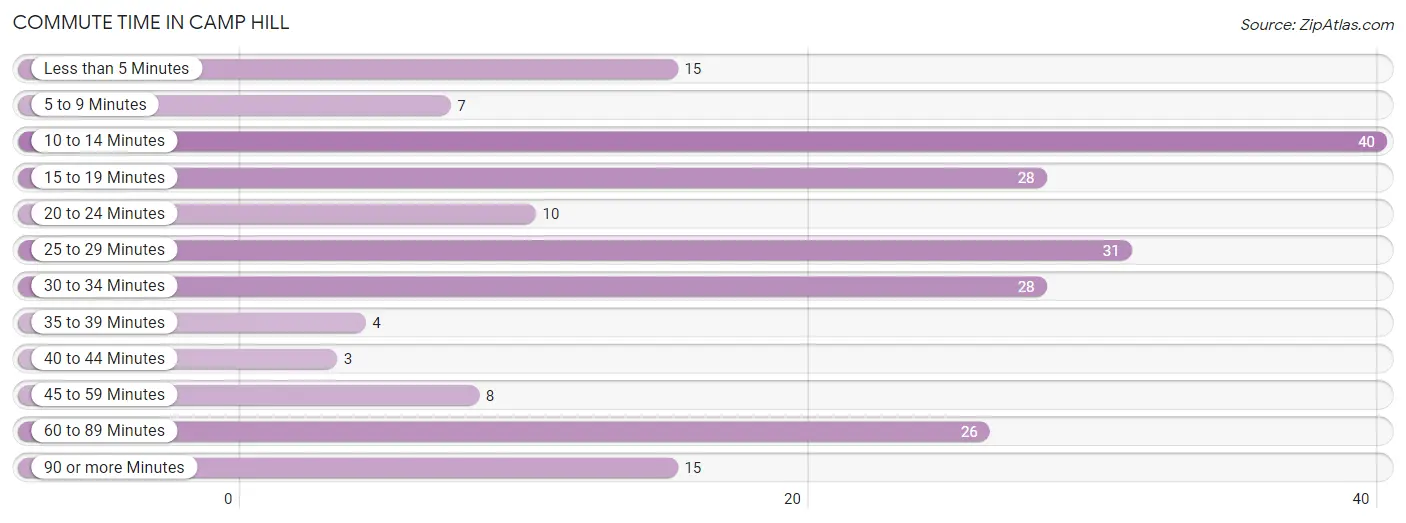
| Commute Time | # Commuters | % Commuters |
| Less than 5 Minutes | 15 | 7.0% |
| 5 to 9 Minutes | 7 | 3.3% |
| 10 to 14 Minutes | 40 | 18.6% |
| 15 to 19 Minutes | 28 | 13.0% |
| 20 to 24 Minutes | 10 | 4.6% |
| 25 to 29 Minutes | 31 | 14.4% |
| 30 to 34 Minutes | 28 | 13.0% |
| 35 to 39 Minutes | 4 | 1.9% |
| 40 to 44 Minutes | 3 | 1.4% |
| 45 to 59 Minutes | 8 | 3.7% |
| 60 to 89 Minutes | 26 | 12.1% |
| 90 or more Minutes | 15 | 7.0% |
Commute Time by Sex in Camp Hill
The most common commute times in Camp Hill are 30 to 34 minutes (28 commuters, 35.9%) for males and 10 to 14 minutes (36 commuters, 26.3%) for females.
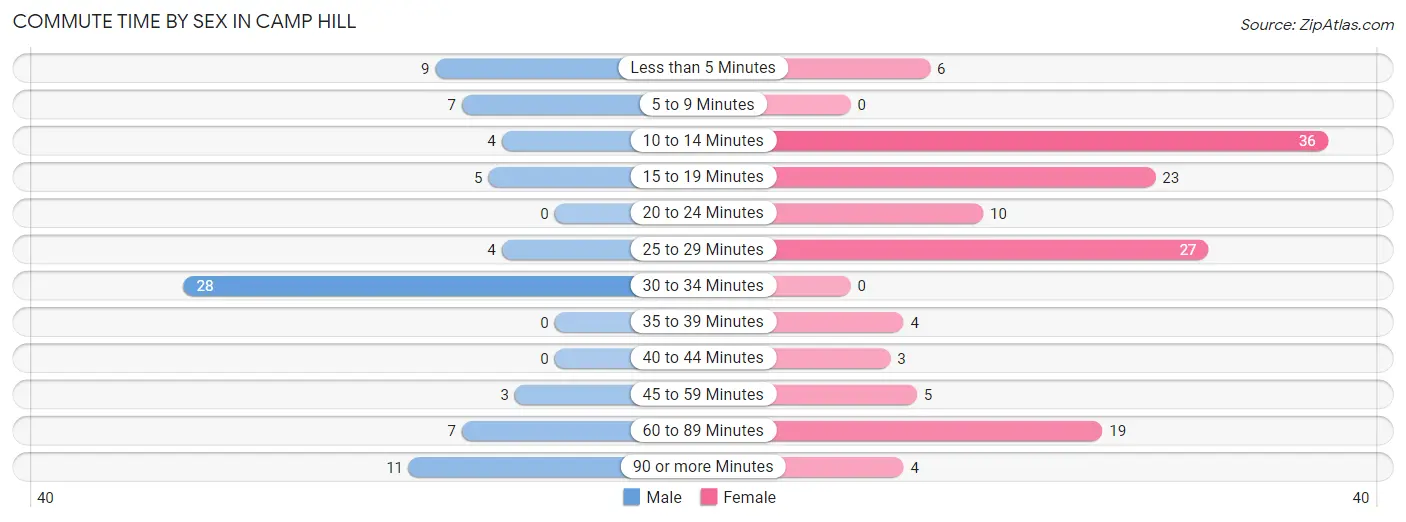
| Commute Time | Male | Female |
| Less than 5 Minutes | 9 (11.5%) | 6 (4.4%) |
| 5 to 9 Minutes | 7 (9.0%) | 0 (0.0%) |
| 10 to 14 Minutes | 4 (5.1%) | 36 (26.3%) |
| 15 to 19 Minutes | 5 (6.4%) | 23 (16.8%) |
| 20 to 24 Minutes | 0 (0.0%) | 10 (7.3%) |
| 25 to 29 Minutes | 4 (5.1%) | 27 (19.7%) |
| 30 to 34 Minutes | 28 (35.9%) | 0 (0.0%) |
| 35 to 39 Minutes | 0 (0.0%) | 4 (2.9%) |
| 40 to 44 Minutes | 0 (0.0%) | 3 (2.2%) |
| 45 to 59 Minutes | 3 (3.8%) | 5 (3.6%) |
| 60 to 89 Minutes | 7 (9.0%) | 19 (13.9%) |
| 90 or more Minutes | 11 (14.1%) | 4 (2.9%) |
Time of Departure to Work by Sex in Camp Hill
The most frequent times of departure to work in Camp Hill are 8:30 AM to 8:59 AM (19, 24.4%) for males and 4:00 PM to 11:59 PM (38, 27.7%) for females.
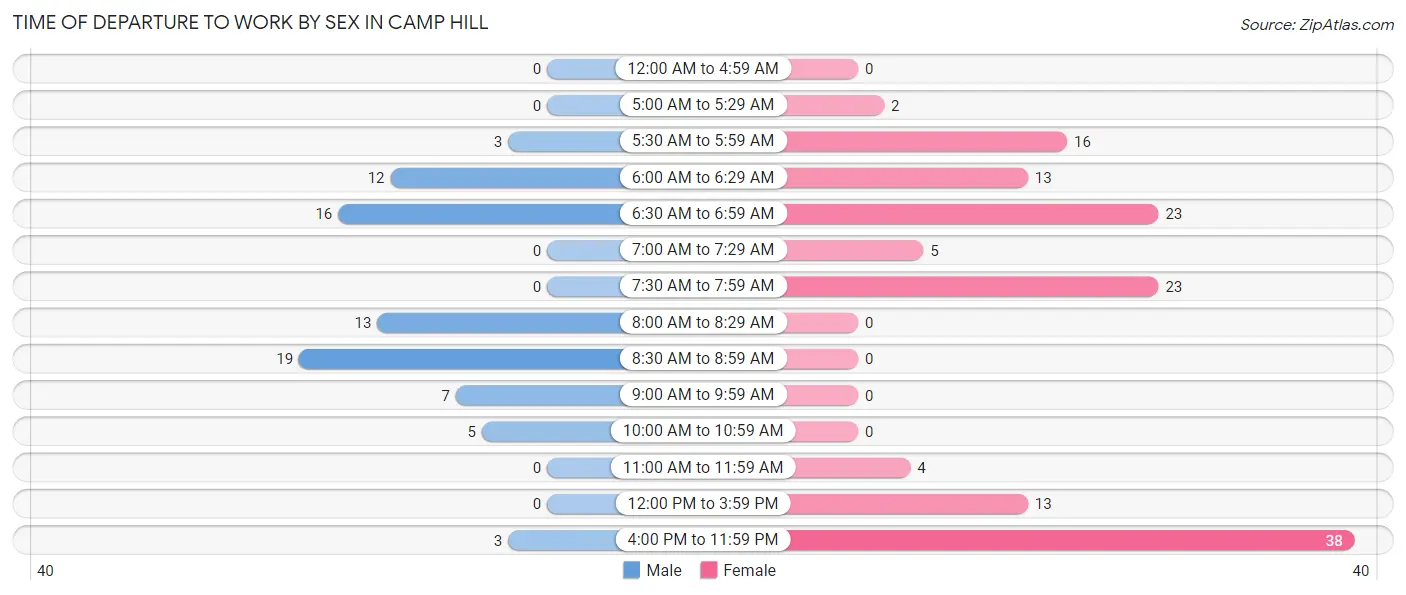
| Time of Departure | Male | Female |
| 12:00 AM to 4:59 AM | 0 (0.0%) | 0 (0.0%) |
| 5:00 AM to 5:29 AM | 0 (0.0%) | 2 (1.5%) |
| 5:30 AM to 5:59 AM | 3 (3.8%) | 16 (11.7%) |
| 6:00 AM to 6:29 AM | 12 (15.4%) | 13 (9.5%) |
| 6:30 AM to 6:59 AM | 16 (20.5%) | 23 (16.8%) |
| 7:00 AM to 7:29 AM | 0 (0.0%) | 5 (3.6%) |
| 7:30 AM to 7:59 AM | 0 (0.0%) | 23 (16.8%) |
| 8:00 AM to 8:29 AM | 13 (16.7%) | 0 (0.0%) |
| 8:30 AM to 8:59 AM | 19 (24.4%) | 0 (0.0%) |
| 9:00 AM to 9:59 AM | 7 (9.0%) | 0 (0.0%) |
| 10:00 AM to 10:59 AM | 5 (6.4%) | 0 (0.0%) |
| 11:00 AM to 11:59 AM | 0 (0.0%) | 4 (2.9%) |
| 12:00 PM to 3:59 PM | 0 (0.0%) | 13 (9.5%) |
| 4:00 PM to 11:59 PM | 3 (3.8%) | 38 (27.7%) |
| Total | 78 (100.0%) | 137 (100.0%) |
Housing Occupancy in Camp Hill
Occupancy by Ownership in Camp Hill
Of the total 483 dwellings in Camp Hill, owner-occupied units account for 370 (76.6%), while renter-occupied units make up 113 (23.4%).
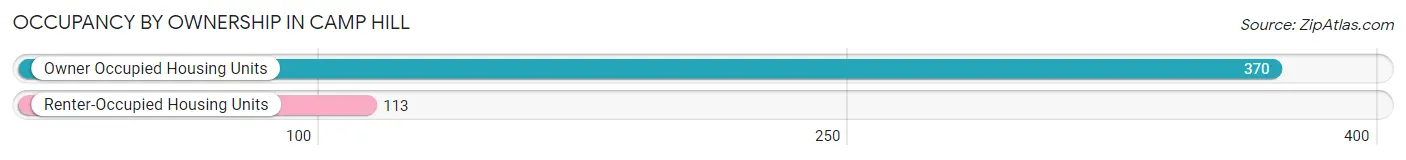
| Occupancy | # Housing Units | % Housing Units |
| Owner Occupied Housing Units | 370 | 76.6% |
| Renter-Occupied Housing Units | 113 | 23.4% |
| Total Occupied Housing Units | 483 | 100.0% |
Occupancy by Household Size in Camp Hill
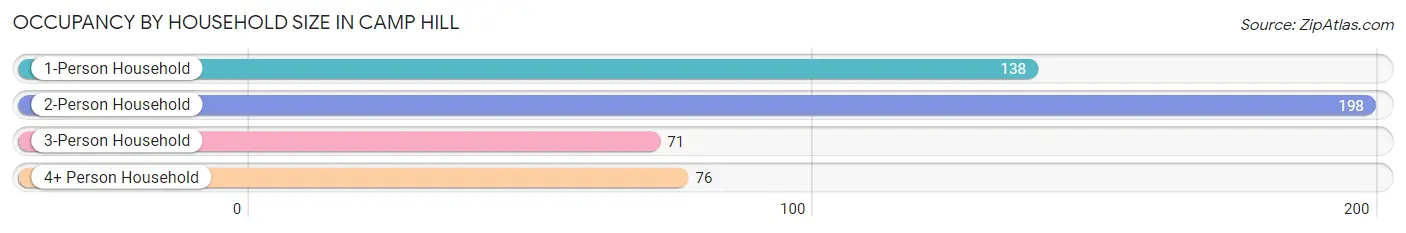
| Household Size | # Housing Units | % Housing Units |
| 1-Person Household | 138 | 28.6% |
| 2-Person Household | 198 | 41.0% |
| 3-Person Household | 71 | 14.7% |
| 4+ Person Household | 76 | 15.7% |
| Total Housing Units | 483 | 100.0% |
Occupancy by Ownership by Household Size in Camp Hill
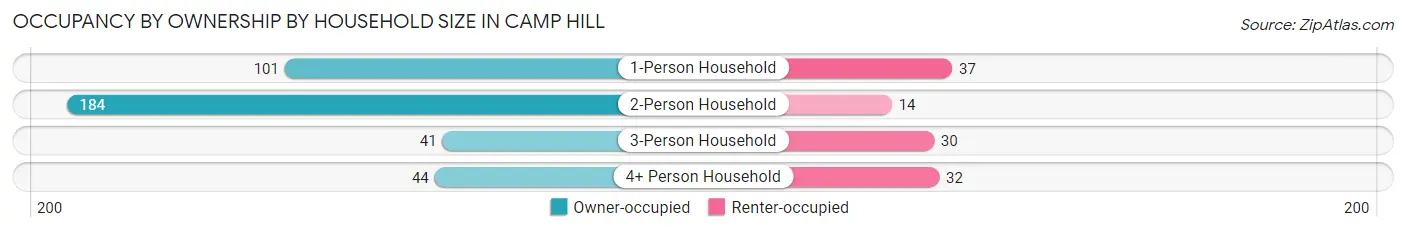
| Household Size | Owner-occupied | Renter-occupied |
| 1-Person Household | 101 (73.2%) | 37 (26.8%) |
| 2-Person Household | 184 (92.9%) | 14 (7.1%) |
| 3-Person Household | 41 (57.8%) | 30 (42.2%) |
| 4+ Person Household | 44 (57.9%) | 32 (42.1%) |
| Total Housing Units | 370 (76.6%) | 113 (23.4%) |
Occupancy by Educational Attainment in Camp Hill
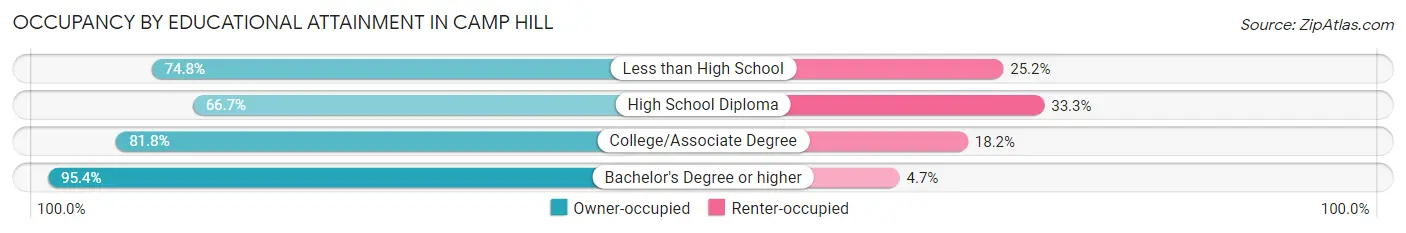
| Household Size | Owner-occupied | Renter-occupied |
| Less than High School | 92 (74.8%) | 31 (25.2%) |
| High School Diploma | 124 (66.7%) | 62 (33.3%) |
| College/Associate Degree | 72 (81.8%) | 16 (18.2%) |
| Bachelor's Degree or higher | 82 (95.4%) | 4 (4.6%) |
Occupancy by Age of Householder in Camp Hill
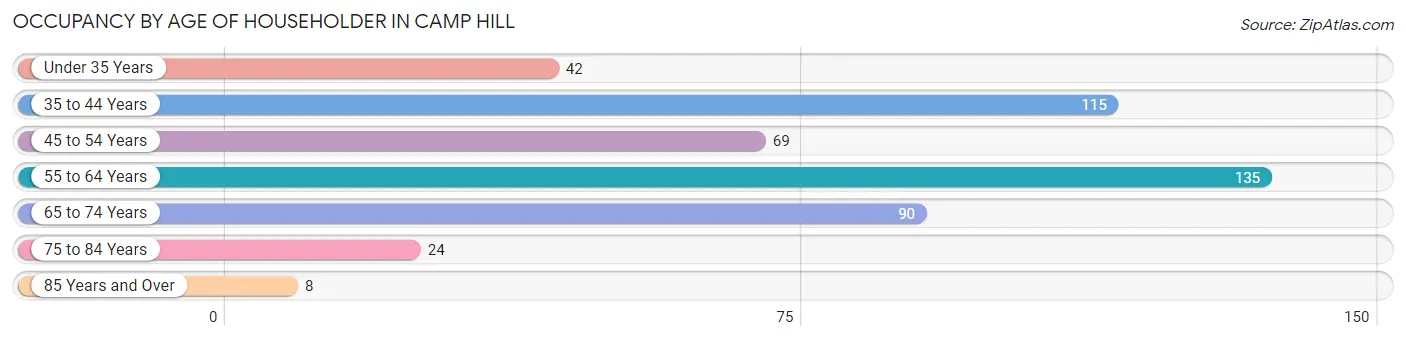
| Age Bracket | # Households | % Households |
| Under 35 Years | 42 | 8.7% |
| 35 to 44 Years | 115 | 23.8% |
| 45 to 54 Years | 69 | 14.3% |
| 55 to 64 Years | 135 | 28.0% |
| 65 to 74 Years | 90 | 18.6% |
| 75 to 84 Years | 24 | 5.0% |
| 85 Years and Over | 8 | 1.7% |
| Total | 483 | 100.0% |
Housing Finances in Camp Hill
Median Income by Occupancy in Camp Hill
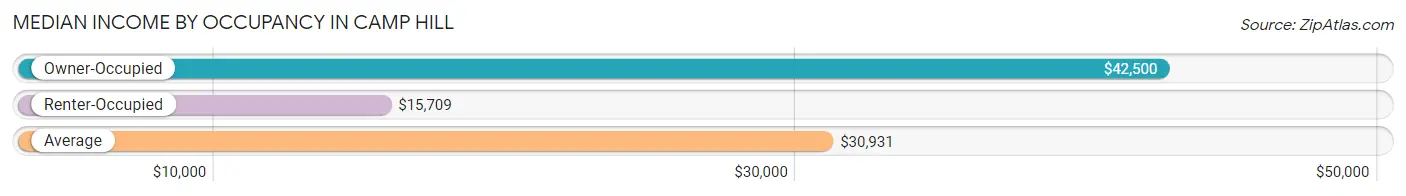
| Occupancy Type | # Households | Median Income |
| Owner-Occupied | 370 (76.6%) | $42,500 |
| Renter-Occupied | 113 (23.4%) | $15,709 |
| Average | 483 (100.0%) | $30,931 |
Occupancy by Householder Income Bracket in Camp Hill
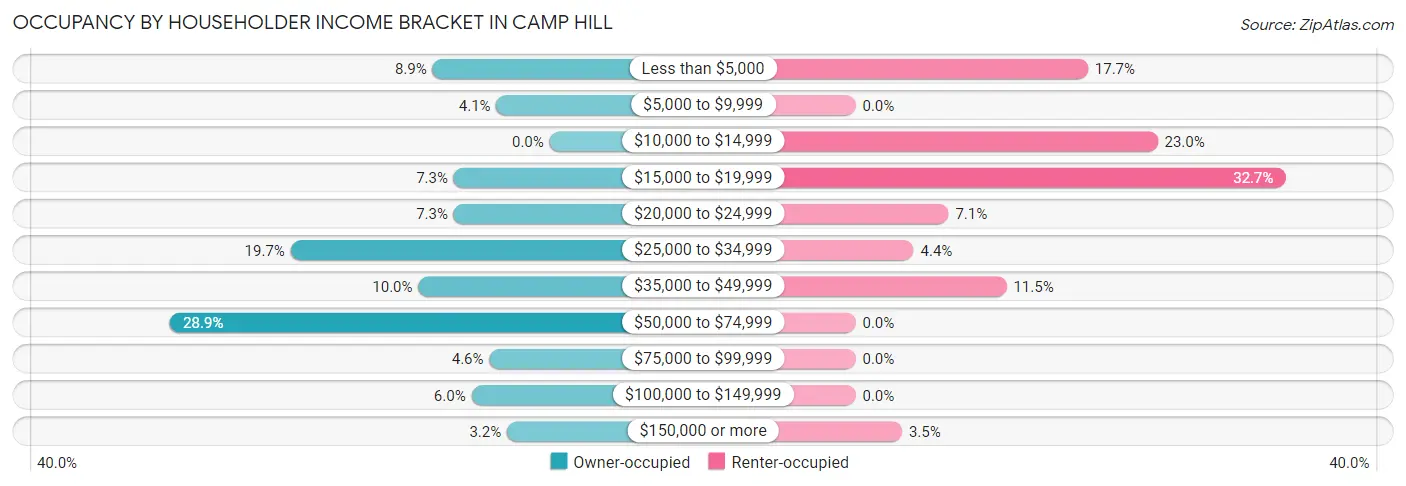
| Income Bracket | Owner-occupied | Renter-occupied |
| Less than $5,000 | 33 (8.9%) | 20 (17.7%) |
| $5,000 to $9,999 | 15 (4.1%) | 0 (0.0%) |
| $10,000 to $14,999 | 0 (0.0%) | 26 (23.0%) |
| $15,000 to $19,999 | 27 (7.3%) | 37 (32.7%) |
| $20,000 to $24,999 | 27 (7.3%) | 8 (7.1%) |
| $25,000 to $34,999 | 73 (19.7%) | 5 (4.4%) |
| $35,000 to $49,999 | 37 (10.0%) | 13 (11.5%) |
| $50,000 to $74,999 | 107 (28.9%) | 0 (0.0%) |
| $75,000 to $99,999 | 17 (4.6%) | 0 (0.0%) |
| $100,000 to $149,999 | 22 (5.9%) | 0 (0.0%) |
| $150,000 or more | 12 (3.2%) | 4 (3.5%) |
| Total | 370 (100.0%) | 113 (100.0%) |
Monthly Housing Cost Tiers in Camp Hill
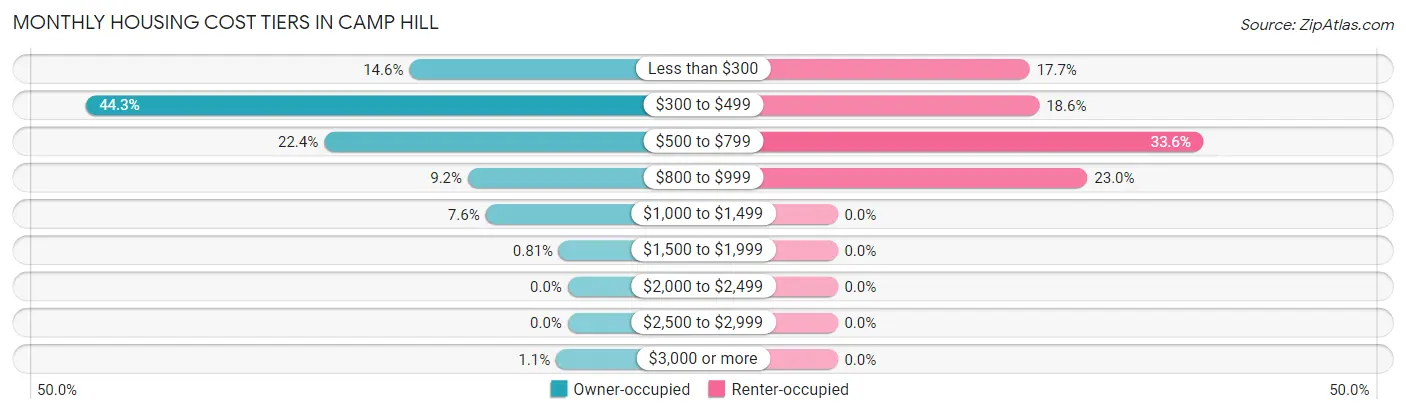
| Monthly Cost | Owner-occupied | Renter-occupied |
| Less than $300 | 54 (14.6%) | 20 (17.7%) |
| $300 to $499 | 164 (44.3%) | 21 (18.6%) |
| $500 to $799 | 83 (22.4%) | 38 (33.6%) |
| $800 to $999 | 34 (9.2%) | 26 (23.0%) |
| $1,000 to $1,499 | 28 (7.6%) | 0 (0.0%) |
| $1,500 to $1,999 | 3 (0.8%) | 0 (0.0%) |
| $2,000 to $2,499 | 0 (0.0%) | 0 (0.0%) |
| $2,500 to $2,999 | 0 (0.0%) | 0 (0.0%) |
| $3,000 or more | 4 (1.1%) | 0 (0.0%) |
| Total | 370 (100.0%) | 113 (100.0%) |
Physical Housing Characteristics in Camp Hill
Housing Structures in Camp Hill
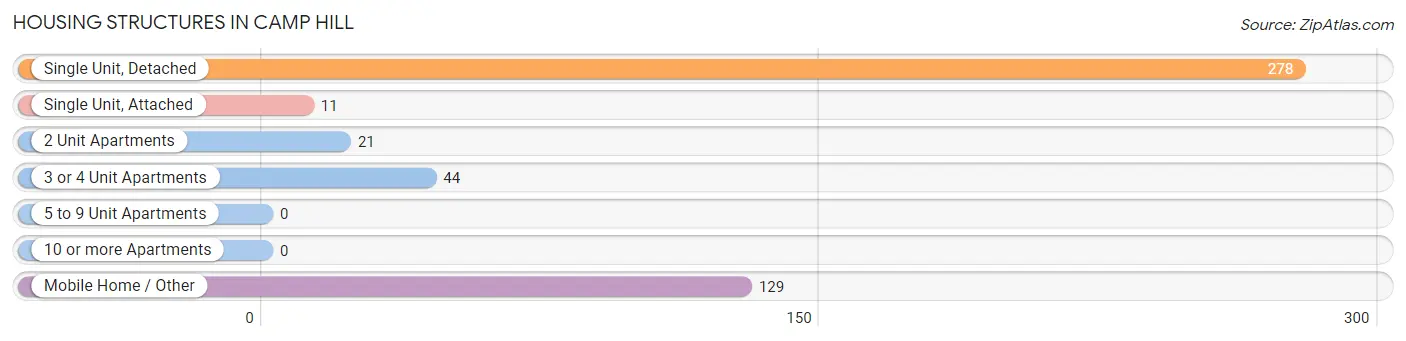
| Structure Type | # Housing Units | % Housing Units |
| Single Unit, Detached | 278 | 57.6% |
| Single Unit, Attached | 11 | 2.3% |
| 2 Unit Apartments | 21 | 4.3% |
| 3 or 4 Unit Apartments | 44 | 9.1% |
| 5 to 9 Unit Apartments | 0 | 0.0% |
| 10 or more Apartments | 0 | 0.0% |
| Mobile Home / Other | 129 | 26.7% |
| Total | 483 | 100.0% |
Housing Structures by Occupancy in Camp Hill
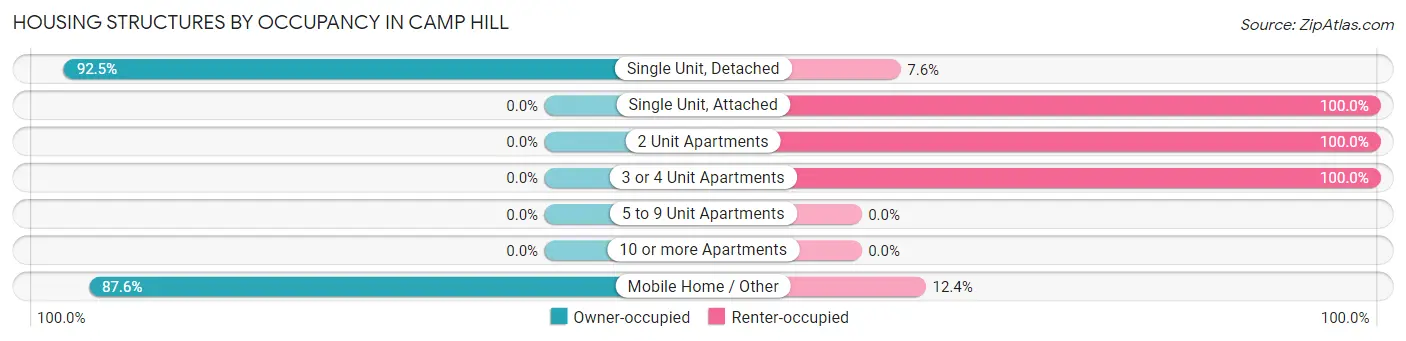
| Structure Type | Owner-occupied | Renter-occupied |
| Single Unit, Detached | 257 (92.4%) | 21 (7.5%) |
| Single Unit, Attached | 0 (0.0%) | 11 (100.0%) |
| 2 Unit Apartments | 0 (0.0%) | 21 (100.0%) |
| 3 or 4 Unit Apartments | 0 (0.0%) | 44 (100.0%) |
| 5 to 9 Unit Apartments | 0 (0.0%) | 0 (0.0%) |
| 10 or more Apartments | 0 (0.0%) | 0 (0.0%) |
| Mobile Home / Other | 113 (87.6%) | 16 (12.4%) |
| Total | 370 (76.6%) | 113 (23.4%) |
Housing Structures by Number of Rooms in Camp Hill
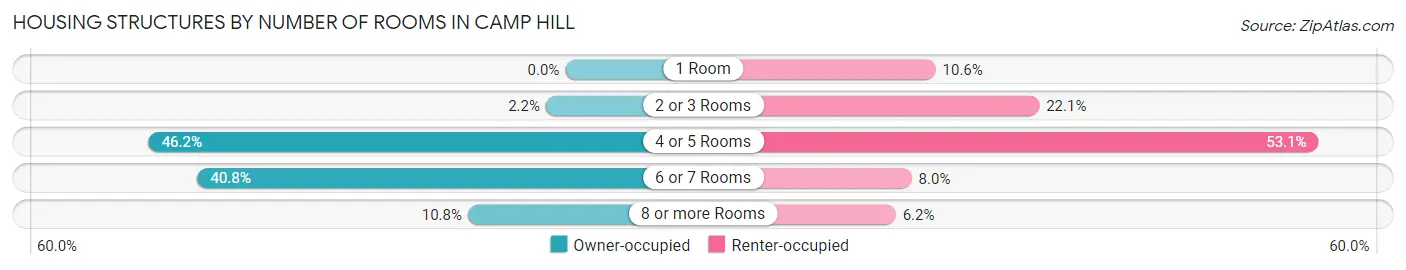
| Number of Rooms | Owner-occupied | Renter-occupied |
| 1 Room | 0 (0.0%) | 12 (10.6%) |
| 2 or 3 Rooms | 8 (2.2%) | 25 (22.1%) |
| 4 or 5 Rooms | 171 (46.2%) | 60 (53.1%) |
| 6 or 7 Rooms | 151 (40.8%) | 9 (8.0%) |
| 8 or more Rooms | 40 (10.8%) | 7 (6.2%) |
| Total | 370 (100.0%) | 113 (100.0%) |
Housing Structure by Heating Type in Camp Hill
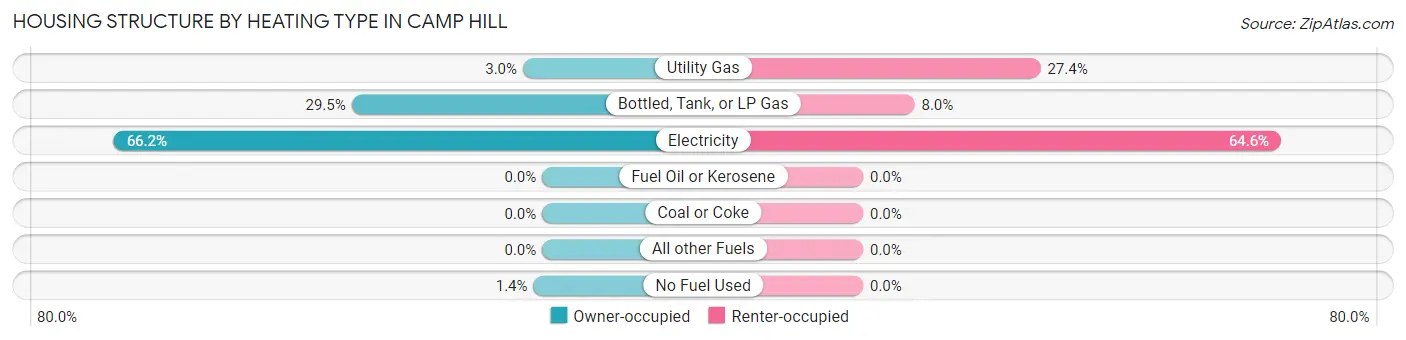
| Heating Type | Owner-occupied | Renter-occupied |
| Utility Gas | 11 (3.0%) | 31 (27.4%) |
| Bottled, Tank, or LP Gas | 109 (29.5%) | 9 (8.0%) |
| Electricity | 245 (66.2%) | 73 (64.6%) |
| Fuel Oil or Kerosene | 0 (0.0%) | 0 (0.0%) |
| Coal or Coke | 0 (0.0%) | 0 (0.0%) |
| All other Fuels | 0 (0.0%) | 0 (0.0%) |
| No Fuel Used | 5 (1.3%) | 0 (0.0%) |
| Total | 370 (100.0%) | 113 (100.0%) |
Household Vehicle Usage in Camp Hill
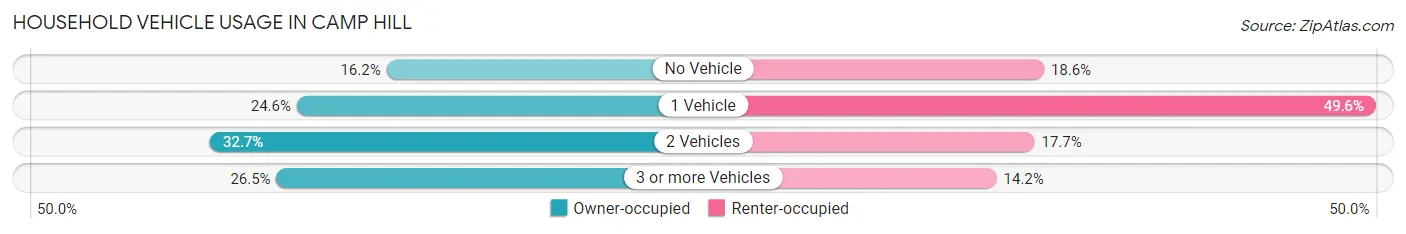
| Vehicles per Household | Owner-occupied | Renter-occupied |
| No Vehicle | 60 (16.2%) | 21 (18.6%) |
| 1 Vehicle | 91 (24.6%) | 56 (49.6%) |
| 2 Vehicles | 121 (32.7%) | 20 (17.7%) |
| 3 or more Vehicles | 98 (26.5%) | 16 (14.2%) |
| Total | 370 (100.0%) | 113 (100.0%) |
Real Estate & Mortgages in Camp Hill
Real Estate and Mortgage Overview in Camp Hill
| Characteristic | Without Mortgage | With Mortgage |
| Housing Units | 270 | 100 |
| Median Property Value | $63,000 | $0 |
| Median Household Income | $32,074 | $0 |
| Monthly Housing Costs | $370 | $0 |
| Real Estate Taxes | $254 | $40 |
Property Value by Mortgage Status in Camp Hill
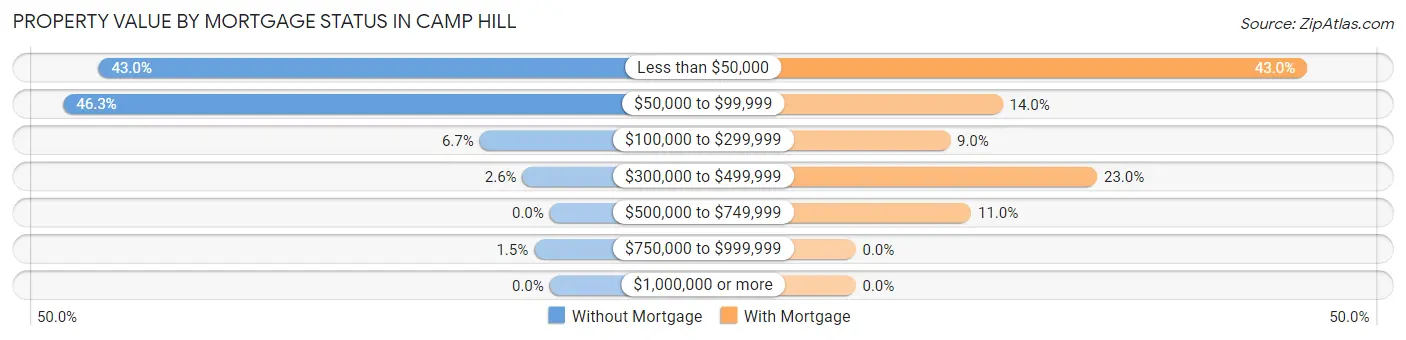
| Property Value | Without Mortgage | With Mortgage |
| Less than $50,000 | 116 (43.0%) | 43 (43.0%) |
| $50,000 to $99,999 | 125 (46.3%) | 14 (14.0%) |
| $100,000 to $299,999 | 18 (6.7%) | 9 (9.0%) |
| $300,000 to $499,999 | 7 (2.6%) | 23 (23.0%) |
| $500,000 to $749,999 | 0 (0.0%) | 11 (11.0%) |
| $750,000 to $999,999 | 4 (1.5%) | 0 (0.0%) |
| $1,000,000 or more | 0 (0.0%) | 0 (0.0%) |
| Total | 270 (100.0%) | 100 (100.0%) |
Household Income by Mortgage Status in Camp Hill
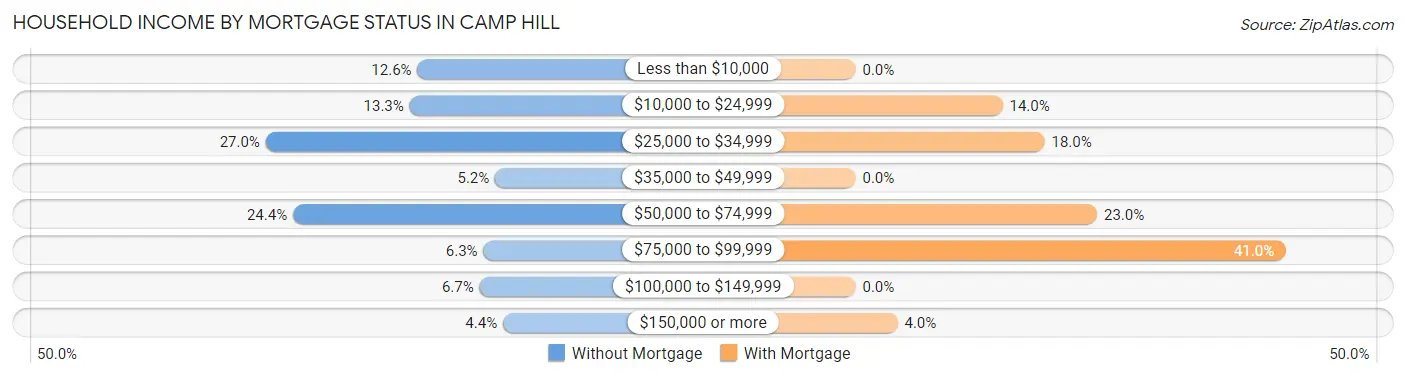
| Household Income | Without Mortgage | With Mortgage |
| Less than $10,000 | 34 (12.6%) | 0 (0.0%) |
| $10,000 to $24,999 | 36 (13.3%) | 14 (14.0%) |
| $25,000 to $34,999 | 73 (27.0%) | 18 (18.0%) |
| $35,000 to $49,999 | 14 (5.2%) | 0 (0.0%) |
| $50,000 to $74,999 | 66 (24.4%) | 23 (23.0%) |
| $75,000 to $99,999 | 17 (6.3%) | 41 (41.0%) |
| $100,000 to $149,999 | 18 (6.7%) | 0 (0.0%) |
| $150,000 or more | 12 (4.4%) | 4 (4.0%) |
| Total | 270 (100.0%) | 100 (100.0%) |
Property Value to Household Income Ratio in Camp Hill
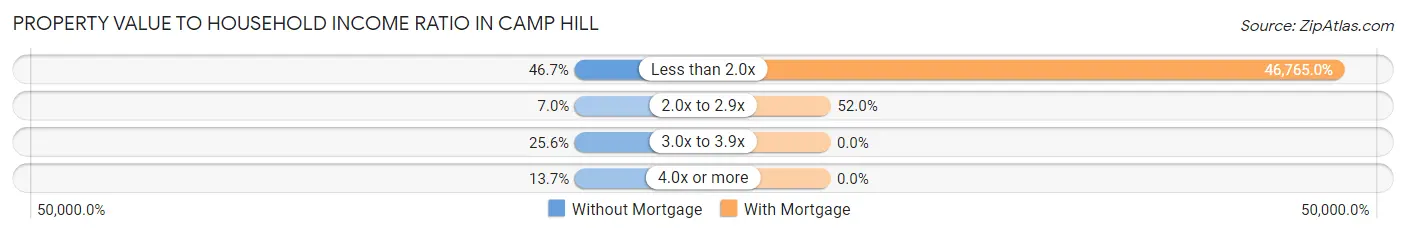
| Value-to-Income Ratio | Without Mortgage | With Mortgage |
| Less than 2.0x | 126 (46.7%) | 46,765 (46,765.0%) |
| 2.0x to 2.9x | 19 (7.0%) | 52 (52.0%) |
| 3.0x to 3.9x | 69 (25.6%) | 0 (0.0%) |
| 4.0x or more | 37 (13.7%) | 0 (0.0%) |
| Total | 270 (100.0%) | 100 (100.0%) |
Real Estate Taxes by Mortgage Status in Camp Hill
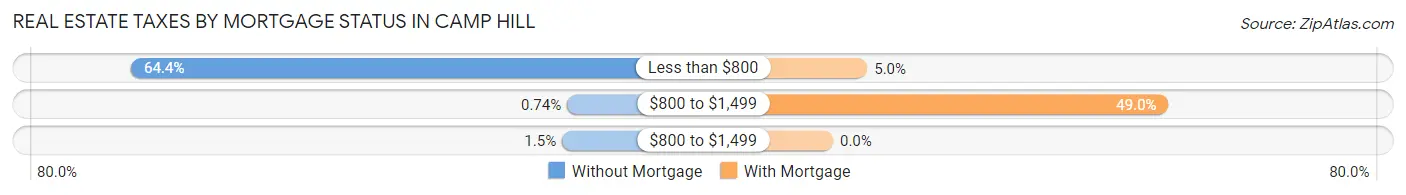
| Property Taxes | Without Mortgage | With Mortgage |
| Less than $800 | 174 (64.4%) | 5 (5.0%) |
| $800 to $1,499 | 2 (0.7%) | 49 (49.0%) |
| $800 to $1,499 | 4 (1.5%) | 0 (0.0%) |
| Total | 270 (100.0%) | 100 (100.0%) |
Health & Disability in Camp Hill
Health Insurance Coverage by Age in Camp Hill
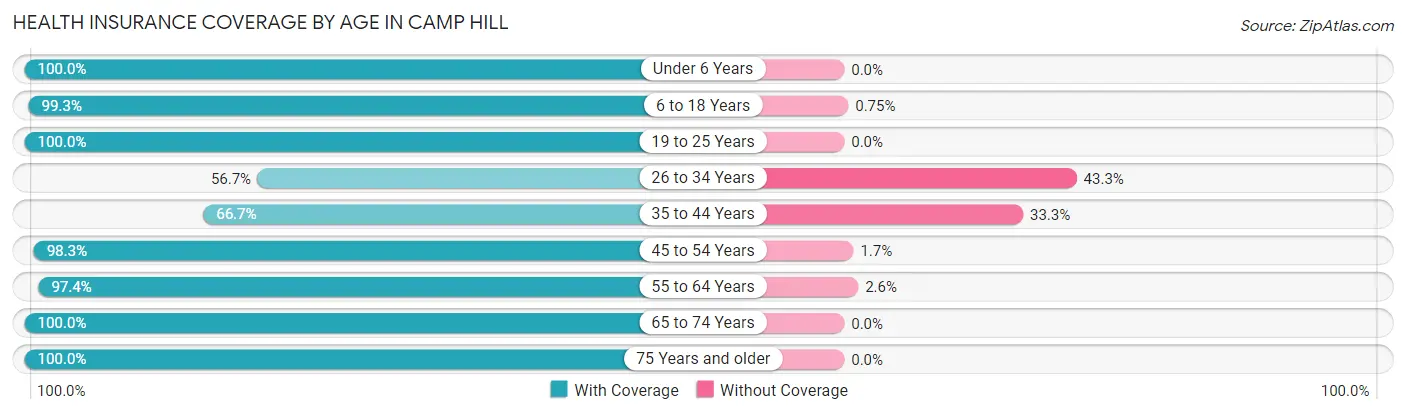
| Age Bracket | With Coverage | Without Coverage |
| Under 6 Years | 129 (100.0%) | 0 (0.0%) |
| 6 to 18 Years | 266 (99.3%) | 2 (0.7%) |
| 19 to 25 Years | 65 (100.0%) | 0 (0.0%) |
| 26 to 34 Years | 51 (56.7%) | 39 (43.3%) |
| 35 to 44 Years | 124 (66.7%) | 62 (33.3%) |
| 45 to 54 Years | 172 (98.3%) | 3 (1.7%) |
| 55 to 64 Years | 188 (97.4%) | 5 (2.6%) |
| 65 to 74 Years | 146 (100.0%) | 0 (0.0%) |
| 75 Years and older | 44 (100.0%) | 0 (0.0%) |
| Total | 1,185 (91.4%) | 111 (8.6%) |
Health Insurance Coverage by Citizenship Status in Camp Hill
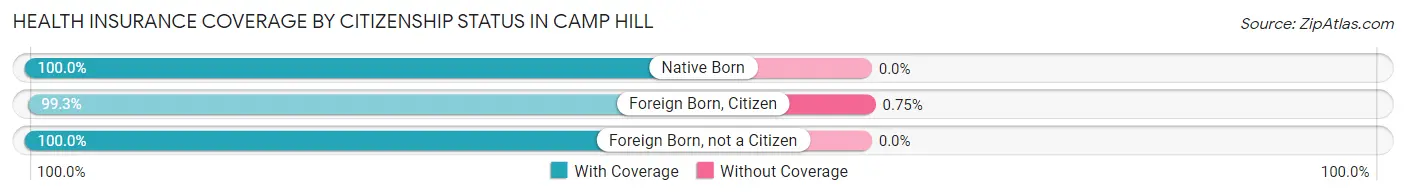
| Citizenship Status | With Coverage | Without Coverage |
| Native Born | 129 (100.0%) | 0 (0.0%) |
| Foreign Born, Citizen | 266 (99.3%) | 2 (0.7%) |
| Foreign Born, not a Citizen | 65 (100.0%) | 0 (0.0%) |
Health Insurance Coverage by Household Income in Camp Hill
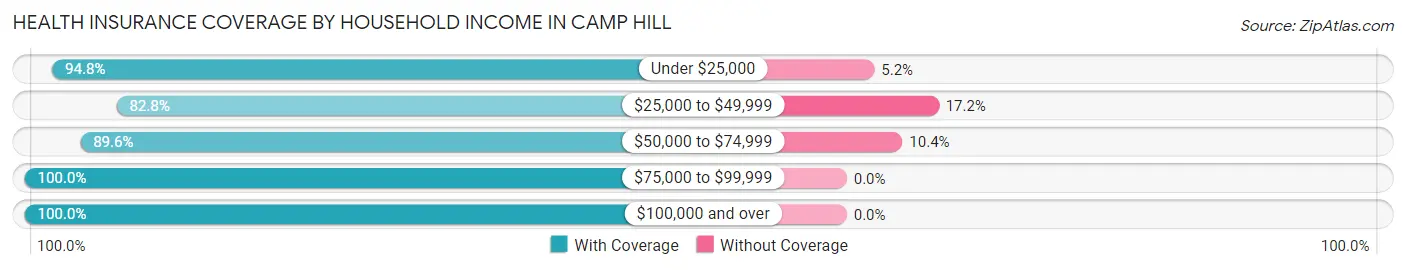
| Household Income | With Coverage | Without Coverage |
| Under $25,000 | 532 (94.8%) | 29 (5.2%) |
| $25,000 to $49,999 | 250 (82.8%) | 52 (17.2%) |
| $50,000 to $74,999 | 258 (89.6%) | 30 (10.4%) |
| $75,000 to $99,999 | 85 (100.0%) | 0 (0.0%) |
| $100,000 and over | 60 (100.0%) | 0 (0.0%) |
Public vs Private Health Insurance Coverage by Age in Camp Hill
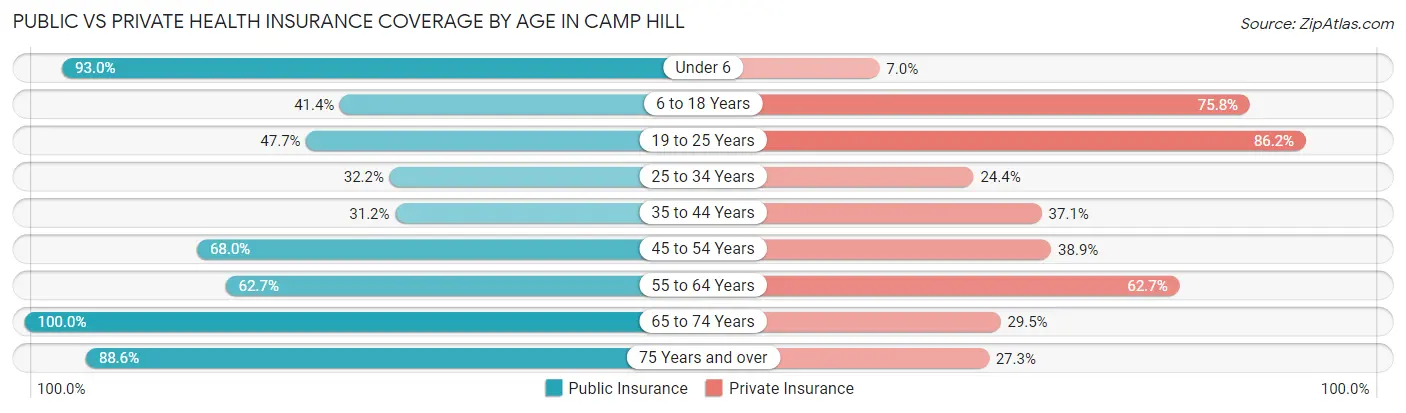
| Age Bracket | Public Insurance | Private Insurance |
| Under 6 | 120 (93.0%) | 9 (7.0%) |
| 6 to 18 Years | 111 (41.4%) | 203 (75.7%) |
| 19 to 25 Years | 31 (47.7%) | 56 (86.2%) |
| 25 to 34 Years | 29 (32.2%) | 22 (24.4%) |
| 35 to 44 Years | 58 (31.2%) | 69 (37.1%) |
| 45 to 54 Years | 119 (68.0%) | 68 (38.9%) |
| 55 to 64 Years | 121 (62.7%) | 121 (62.7%) |
| 65 to 74 Years | 146 (100.0%) | 43 (29.4%) |
| 75 Years and over | 39 (88.6%) | 12 (27.3%) |
| Total | 774 (59.7%) | 603 (46.5%) |
Disability Status by Sex by Age in Camp Hill
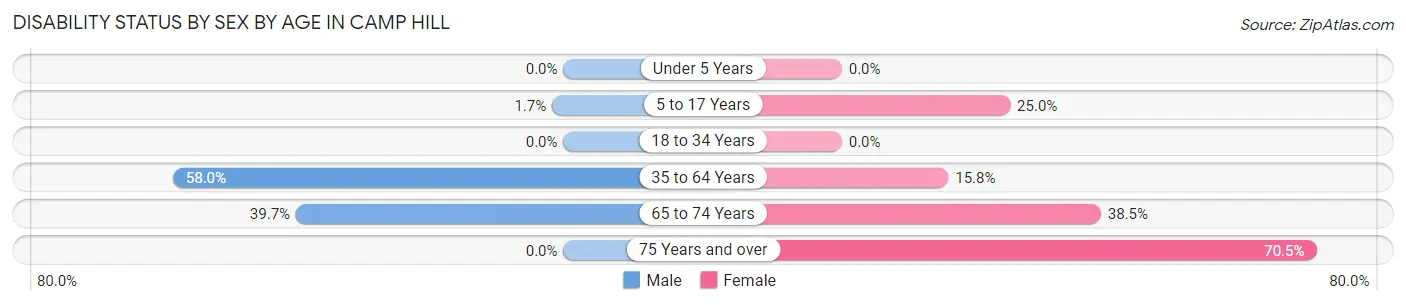
| Age Bracket | Male | Female |
| Under 5 Years | 0 (0.0%) | 0 (0.0%) |
| 5 to 17 Years | 3 (1.7%) | 7 (25.0%) |
| 18 to 34 Years | 0 (0.0%) | 0 (0.0%) |
| 35 to 64 Years | 138 (58.0%) | 50 (15.8%) |
| 65 to 74 Years | 27 (39.7%) | 30 (38.5%) |
| 75 Years and over | 0 (0.0%) | 31 (70.5%) |
Disability Class by Sex by Age in Camp Hill
Disability Class: Hearing Difficulty
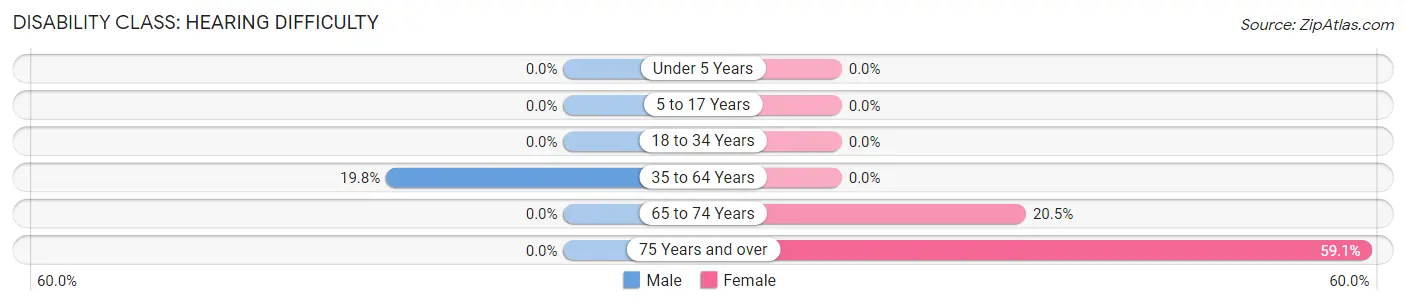
| Age Bracket | Male | Female |
| Under 5 Years | 0 (0.0%) | 0 (0.0%) |
| 5 to 17 Years | 0 (0.0%) | 0 (0.0%) |
| 18 to 34 Years | 0 (0.0%) | 0 (0.0%) |
| 35 to 64 Years | 47 (19.8%) | 0 (0.0%) |
| 65 to 74 Years | 0 (0.0%) | 16 (20.5%) |
| 75 Years and over | 0 (0.0%) | 26 (59.1%) |
Disability Class: Vision Difficulty
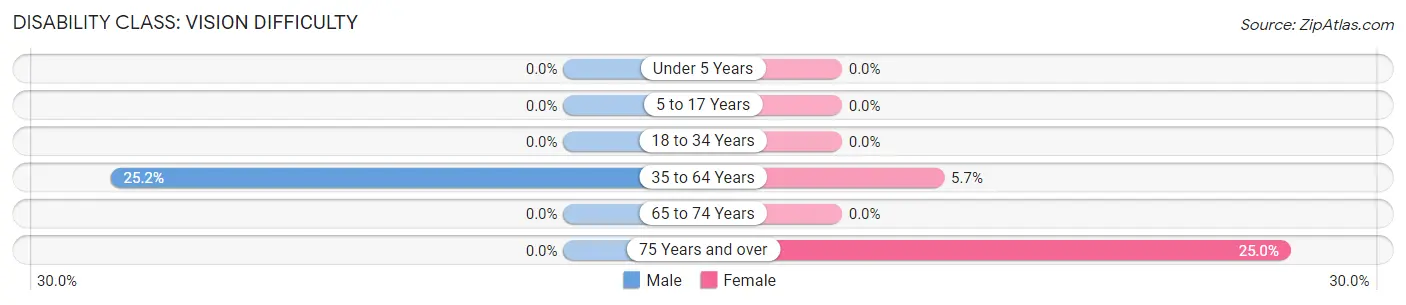
| Age Bracket | Male | Female |
| Under 5 Years | 0 (0.0%) | 0 (0.0%) |
| 5 to 17 Years | 0 (0.0%) | 0 (0.0%) |
| 18 to 34 Years | 0 (0.0%) | 0 (0.0%) |
| 35 to 64 Years | 60 (25.2%) | 18 (5.7%) |
| 65 to 74 Years | 0 (0.0%) | 0 (0.0%) |
| 75 Years and over | 0 (0.0%) | 11 (25.0%) |
Disability Class: Cognitive Difficulty
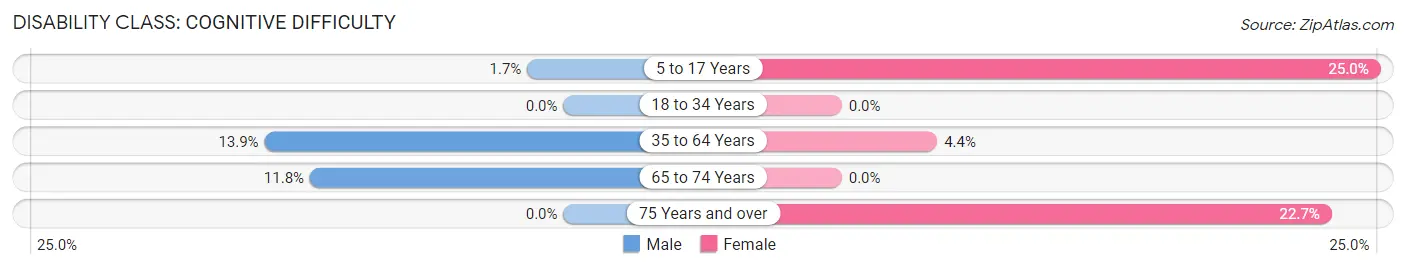
| Age Bracket | Male | Female |
| 5 to 17 Years | 3 (1.7%) | 7 (25.0%) |
| 18 to 34 Years | 0 (0.0%) | 0 (0.0%) |
| 35 to 64 Years | 33 (13.9%) | 14 (4.4%) |
| 65 to 74 Years | 8 (11.8%) | 0 (0.0%) |
| 75 Years and over | 0 (0.0%) | 10 (22.7%) |
Disability Class: Ambulatory Difficulty
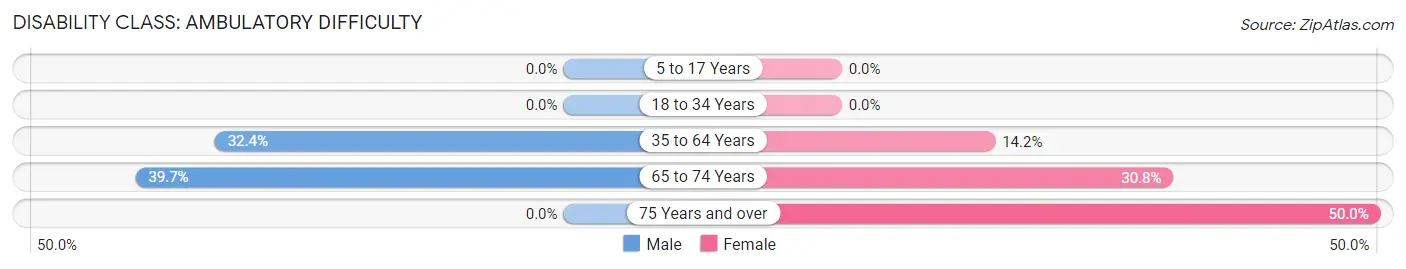
| Age Bracket | Male | Female |
| 5 to 17 Years | 0 (0.0%) | 0 (0.0%) |
| 18 to 34 Years | 0 (0.0%) | 0 (0.0%) |
| 35 to 64 Years | 77 (32.4%) | 45 (14.2%) |
| 65 to 74 Years | 27 (39.7%) | 24 (30.8%) |
| 75 Years and over | 0 (0.0%) | 22 (50.0%) |
Disability Class: Self-Care Difficulty
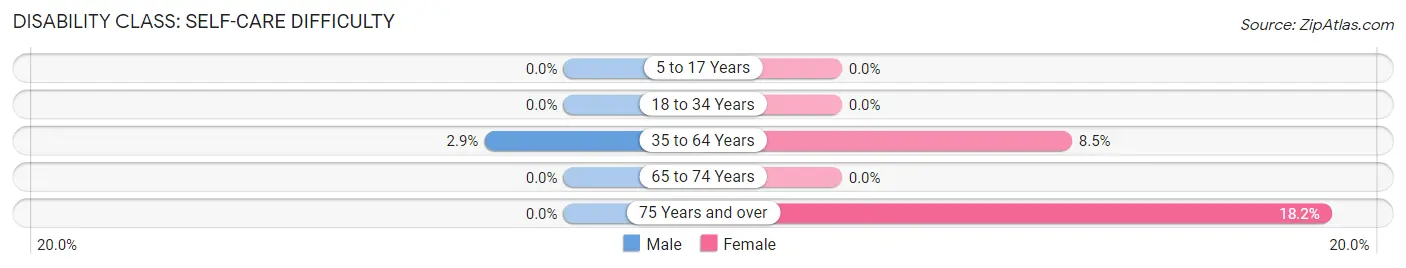
| Age Bracket | Male | Female |
| 5 to 17 Years | 0 (0.0%) | 0 (0.0%) |
| 18 to 34 Years | 0 (0.0%) | 0 (0.0%) |
| 35 to 64 Years | 7 (2.9%) | 27 (8.5%) |
| 65 to 74 Years | 0 (0.0%) | 0 (0.0%) |
| 75 Years and over | 0 (0.0%) | 8 (18.2%) |
Technology Access in Camp Hill
Computing Device Access in Camp Hill
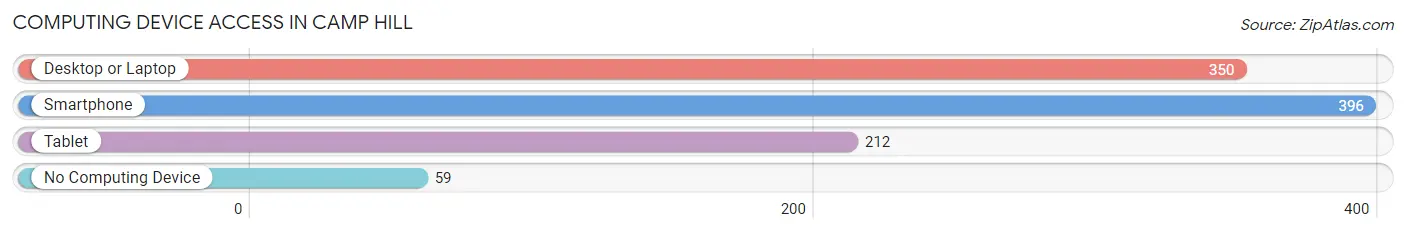
| Device Type | # Households | % Households |
| Desktop or Laptop | 350 | 72.5% |
| Smartphone | 396 | 82.0% |
| Tablet | 212 | 43.9% |
| No Computing Device | 59 | 12.2% |
| Total | 483 | 100.0% |
Internet Access in Camp Hill
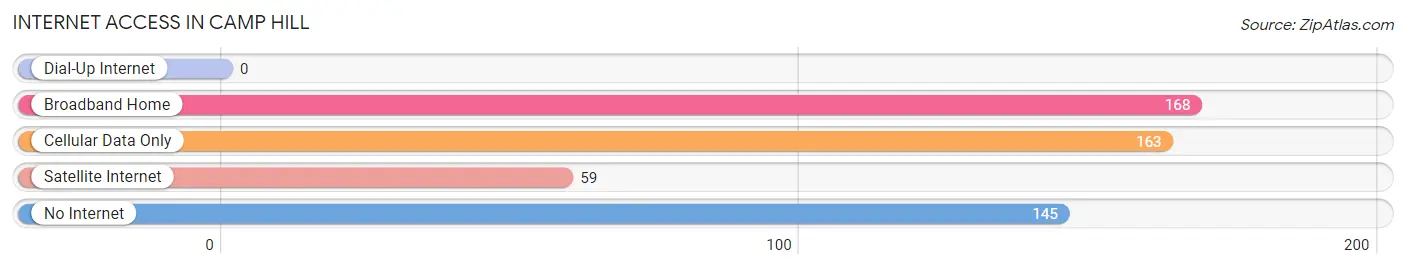
| Internet Type | # Households | % Households |
| Dial-Up Internet | 0 | 0.0% |
| Broadband Home | 168 | 34.8% |
| Cellular Data Only | 163 | 33.8% |
| Satellite Internet | 59 | 12.2% |
| No Internet | 145 | 30.0% |
| Total | 483 | 100.0% |
Camp Hill Summary
Introduction
Camp Hill is a small town located in Tallapoosa County, Alabama. It is situated on the banks of the Tallapoosa River, and is home to a population of just over 1,000 people. The town is known for its rich history, beautiful scenery, and friendly people.
History
Camp Hill was founded in 1820 by a group of settlers from Georgia. The town was named after a nearby hill, which was used as a campground by the settlers. The town was originally a farming community, and the main crops grown were cotton and corn.
In the late 1800s, Camp Hill began to grow and develop. The town was incorporated in 1891, and the first mayor was elected in 1892. The town was home to several businesses, including a sawmill, a gristmill, and a cotton gin.
In the early 1900s, Camp Hill experienced a period of growth and prosperity. The town was home to several churches, schools, and businesses. The town also had a railroad station, which connected it to the rest of the state.
In the 1950s, Camp Hill began to decline. The railroad station closed, and many of the businesses moved away. The town was also hit hard by the Great Depression, and many of the residents moved away in search of work.
Geography
Camp Hill is located in the southeastern corner of Tallapoosa County, Alabama. The town is situated on the banks of the Tallapoosa River, and is surrounded by rolling hills and forests. The town is located about 25 miles south of the city of Montgomery, and about 50 miles north of the city of Birmingham.
The climate in Camp Hill is mild and humid. The average temperature in the summer is around 80 degrees Fahrenheit, and the average temperature in the winter is around 50 degrees Fahrenheit. The town receives an average of 48 inches of rain per year.
Economy
The economy of Camp Hill is largely based on agriculture. The town is home to several farms, which produce a variety of crops, including cotton, corn, soybeans, and peanuts. The town is also home to several small businesses, including restaurants, stores, and service providers.
Demographics
As of the 2010 census, the population of Camp Hill was 1,072. The racial makeup of the town was 95.3% White, 2.2% African American, 0.3% Native American, 0.2% Asian, 0.1% Pacific Islander, 0.7% from other races, and 1.2% from two or more races. Hispanic or Latino of any race were 1.7% of the population.
Conclusion
Camp Hill is a small town located in Tallapoosa County, Alabama. It is known for its rich history, beautiful scenery, and friendly people. The town is home to a population of just over 1,000 people, and the economy is largely based on agriculture. Camp Hill is a great place to live, work, and raise a family.
Common Questions
What is Per Capita Income in Camp Hill?
Per Capita income in Camp Hill is $16,513.
What is the Median Family Income in Camp Hill?
Median Family Income in Camp Hill is $32,420.
What is the Median Household income in Camp Hill?
Median Household Income in Camp Hill is $30,931.
What is Inequality or Gini Index in Camp Hill?
Inequality or Gini Index in Camp Hill is 0.46.
What is the Total Population of Camp Hill?
Total Population of Camp Hill is 1,321.
What is the Total Male Population of Camp Hill?
Total Male Population of Camp Hill is 623.
What is the Total Female Population of Camp Hill?
Total Female Population of Camp Hill is 698.
What is the Ratio of Males per 100 Females in Camp Hill?
There are 89.26 Males per 100 Females in Camp Hill.
What is the Ratio of Females per 100 Males in Camp Hill?
There are 112.04 Females per 100 Males in Camp Hill.
What is the Median Population Age in Camp Hill?
Median Population Age in Camp Hill is 40.0 Years.
What is the Average Family Size in Camp Hill
Average Family Size in Camp Hill is 3.3 People.
What is the Average Household Size in Camp Hill
Average Household Size in Camp Hill is 2.7 People.
How Large is the Labor Force in Camp Hill?
There are 308 People in the Labor Forcein in Camp Hill.
What is the Percentage of People in the Labor Force in Camp Hill?
31.0% of People are in the Labor Force in Camp Hill.
What is the Unemployment Rate in Camp Hill?
Unemployment Rate in Camp Hill is 21.8%.