Lauderdale County, AL Map & Demographics
Lauderdale County Map
Lauderdale County Overview
$32,678
PER CAPITA INCOME
$76,544
AVG FAMILY INCOME
$56,081
AVG HOUSEHOLD INCOME
35.7%
WAGE / INCOME GAP [ % ]
64.3¢/ $1
WAGE / INCOME GAP [ $ ]
$10,852
FAMILY INCOME DEFICIT
0.46
INEQUALITY / GINI INDEX
94,329
TOTAL POPULATION
45,493
MALE POPULATION
48,836
FEMALE POPULATION
93.15
MALES / 100 FEMALES
107.35
FEMALES / 100 MALES
40.8
MEDIAN AGE
3.0
AVG FAMILY SIZE
2.4
AVG HOUSEHOLD SIZE
45,163
LABOR FORCE [ PEOPLE ]
58.1%
PERCENT IN LABOR FORCE
3.6%
UNEMPLOYMENT RATE
Lauderdale County Area Codes
Income in Lauderdale County
Income Overview in Lauderdale County
Per Capita Income in Lauderdale County is $32,678, while median incomes of families and households are $76,544 and $56,081 respectively.
| Characteristic | Number | Measure |
| Per Capita Income | 94,329 | $32,678 |
| Median Family Income | 24,633 | $76,544 |
| Mean Family Income | 24,633 | $95,239 |
| Median Household Income | 38,237 | $56,081 |
| Mean Household Income | 38,237 | $76,624 |
| Income Deficit | 24,633 | $10,852 |
| Wage / Income Gap (%) | 94,329 | 35.74% |
| Wage / Income Gap ($) | 94,329 | 64.26¢ per $1 |
| Gini / Inequality Index | 94,329 | 0.46 |
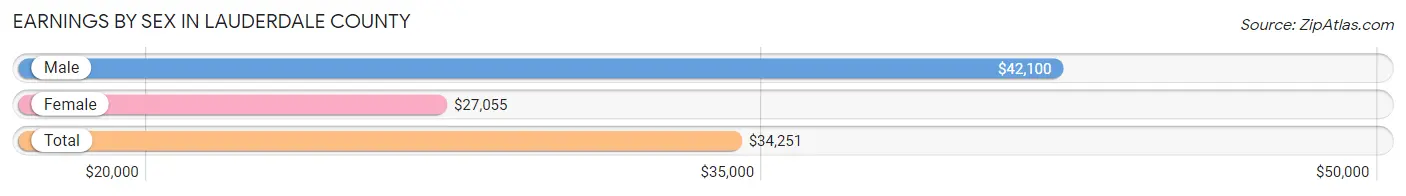
Earnings by Sex in Lauderdale County
Average Earnings in Lauderdale County are $34,251, $42,100 for men and $27,055 for women, a difference of 35.7%.
| Sex | Number | Average Earnings |
| Male | 25,390 (53.2%) | $42,100 |
| Female | 22,366 (46.8%) | $27,055 |
| Total | 47,756 (100.0%) | $34,251 |
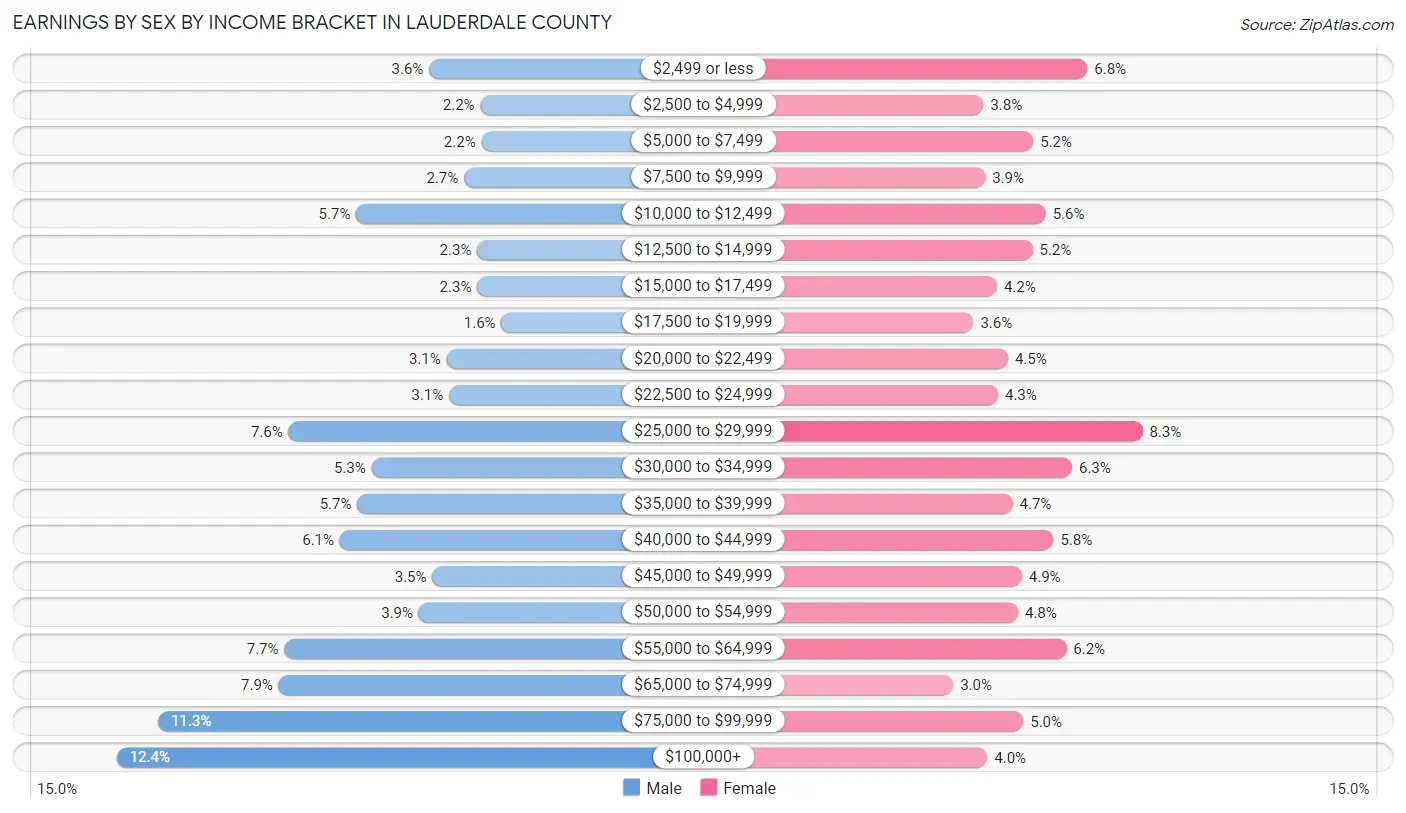
Earnings by Sex by Income Bracket in Lauderdale County
The most common earnings brackets in Lauderdale County are $100,000+ for men (3,150 | 12.4%) and $25,000 to $29,999 for women (1,859 | 8.3%).
| Income | Male | Female |
| $2,499 or less | 921 (3.6%) | 1,511 (6.8%) |
| $2,500 to $4,999 | 557 (2.2%) | 858 (3.8%) |
| $5,000 to $7,499 | 549 (2.2%) | 1,171 (5.2%) |
| $7,500 to $9,999 | 674 (2.6%) | 869 (3.9%) |
| $10,000 to $12,499 | 1,443 (5.7%) | 1,250 (5.6%) |
| $12,500 to $14,999 | 578 (2.3%) | 1,168 (5.2%) |
| $15,000 to $17,499 | 580 (2.3%) | 944 (4.2%) |
| $17,500 to $19,999 | 406 (1.6%) | 797 (3.6%) |
| $20,000 to $22,499 | 796 (3.1%) | 1,014 (4.5%) |
| $22,500 to $24,999 | 779 (3.1%) | 950 (4.3%) |
| $25,000 to $29,999 | 1,924 (7.6%) | 1,859 (8.3%) |
| $30,000 to $34,999 | 1,333 (5.2%) | 1,416 (6.3%) |
| $35,000 to $39,999 | 1,435 (5.7%) | 1,043 (4.7%) |
| $40,000 to $44,999 | 1,560 (6.1%) | 1,299 (5.8%) |
| $45,000 to $49,999 | 900 (3.5%) | 1,100 (4.9%) |
| $50,000 to $54,999 | 996 (3.9%) | 1,075 (4.8%) |
| $55,000 to $64,999 | 1,956 (7.7%) | 1,381 (6.2%) |
| $65,000 to $74,999 | 1,996 (7.9%) | 668 (3.0%) |
| $75,000 to $99,999 | 2,857 (11.3%) | 1,109 (5.0%) |
| $100,000+ | 3,150 (12.4%) | 884 (4.0%) |
| Total | 25,390 (100.0%) | 22,366 (100.0%) |
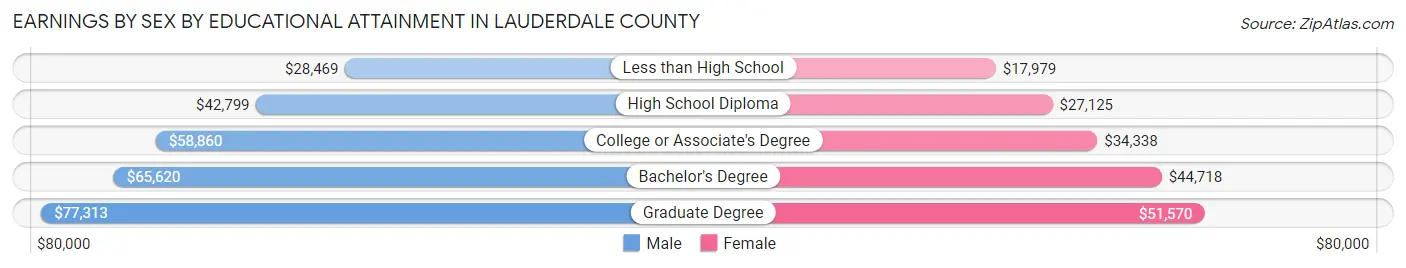
Earnings by Sex by Educational Attainment in Lauderdale County
Average earnings in Lauderdale County are $51,392 for men and $33,185 for women, a difference of 35.4%. Men with an educational attainment of graduate degree enjoy the highest average annual earnings of $77,313, while those with less than high school education earn the least with $28,469. Women with an educational attainment of graduate degree earn the most with the average annual earnings of $51,570, while those with less than high school education have the smallest earnings of $17,979.
| Educational Attainment | Male Income | Female Income |
| Less than High School | $28,469 | $17,979 |
| High School Diploma | $42,799 | $27,125 |
| College or Associate's Degree | $58,860 | $34,338 |
| Bachelor's Degree | $65,620 | $44,718 |
| Graduate Degree | $77,313 | $51,570 |
| Total | $51,392 | $33,185 |
Family Income in Lauderdale County
Family Income Brackets in Lauderdale County
According to the Lauderdale County family income data, there are 4,360 families falling into the $50,000 to $74,999 income range, which is the most common income bracket and makes up 17.7% of all families. Conversely, the $10,000 to $14,999 income bracket is the least frequent group with only 591 families (2.4%) belonging to this category.
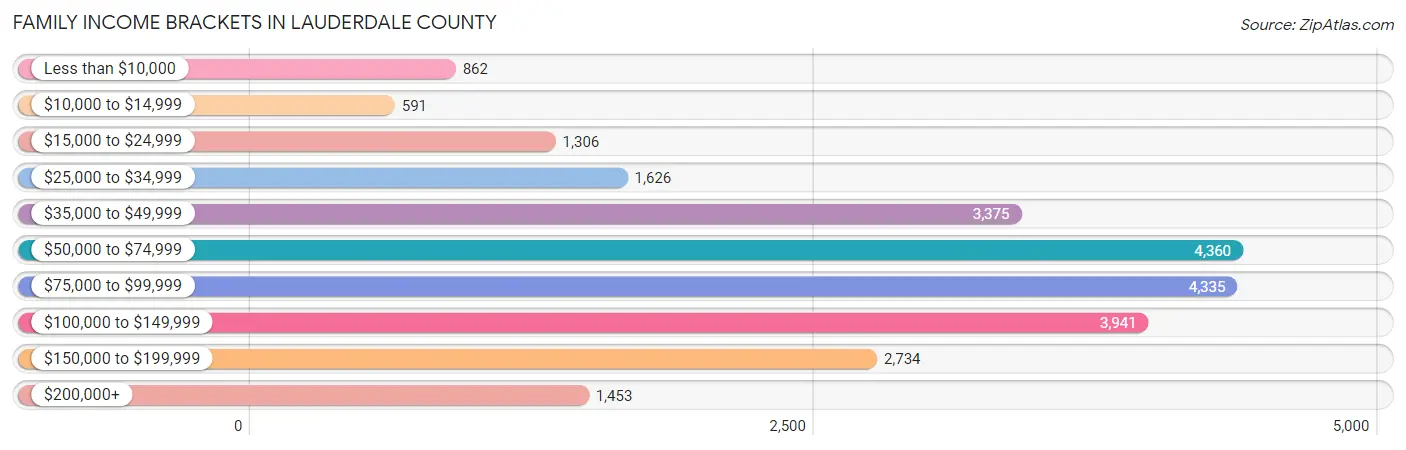
| Income Bracket | # Families | % Families |
| Less than $10,000 | 862 | 3.5% |
| $10,000 to $14,999 | 591 | 2.4% |
| $15,000 to $24,999 | 1,306 | 5.3% |
| $25,000 to $34,999 | 1,626 | 6.6% |
| $35,000 to $49,999 | 3,375 | 13.7% |
| $50,000 to $74,999 | 4,360 | 17.7% |
| $75,000 to $99,999 | 4,335 | 17.6% |
| $100,000 to $149,999 | 3,941 | 16.0% |
| $150,000 to $199,999 | 2,734 | 11.1% |
| $200,000+ | 1,453 | 5.9% |
Family Income by Famaliy Size in Lauderdale County
7+ person families (210 | 0.9%) account for the highest median family income in Lauderdale County with $130,417 per family, while 2-person families (13,016 | 52.8%) have the highest median income of $34,834 per family member.
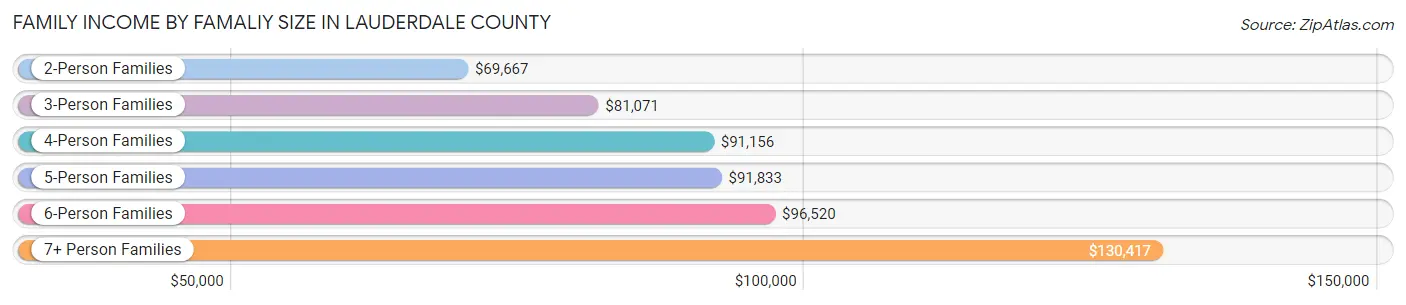
| Income Bracket | # Families | Median Income |
| 2-Person Families | 13,016 (52.8%) | $69,667 |
| 3-Person Families | 5,663 (23.0%) | $81,071 |
| 4-Person Families | 4,069 (16.5%) | $91,156 |
| 5-Person Families | 1,200 (4.9%) | $91,833 |
| 6-Person Families | 475 (1.9%) | $96,520 |
| 7+ Person Families | 210 (0.9%) | $130,417 |
| Total | 24,633 (100.0%) | $76,544 |
Family Income by Number of Earners in Lauderdale County
The median family income in Lauderdale County is $76,544, with families comprising 3+ earners (2,135) having the highest median family income of $119,963, while families with no earners (4,926) have the lowest median family income of $44,118, accounting for 8.7% and 20.0% of families, respectively.
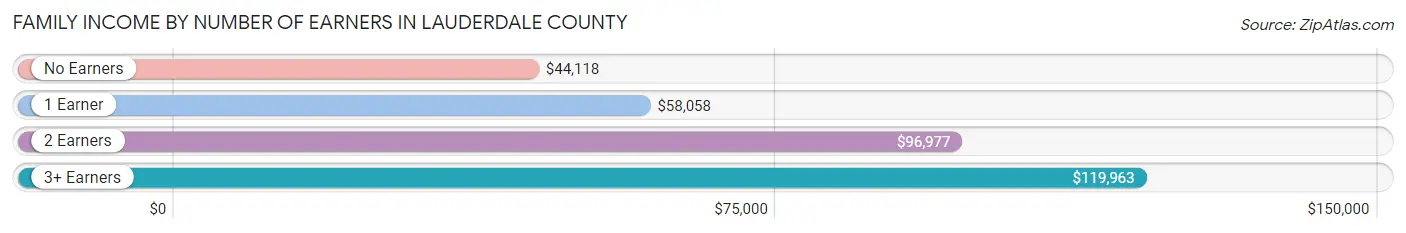
| Number of Earners | # Families | Median Income |
| No Earners | 4,926 (20.0%) | $44,118 |
| 1 Earner | 8,217 (33.4%) | $58,058 |
| 2 Earners | 9,355 (38.0%) | $96,977 |
| 3+ Earners | 2,135 (8.7%) | $119,963 |
| Total | 24,633 (100.0%) | $76,544 |
Household Income in Lauderdale County
Household Income Brackets in Lauderdale County
With 6,539 households falling in the category, the $50,000 to $74,999 income range is the most frequent in Lauderdale County, accounting for 17.1% of all households. In contrast, only 1,529 households (4.0%) fall into the $200,000+ income bracket, making it the least populous group.
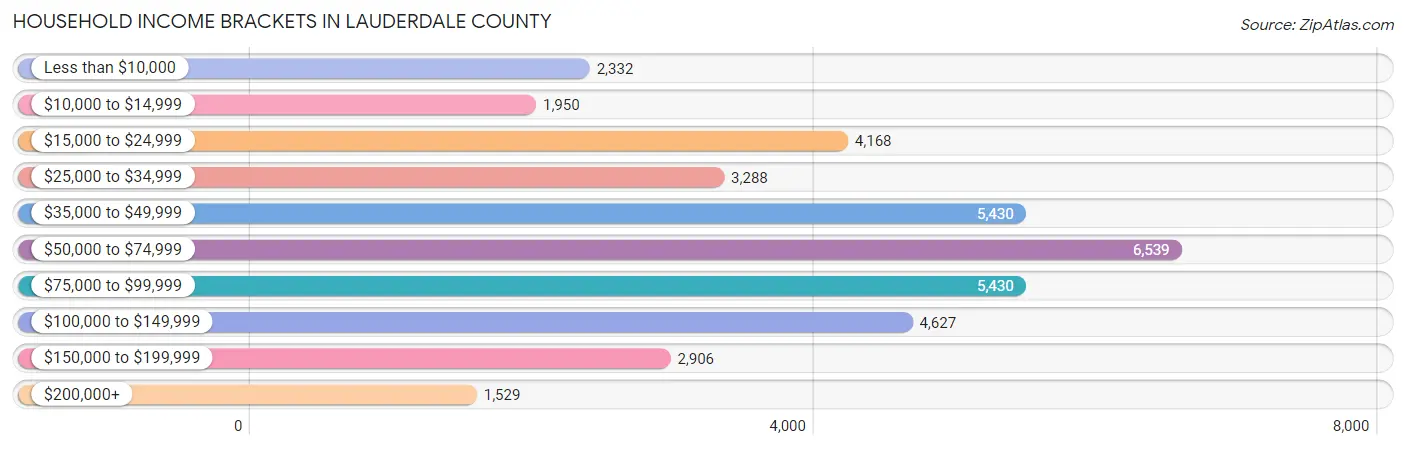
| Income Bracket | # Households | % Households |
| Less than $10,000 | 2,332 | 6.1% |
| $10,000 to $14,999 | 1,950 | 5.1% |
| $15,000 to $24,999 | 4,168 | 10.9% |
| $25,000 to $34,999 | 3,288 | 8.6% |
| $35,000 to $49,999 | 5,430 | 14.2% |
| $50,000 to $74,999 | 6,539 | 17.1% |
| $75,000 to $99,999 | 5,430 | 14.2% |
| $100,000 to $149,999 | 4,627 | 12.1% |
| $150,000 to $199,999 | 2,906 | 7.6% |
| $200,000+ | 1,529 | 4.0% |
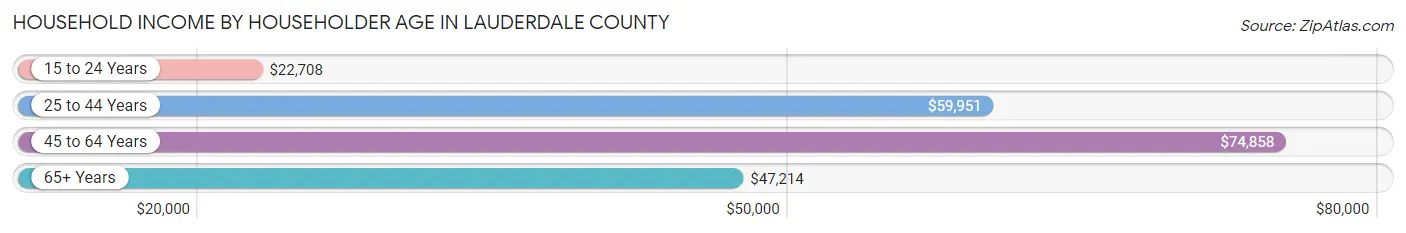
Household Income by Householder Age in Lauderdale County
The median household income in Lauderdale County is $56,081, with the highest median household income of $74,858 found in the 45 to 64 years age bracket for the primary householder. A total of 13,068 households (34.2%) fall into this category. Meanwhile, the 15 to 24 years age bracket for the primary householder has the lowest median household income of $22,708, with 2,413 households (6.3%) in this group.
| Income Bracket | # Households | Median Income |
| 15 to 24 Years | 2,413 (6.3%) | $22,708 |
| 25 to 44 Years | 10,583 (27.7%) | $59,951 |
| 45 to 64 Years | 13,068 (34.2%) | $74,858 |
| 65+ Years | 12,173 (31.8%) | $47,214 |
| Total | 38,237 (100.0%) | $56,081 |
Poverty in Lauderdale County
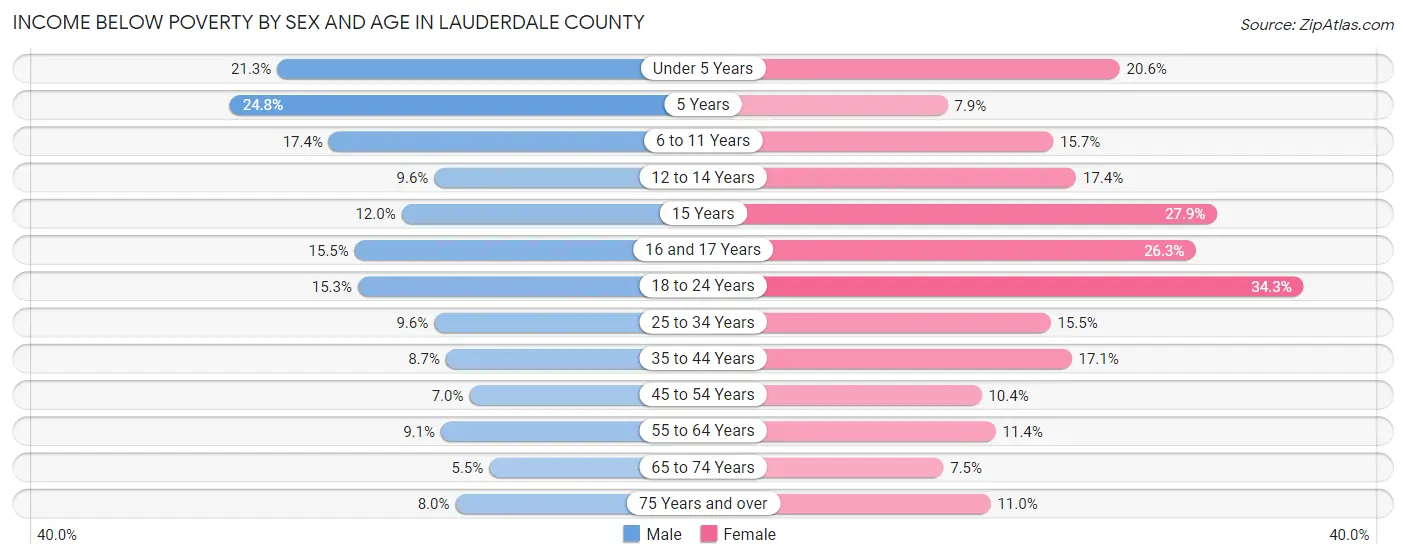
Income Below Poverty by Sex and Age in Lauderdale County
With 10.6% poverty level for males and 15.8% for females among the residents of Lauderdale County, 5 year old males and 18 to 24 year old females are the most vulnerable to poverty, with 102 males (24.8%) and 1,796 females (34.3%) in their respective age groups living below the poverty level.
| Age Bracket | Male | Female |
| Under 5 Years | 509 (21.2%) | 467 (20.6%) |
| 5 Years | 102 (24.8%) | 45 (7.9%) |
| 6 to 11 Years | 524 (17.4%) | 436 (15.7%) |
| 12 to 14 Years | 174 (9.6%) | 300 (17.4%) |
| 15 Years | 94 (12.0%) | 221 (27.9%) |
| 16 and 17 Years | 137 (15.5%) | 191 (26.3%) |
| 18 to 24 Years | 745 (15.3%) | 1,796 (34.3%) |
| 25 to 34 Years | 523 (9.6%) | 862 (15.5%) |
| 35 to 44 Years | 463 (8.7%) | 868 (17.1%) |
| 45 to 54 Years | 387 (7.0%) | 591 (10.4%) |
| 55 to 64 Years | 545 (9.1%) | 741 (11.4%) |
| 65 to 74 Years | 280 (5.5%) | 431 (7.5%) |
| 75 Years and over | 245 (8.0%) | 511 (11.0%) |
| Total | 4,728 (10.6%) | 7,460 (15.8%) |
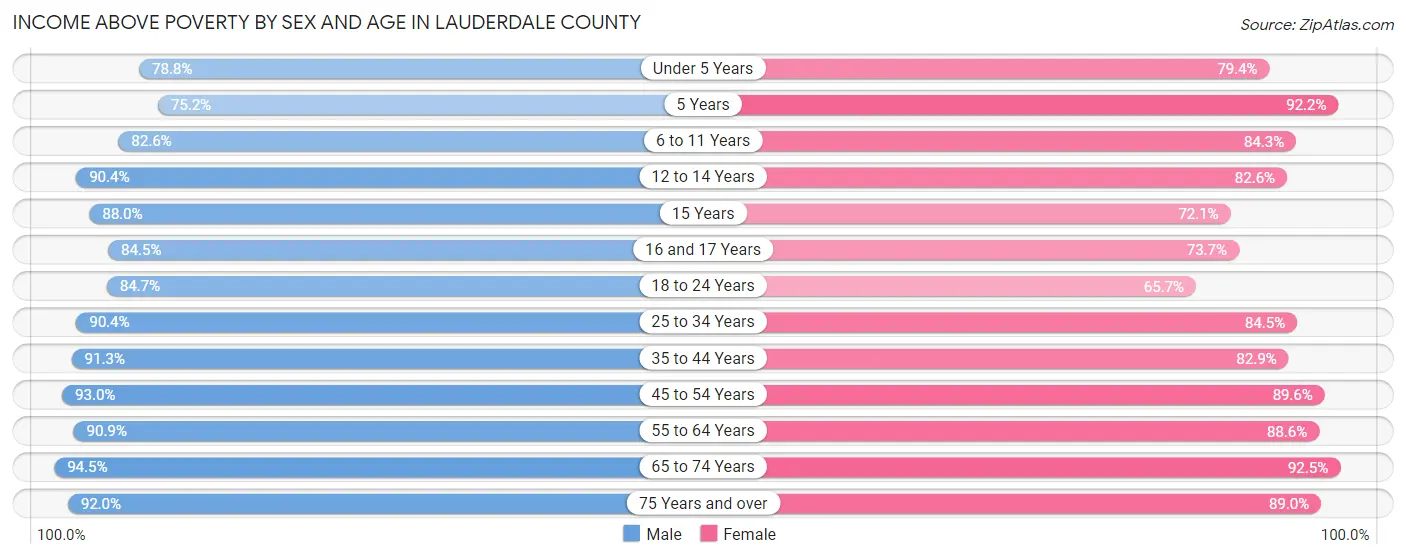
Income Above Poverty by Sex and Age in Lauderdale County
According to the poverty statistics in Lauderdale County, males aged 65 to 74 years and females aged 65 to 74 years are the age groups that are most secure financially, with 94.5% of males and 92.5% of females in these age groups living above the poverty line.
| Age Bracket | Male | Female |
| Under 5 Years | 1,886 (78.7%) | 1,797 (79.4%) |
| 5 Years | 310 (75.2%) | 528 (92.1%) |
| 6 to 11 Years | 2,484 (82.6%) | 2,342 (84.3%) |
| 12 to 14 Years | 1,641 (90.4%) | 1,425 (82.6%) |
| 15 Years | 688 (88.0%) | 572 (72.1%) |
| 16 and 17 Years | 747 (84.5%) | 535 (73.7%) |
| 18 to 24 Years | 4,136 (84.7%) | 3,443 (65.7%) |
| 25 to 34 Years | 4,924 (90.4%) | 4,700 (84.5%) |
| 35 to 44 Years | 4,841 (91.3%) | 4,220 (82.9%) |
| 45 to 54 Years | 5,160 (93.0%) | 5,108 (89.6%) |
| 55 to 64 Years | 5,447 (90.9%) | 5,749 (88.6%) |
| 65 to 74 Years | 4,806 (94.5%) | 5,291 (92.5%) |
| 75 Years and over | 2,808 (92.0%) | 4,118 (89.0%) |
| Total | 39,878 (89.4%) | 39,828 (84.2%) |
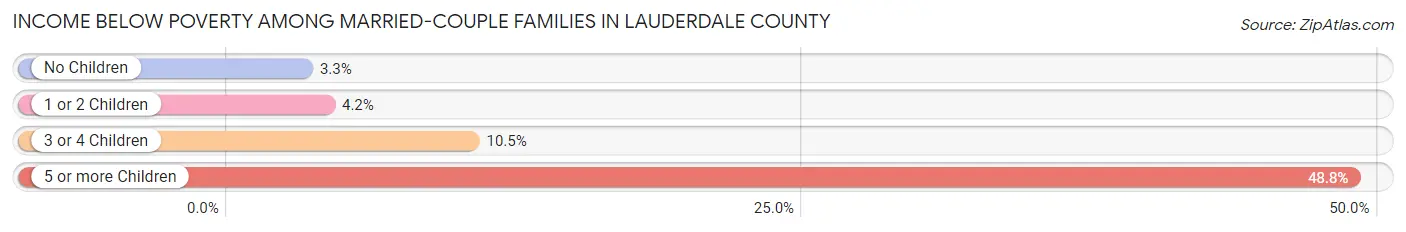
Income Below Poverty Among Married-Couple Families in Lauderdale County
The poverty statistics for married-couple families in Lauderdale County show that 4.2% or 770 of the total 18,369 families live below the poverty line. Families with 5 or more children have the highest poverty rate of 48.8%, comprising of 42 families. On the other hand, families with no children have the lowest poverty rate of 3.3%, which includes 376 families.
| Children | Above Poverty | Below Poverty |
| No Children | 11,155 (96.7%) | 376 (3.3%) |
| 1 or 2 Children | 5,446 (95.8%) | 240 (4.2%) |
| 3 or 4 Children | 954 (89.5%) | 112 (10.5%) |
| 5 or more Children | 44 (51.2%) | 42 (48.8%) |
| Total | 17,599 (95.8%) | 770 (4.2%) |
Income Below Poverty Among Single-Parent Households in Lauderdale County
According to the poverty data in Lauderdale County, 9.5% or 158 single-father households and 30.6% or 1,409 single-mother households are living below the poverty line. Among single-father households, those with 1 or 2 children have the highest poverty rate, with 144 households (20.1%) experiencing poverty. Likewise, among single-mother households, those with 3 or 4 children have the highest poverty rate, with 343 households (73.8%) falling below the poverty line.
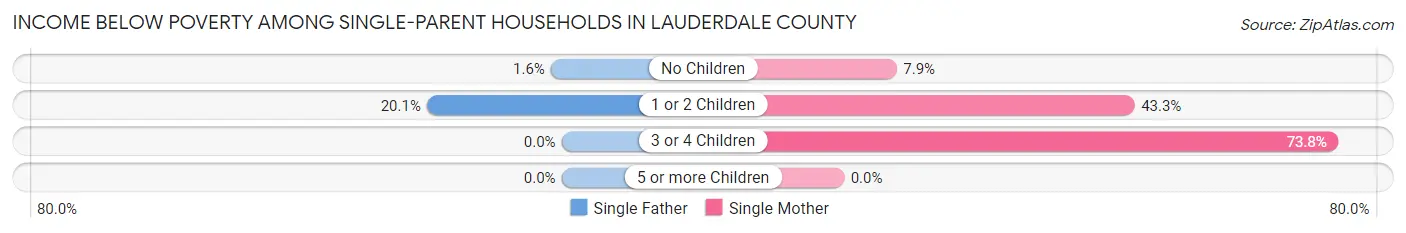
| Children | Single Father | Single Mother |
| No Children | 14 (1.6%) | 160 (7.9%) |
| 1 or 2 Children | 144 (20.1%) | 906 (43.3%) |
| 3 or 4 Children | 0 (0.0%) | 343 (73.8%) |
| 5 or more Children | 0 (0.0%) | 0 (0.0%) |
| Total | 158 (9.5%) | 1,409 (30.6%) |
Income Below Poverty Among Married-Couple vs Single-Parent Households in Lauderdale County
The poverty data for Lauderdale County shows that 770 of the married-couple family households (4.2%) and 1,567 of the single-parent households (25.0%) are living below the poverty level. Within the married-couple family households, those with 5 or more children have the highest poverty rate, with 42 households (48.8%) falling below the poverty line. Among the single-parent households, those with 3 or 4 children have the highest poverty rate, with 343 household (62.9%) living below poverty.
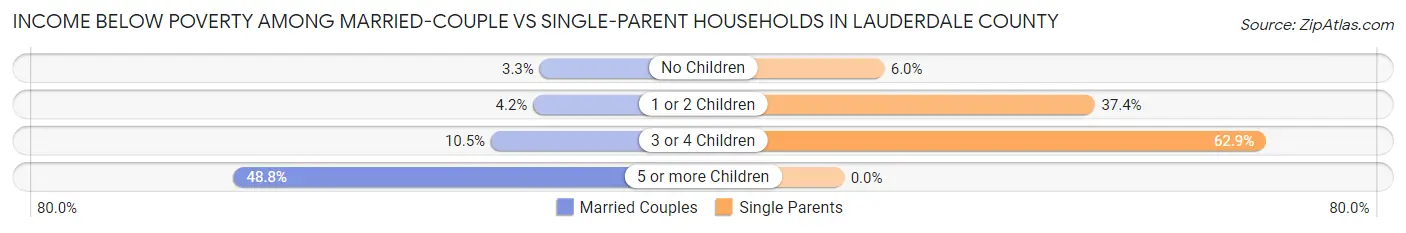
| Children | Married-Couple Families | Single-Parent Households |
| No Children | 376 (3.3%) | 174 (6.0%) |
| 1 or 2 Children | 240 (4.2%) | 1,050 (37.4%) |
| 3 or 4 Children | 112 (10.5%) | 343 (62.9%) |
| 5 or more Children | 42 (48.8%) | 0 (0.0%) |
| Total | 770 (4.2%) | 1,567 (25.0%) |
Race in Lauderdale County
The most populous races in Lauderdale County are White / Caucasian (79,592 | 84.4%), Black / African American (9,317 | 9.9%), and Two or more Races (3,768 | 4.0%).
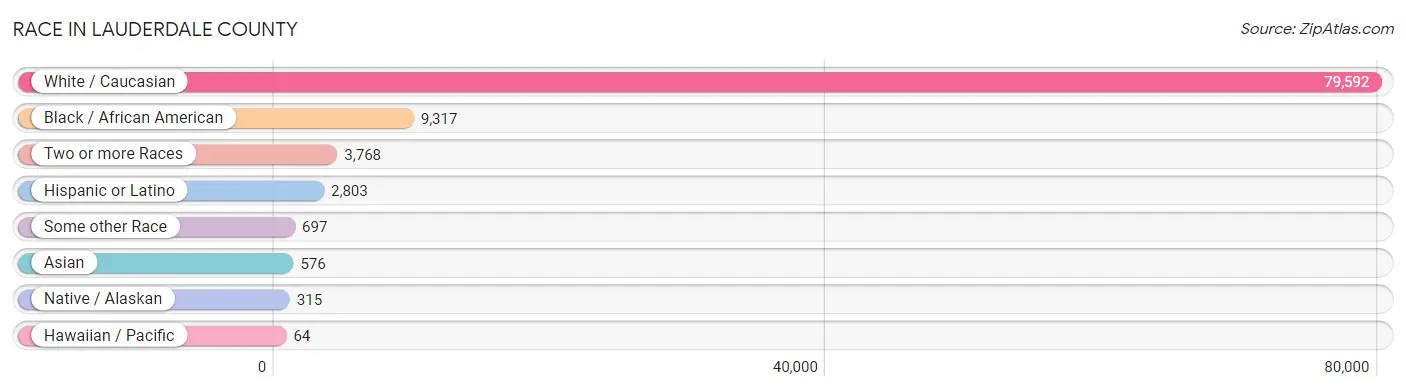
| Race | # Population | % Population |
| Asian | 576 | 0.6% |
| Black / African American | 9,317 | 9.9% |
| Hawaiian / Pacific | 64 | 0.1% |
| Hispanic or Latino | 2,803 | 3.0% |
| Native / Alaskan | 315 | 0.3% |
| White / Caucasian | 79,592 | 84.4% |
| Two or more Races | 3,768 | 4.0% |
| Some other Race | 697 | 0.7% |
| Total | 94,329 | 100.0% |
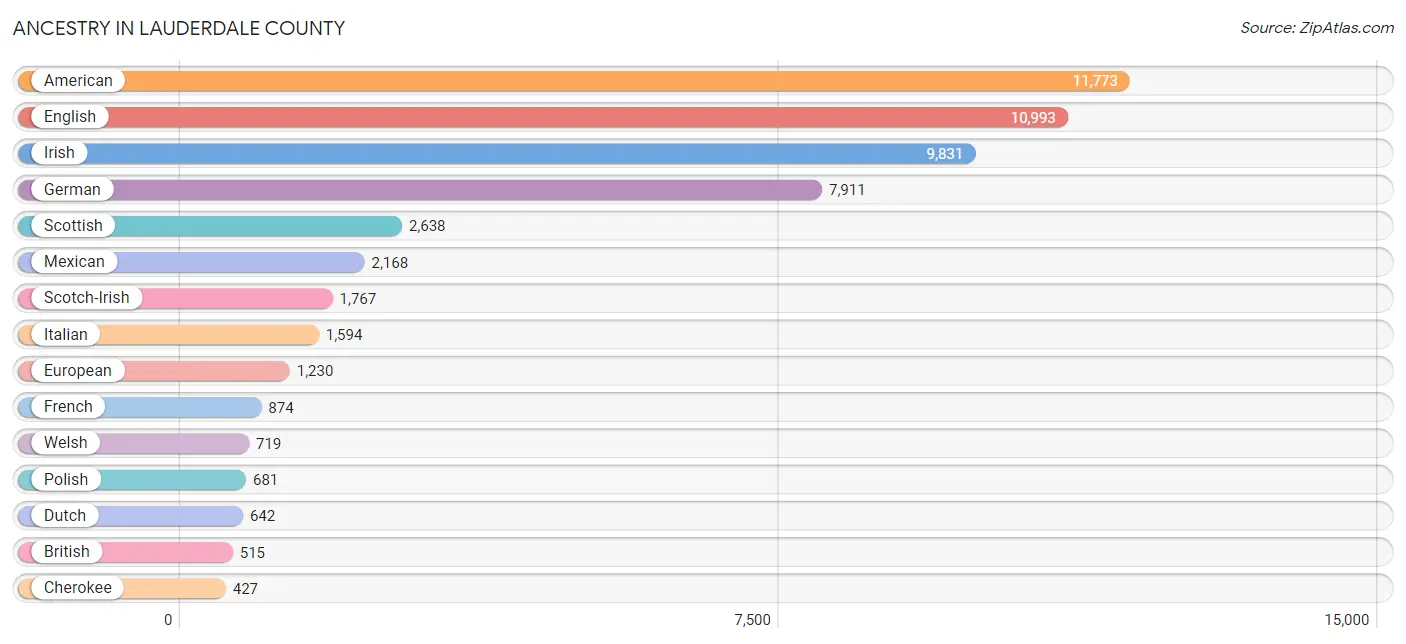
Ancestry in Lauderdale County
The most populous ancestries reported in Lauderdale County are American (11,773 | 12.5%), English (10,993 | 11.7%), Irish (9,831 | 10.4%), German (7,911 | 8.4%), and Scottish (2,638 | 2.8%), together accounting for 45.7% of all Lauderdale County residents.
| Ancestry | # Population | % Population |
| African | 125 | 0.1% |
| American | 11,773 | 12.5% |
| Arab | 273 | 0.3% |
| Austrian | 115 | 0.1% |
| Belgian | 8 | 0.0% |
| Bhutanese | 163 | 0.2% |
| Bolivian | 3 | 0.0% |
| British | 515 | 0.5% |
| Burmese | 81 | 0.1% |
| Cajun | 89 | 0.1% |
| Canadian | 119 | 0.1% |
| Celtic | 6 | 0.0% |
| Central American | 163 | 0.2% |
| Central American Indian | 44 | 0.1% |
| Cherokee | 427 | 0.4% |
| Chickasaw | 18 | 0.0% |
| Choctaw | 21 | 0.0% |
| Colombian | 18 | 0.0% |
| Costa Rican | 10 | 0.0% |
| Creek | 72 | 0.1% |
| Croatian | 8 | 0.0% |
| Cuban | 280 | 0.3% |
| Czech | 205 | 0.2% |
| Czechoslovakian | 53 | 0.1% |
| Danish | 125 | 0.1% |
| Dutch | 642 | 0.7% |
| Eastern European | 174 | 0.2% |
| Ecuadorian | 37 | 0.0% |
| English | 10,993 | 11.7% |
| European | 1,230 | 1.3% |
| Finnish | 170 | 0.2% |
| French | 874 | 0.9% |
| French Canadian | 62 | 0.1% |
| German | 7,911 | 8.4% |
| Greek | 148 | 0.2% |
| Guamanian / Chamorro | 28 | 0.0% |
| Guatemalan | 148 | 0.2% |
| Haitian | 25 | 0.0% |
| Honduran | 3 | 0.0% |
| Hungarian | 126 | 0.1% |
| Indian (Asian) | 351 | 0.4% |
| Irish | 9,831 | 10.4% |
| Italian | 1,594 | 1.7% |
| Jamaican | 31 | 0.0% |
| Japanese | 13 | 0.0% |
| Korean | 193 | 0.2% |
| Lebanese | 202 | 0.2% |
| Lithuanian | 22 | 0.0% |
| Lumbee | 14 | 0.0% |
| Mexican | 2,168 | 2.3% |
| Mexican American Indian | 53 | 0.1% |
| Moroccan | 11 | 0.0% |
| Native Hawaiian | 52 | 0.1% |
| Nicaraguan | 2 | 0.0% |
| Nigerian | 19 | 0.0% |
| Northern European | 116 | 0.1% |
| Norwegian | 290 | 0.3% |
| Osage | 5 | 0.0% |
| Pennsylvania German | 12 | 0.0% |
| Polish | 681 | 0.7% |
| Portuguese | 138 | 0.2% |
| Pueblo | 53 | 0.1% |
| Puerto Rican | 57 | 0.1% |
| Romanian | 9 | 0.0% |
| Russian | 112 | 0.1% |
| Scandinavian | 110 | 0.1% |
| Scotch-Irish | 1,767 | 1.9% |
| Scottish | 2,638 | 2.8% |
| Seminole | 7 | 0.0% |
| Serbian | 9 | 0.0% |
| Sioux | 17 | 0.0% |
| Slovak | 12 | 0.0% |
| Slovene | 16 | 0.0% |
| South American | 90 | 0.1% |
| Sri Lankan | 82 | 0.1% |
| Subsaharan African | 196 | 0.2% |
| Swedish | 108 | 0.1% |
| Swiss | 136 | 0.1% |
| Thai | 134 | 0.1% |
| Turkish | 9 | 0.0% |
| Ukrainian | 28 | 0.0% |
| Uruguayan | 28 | 0.0% |
| Venezuelan | 4 | 0.0% |
| Welsh | 719 | 0.8% |
| Yugoslavian | 70 | 0.1% | View All 85 Rows |
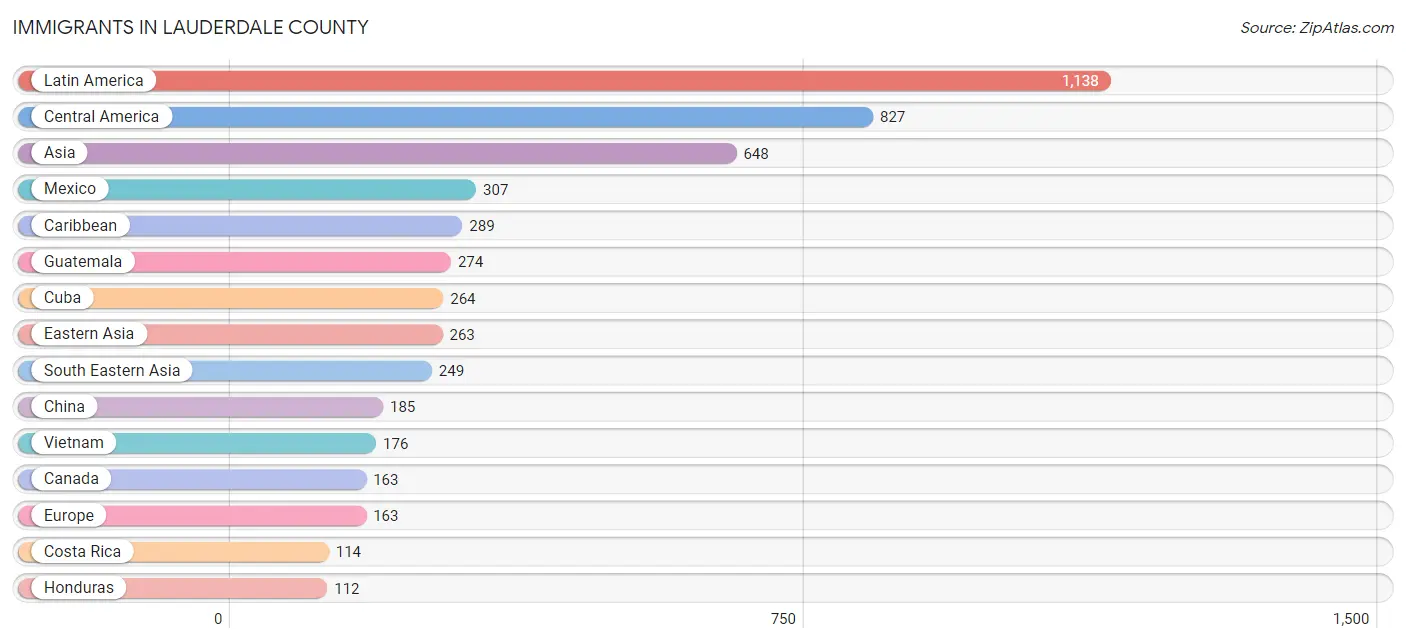
Immigrants in Lauderdale County
The most numerous immigrant groups reported in Lauderdale County came from Latin America (1,138 | 1.2%), Central America (827 | 0.9%), Asia (648 | 0.7%), Mexico (307 | 0.3%), and Caribbean (289 | 0.3%), together accounting for 3.4% of all Lauderdale County residents.
| Immigration Origin | # Population | % Population |
| Africa | 104 | 0.1% |
| Asia | 648 | 0.7% |
| Belgium | 8 | 0.0% |
| Bolivia | 3 | 0.0% |
| Canada | 163 | 0.2% |
| Caribbean | 289 | 0.3% |
| Central America | 827 | 0.9% |
| China | 185 | 0.2% |
| Colombia | 18 | 0.0% |
| Congo | 52 | 0.1% |
| Costa Rica | 114 | 0.1% |
| Cuba | 264 | 0.3% |
| Eastern Asia | 263 | 0.3% |
| Eastern Europe | 82 | 0.1% |
| El Salvador | 18 | 0.0% |
| England | 9 | 0.0% |
| Europe | 163 | 0.2% |
| Germany | 33 | 0.0% |
| Guatemala | 274 | 0.3% |
| Haiti | 11 | 0.0% |
| Honduras | 112 | 0.1% |
| Hungary | 32 | 0.0% |
| India | 71 | 0.1% |
| Jamaica | 10 | 0.0% |
| Japan | 27 | 0.0% |
| Korea | 51 | 0.1% |
| Latin America | 1,138 | 1.2% |
| Mexico | 307 | 0.3% |
| Middle Africa | 52 | 0.1% |
| Nepal | 5 | 0.0% |
| Nicaragua | 2 | 0.0% |
| Nigeria | 16 | 0.0% |
| Northern Europe | 21 | 0.0% |
| Philippines | 54 | 0.1% |
| Portugal | 19 | 0.0% |
| Russia | 50 | 0.1% |
| Saudi Arabia | 60 | 0.1% |
| Singapore | 17 | 0.0% |
| South America | 22 | 0.0% |
| South Central Asia | 76 | 0.1% |
| South Eastern Asia | 249 | 0.3% |
| Southern Europe | 19 | 0.0% |
| Thailand | 2 | 0.0% |
| Trinidad and Tobago | 4 | 0.0% |
| Venezuela | 1 | 0.0% |
| Vietnam | 176 | 0.2% |
| Western Africa | 16 | 0.0% |
| Western Asia | 60 | 0.1% |
| Western Europe | 41 | 0.0% | View All 49 Rows |
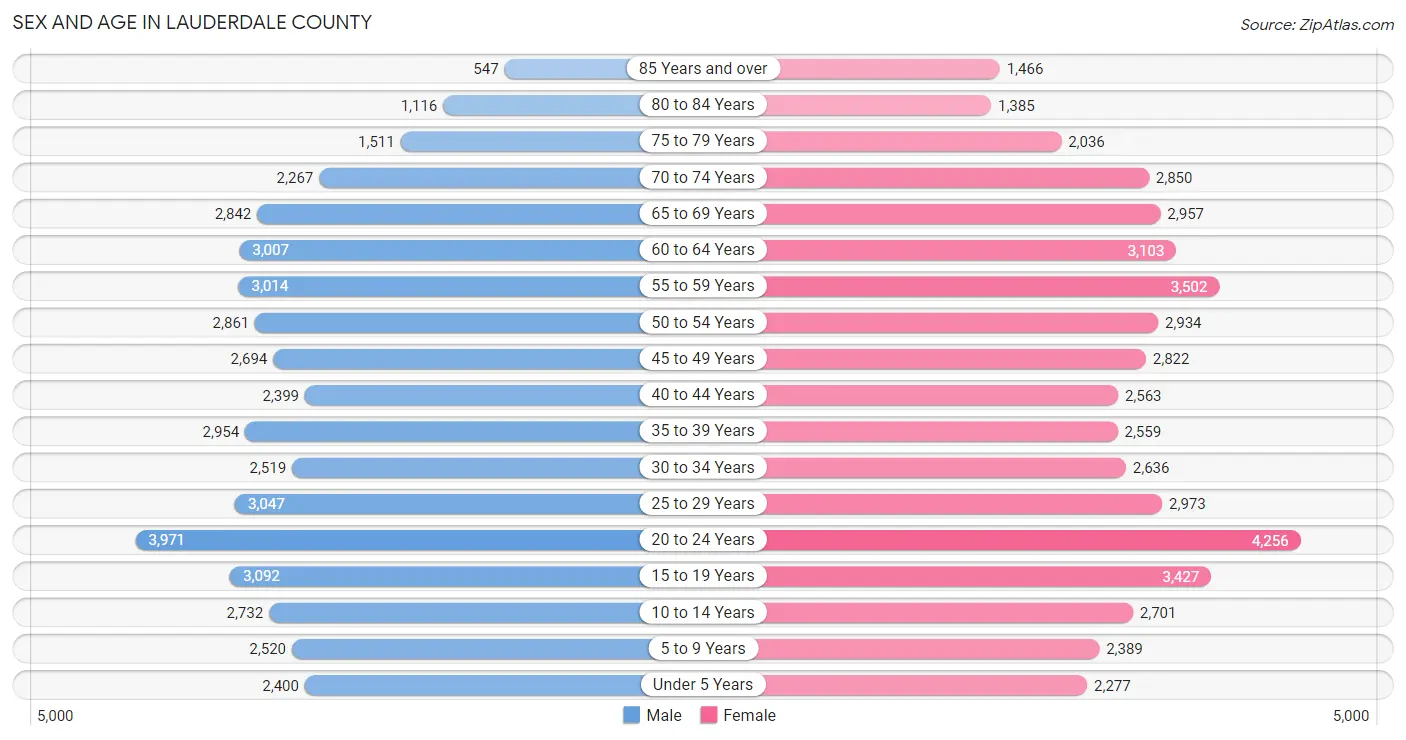
Sex and Age in Lauderdale County
Sex and Age in Lauderdale County
The most populous age groups in Lauderdale County are 20 to 24 Years (3,971 | 8.7%) for men and 20 to 24 Years (4,256 | 8.7%) for women.
| Age Bracket | Male | Female |
| Under 5 Years | 2,400 (5.3%) | 2,277 (4.7%) |
| 5 to 9 Years | 2,520 (5.5%) | 2,389 (4.9%) |
| 10 to 14 Years | 2,732 (6.0%) | 2,701 (5.5%) |
| 15 to 19 Years | 3,092 (6.8%) | 3,427 (7.0%) |
| 20 to 24 Years | 3,971 (8.7%) | 4,256 (8.7%) |
| 25 to 29 Years | 3,047 (6.7%) | 2,973 (6.1%) |
| 30 to 34 Years | 2,519 (5.5%) | 2,636 (5.4%) |
| 35 to 39 Years | 2,954 (6.5%) | 2,559 (5.2%) |
| 40 to 44 Years | 2,399 (5.3%) | 2,563 (5.2%) |
| 45 to 49 Years | 2,694 (5.9%) | 2,822 (5.8%) |
| 50 to 54 Years | 2,861 (6.3%) | 2,934 (6.0%) |
| 55 to 59 Years | 3,014 (6.6%) | 3,502 (7.2%) |
| 60 to 64 Years | 3,007 (6.6%) | 3,103 (6.4%) |
| 65 to 69 Years | 2,842 (6.2%) | 2,957 (6.0%) |
| 70 to 74 Years | 2,267 (5.0%) | 2,850 (5.8%) |
| 75 to 79 Years | 1,511 (3.3%) | 2,036 (4.2%) |
| 80 to 84 Years | 1,116 (2.5%) | 1,385 (2.8%) |
| 85 Years and over | 547 (1.2%) | 1,466 (3.0%) |
| Total | 45,493 (100.0%) | 48,836 (100.0%) |
Families and Households in Lauderdale County
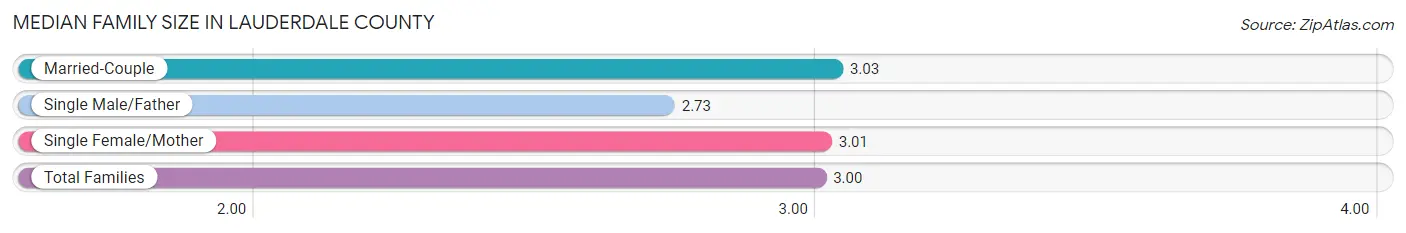
Median Family Size in Lauderdale County
The median family size in Lauderdale County is 3.00 persons per family, with married-couple families (18,369 | 74.6%) accounting for the largest median family size of 3.03 persons per family. On the other hand, single male/father families (1,667 | 6.8%) represent the smallest median family size with 2.73 persons per family.
| Family Type | # Families | Family Size |
| Married-Couple | 18,369 (74.6%) | 3.03 |
| Single Male/Father | 1,667 (6.8%) | 2.73 |
| Single Female/Mother | 4,597 (18.7%) | 3.01 |
| Total Families | 24,633 (100.0%) | 3.00 |
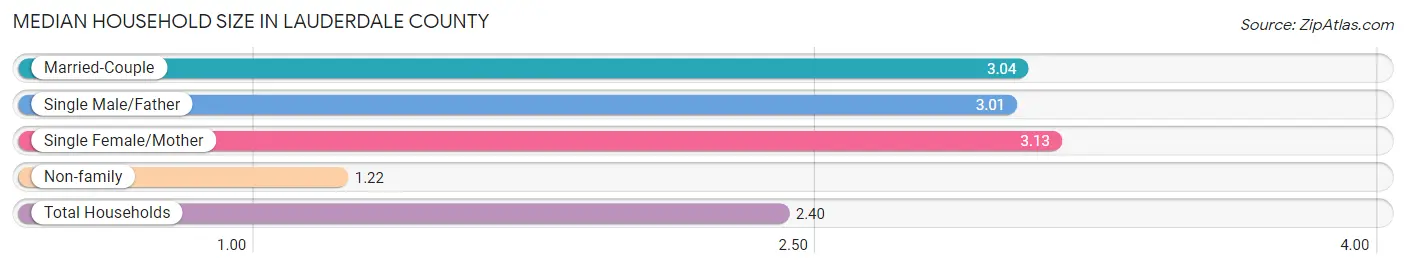
Median Household Size in Lauderdale County
The median household size in Lauderdale County is 2.40 persons per household, with single female/mother households (4,597 | 12.0%) accounting for the largest median household size of 3.13 persons per household. non-family households (13,604 | 35.6%) represent the smallest median household size with 1.22 persons per household.
| Household Type | # Households | Household Size |
| Married-Couple | 18,369 (48.0%) | 3.04 |
| Single Male/Father | 1,667 (4.4%) | 3.01 |
| Single Female/Mother | 4,597 (12.0%) | 3.13 |
| Non-family | 13,604 (35.6%) | 1.22 |
| Total Households | 38,237 (100.0%) | 2.40 |
Household Size by Marriage Status in Lauderdale County
Out of a total of 38,237 households in Lauderdale County, 24,633 (64.4%) are family households, while 13,604 (35.6%) are nonfamily households. The most numerous type of family households are 2-person households, comprising 12,435, and the most common type of nonfamily households are 1-person households, comprising 11,229.
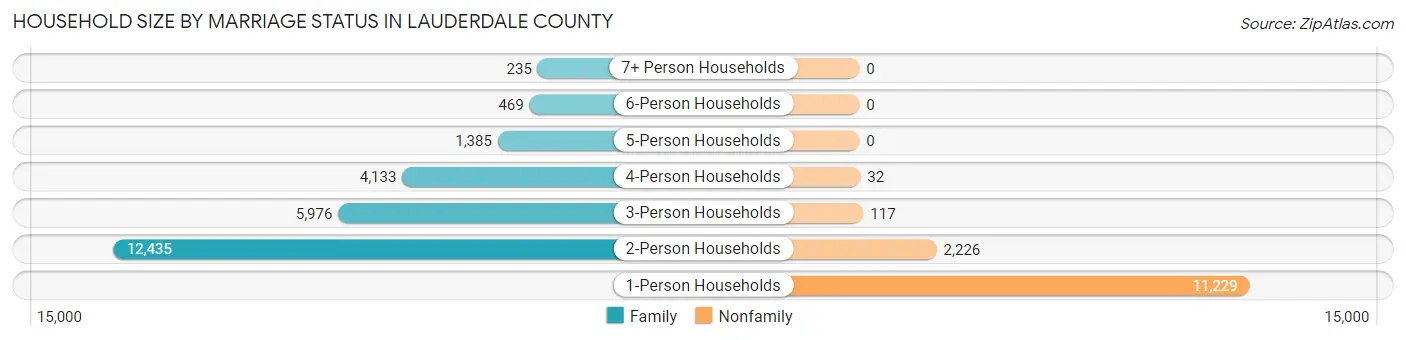
| Household Size | Family Households | Nonfamily Households |
| 1-Person Households | - | 11,229 (29.4%) |
| 2-Person Households | 12,435 (32.5%) | 2,226 (5.8%) |
| 3-Person Households | 5,976 (15.6%) | 117 (0.3%) |
| 4-Person Households | 4,133 (10.8%) | 32 (0.1%) |
| 5-Person Households | 1,385 (3.6%) | 0 (0.0%) |
| 6-Person Households | 469 (1.2%) | 0 (0.0%) |
| 7+ Person Households | 235 (0.6%) | 0 (0.0%) |
| Total | 24,633 (64.4%) | 13,604 (35.6%) |
Female Fertility in Lauderdale County
Fertility by Age in Lauderdale County
Average fertility rate in Lauderdale County is 50.0 births per 1,000 women. Women in the age bracket of 20 to 34 years have the highest fertility rate with 87.0 births per 1,000 women. Women in the age bracket of 20 to 34 years acount for 78.8% of all women with births.
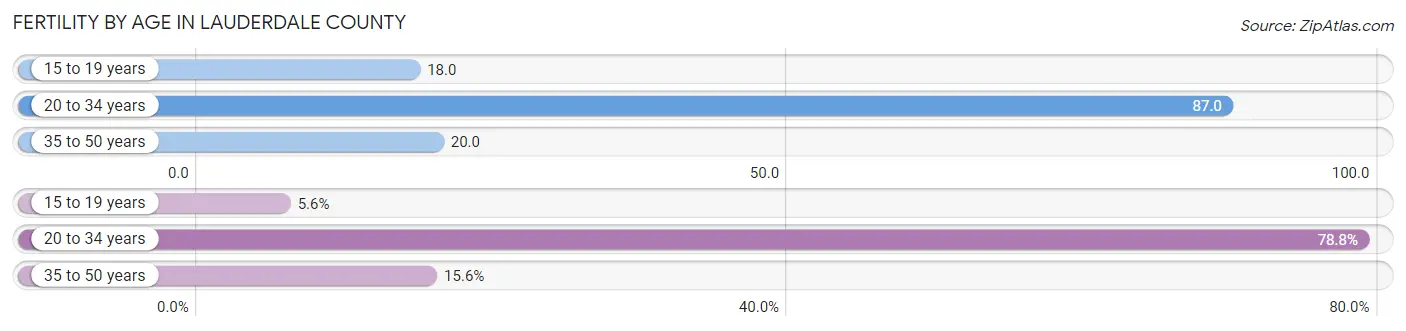
| Age Bracket | Women with Births | Births / 1,000 Women |
| 15 to 19 years | 61 (5.6%) | 18.0 |
| 20 to 34 years | 857 (78.8%) | 87.0 |
| 35 to 50 years | 169 (15.5%) | 20.0 |
| Total | 1,087 (100.0%) | 50.0 |
Fertility by Age by Marriage Status in Lauderdale County
68.9% of women with births (1,087) in Lauderdale County are married. The highest percentage of unmarried women with births falls into 15 to 19 years age bracket with 42.6% of them unmarried at the time of birth, while the lowest percentage of unmarried women with births belong to 35 to 50 years age bracket with 26.0% of them unmarried.
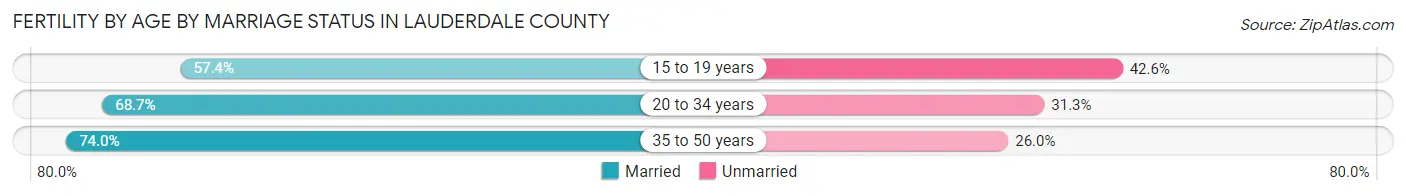
| Age Bracket | Married | Unmarried |
| 15 to 19 years | 35 (57.4%) | 26 (42.6%) |
| 20 to 34 years | 589 (68.7%) | 268 (31.3%) |
| 35 to 50 years | 125 (74.0%) | 44 (26.0%) |
| Total | 749 (68.9%) | 338 (31.1%) |
Fertility by Education in Lauderdale County
Average fertility rate in Lauderdale County is 50.0 births per 1,000 women. Women with the education attainment of bachelor's degree have the highest fertility rate of 95.0 births per 1,000 women, while women with the education attainment of less than high school have the lowest fertility at 18.0 births per 1,000 women. Women with the education attainment of high school diploma represent 40.2% of all women with births.
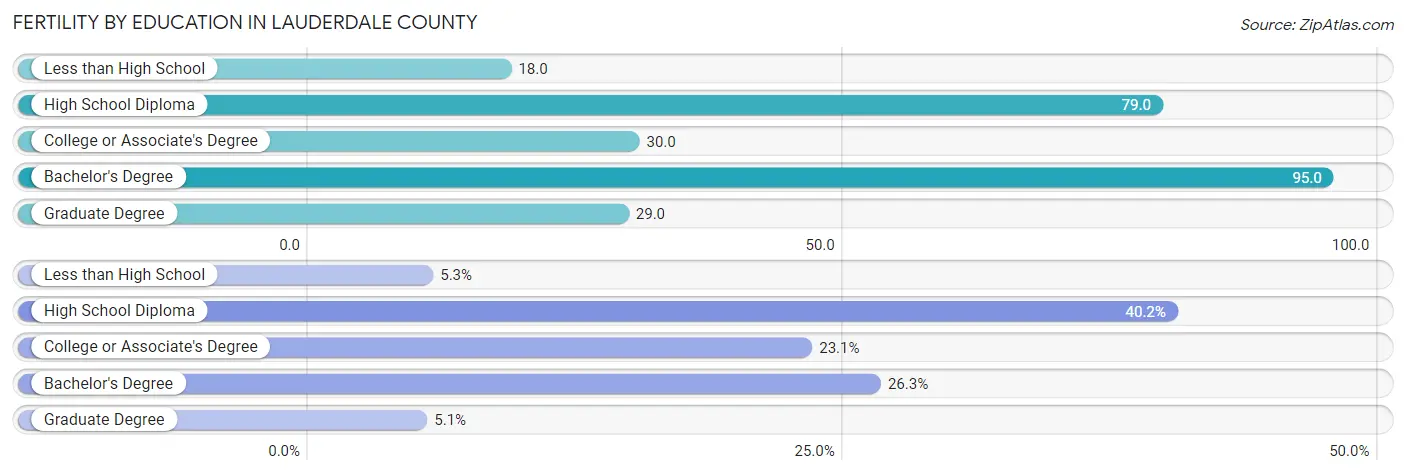
| Educational Attainment | Women with Births | Births / 1,000 Women |
| Less than High School | 58 (5.3%) | 18.0 |
| High School Diploma | 437 (40.2%) | 79.0 |
| College or Associate's Degree | 251 (23.1%) | 30.0 |
| Bachelor's Degree | 286 (26.3%) | 95.0 |
| Graduate Degree | 55 (5.1%) | 29.0 |
| Total | 1,087 (100.0%) | 50.0 |
Fertility by Education by Marriage Status in Lauderdale County
31.1% of women with births in Lauderdale County are unmarried. Women with the educational attainment of graduate degree are most likely to be married with 100.0% of them married at childbirth, while women with the educational attainment of high school diploma are least likely to be married with 50.1% of them unmarried at childbirth.
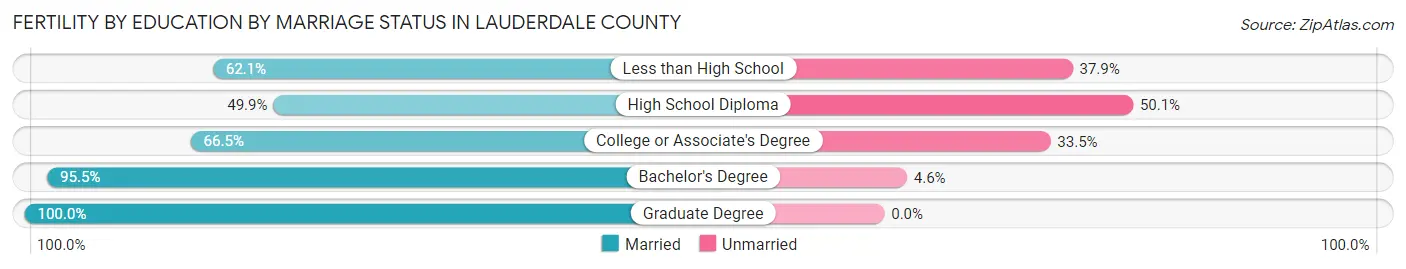
| Educational Attainment | Married | Unmarried |
| Less than High School | 36 (62.1%) | 22 (37.9%) |
| High School Diploma | 218 (49.9%) | 219 (50.1%) |
| College or Associate's Degree | 167 (66.5%) | 84 (33.5%) |
| Bachelor's Degree | 273 (95.5%) | 13 (4.5%) |
| Graduate Degree | 55 (100.0%) | 0 (0.0%) |
| Total | 749 (68.9%) | 338 (31.1%) |
Employment Characteristics in Lauderdale County
Employment by Class of Employer in Lauderdale County
Among the 42,958 employed individuals in Lauderdale County, private company employees (30,652 | 71.4%), local government employees (2,997 | 7.0%), and self-employed (not incorporated) (2,163 | 5.0%) make up the most common classes of employment.
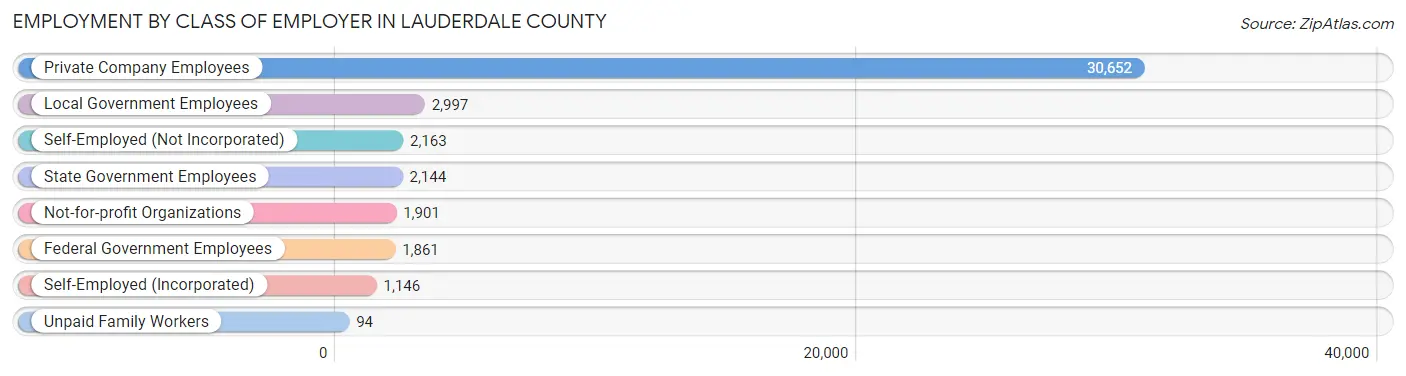
| Employer Class | # Employees | % Employees |
| Private Company Employees | 30,652 | 71.4% |
| Self-Employed (Incorporated) | 1,146 | 2.7% |
| Self-Employed (Not Incorporated) | 2,163 | 5.0% |
| Not-for-profit Organizations | 1,901 | 4.4% |
| Local Government Employees | 2,997 | 7.0% |
| State Government Employees | 2,144 | 5.0% |
| Federal Government Employees | 1,861 | 4.3% |
| Unpaid Family Workers | 94 | 0.2% |
| Total | 42,958 | 100.0% |
Employment Status by Age in Lauderdale County
According to the labor force statistics for Lauderdale County, out of the total population over 16 years of age (77,733), 58.1% or 45,163 individuals are in the labor force, with 3.6% or 1,626 of them unemployed. The age group with the highest labor force participation rate is 25 to 29 years, with 81.9% or 4,930 individuals in the labor force. Within the labor force, the 16 to 19 years age range has the highest percentage of unemployed individuals, with 7.0% or 167 of them being unemployed.
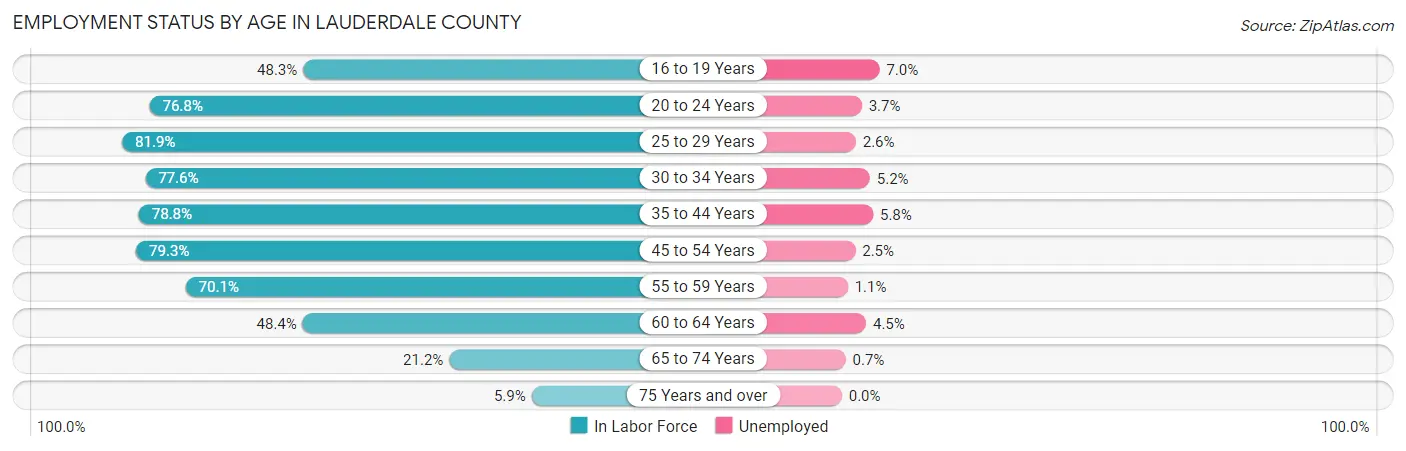
| Age Bracket | In Labor Force | Unemployed |
| 16 to 19 Years | 2,387 (48.3%) | 167 (7.0%) |
| 20 to 24 Years | 6,318 (76.8%) | 234 (3.7%) |
| 25 to 29 Years | 4,930 (81.9%) | 128 (2.6%) |
| 30 to 34 Years | 4,000 (77.6%) | 208 (5.2%) |
| 35 to 44 Years | 8,254 (78.8%) | 479 (5.8%) |
| 45 to 54 Years | 8,970 (79.3%) | 224 (2.5%) |
| 55 to 59 Years | 4,568 (70.1%) | 50 (1.1%) |
| 60 to 64 Years | 2,957 (48.4%) | 133 (4.5%) |
| 65 to 74 Years | 2,314 (21.2%) | 16 (0.7%) |
| 75 Years and over | 476 (5.9%) | 0 (0.0%) |
| Total | 45,163 (58.1%) | 1,626 (3.6%) |
Employment Status by Educational Attainment in Lauderdale County
According to labor force statistics for Lauderdale County, 73.9% of individuals (33,689) out of the total population between 25 and 64 years of age (45,587) are in the labor force, with 3.6% or 1,213 of them being unemployed. The group with the highest labor force participation rate are those with the educational attainment of bachelor's degree or higher, with 82.3% or 9,595 individuals in the labor force. Within the labor force, individuals with less than high school education have the highest percentage of unemployment, with 9.6% or 252 of them being unemployed.
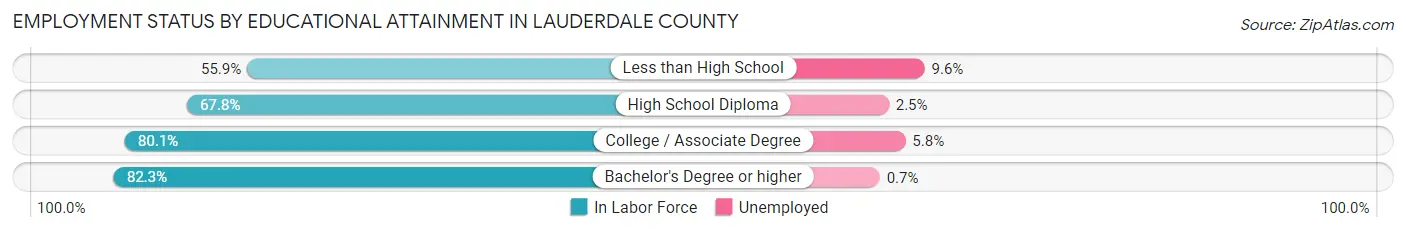
| Educational Attainment | In Labor Force | Unemployed |
| Less than High School | 2,622 (55.9%) | 450 (9.6%) |
| High School Diploma | 10,758 (67.8%) | 397 (2.5%) |
| College / Associate Degree | 10,710 (80.1%) | 776 (5.8%) |
| Bachelor's Degree or higher | 9,595 (82.3%) | 82 (0.7%) |
| Total | 33,689 (73.9%) | 1,641 (3.6%) |
Employment Occupations by Sex in Lauderdale County
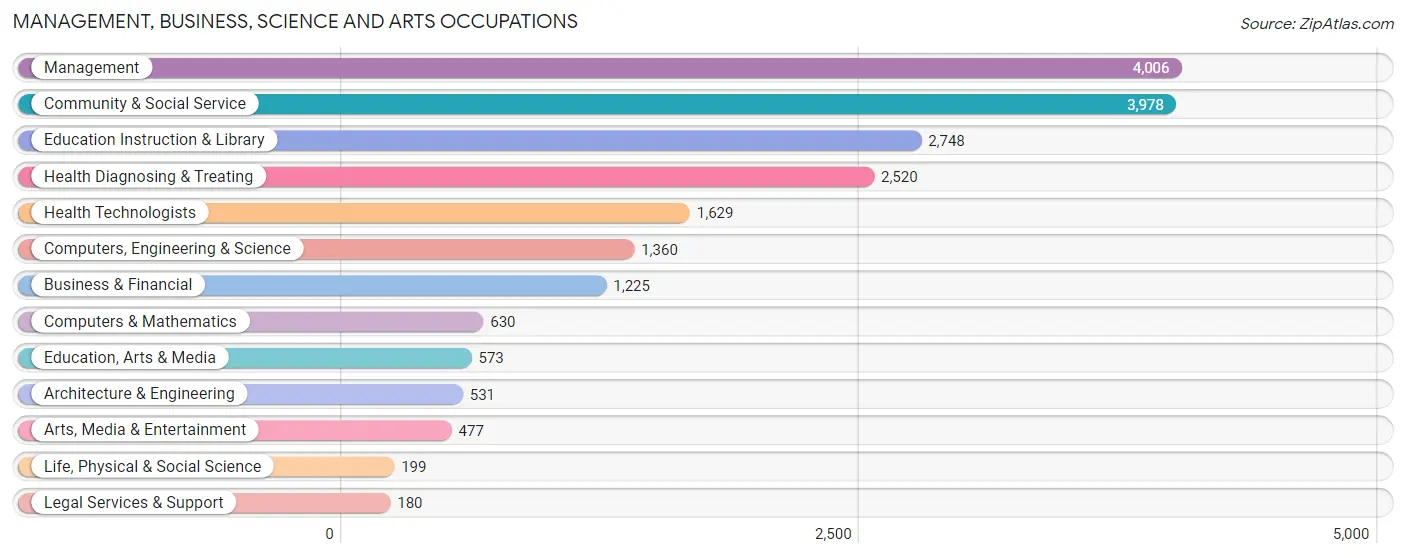
Management, Business, Science and Arts Occupations
The most common Management, Business, Science and Arts occupations in Lauderdale County are Management (4,006 | 9.2%), Community & Social Service (3,978 | 9.1%), Education Instruction & Library (2,748 | 6.3%), Health Diagnosing & Treating (2,520 | 5.8%), and Health Technologists (1,629 | 3.7%).
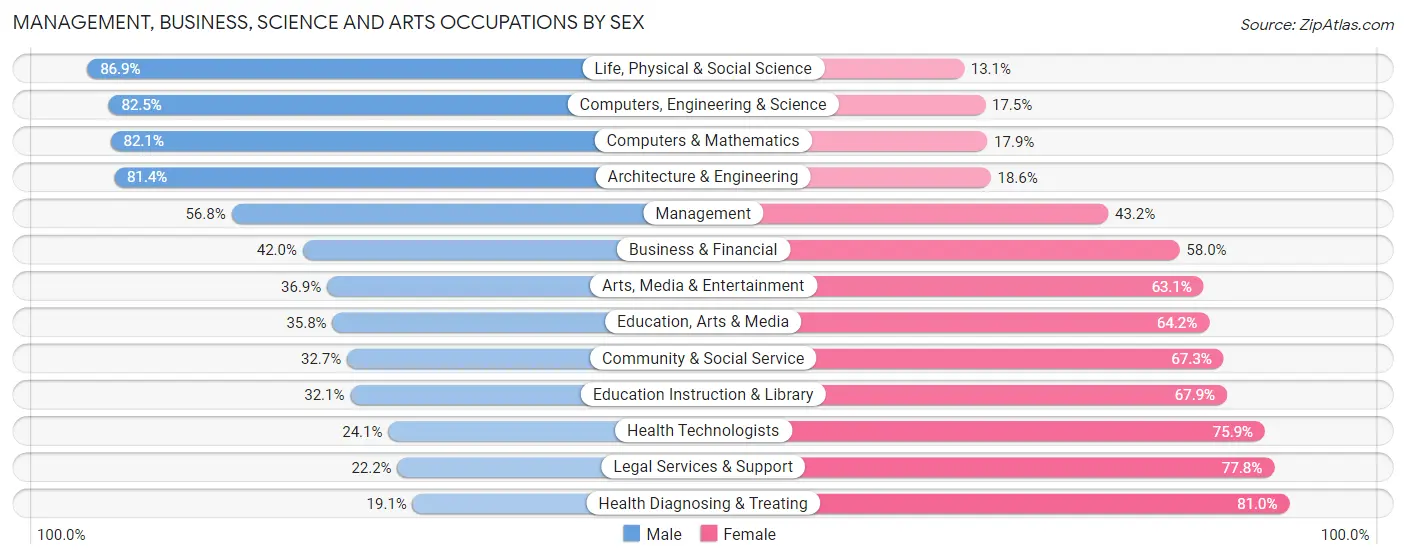
Management, Business, Science and Arts Occupations by Sex
Within the Management, Business, Science and Arts occupations in Lauderdale County, the most male-oriented occupations are Life, Physical & Social Science (86.9%), Computers, Engineering & Science (82.5%), and Computers & Mathematics (82.1%), while the most female-oriented occupations are Health Diagnosing & Treating (80.9%), Legal Services & Support (77.8%), and Health Technologists (75.9%).
| Occupation | Male | Female |
| Management | 2,277 (56.8%) | 1,729 (43.2%) |
| Business & Financial | 514 (42.0%) | 711 (58.0%) |
| Computers, Engineering & Science | 1,122 (82.5%) | 238 (17.5%) |
| Computers & Mathematics | 517 (82.1%) | 113 (17.9%) |
| Architecture & Engineering | 432 (81.4%) | 99 (18.6%) |
| Life, Physical & Social Science | 173 (86.9%) | 26 (13.1%) |
| Community & Social Service | 1,302 (32.7%) | 2,676 (67.3%) |
| Education, Arts & Media | 205 (35.8%) | 368 (64.2%) |
| Legal Services & Support | 40 (22.2%) | 140 (77.8%) |
| Education Instruction & Library | 881 (32.1%) | 1,867 (67.9%) |
| Arts, Media & Entertainment | 176 (36.9%) | 301 (63.1%) |
| Health Diagnosing & Treating | 480 (19.1%) | 2,040 (80.9%) |
| Health Technologists | 393 (24.1%) | 1,236 (75.9%) |
| Total (Category) | 5,695 (43.5%) | 7,394 (56.5%) |
| Total (Overall) | 23,821 (54.8%) | 19,653 (45.2%) |
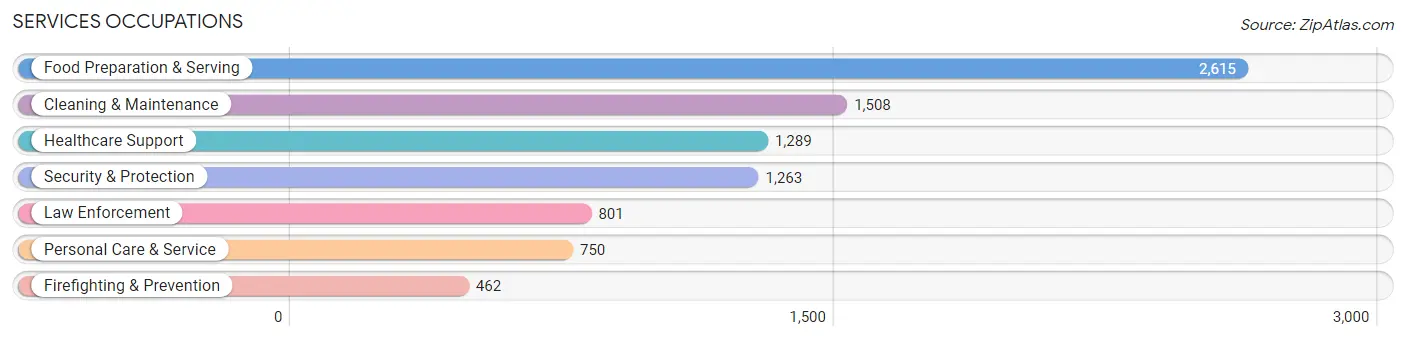
Services Occupations
The most common Services occupations in Lauderdale County are Food Preparation & Serving (2,615 | 6.0%), Cleaning & Maintenance (1,508 | 3.5%), Healthcare Support (1,289 | 3.0%), Security & Protection (1,263 | 2.9%), and Law Enforcement (801 | 1.8%).
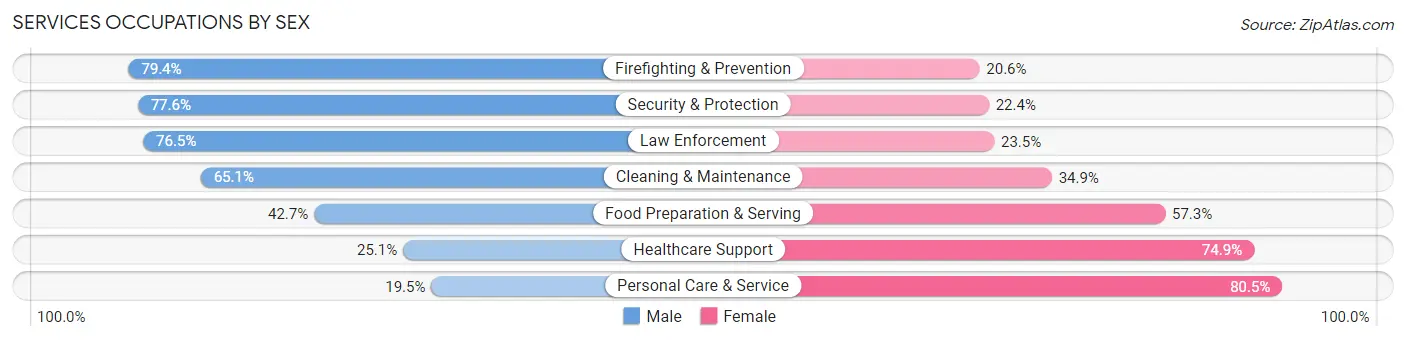
Services Occupations by Sex
Within the Services occupations in Lauderdale County, the most male-oriented occupations are Firefighting & Prevention (79.4%), Security & Protection (77.6%), and Law Enforcement (76.5%), while the most female-oriented occupations are Personal Care & Service (80.5%), Healthcare Support (74.9%), and Food Preparation & Serving (57.3%).
| Occupation | Male | Female |
| Healthcare Support | 323 (25.1%) | 966 (74.9%) |
| Security & Protection | 980 (77.6%) | 283 (22.4%) |
| Firefighting & Prevention | 367 (79.4%) | 95 (20.6%) |
| Law Enforcement | 613 (76.5%) | 188 (23.5%) |
| Food Preparation & Serving | 1,116 (42.7%) | 1,499 (57.3%) |
| Cleaning & Maintenance | 982 (65.1%) | 526 (34.9%) |
| Personal Care & Service | 146 (19.5%) | 604 (80.5%) |
| Total (Category) | 3,547 (47.8%) | 3,878 (52.2%) |
| Total (Overall) | 23,821 (54.8%) | 19,653 (45.2%) |
Sales and Office Occupations
The most common Sales and Office occupations in Lauderdale County are Sales & Related (6,035 | 13.9%), and Office & Administration (4,707 | 10.8%).

Sales and Office Occupations by Sex
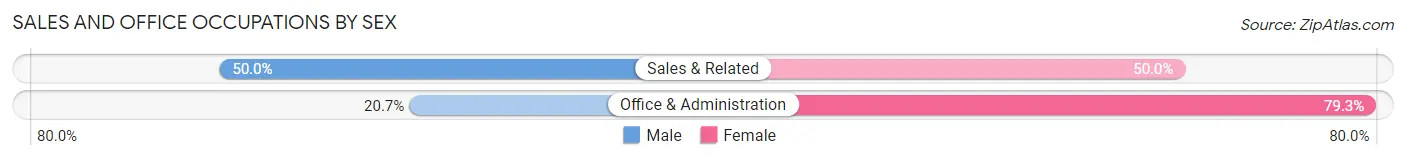
| Occupation | Male | Female |
| Sales & Related | 3,020 (50.0%) | 3,015 (50.0%) |
| Office & Administration | 974 (20.7%) | 3,733 (79.3%) |
| Total (Category) | 3,994 (37.2%) | 6,748 (62.8%) |
| Total (Overall) | 23,821 (54.8%) | 19,653 (45.2%) |
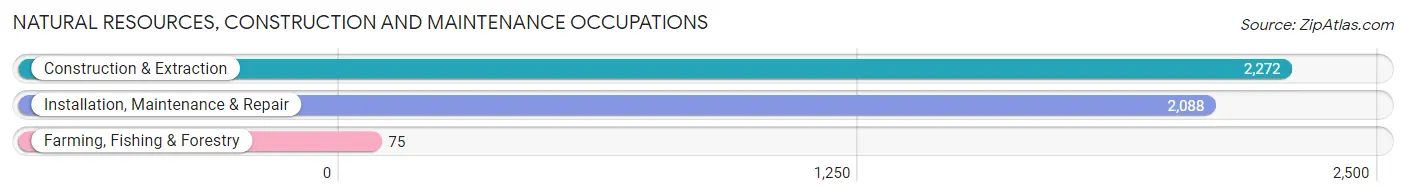
Natural Resources, Construction and Maintenance Occupations
The most common Natural Resources, Construction and Maintenance occupations in Lauderdale County are Construction & Extraction (2,272 | 5.2%), Installation, Maintenance & Repair (2,088 | 4.8%), and Farming, Fishing & Forestry (75 | 0.2%).
Natural Resources, Construction and Maintenance Occupations by Sex
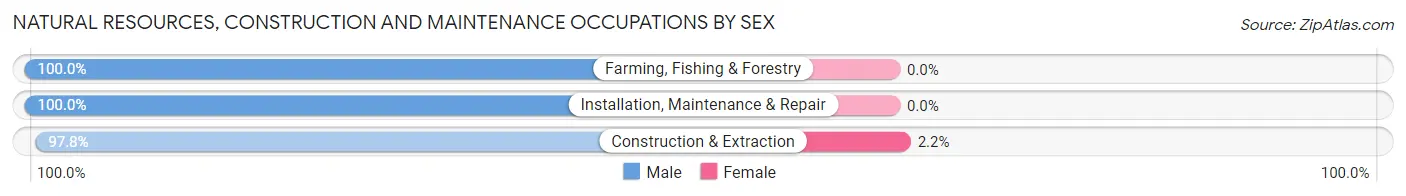
| Occupation | Male | Female |
| Farming, Fishing & Forestry | 75 (100.0%) | 0 (0.0%) |
| Construction & Extraction | 2,221 (97.8%) | 51 (2.2%) |
| Installation, Maintenance & Repair | 2,088 (100.0%) | 0 (0.0%) |
| Total (Category) | 4,384 (98.9%) | 51 (1.1%) |
| Total (Overall) | 23,821 (54.8%) | 19,653 (45.2%) |
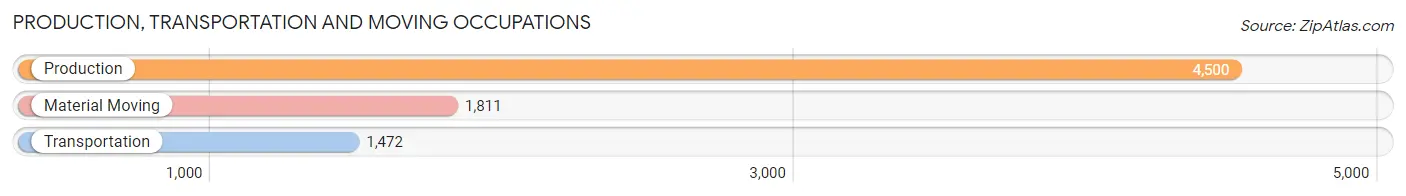
Production, Transportation and Moving Occupations
The most common Production, Transportation and Moving occupations in Lauderdale County are Production (4,500 | 10.3%), Material Moving (1,811 | 4.2%), and Transportation (1,472 | 3.4%).
Production, Transportation and Moving Occupations by Sex
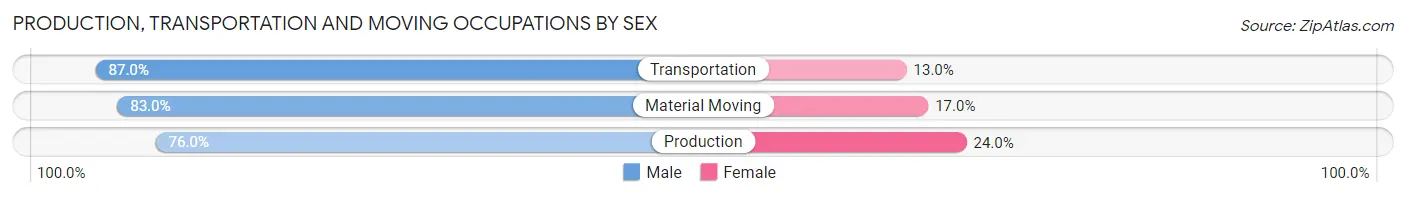
| Occupation | Male | Female |
| Production | 3,418 (76.0%) | 1,082 (24.0%) |
| Transportation | 1,280 (87.0%) | 192 (13.0%) |
| Material Moving | 1,503 (83.0%) | 308 (17.0%) |
| Total (Category) | 6,201 (79.7%) | 1,582 (20.3%) |
| Total (Overall) | 23,821 (54.8%) | 19,653 (45.2%) |
Employment Industries by Sex in Lauderdale County
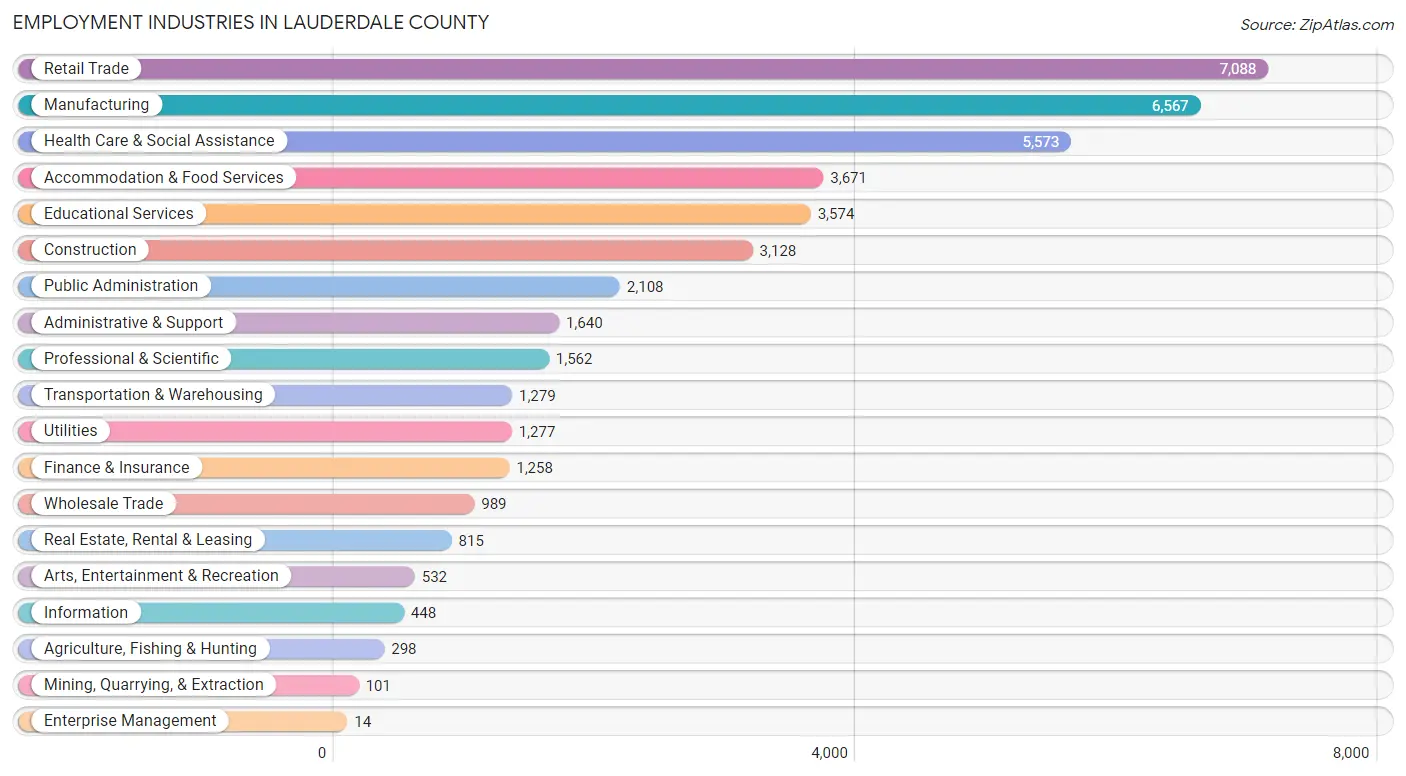
Employment Industries in Lauderdale County
The major employment industries in Lauderdale County include Retail Trade (7,088 | 16.3%), Manufacturing (6,567 | 15.1%), Health Care & Social Assistance (5,573 | 12.8%), Accommodation & Food Services (3,671 | 8.4%), and Educational Services (3,574 | 8.2%).
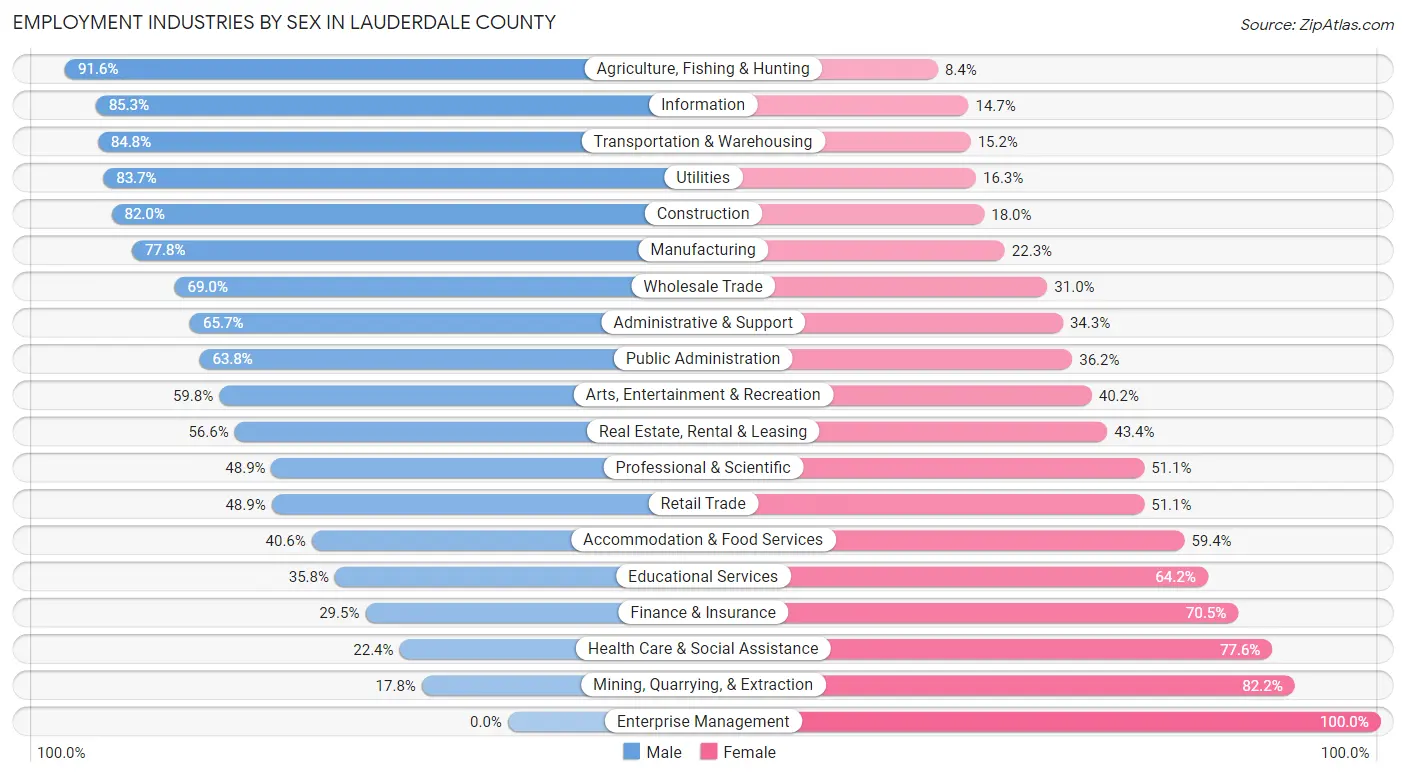
Employment Industries by Sex in Lauderdale County
The Lauderdale County industries that see more men than women are Agriculture, Fishing & Hunting (91.6%), Information (85.3%), and Transportation & Warehousing (84.8%), whereas the industries that tend to have a higher number of women are Enterprise Management (100.0%), Mining, Quarrying, & Extraction (82.2%), and Health Care & Social Assistance (77.6%).
| Industry | Male | Female |
| Agriculture, Fishing & Hunting | 273 (91.6%) | 25 (8.4%) |
| Mining, Quarrying, & Extraction | 18 (17.8%) | 83 (82.2%) |
| Construction | 2,565 (82.0%) | 563 (18.0%) |
| Manufacturing | 5,106 (77.7%) | 1,461 (22.3%) |
| Wholesale Trade | 682 (69.0%) | 307 (31.0%) |
| Retail Trade | 3,466 (48.9%) | 3,622 (51.1%) |
| Transportation & Warehousing | 1,085 (84.8%) | 194 (15.2%) |
| Utilities | 1,069 (83.7%) | 208 (16.3%) |
| Information | 382 (85.3%) | 66 (14.7%) |
| Finance & Insurance | 371 (29.5%) | 887 (70.5%) |
| Real Estate, Rental & Leasing | 461 (56.6%) | 354 (43.4%) |
| Professional & Scientific | 764 (48.9%) | 798 (51.1%) |
| Enterprise Management | 0 (0.0%) | 14 (100.0%) |
| Administrative & Support | 1,078 (65.7%) | 562 (34.3%) |
| Educational Services | 1,279 (35.8%) | 2,295 (64.2%) |
| Health Care & Social Assistance | 1,250 (22.4%) | 4,323 (77.6%) |
| Arts, Entertainment & Recreation | 318 (59.8%) | 214 (40.2%) |
| Accommodation & Food Services | 1,490 (40.6%) | 2,181 (59.4%) |
| Public Administration | 1,345 (63.8%) | 763 (36.2%) |
| Total | 23,821 (54.8%) | 19,653 (45.2%) |
Education in Lauderdale County
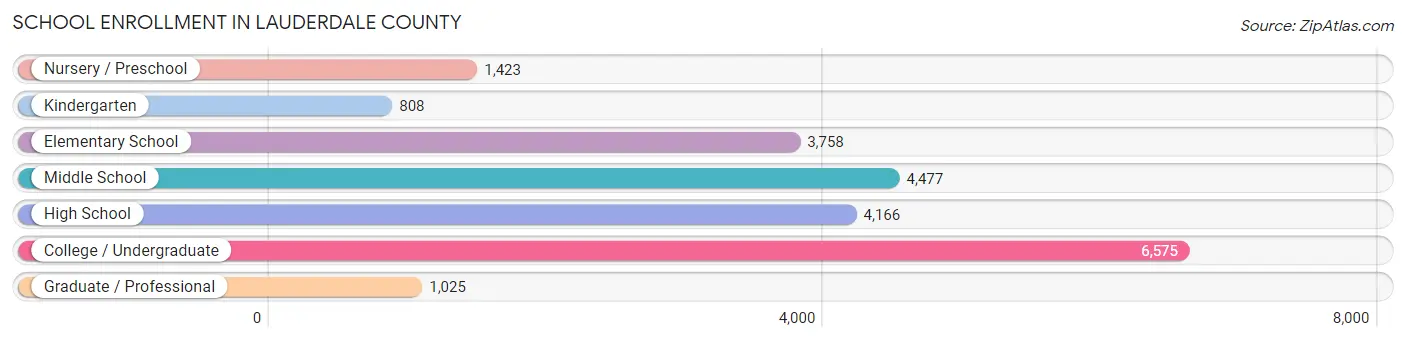
School Enrollment in Lauderdale County
The most common levels of schooling among the 22,232 students in Lauderdale County are college / undergraduate (6,575 | 29.6%), middle school (4,477 | 20.1%), and high school (4,166 | 18.7%).
| School Level | # Students | % Students |
| Nursery / Preschool | 1,423 | 6.4% |
| Kindergarten | 808 | 3.6% |
| Elementary School | 3,758 | 16.9% |
| Middle School | 4,477 | 20.1% |
| High School | 4,166 | 18.7% |
| College / Undergraduate | 6,575 | 29.6% |
| Graduate / Professional | 1,025 | 4.6% |
| Total | 22,232 | 100.0% |
School Enrollment by Age by Funding Source in Lauderdale County
Out of a total of 22,232 students who are enrolled in schools in Lauderdale County, 2,357 (10.6%) attend a private institution, while the remaining 19,875 (89.4%) are enrolled in public schools. The age group of 3 to 4 year olds has the highest likelihood of being enrolled in private schools, with 250 (26.5% in the age bracket) enrolled. Conversely, the age group of 25 to 34 year olds has the lowest likelihood of being enrolled in a private school, with 926 (96.3% in the age bracket) attending a public institution.
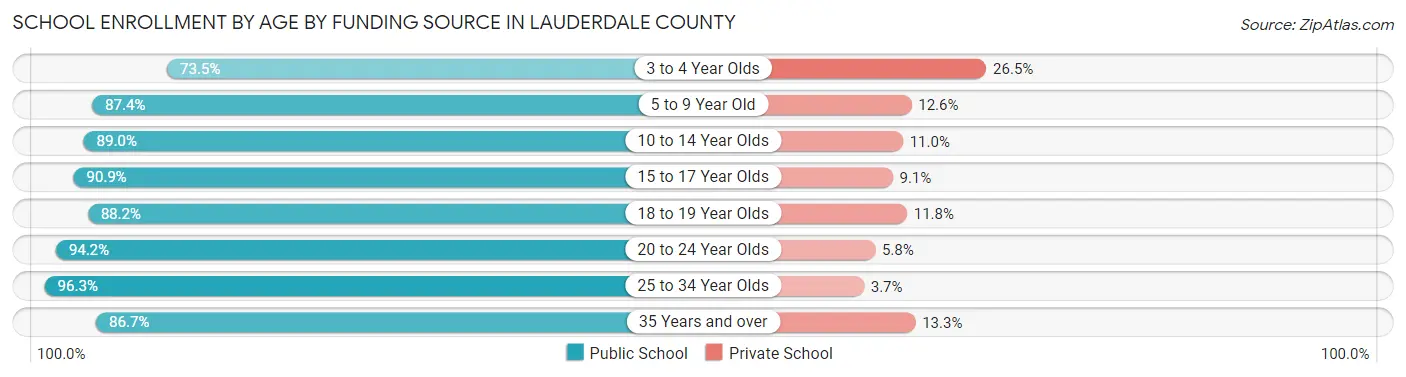
| Age Bracket | Public School | Private School |
| 3 to 4 Year Olds | 692 (73.5%) | 250 (26.5%) |
| 5 to 9 Year Old | 3,964 (87.4%) | 571 (12.6%) |
| 10 to 14 Year Olds | 4,772 (89.0%) | 590 (11.0%) |
| 15 to 17 Year Olds | 2,806 (90.9%) | 281 (9.1%) |
| 18 to 19 Year Olds | 2,312 (88.2%) | 308 (11.8%) |
| 20 to 24 Year Olds | 3,827 (94.2%) | 237 (5.8%) |
| 25 to 34 Year Olds | 926 (96.3%) | 36 (3.7%) |
| 35 Years and over | 572 (86.7%) | 88 (13.3%) |
| Total | 19,875 (89.4%) | 2,357 (10.6%) |
Educational Attainment by Field of Study in Lauderdale County
Business (4,155 | 22.4%), education (3,532 | 19.0%), science & technology (2,080 | 11.2%), arts & humanities (1,690 | 9.1%), and liberal arts & history (1,055 | 5.7%) are the most common fields of study among 18,584 individuals in Lauderdale County who have obtained a bachelor's degree or higher.
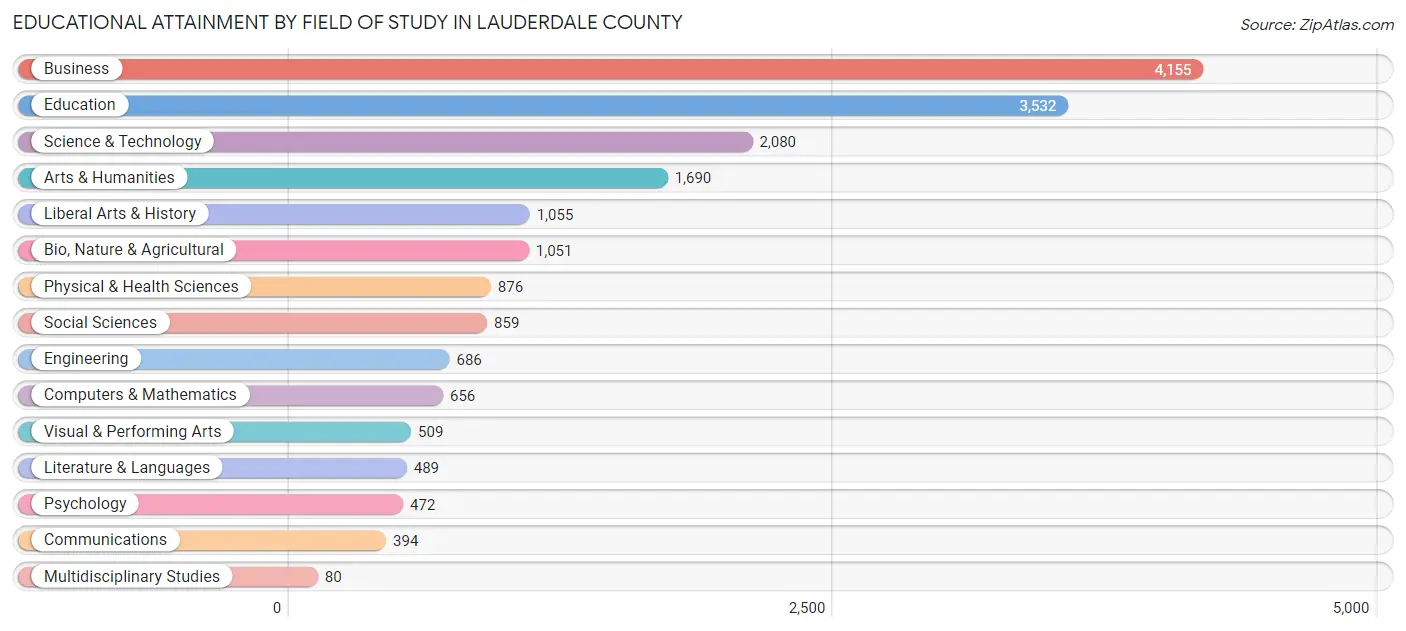
| Field of Study | # Graduates | % Graduates |
| Computers & Mathematics | 656 | 3.5% |
| Bio, Nature & Agricultural | 1,051 | 5.7% |
| Physical & Health Sciences | 876 | 4.7% |
| Psychology | 472 | 2.5% |
| Social Sciences | 859 | 4.6% |
| Engineering | 686 | 3.7% |
| Multidisciplinary Studies | 80 | 0.4% |
| Science & Technology | 2,080 | 11.2% |
| Business | 4,155 | 22.4% |
| Education | 3,532 | 19.0% |
| Literature & Languages | 489 | 2.6% |
| Liberal Arts & History | 1,055 | 5.7% |
| Visual & Performing Arts | 509 | 2.7% |
| Communications | 394 | 2.1% |
| Arts & Humanities | 1,690 | 9.1% |
| Total | 18,584 | 100.0% |
Transportation & Commute in Lauderdale County
Vehicle Availability by Sex in Lauderdale County
The most prevalent vehicle ownership categories in Lauderdale County are males with 2 vehicles (8,379, accounting for 35.6%) and females with 2 vehicles (6,811, making up 44.4%).
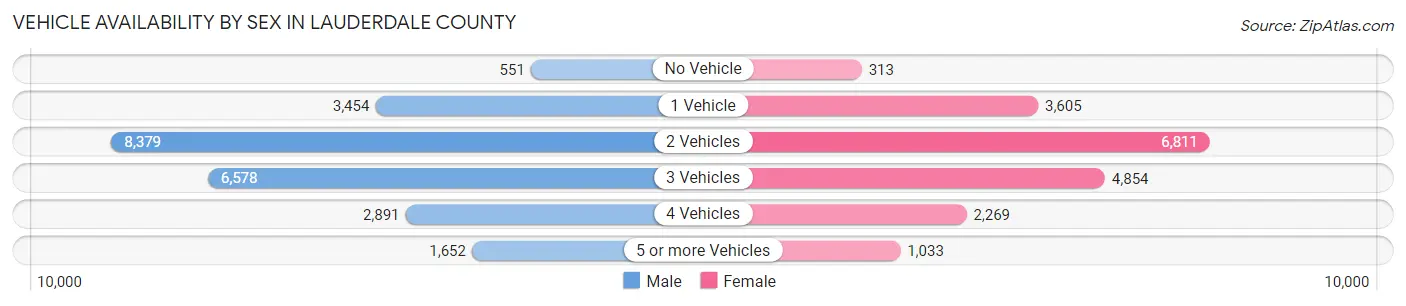
| Vehicles Available | Male | Female |
| No Vehicle | 551 (2.3%) | 313 (1.7%) |
| 1 Vehicle | 3,454 (14.7%) | 3,605 (19.1%) |
| 2 Vehicles | 8,379 (35.6%) | 6,811 (36.1%) |
| 3 Vehicles | 6,578 (28.0%) | 4,854 (25.7%) |
| 4 Vehicles | 2,891 (12.3%) | 2,269 (12.0%) |
| 5 or more Vehicles | 1,652 (7.0%) | 1,033 (5.5%) |
| Total | 23,505 (100.0%) | 18,885 (100.0%) |
Commute Time in Lauderdale County
The most frequently occuring commute durations in Lauderdale County are 15 to 19 minutes (7,679 commuters, 18.9%), 10 to 14 minutes (5,601 commuters, 13.8%), and 20 to 24 minutes (5,291 commuters, 13.0%).
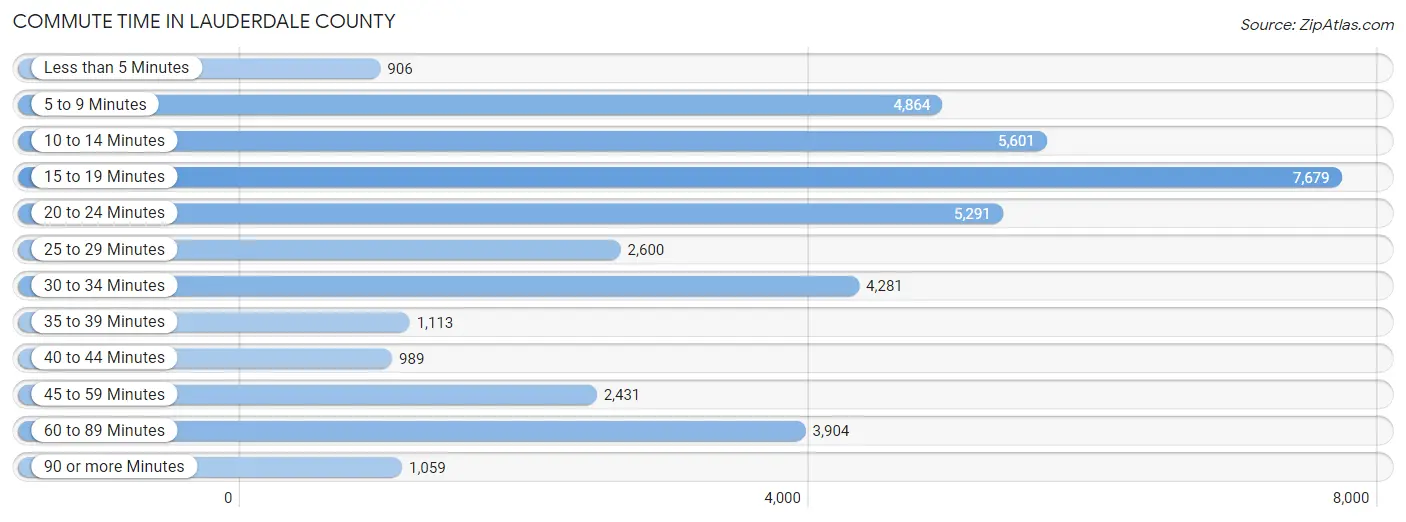
| Commute Time | # Commuters | % Commuters |
| Less than 5 Minutes | 906 | 2.2% |
| 5 to 9 Minutes | 4,864 | 11.9% |
| 10 to 14 Minutes | 5,601 | 13.8% |
| 15 to 19 Minutes | 7,679 | 18.9% |
| 20 to 24 Minutes | 5,291 | 13.0% |
| 25 to 29 Minutes | 2,600 | 6.4% |
| 30 to 34 Minutes | 4,281 | 10.5% |
| 35 to 39 Minutes | 1,113 | 2.7% |
| 40 to 44 Minutes | 989 | 2.4% |
| 45 to 59 Minutes | 2,431 | 6.0% |
| 60 to 89 Minutes | 3,904 | 9.6% |
| 90 or more Minutes | 1,059 | 2.6% |
Commute Time by Sex in Lauderdale County
The most common commute times in Lauderdale County are 15 to 19 minutes (3,898 commuters, 17.1%) for males and 15 to 19 minutes (3,781 commuters, 21.1%) for females.
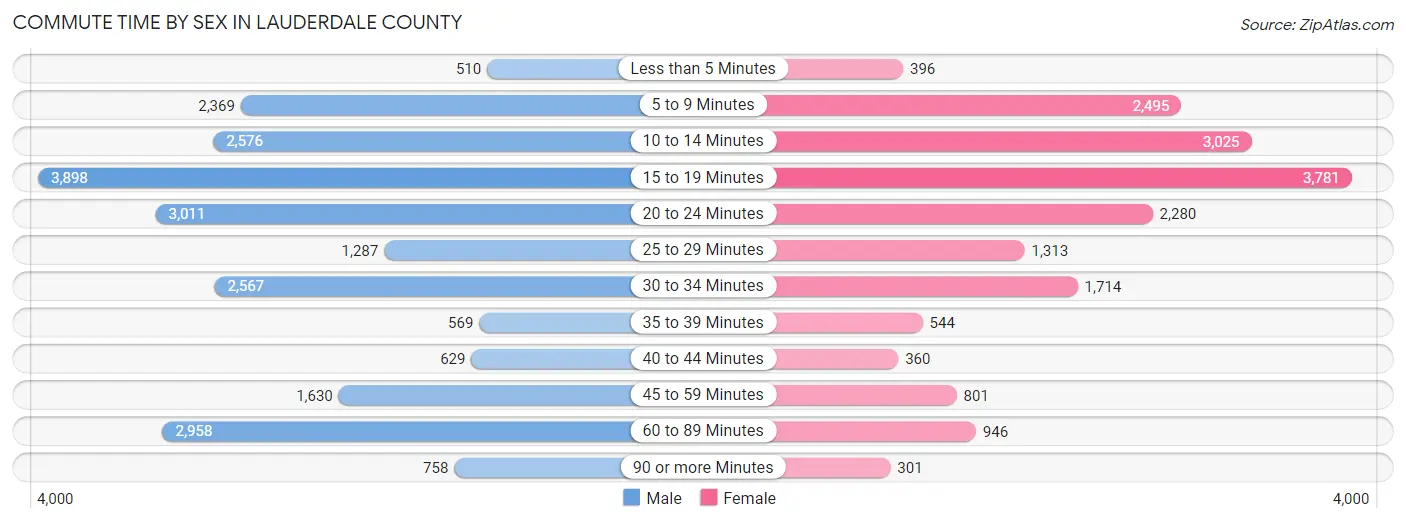
| Commute Time | Male | Female |
| Less than 5 Minutes | 510 (2.2%) | 396 (2.2%) |
| 5 to 9 Minutes | 2,369 (10.4%) | 2,495 (13.9%) |
| 10 to 14 Minutes | 2,576 (11.3%) | 3,025 (16.9%) |
| 15 to 19 Minutes | 3,898 (17.1%) | 3,781 (21.1%) |
| 20 to 24 Minutes | 3,011 (13.2%) | 2,280 (12.7%) |
| 25 to 29 Minutes | 1,287 (5.7%) | 1,313 (7.3%) |
| 30 to 34 Minutes | 2,567 (11.3%) | 1,714 (9.6%) |
| 35 to 39 Minutes | 569 (2.5%) | 544 (3.0%) |
| 40 to 44 Minutes | 629 (2.8%) | 360 (2.0%) |
| 45 to 59 Minutes | 1,630 (7.2%) | 801 (4.5%) |
| 60 to 89 Minutes | 2,958 (13.0%) | 946 (5.3%) |
| 90 or more Minutes | 758 (3.3%) | 301 (1.7%) |
Time of Departure to Work by Sex in Lauderdale County
The most frequent times of departure to work in Lauderdale County are 7:00 AM to 7:29 AM (3,309, 14.5%) for males and 7:00 AM to 7:29 AM (3,654, 20.3%) for females.
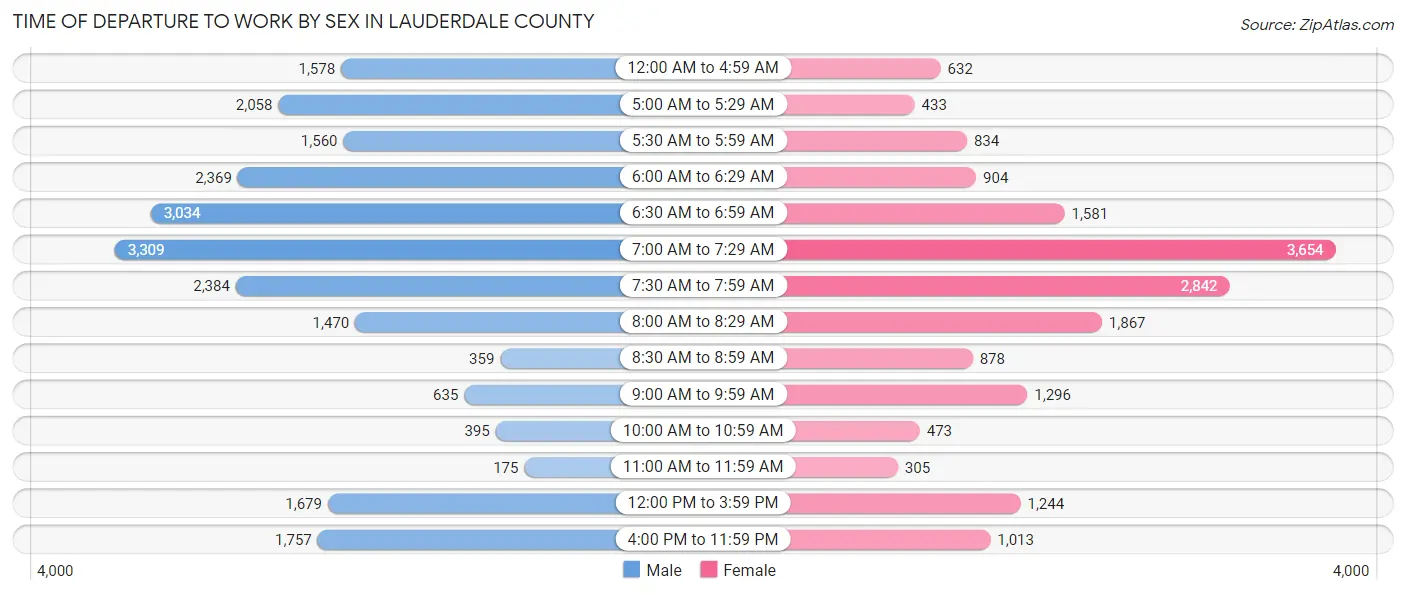
| Time of Departure | Male | Female |
| 12:00 AM to 4:59 AM | 1,578 (6.9%) | 632 (3.5%) |
| 5:00 AM to 5:29 AM | 2,058 (9.0%) | 433 (2.4%) |
| 5:30 AM to 5:59 AM | 1,560 (6.9%) | 834 (4.6%) |
| 6:00 AM to 6:29 AM | 2,369 (10.4%) | 904 (5.0%) |
| 6:30 AM to 6:59 AM | 3,034 (13.3%) | 1,581 (8.8%) |
| 7:00 AM to 7:29 AM | 3,309 (14.5%) | 3,654 (20.3%) |
| 7:30 AM to 7:59 AM | 2,384 (10.5%) | 2,842 (15.8%) |
| 8:00 AM to 8:29 AM | 1,470 (6.5%) | 1,867 (10.4%) |
| 8:30 AM to 8:59 AM | 359 (1.6%) | 878 (4.9%) |
| 9:00 AM to 9:59 AM | 635 (2.8%) | 1,296 (7.2%) |
| 10:00 AM to 10:59 AM | 395 (1.7%) | 473 (2.6%) |
| 11:00 AM to 11:59 AM | 175 (0.8%) | 305 (1.7%) |
| 12:00 PM to 3:59 PM | 1,679 (7.4%) | 1,244 (6.9%) |
| 4:00 PM to 11:59 PM | 1,757 (7.7%) | 1,013 (5.6%) |
| Total | 22,762 (100.0%) | 17,956 (100.0%) |
Housing Occupancy in Lauderdale County
Occupancy by Ownership in Lauderdale County
Of the total 38,237 dwellings in Lauderdale County, owner-occupied units account for 25,815 (67.5%), while renter-occupied units make up 12,422 (32.5%).
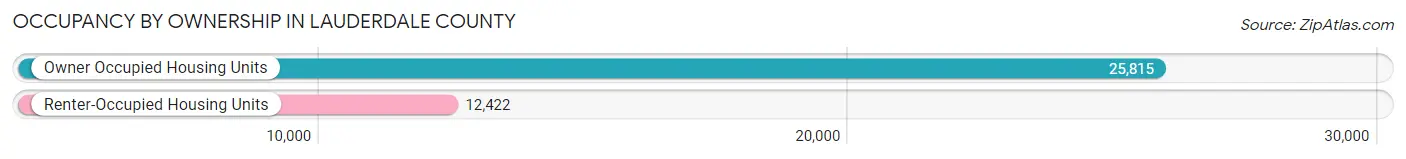
| Occupancy | # Housing Units | % Housing Units |
| Owner Occupied Housing Units | 25,815 | 67.5% |
| Renter-Occupied Housing Units | 12,422 | 32.5% |
| Total Occupied Housing Units | 38,237 | 100.0% |
Occupancy by Household Size in Lauderdale County
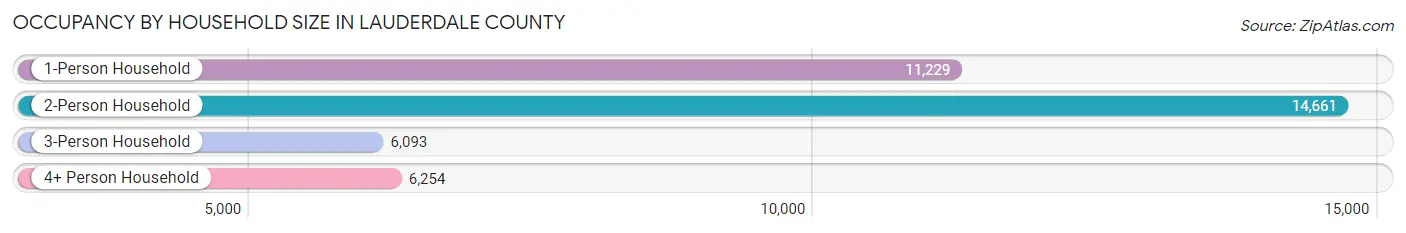
| Household Size | # Housing Units | % Housing Units |
| 1-Person Household | 11,229 | 29.4% |
| 2-Person Household | 14,661 | 38.3% |
| 3-Person Household | 6,093 | 15.9% |
| 4+ Person Household | 6,254 | 16.4% |
| Total Housing Units | 38,237 | 100.0% |
Occupancy by Ownership by Household Size in Lauderdale County
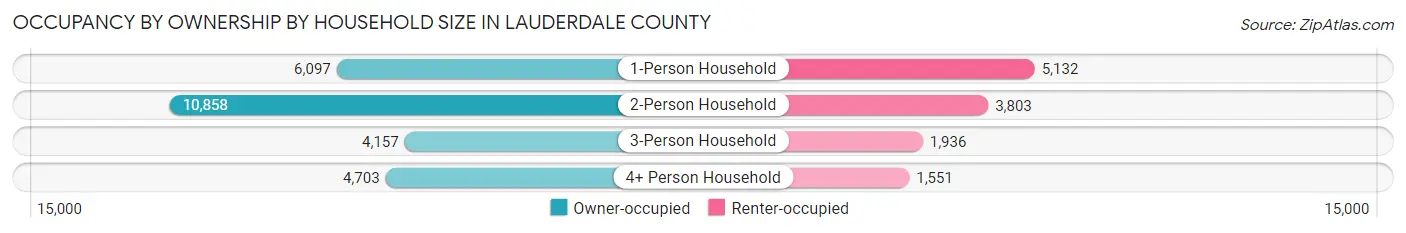
| Household Size | Owner-occupied | Renter-occupied |
| 1-Person Household | 6,097 (54.3%) | 5,132 (45.7%) |
| 2-Person Household | 10,858 (74.1%) | 3,803 (25.9%) |
| 3-Person Household | 4,157 (68.2%) | 1,936 (31.8%) |
| 4+ Person Household | 4,703 (75.2%) | 1,551 (24.8%) |
| Total Housing Units | 25,815 (67.5%) | 12,422 (32.5%) |
Occupancy by Educational Attainment in Lauderdale County
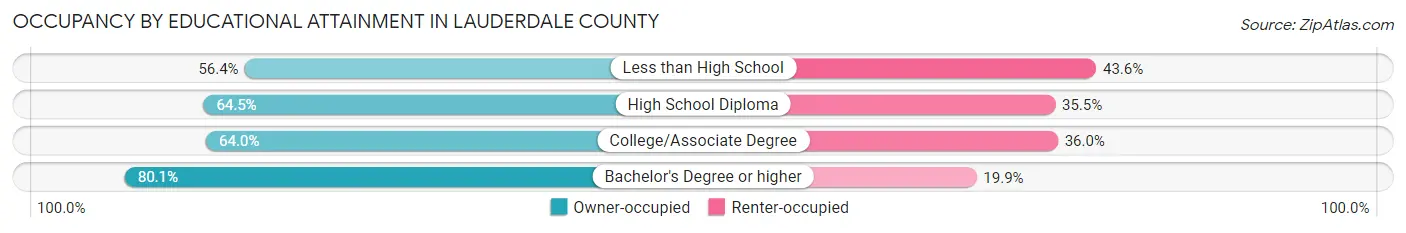
| Household Size | Owner-occupied | Renter-occupied |
| Less than High School | 2,236 (56.4%) | 1,728 (43.6%) |
| High School Diploma | 8,019 (64.5%) | 4,407 (35.5%) |
| College/Associate Degree | 7,727 (64.0%) | 4,345 (36.0%) |
| Bachelor's Degree or higher | 7,833 (80.1%) | 1,942 (19.9%) |
Occupancy by Age of Householder in Lauderdale County
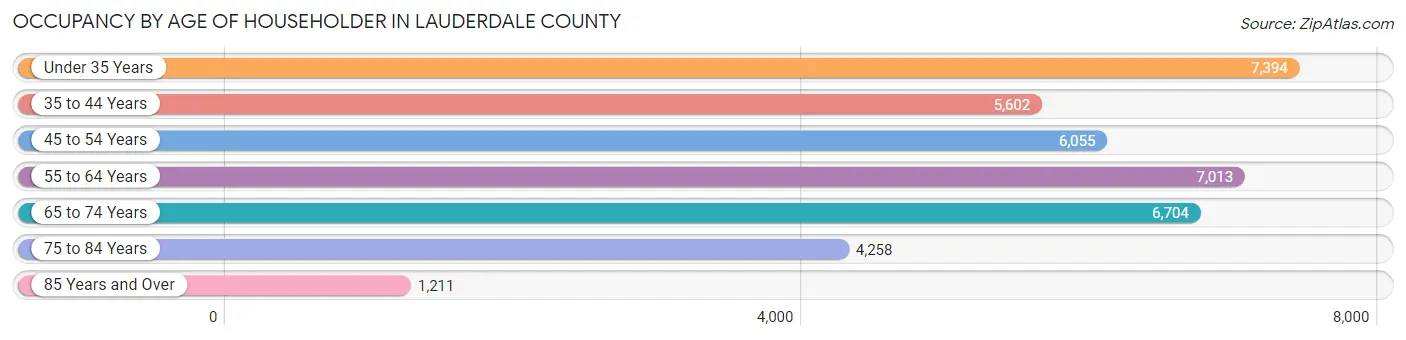
| Age Bracket | # Households | % Households |
| Under 35 Years | 7,394 | 19.3% |
| 35 to 44 Years | 5,602 | 14.6% |
| 45 to 54 Years | 6,055 | 15.8% |
| 55 to 64 Years | 7,013 | 18.3% |
| 65 to 74 Years | 6,704 | 17.5% |
| 75 to 84 Years | 4,258 | 11.1% |
| 85 Years and Over | 1,211 | 3.2% |
| Total | 38,237 | 100.0% |
Housing Finances in Lauderdale County
Median Income by Occupancy in Lauderdale County
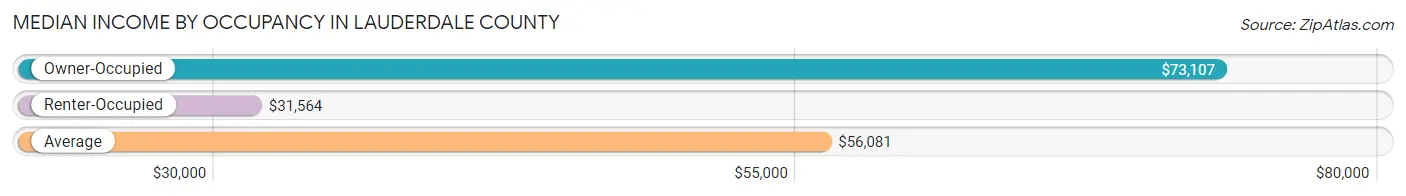
| Occupancy Type | # Households | Median Income |
| Owner-Occupied | 25,815 (67.5%) | $73,107 |
| Renter-Occupied | 12,422 (32.5%) | $31,564 |
| Average | 38,237 (100.0%) | $56,081 |
Occupancy by Householder Income Bracket in Lauderdale County
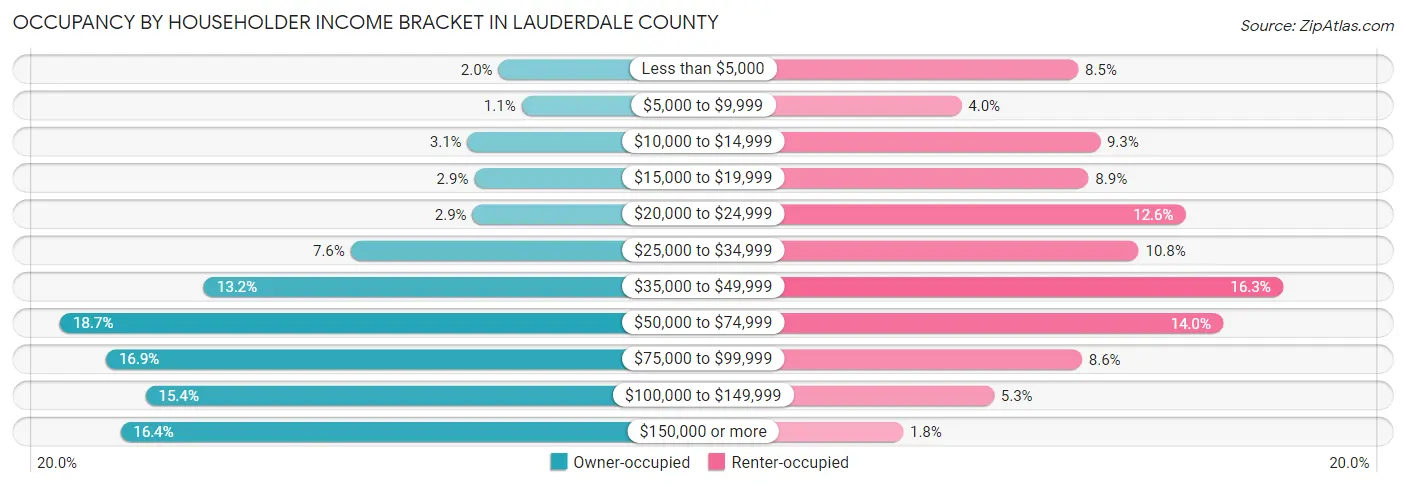
| Income Bracket | Owner-occupied | Renter-occupied |
| Less than $5,000 | 504 (1.9%) | 1,053 (8.5%) |
| $5,000 to $9,999 | 275 (1.1%) | 501 (4.0%) |
| $10,000 to $14,999 | 807 (3.1%) | 1,157 (9.3%) |
| $15,000 to $19,999 | 742 (2.9%) | 1,102 (8.9%) |
| $20,000 to $24,999 | 759 (2.9%) | 1,560 (12.6%) |
| $25,000 to $34,999 | 1,957 (7.6%) | 1,339 (10.8%) |
| $35,000 to $49,999 | 3,399 (13.2%) | 2,021 (16.3%) |
| $50,000 to $74,999 | 4,815 (18.6%) | 1,738 (14.0%) |
| $75,000 to $99,999 | 4,363 (16.9%) | 1,071 (8.6%) |
| $100,000 to $149,999 | 3,973 (15.4%) | 655 (5.3%) |
| $150,000 or more | 4,221 (16.4%) | 225 (1.8%) |
| Total | 25,815 (100.0%) | 12,422 (100.0%) |
Monthly Housing Cost Tiers in Lauderdale County
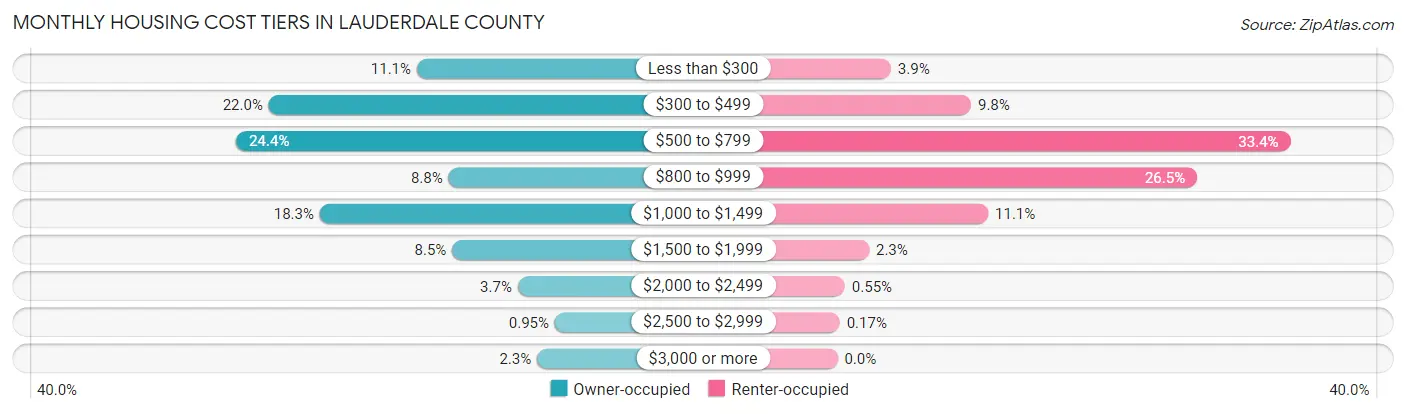
| Monthly Cost | Owner-occupied | Renter-occupied |
| Less than $300 | 2,867 (11.1%) | 489 (3.9%) |
| $300 to $499 | 5,685 (22.0%) | 1,222 (9.8%) |
| $500 to $799 | 6,307 (24.4%) | 4,144 (33.4%) |
| $800 to $999 | 2,267 (8.8%) | 3,289 (26.5%) |
| $1,000 to $1,499 | 4,714 (18.3%) | 1,379 (11.1%) |
| $1,500 to $1,999 | 2,196 (8.5%) | 290 (2.3%) |
| $2,000 to $2,499 | 951 (3.7%) | 68 (0.5%) |
| $2,500 to $2,999 | 244 (0.9%) | 21 (0.2%) |
| $3,000 or more | 584 (2.3%) | 0 (0.0%) |
| Total | 25,815 (100.0%) | 12,422 (100.0%) |
Physical Housing Characteristics in Lauderdale County
Housing Structures in Lauderdale County
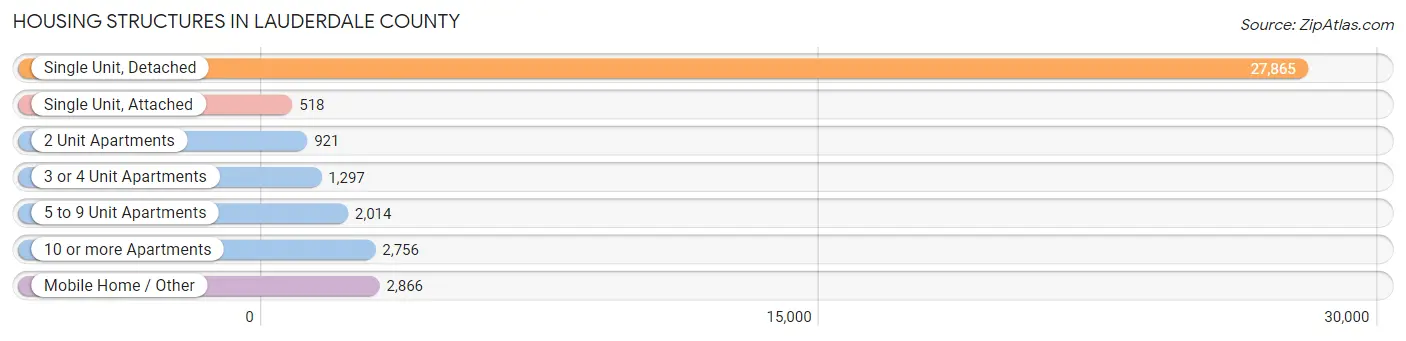
| Structure Type | # Housing Units | % Housing Units |
| Single Unit, Detached | 27,865 | 72.9% |
| Single Unit, Attached | 518 | 1.3% |
| 2 Unit Apartments | 921 | 2.4% |
| 3 or 4 Unit Apartments | 1,297 | 3.4% |
| 5 to 9 Unit Apartments | 2,014 | 5.3% |
| 10 or more Apartments | 2,756 | 7.2% |
| Mobile Home / Other | 2,866 | 7.5% |
| Total | 38,237 | 100.0% |
Housing Structures by Occupancy in Lauderdale County
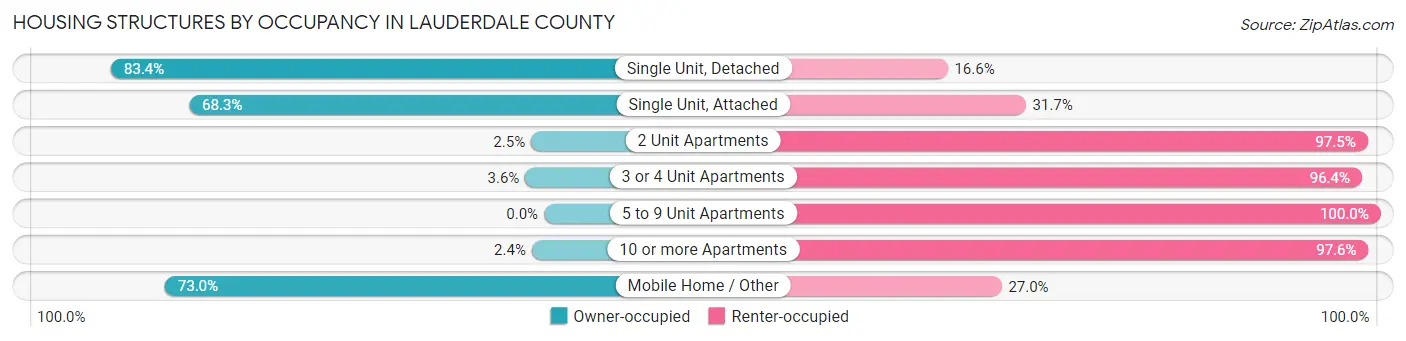
| Structure Type | Owner-occupied | Renter-occupied |
| Single Unit, Detached | 23,234 (83.4%) | 4,631 (16.6%) |
| Single Unit, Attached | 354 (68.3%) | 164 (31.7%) |
| 2 Unit Apartments | 23 (2.5%) | 898 (97.5%) |
| 3 or 4 Unit Apartments | 47 (3.6%) | 1,250 (96.4%) |
| 5 to 9 Unit Apartments | 0 (0.0%) | 2,014 (100.0%) |
| 10 or more Apartments | 65 (2.4%) | 2,691 (97.6%) |
| Mobile Home / Other | 2,092 (73.0%) | 774 (27.0%) |
| Total | 25,815 (67.5%) | 12,422 (32.5%) |
Housing Structures by Number of Rooms in Lauderdale County
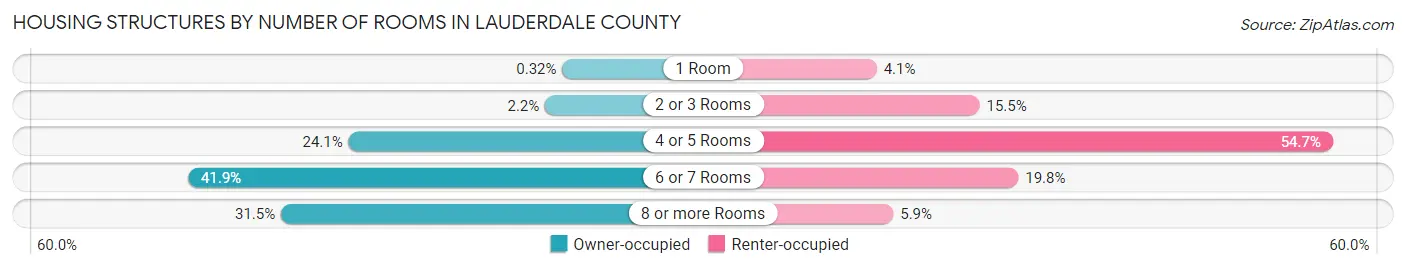
| Number of Rooms | Owner-occupied | Renter-occupied |
| 1 Room | 82 (0.3%) | 507 (4.1%) |
| 2 or 3 Rooms | 575 (2.2%) | 1,926 (15.5%) |
| 4 or 5 Rooms | 6,208 (24.0%) | 6,793 (54.7%) |
| 6 or 7 Rooms | 10,808 (41.9%) | 2,460 (19.8%) |
| 8 or more Rooms | 8,142 (31.5%) | 736 (5.9%) |
| Total | 25,815 (100.0%) | 12,422 (100.0%) |
Housing Structure by Heating Type in Lauderdale County
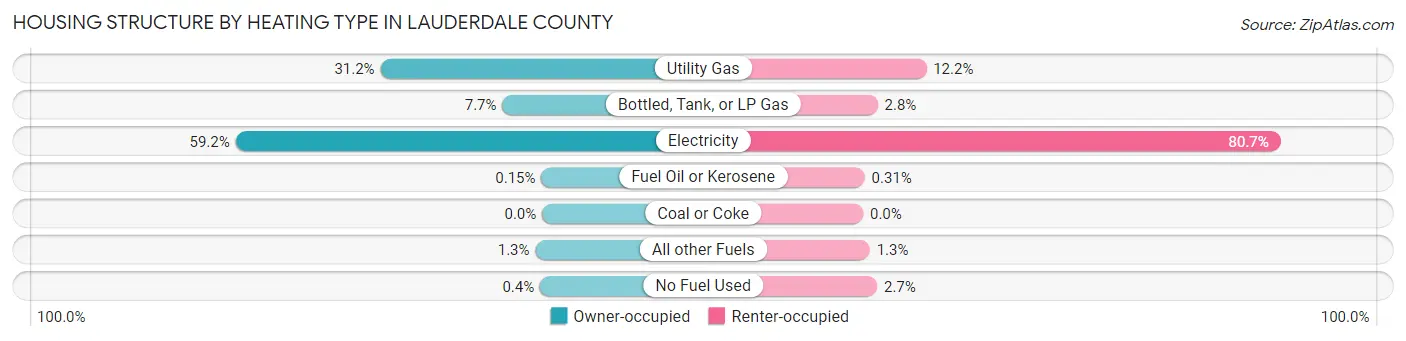
| Heating Type | Owner-occupied | Renter-occupied |
| Utility Gas | 8,064 (31.2%) | 1,517 (12.2%) |
| Bottled, Tank, or LP Gas | 1,982 (7.7%) | 349 (2.8%) |
| Electricity | 15,292 (59.2%) | 10,022 (80.7%) |
| Fuel Oil or Kerosene | 39 (0.2%) | 38 (0.3%) |
| Coal or Coke | 0 (0.0%) | 0 (0.0%) |
| All other Fuels | 336 (1.3%) | 160 (1.3%) |
| No Fuel Used | 102 (0.4%) | 336 (2.7%) |
| Total | 25,815 (100.0%) | 12,422 (100.0%) |
Household Vehicle Usage in Lauderdale County
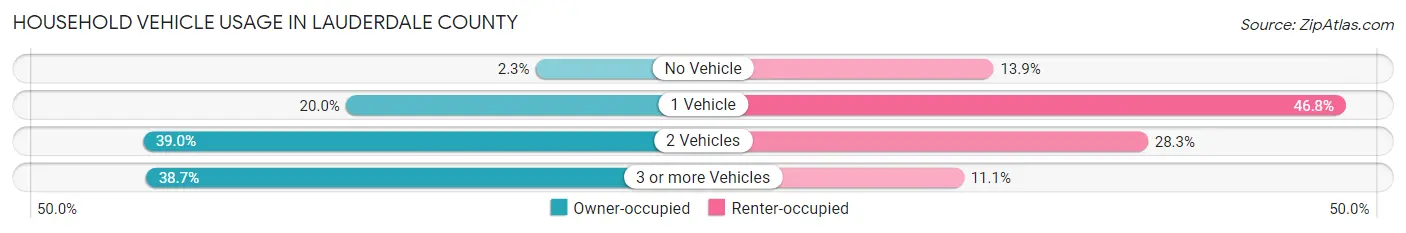
| Vehicles per Household | Owner-occupied | Renter-occupied |
| No Vehicle | 599 (2.3%) | 1,723 (13.9%) |
| 1 Vehicle | 5,170 (20.0%) | 5,809 (46.8%) |
| 2 Vehicles | 10,059 (39.0%) | 3,512 (28.3%) |
| 3 or more Vehicles | 9,987 (38.7%) | 1,378 (11.1%) |
| Total | 25,815 (100.0%) | 12,422 (100.0%) |
Real Estate & Mortgages in Lauderdale County
Real Estate and Mortgage Overview in Lauderdale County
| Characteristic | Without Mortgage | With Mortgage |
| Housing Units | 13,601 | 12,214 |
| Median Property Value | $165,100 | $183,700 |
| Median Household Income | $61,563 | $2,207 |
| Monthly Housing Costs | $443 | $547 |
| Real Estate Taxes | $628 | $1,798 |
Property Value by Mortgage Status in Lauderdale County
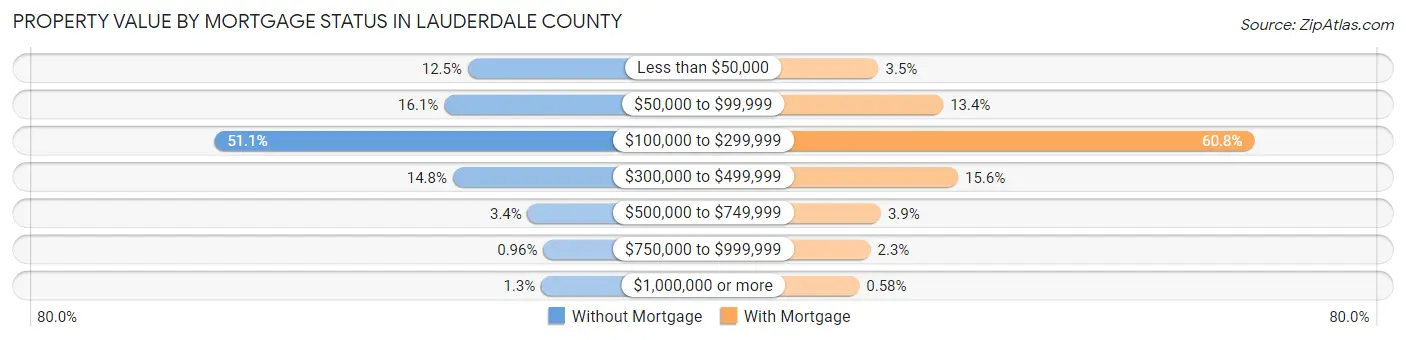
| Property Value | Without Mortgage | With Mortgage |
| Less than $50,000 | 1,696 (12.5%) | 429 (3.5%) |
| $50,000 to $99,999 | 2,186 (16.1%) | 1,632 (13.4%) |
| $100,000 to $299,999 | 6,950 (51.1%) | 7,421 (60.8%) |
| $300,000 to $499,999 | 2,006 (14.7%) | 1,908 (15.6%) |
| $500,000 to $749,999 | 456 (3.4%) | 473 (3.9%) |
| $750,000 to $999,999 | 130 (1.0%) | 280 (2.3%) |
| $1,000,000 or more | 177 (1.3%) | 71 (0.6%) |
| Total | 13,601 (100.0%) | 12,214 (100.0%) |
Household Income by Mortgage Status in Lauderdale County
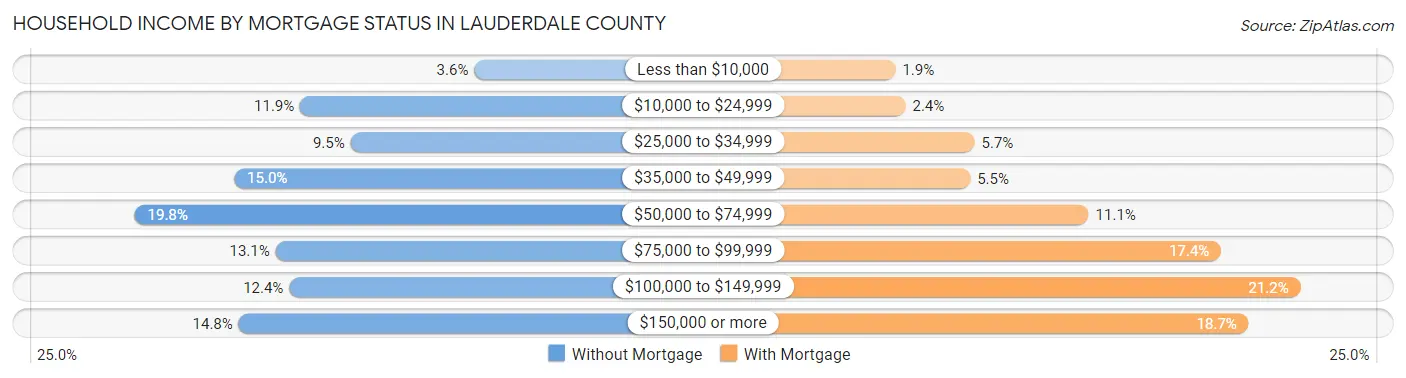
| Household Income | Without Mortgage | With Mortgage |
| Less than $10,000 | 488 (3.6%) | 232 (1.9%) |
| $10,000 to $24,999 | 1,616 (11.9%) | 291 (2.4%) |
| $25,000 to $34,999 | 1,290 (9.5%) | 692 (5.7%) |
| $35,000 to $49,999 | 2,043 (15.0%) | 667 (5.5%) |
| $50,000 to $74,999 | 2,688 (19.8%) | 1,356 (11.1%) |
| $75,000 to $99,999 | 1,775 (13.1%) | 2,127 (17.4%) |
| $100,000 to $149,999 | 1,687 (12.4%) | 2,588 (21.2%) |
| $150,000 or more | 2,014 (14.8%) | 2,286 (18.7%) |
| Total | 13,601 (100.0%) | 12,214 (100.0%) |
Property Value to Household Income Ratio in Lauderdale County
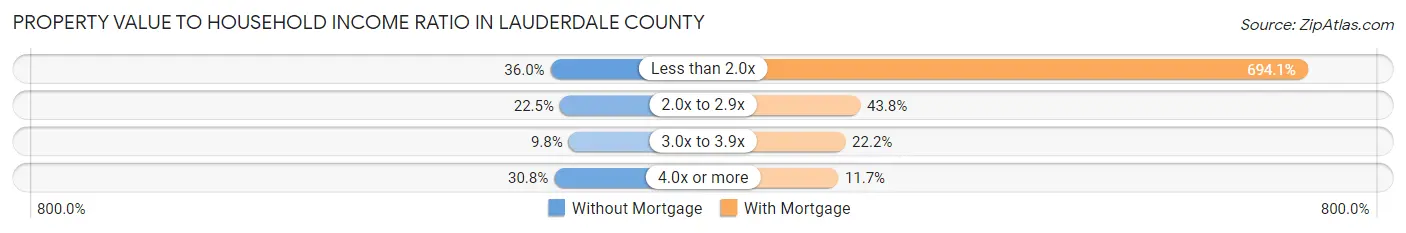
| Value-to-Income Ratio | Without Mortgage | With Mortgage |
| Less than 2.0x | 4,902 (36.0%) | 84,775 (694.1%) |
| 2.0x to 2.9x | 3,053 (22.5%) | 5,347 (43.8%) |
| 3.0x to 3.9x | 1,326 (9.8%) | 2,707 (22.2%) |
| 4.0x or more | 4,186 (30.8%) | 1,425 (11.7%) |
| Total | 13,601 (100.0%) | 12,214 (100.0%) |
Real Estate Taxes by Mortgage Status in Lauderdale County
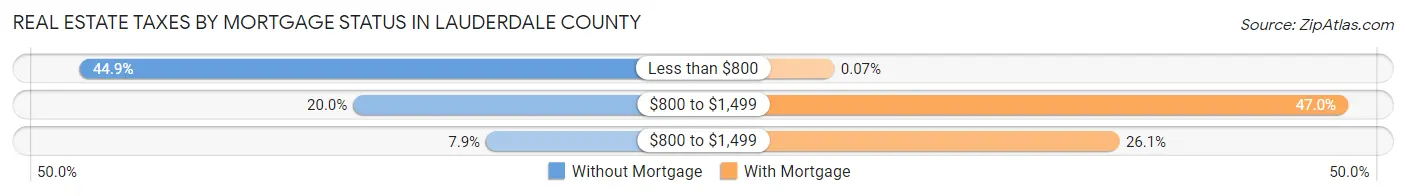
| Property Taxes | Without Mortgage | With Mortgage |
| Less than $800 | 6,112 (44.9%) | 9 (0.1%) |
| $800 to $1,499 | 2,720 (20.0%) | 5,743 (47.0%) |
| $800 to $1,499 | 1,070 (7.9%) | 3,189 (26.1%) |
| Total | 13,601 (100.0%) | 12,214 (100.0%) |
Health & Disability in Lauderdale County
Health Insurance Coverage by Age in Lauderdale County
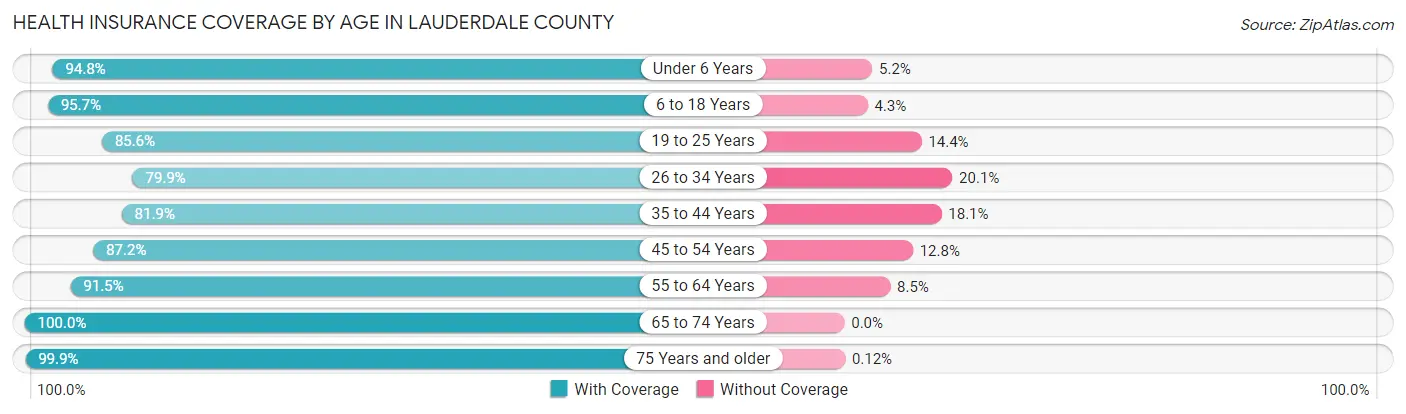
| Age Bracket | With Coverage | Without Coverage |
| Under 6 Years | 5,367 (94.8%) | 294 (5.2%) |
| 6 to 18 Years | 13,374 (95.7%) | 604 (4.3%) |
| 19 to 25 Years | 9,622 (85.6%) | 1,617 (14.4%) |
| 26 to 34 Years | 7,887 (79.9%) | 1,985 (20.1%) |
| 35 to 44 Years | 8,471 (81.9%) | 1,872 (18.1%) |
| 45 to 54 Years | 9,802 (87.2%) | 1,434 (12.8%) |
| 55 to 64 Years | 11,416 (91.5%) | 1,066 (8.5%) |
| 65 to 74 Years | 10,808 (100.0%) | 0 (0.0%) |
| 75 Years and older | 7,673 (99.9%) | 9 (0.1%) |
| Total | 84,420 (90.5%) | 8,881 (9.5%) |
Health Insurance Coverage by Citizenship Status in Lauderdale County
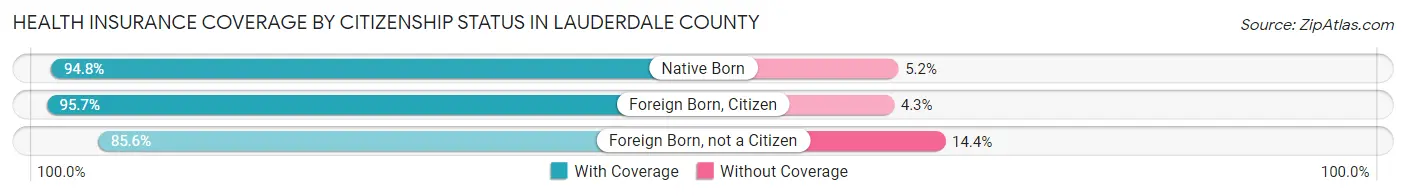
| Citizenship Status | With Coverage | Without Coverage |
| Native Born | 5,367 (94.8%) | 294 (5.2%) |
| Foreign Born, Citizen | 13,374 (95.7%) | 604 (4.3%) |
| Foreign Born, not a Citizen | 9,622 (85.6%) | 1,617 (14.4%) |
Health Insurance Coverage by Household Income in Lauderdale County
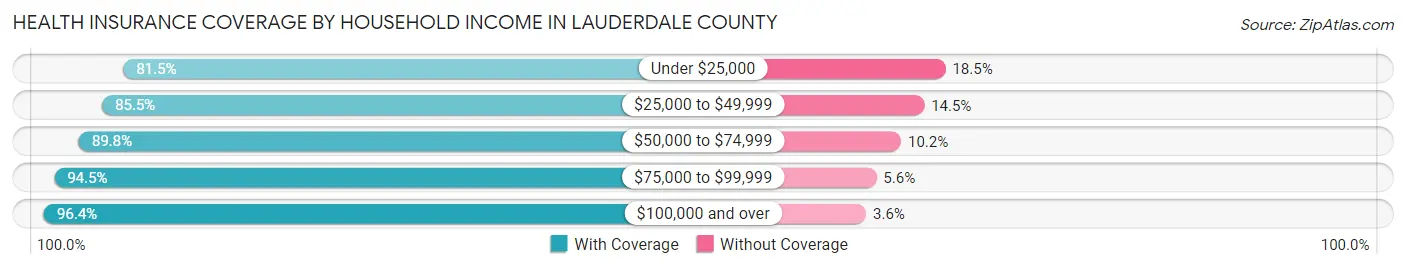
| Household Income | With Coverage | Without Coverage |
| Under $25,000 | 11,315 (81.5%) | 2,566 (18.5%) |
| $25,000 to $49,999 | 16,055 (85.5%) | 2,723 (14.5%) |
| $50,000 to $74,999 | 13,478 (89.8%) | 1,524 (10.2%) |
| $75,000 to $99,999 | 14,494 (94.5%) | 851 (5.6%) |
| $100,000 and over | 27,679 (96.4%) | 1,039 (3.6%) |
Public vs Private Health Insurance Coverage by Age in Lauderdale County
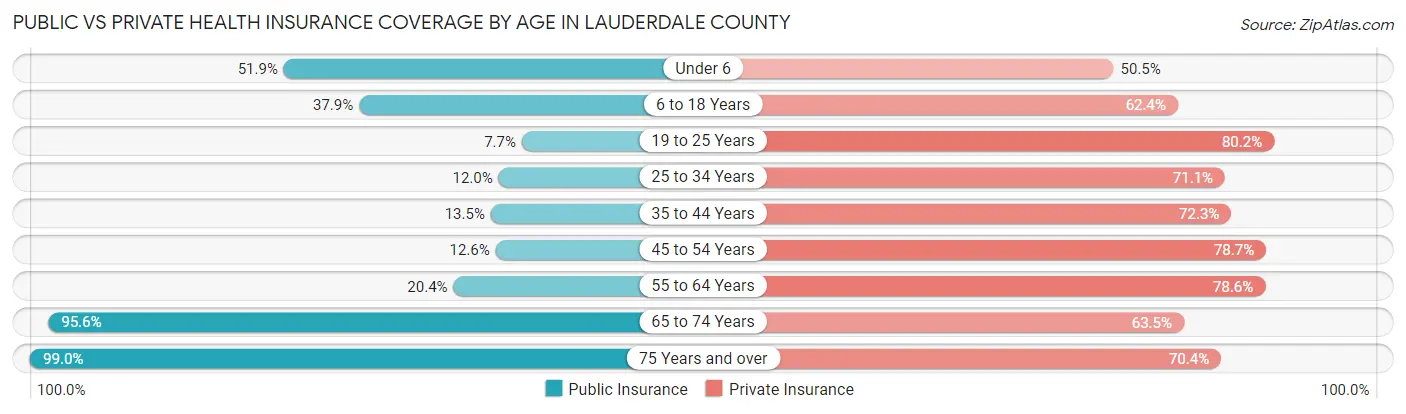
| Age Bracket | Public Insurance | Private Insurance |
| Under 6 | 2,938 (51.9%) | 2,856 (50.4%) |
| 6 to 18 Years | 5,301 (37.9%) | 8,715 (62.4%) |
| 19 to 25 Years | 867 (7.7%) | 9,015 (80.2%) |
| 25 to 34 Years | 1,188 (12.0%) | 7,019 (71.1%) |
| 35 to 44 Years | 1,394 (13.5%) | 7,475 (72.3%) |
| 45 to 54 Years | 1,414 (12.6%) | 8,846 (78.7%) |
| 55 to 64 Years | 2,548 (20.4%) | 9,807 (78.6%) |
| 65 to 74 Years | 10,331 (95.6%) | 6,860 (63.5%) |
| 75 Years and over | 7,602 (99.0%) | 5,407 (70.4%) |
| Total | 33,583 (36.0%) | 66,000 (70.7%) |
Disability Status by Sex by Age in Lauderdale County
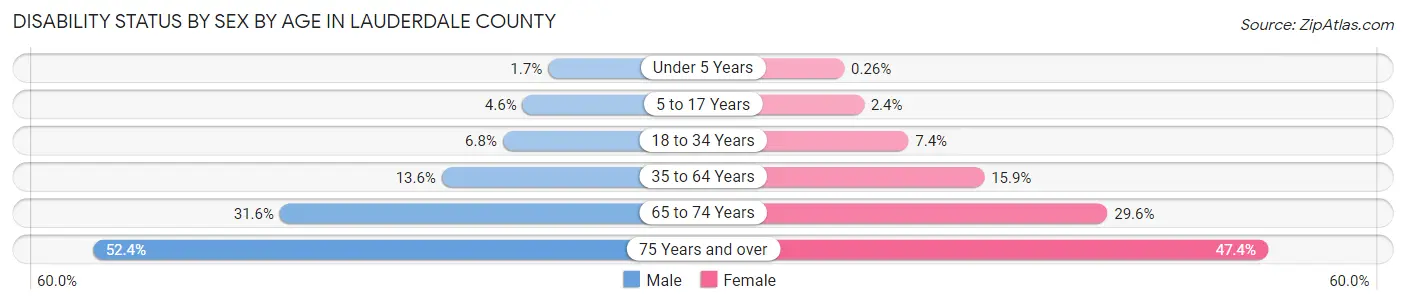
| Age Bracket | Male | Female |
| Under 5 Years | 41 (1.7%) | 6 (0.3%) |
| 5 to 17 Years | 315 (4.5%) | 162 (2.4%) |
| 18 to 34 Years | 731 (6.8%) | 866 (7.4%) |
| 35 to 64 Years | 2,274 (13.6%) | 2,740 (15.9%) |
| 65 to 74 Years | 1,606 (31.6%) | 1,692 (29.6%) |
| 75 Years and over | 1,600 (52.4%) | 2,196 (47.4%) |
Disability Class by Sex by Age in Lauderdale County
Disability Class: Hearing Difficulty
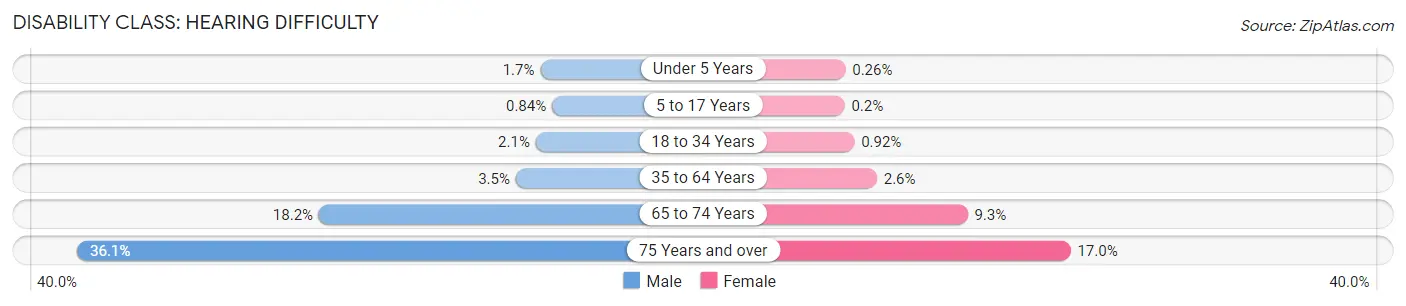
| Age Bracket | Male | Female |
| Under 5 Years | 41 (1.7%) | 6 (0.3%) |
| 5 to 17 Years | 58 (0.8%) | 13 (0.2%) |
| 18 to 34 Years | 222 (2.1%) | 107 (0.9%) |
| 35 to 64 Years | 592 (3.5%) | 450 (2.6%) |
| 65 to 74 Years | 923 (18.1%) | 534 (9.3%) |
| 75 Years and over | 1,102 (36.1%) | 786 (17.0%) |
Disability Class: Vision Difficulty
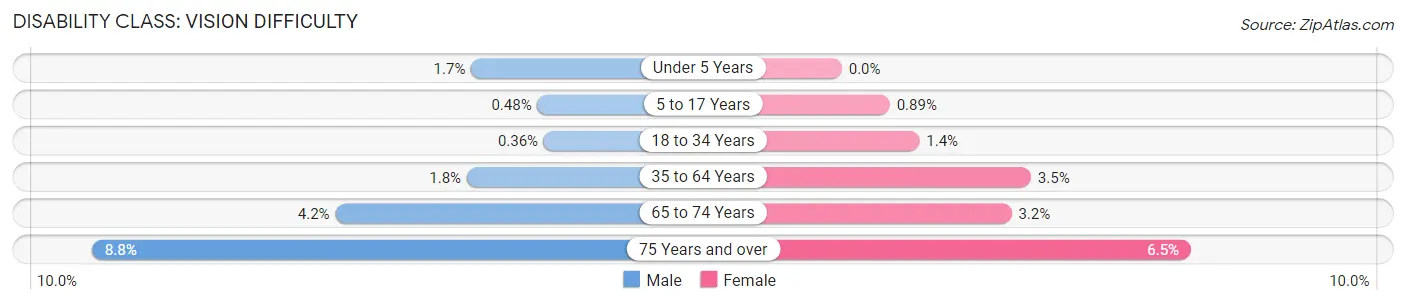
| Age Bracket | Male | Female |
| Under 5 Years | 41 (1.7%) | 0 (0.0%) |
| 5 to 17 Years | 33 (0.5%) | 59 (0.9%) |
| 18 to 34 Years | 39 (0.4%) | 168 (1.4%) |
| 35 to 64 Years | 300 (1.8%) | 606 (3.5%) |
| 65 to 74 Years | 215 (4.2%) | 180 (3.2%) |
| 75 Years and over | 267 (8.7%) | 300 (6.5%) |
Disability Class: Cognitive Difficulty
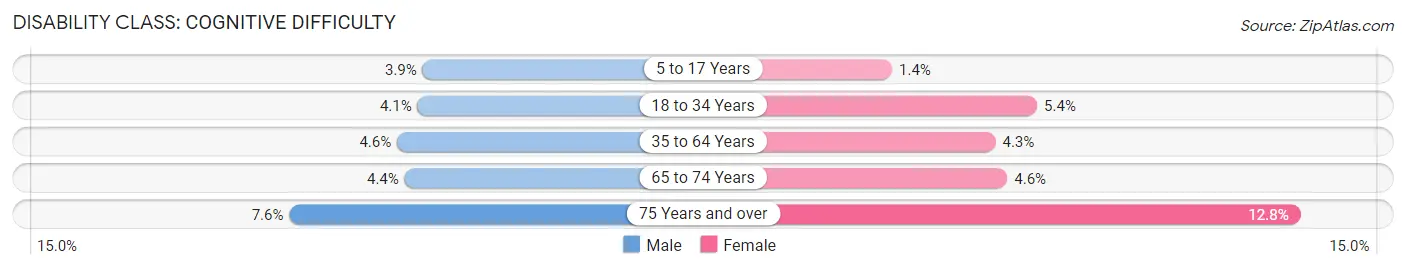
| Age Bracket | Male | Female |
| 5 to 17 Years | 271 (3.9%) | 93 (1.4%) |
| 18 to 34 Years | 440 (4.1%) | 636 (5.4%) |
| 35 to 64 Years | 777 (4.6%) | 740 (4.3%) |
| 65 to 74 Years | 225 (4.4%) | 264 (4.6%) |
| 75 Years and over | 233 (7.6%) | 591 (12.8%) |
Disability Class: Ambulatory Difficulty
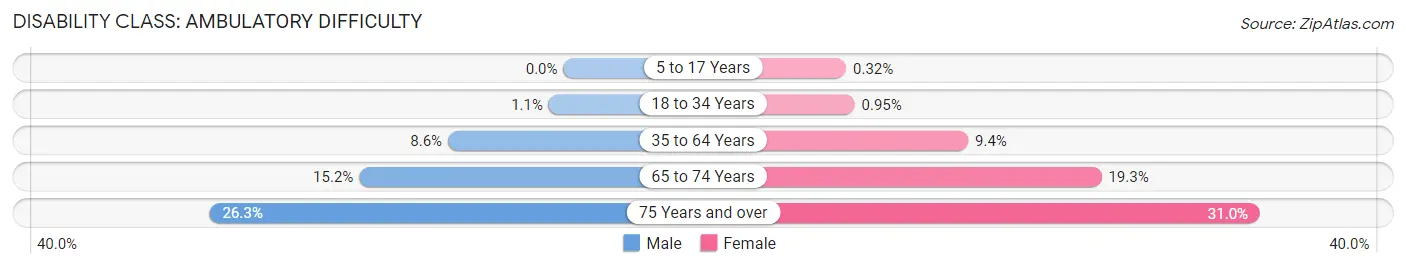
| Age Bracket | Male | Female |
| 5 to 17 Years | 0 (0.0%) | 21 (0.3%) |
| 18 to 34 Years | 117 (1.1%) | 111 (0.9%) |
| 35 to 64 Years | 1,439 (8.6%) | 1,621 (9.4%) |
| 65 to 74 Years | 771 (15.2%) | 1,103 (19.3%) |
| 75 Years and over | 802 (26.3%) | 1,437 (31.0%) |
Disability Class: Self-Care Difficulty
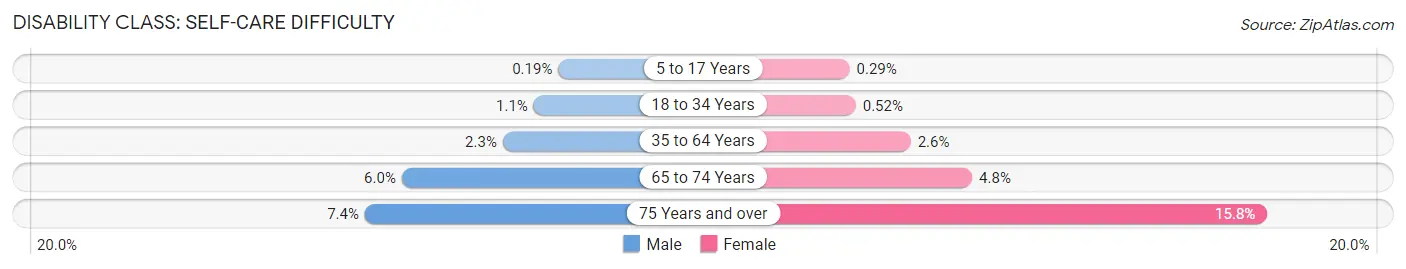
| Age Bracket | Male | Female |
| 5 to 17 Years | 13 (0.2%) | 19 (0.3%) |
| 18 to 34 Years | 119 (1.1%) | 61 (0.5%) |
| 35 to 64 Years | 377 (2.2%) | 443 (2.6%) |
| 65 to 74 Years | 305 (6.0%) | 277 (4.8%) |
| 75 Years and over | 225 (7.4%) | 731 (15.8%) |
Technology Access in Lauderdale County
Computing Device Access in Lauderdale County
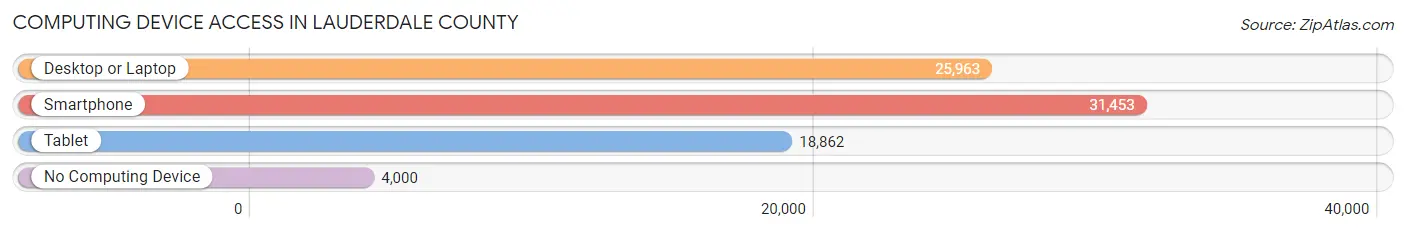
| Device Type | # Households | % Households |
| Desktop or Laptop | 25,963 | 67.9% |
| Smartphone | 31,453 | 82.3% |
| Tablet | 18,862 | 49.3% |
| No Computing Device | 4,000 | 10.5% |
| Total | 38,237 | 100.0% |
Internet Access in Lauderdale County
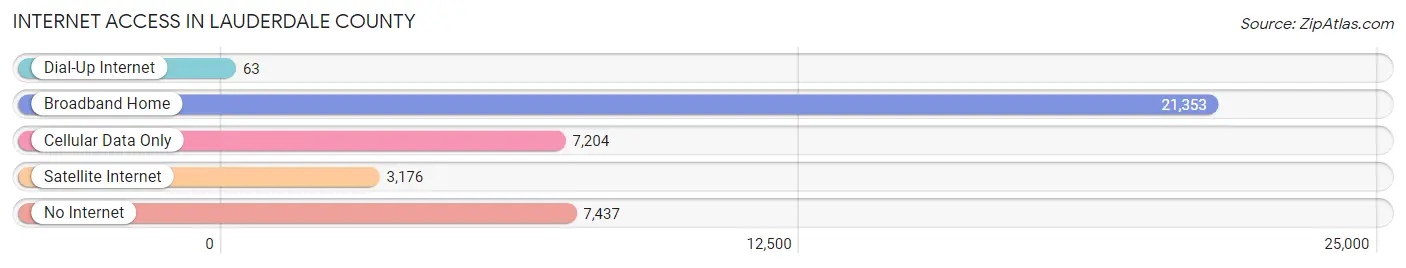
| Internet Type | # Households | % Households |
| Dial-Up Internet | 63 | 0.2% |
| Broadband Home | 21,353 | 55.8% |
| Cellular Data Only | 7,204 | 18.8% |
| Satellite Internet | 3,176 | 8.3% |
| No Internet | 7,437 | 19.5% |
| Total | 38,237 | 100.0% |
Lauderdale County Summary
Lauderdale County is located in the northwest corner of the state of Alabama, in the United States. It is bordered by Colbert County to the north, Franklin County to the east, Lawrence County to the south, and Mississippi to the west. The county seat is Florence, and the largest city is Muscle Shoals. The county was established in 1818 and named for Colonel James Lauderdale, a soldier in the War of 1812.
Geography
Lauderdale County covers an area of 602 square miles, of which 599 square miles is land and 3 square miles is water. The county is located in the Tennessee Valley region of the state, and is part of the Tennessee River watershed. The terrain is mostly rolling hills, with some flat areas in the northern part of the county. The highest point in the county is located in the northwest corner, at an elevation of 845 feet. The county is drained by the Tennessee River, which forms its western border.
The climate of Lauderdale County is humid subtropical, with hot, humid summers and mild winters. The average annual temperature is 64°F, and the average annual precipitation is 51 inches.
Demographics
As of the 2010 census, there were 92,709 people, 37,845 households, and 25,845 families living in the county. The population density was 154 people per square mile. The racial makeup of the county was 79.2% White, 17.7% Black or African American, 0.4% Native American, 0.7% Asian, 0.1% Pacific Islander, 0.7% from other races, and 1.2% from two or more races. 2.2% of the population were Hispanic or Latino of any race.
The median income for a household in the county was $37,845, and the median income for a family was $45,845. The per capita income for the county was $20,845. About 14.2% of families and 17.7% of the population were below the poverty line, including 25.2% of those under age 18 and 11.7% of those age 65 or over.
Economy
Lauderdale County is a largely rural county, with a strong agricultural base. The main crops grown in the county are cotton, soybeans, corn, and wheat. The county is also home to several large poultry farms.
The county is also home to several large manufacturing companies, including the TVA Bellefonte Nuclear Plant, the International Paper Company, and the Reynolds Metals Company. The county is also home to several large retail stores, including Walmart, Target, and Lowe's.
The county is served by the Florence-Lauderdale County Airport, which offers daily flights to Atlanta, Birmingham, and Nashville. The county is also served by several major highways, including Interstate 65, U.S. Route 72, and U.S. Route 43.
Conclusion
Lauderdale County is a largely rural county located in the northwest corner of Alabama. It is bordered by Colbert County to the north, Franklin County to the east, Lawrence County to the south, and Mississippi to the west. The county has a population of 92,709, and is home to several large manufacturing companies and retail stores. The county is served by the Florence-Lauderdale County Airport, and several major highways. The county has a strong agricultural base, and is also home to several large poultry farms.
Common Questions
What is Per Capita Income in Lauderdale County?
Per Capita income in Lauderdale County is $32,678.
What is the Median Family Income in Lauderdale County?
Median Family Income in Lauderdale County is $76,544.
What is the Median Household income in Lauderdale County?
Median Household Income in Lauderdale County is $56,081.
What is Income or Wage Gap in Lauderdale County?
Income or Wage Gap in Lauderdale County is 35.7%.
Women in Lauderdale County earn 64.3 cents for every dollar earned by a man.
What is Family Income Deficit in Lauderdale County?
Family Income Deficit in Lauderdale County is $10,852.
Families that are below poverty line in Lauderdale County earn $10,852 less on average than the poverty threshold level.
What is Inequality or Gini Index in Lauderdale County?
Inequality or Gini Index in Lauderdale County is 0.46.
What is the Total Population of Lauderdale County?
Total Population of Lauderdale County is 94,329.
What is the Total Male Population of Lauderdale County?
Total Male Population of Lauderdale County is 45,493.
What is the Total Female Population of Lauderdale County?
Total Female Population of Lauderdale County is 48,836.
What is the Ratio of Males per 100 Females in Lauderdale County?
There are 93.15 Males per 100 Females in Lauderdale County.
What is the Ratio of Females per 100 Males in Lauderdale County?
There are 107.35 Females per 100 Males in Lauderdale County.
What is the Median Population Age in Lauderdale County?
Median Population Age in Lauderdale County is 40.8 Years.
What is the Average Family Size in Lauderdale County
Average Family Size in Lauderdale County is 3.0 People.
What is the Average Household Size in Lauderdale County
Average Household Size in Lauderdale County is 2.4 People.
How Large is the Labor Force in Lauderdale County?
There are 45,163 People in the Labor Forcein in Lauderdale County.
What is the Percentage of People in the Labor Force in Lauderdale County?
58.1% of People are in the Labor Force in Lauderdale County.
What is the Unemployment Rate in Lauderdale County?
Unemployment Rate in Lauderdale County is 3.6%.