Arab, AL Map & Demographics
Arab Map
Arab Overview
$32,269
PER CAPITA INCOME
$80,236
AVG FAMILY INCOME
$56,471
AVG HOUSEHOLD INCOME
24.6%
WAGE / INCOME GAP [ % ]
75.4¢/ $1
WAGE / INCOME GAP [ $ ]
$8,590
FAMILY INCOME DEFICIT
0.46
INEQUALITY / GINI INDEX
8,552
TOTAL POPULATION
4,354
MALE POPULATION
4,198
FEMALE POPULATION
103.72
MALES / 100 FEMALES
96.42
FEMALES / 100 MALES
38.7
MEDIAN AGE
3.2
AVG FAMILY SIZE
2.5
AVG HOUSEHOLD SIZE
3,896
LABOR FORCE [ PEOPLE ]
59.0%
PERCENT IN LABOR FORCE
3.0%
UNEMPLOYMENT RATE
Arab Zip Codes
Arab Area Codes
Income in Arab
Income Overview in Arab
Per Capita Income in Arab is $32,269, while median incomes of families and households are $80,236 and $56,471 respectively.
| Characteristic | Number | Measure |
| Per Capita Income | 8,552 | $32,269 |
| Median Family Income | 2,157 | $80,236 |
| Mean Family Income | 2,157 | $99,504 |
| Median Household Income | 3,336 | $56,471 |
| Mean Household Income | 3,336 | $79,422 |
| Income Deficit | 2,157 | $8,590 |
| Wage / Income Gap (%) | 8,552 | 24.63% |
| Wage / Income Gap ($) | 8,552 | 75.37¢ per $1 |
| Gini / Inequality Index | 8,552 | 0.46 |
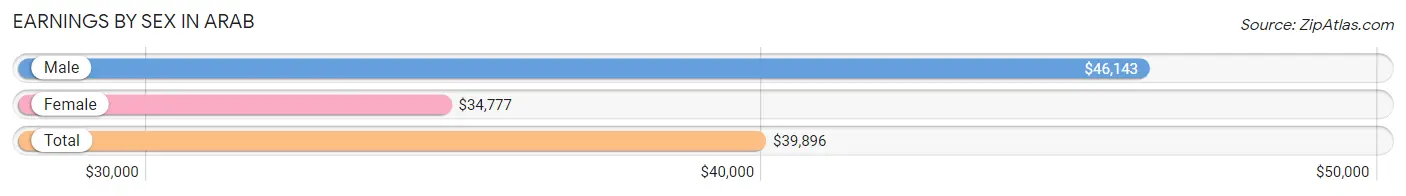
Earnings by Sex in Arab
Average Earnings in Arab are $39,896, $46,143 for men and $34,777 for women, a difference of 24.6%.
| Sex | Number | Average Earnings |
| Male | 2,238 (55.0%) | $46,143 |
| Female | 1,833 (45.0%) | $34,777 |
| Total | 4,071 (100.0%) | $39,896 |
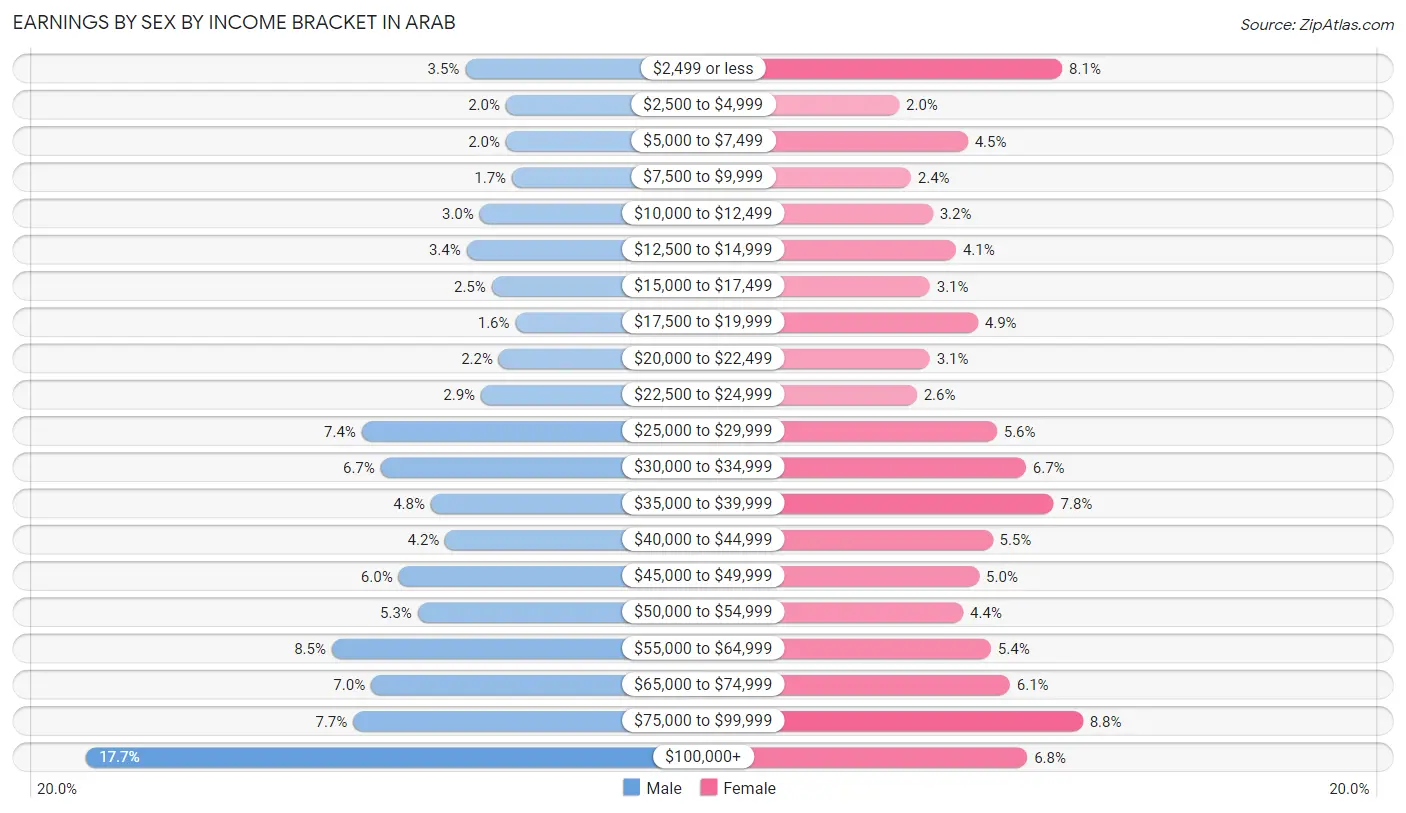
Earnings by Sex by Income Bracket in Arab
The most common earnings brackets in Arab are $100,000+ for men (396 | 17.7%) and $75,000 to $99,999 for women (162 | 8.8%).
| Income | Male | Female |
| $2,499 or less | 78 (3.5%) | 148 (8.1%) |
| $2,500 to $4,999 | 44 (2.0%) | 36 (2.0%) |
| $5,000 to $7,499 | 44 (2.0%) | 83 (4.5%) |
| $7,500 to $9,999 | 39 (1.7%) | 44 (2.4%) |
| $10,000 to $12,499 | 66 (2.9%) | 59 (3.2%) |
| $12,500 to $14,999 | 77 (3.4%) | 75 (4.1%) |
| $15,000 to $17,499 | 56 (2.5%) | 57 (3.1%) |
| $17,500 to $19,999 | 36 (1.6%) | 90 (4.9%) |
| $20,000 to $22,499 | 50 (2.2%) | 57 (3.1%) |
| $22,500 to $24,999 | 65 (2.9%) | 48 (2.6%) |
| $25,000 to $29,999 | 165 (7.4%) | 103 (5.6%) |
| $30,000 to $34,999 | 149 (6.7%) | 123 (6.7%) |
| $35,000 to $39,999 | 107 (4.8%) | 142 (7.7%) |
| $40,000 to $44,999 | 95 (4.2%) | 100 (5.5%) |
| $45,000 to $49,999 | 134 (6.0%) | 91 (5.0%) |
| $50,000 to $54,999 | 118 (5.3%) | 80 (4.4%) |
| $55,000 to $64,999 | 190 (8.5%) | 99 (5.4%) |
| $65,000 to $74,999 | 157 (7.0%) | 112 (6.1%) |
| $75,000 to $99,999 | 172 (7.7%) | 162 (8.8%) |
| $100,000+ | 396 (17.7%) | 124 (6.8%) |
| Total | 2,238 (100.0%) | 1,833 (100.0%) |
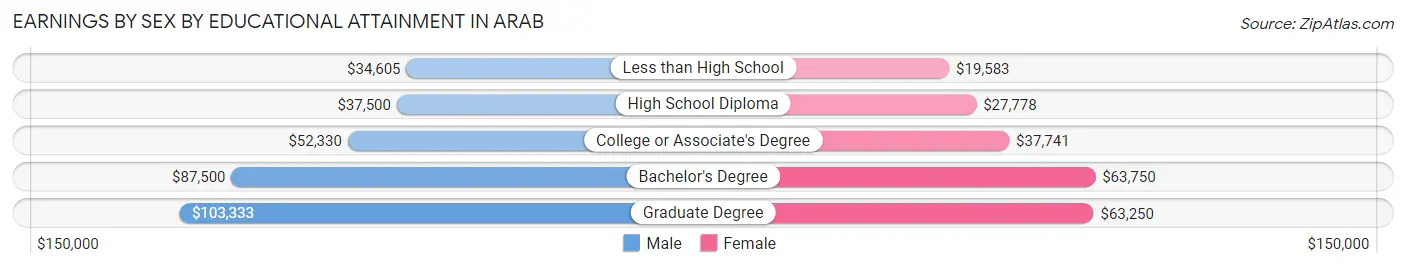
Earnings by Sex by Educational Attainment in Arab
Average earnings in Arab are $52,095 for men and $38,590 for women, a difference of 25.9%. Men with an educational attainment of graduate degree enjoy the highest average annual earnings of $103,333, while those with less than high school education earn the least with $34,605. Women with an educational attainment of bachelor's degree earn the most with the average annual earnings of $63,750, while those with less than high school education have the smallest earnings of $19,583.
| Educational Attainment | Male Income | Female Income |
| Less than High School | $34,605 | $19,583 |
| High School Diploma | $37,500 | $27,778 |
| College or Associate's Degree | $52,330 | $37,741 |
| Bachelor's Degree | $87,500 | $63,750 |
| Graduate Degree | $103,333 | $63,250 |
| Total | $52,095 | $38,590 |
Family Income in Arab
Family Income Brackets in Arab
According to the Arab family income data, there are 438 families falling into the $100,000 to $149,999 income range, which is the most common income bracket and makes up 20.3% of all families. Conversely, the $10,000 to $14,999 income bracket is the least frequent group with only 43 families (2.0%) belonging to this category.
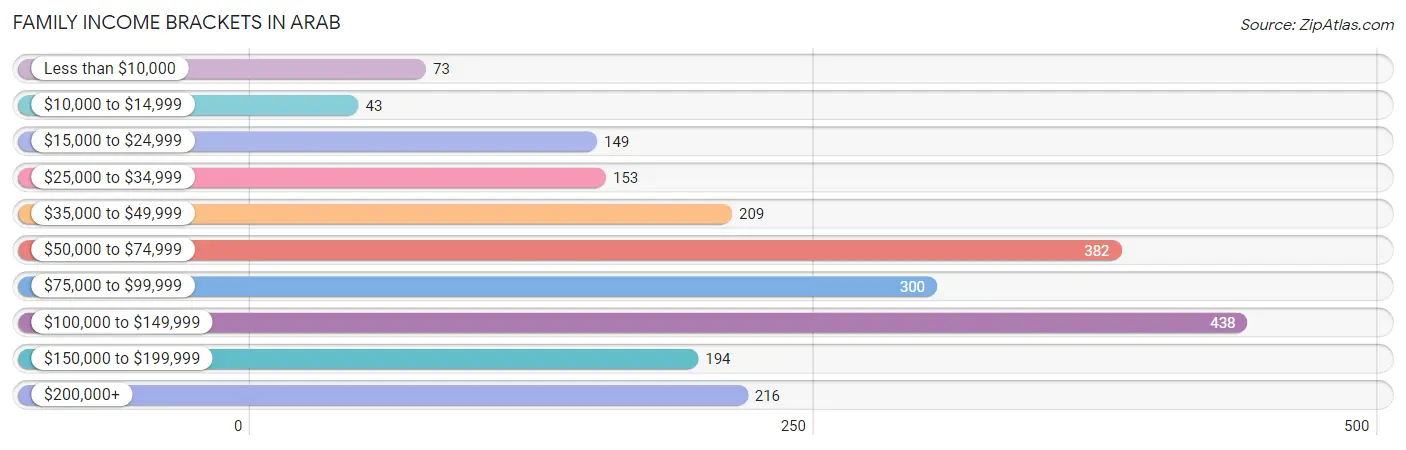
| Income Bracket | # Families | % Families |
| Less than $10,000 | 73 | 3.4% |
| $10,000 to $14,999 | 43 | 2.0% |
| $15,000 to $24,999 | 149 | 6.9% |
| $25,000 to $34,999 | 153 | 7.1% |
| $35,000 to $49,999 | 209 | 9.7% |
| $50,000 to $74,999 | 382 | 17.7% |
| $75,000 to $99,999 | 300 | 13.9% |
| $100,000 to $149,999 | 438 | 20.3% |
| $150,000 to $199,999 | 194 | 9.0% |
| $200,000+ | 216 | 10.0% |
Family Income by Famaliy Size in Arab
7+ person families (56 | 2.6%) account for the highest median family income in Arab with $175,500 per family, while 2-person families (1,028 | 47.7%) have the highest median income of $32,688 per family member.
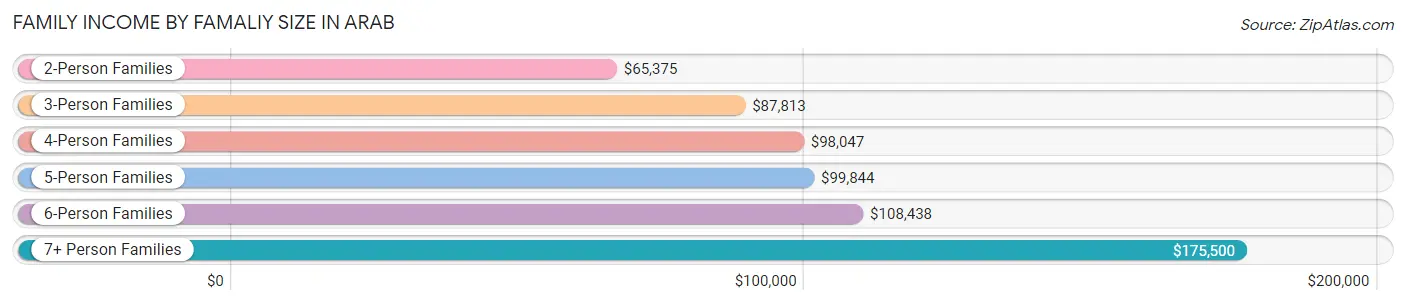
| Income Bracket | # Families | Median Income |
| 2-Person Families | 1,028 (47.7%) | $65,375 |
| 3-Person Families | 456 (21.1%) | $87,813 |
| 4-Person Families | 405 (18.8%) | $98,047 |
| 5-Person Families | 141 (6.5%) | $99,844 |
| 6-Person Families | 71 (3.3%) | $108,438 |
| 7+ Person Families | 56 (2.6%) | $175,500 |
| Total | 2,157 (100.0%) | $80,236 |
Family Income by Number of Earners in Arab
The median family income in Arab is $80,236, with families comprising 3+ earners (213) having the highest median family income of $168,393, while families with no earners (361) have the lowest median family income of $41,650, accounting for 9.9% and 16.7% of families, respectively.
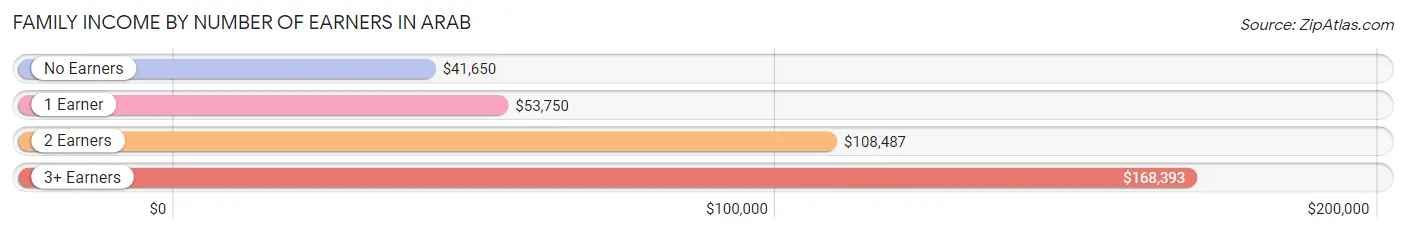
| Number of Earners | # Families | Median Income |
| No Earners | 361 (16.7%) | $41,650 |
| 1 Earner | 692 (32.1%) | $53,750 |
| 2 Earners | 891 (41.3%) | $108,487 |
| 3+ Earners | 213 (9.9%) | $168,393 |
| Total | 2,157 (100.0%) | $80,236 |
Household Income in Arab
Household Income Brackets in Arab
With 517 households falling in the category, the $50,000 to $74,999 income range is the most frequent in Arab, accounting for 15.5% of all households. In contrast, only 157 households (4.7%) fall into the less than $10,000 income bracket, making it the least populous group.
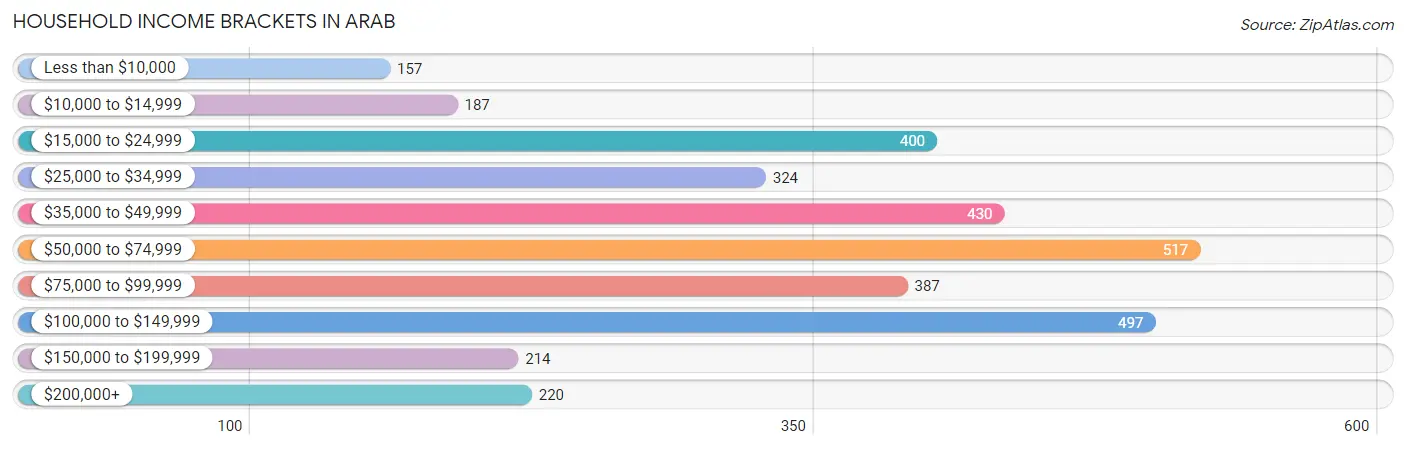
| Income Bracket | # Households | % Households |
| Less than $10,000 | 157 | 4.7% |
| $10,000 to $14,999 | 187 | 5.6% |
| $15,000 to $24,999 | 400 | 12.0% |
| $25,000 to $34,999 | 324 | 9.7% |
| $35,000 to $49,999 | 430 | 12.9% |
| $50,000 to $74,999 | 517 | 15.5% |
| $75,000 to $99,999 | 387 | 11.6% |
| $100,000 to $149,999 | 497 | 14.9% |
| $150,000 to $199,999 | 214 | 6.4% |
| $200,000+ | 220 | 6.6% |
Household Income by Householder Age in Arab
The median household income in Arab is $56,471, with the highest median household income of $72,083 found in the 45 to 64 years age bracket for the primary householder. A total of 1,215 households (36.4%) fall into this category. Meanwhile, the 65+ years age bracket for the primary householder has the lowest median household income of $37,596, with 937 households (28.1%) in this group.
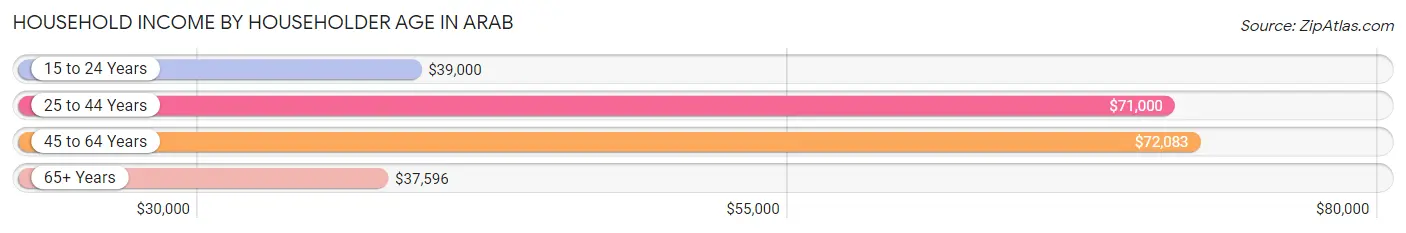
| Income Bracket | # Households | Median Income |
| 15 to 24 Years | 130 (3.9%) | $39,000 |
| 25 to 44 Years | 1,054 (31.6%) | $71,000 |
| 45 to 64 Years | 1,215 (36.4%) | $72,083 |
| 65+ Years | 937 (28.1%) | $37,596 |
| Total | 3,336 (100.0%) | $56,471 |
Poverty in Arab
Income Below Poverty by Sex and Age in Arab
With 12.6% poverty level for males and 14.8% for females among the residents of Arab, under 5 year old males and 18 to 24 year old females are the most vulnerable to poverty, with 149 males (40.3%) and 57 females (20.7%) in their respective age groups living below the poverty level.
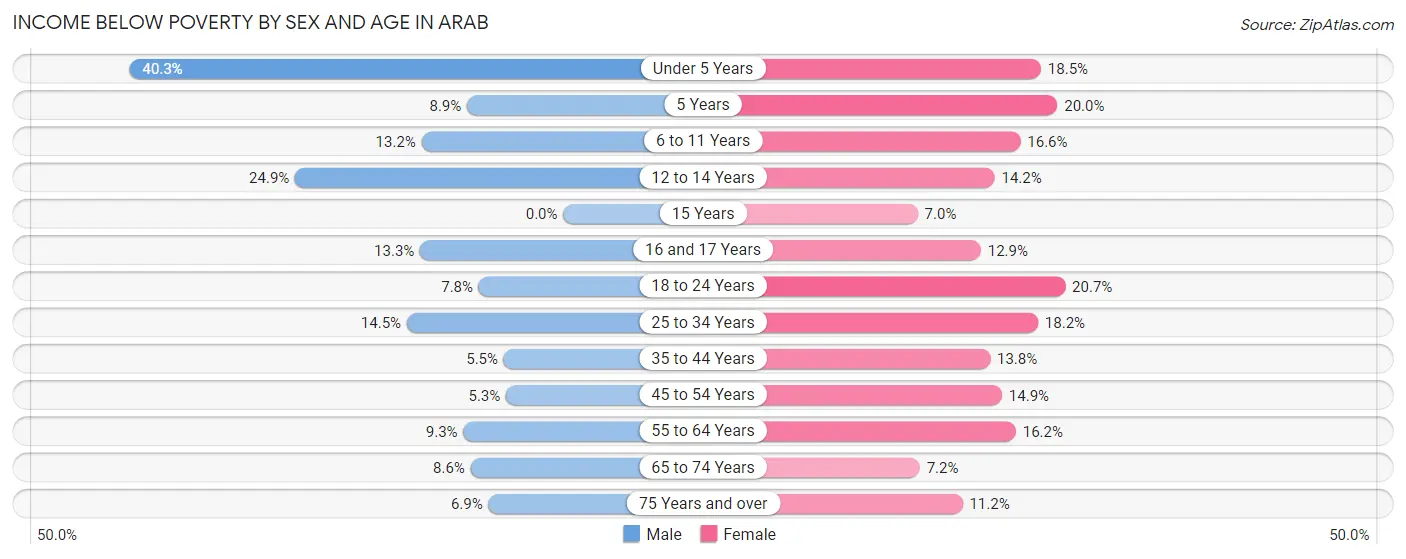
| Age Bracket | Male | Female |
| Under 5 Years | 149 (40.3%) | 34 (18.5%) |
| 5 Years | 5 (8.9%) | 15 (20.0%) |
| 6 to 11 Years | 53 (13.2%) | 55 (16.6%) |
| 12 to 14 Years | 59 (24.9%) | 20 (14.2%) |
| 15 Years | 0 (0.0%) | 5 (7.0%) |
| 16 and 17 Years | 23 (13.3%) | 12 (12.9%) |
| 18 to 24 Years | 28 (7.8%) | 57 (20.7%) |
| 25 to 34 Years | 70 (14.5%) | 93 (18.2%) |
| 35 to 44 Years | 30 (5.5%) | 75 (13.8%) |
| 45 to 54 Years | 25 (5.3%) | 88 (14.9%) |
| 55 to 64 Years | 52 (9.3%) | 89 (16.2%) |
| 65 to 74 Years | 32 (8.6%) | 29 (7.2%) |
| 75 Years and over | 15 (6.9%) | 40 (11.2%) |
| Total | 541 (12.6%) | 612 (14.8%) |
Income Above Poverty by Sex and Age in Arab
According to the poverty statistics in Arab, males aged 15 years and females aged 15 years are the age groups that are most secure financially, with 100.0% of males and 93.0% of females in these age groups living above the poverty line.
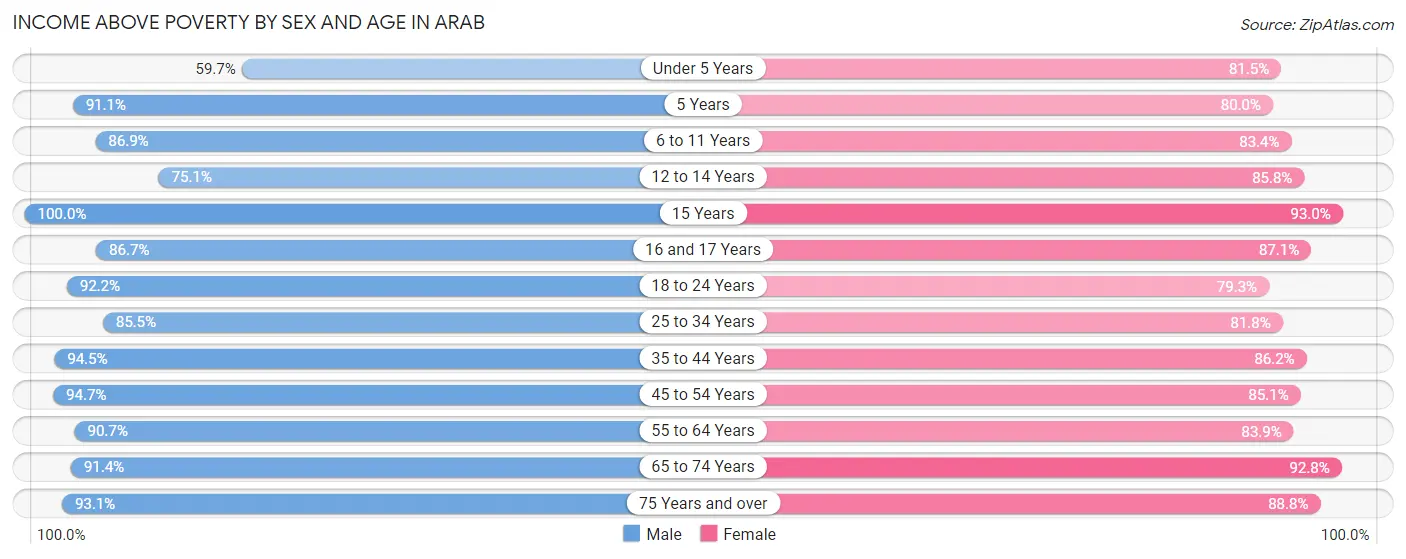
| Age Bracket | Male | Female |
| Under 5 Years | 221 (59.7%) | 150 (81.5%) |
| 5 Years | 51 (91.1%) | 60 (80.0%) |
| 6 to 11 Years | 350 (86.9%) | 277 (83.4%) |
| 12 to 14 Years | 178 (75.1%) | 121 (85.8%) |
| 15 Years | 69 (100.0%) | 66 (93.0%) |
| 16 and 17 Years | 150 (86.7%) | 81 (87.1%) |
| 18 to 24 Years | 329 (92.2%) | 218 (79.3%) |
| 25 to 34 Years | 412 (85.5%) | 418 (81.8%) |
| 35 to 44 Years | 513 (94.5%) | 470 (86.2%) |
| 45 to 54 Years | 446 (94.7%) | 504 (85.1%) |
| 55 to 64 Years | 509 (90.7%) | 462 (83.9%) |
| 65 to 74 Years | 340 (91.4%) | 372 (92.8%) |
| 75 Years and over | 201 (93.1%) | 317 (88.8%) |
| Total | 3,769 (87.5%) | 3,516 (85.2%) |
Income Below Poverty Among Married-Couple Families in Arab
The poverty statistics for married-couple families in Arab show that 6.0% or 96 of the total 1,591 families live below the poverty line. Families with no children have the highest poverty rate of 7.0%, comprising of 61 families. On the other hand, families with 5 or more children have the lowest poverty rate of 0.0%, which includes 0 families.
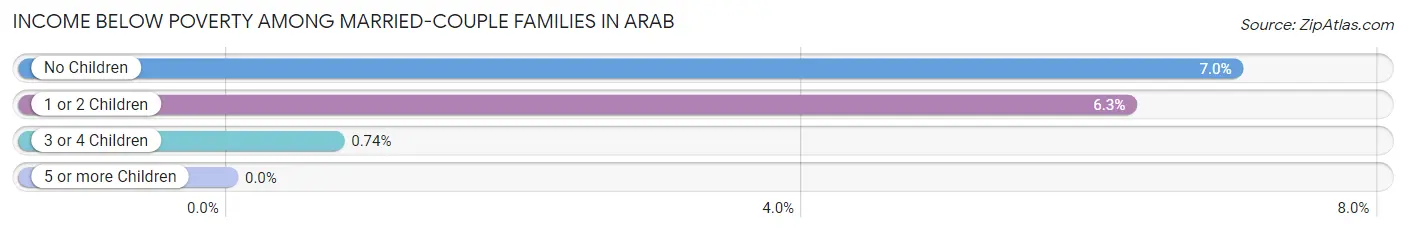
| Children | Above Poverty | Below Poverty |
| No Children | 811 (93.0%) | 61 (7.0%) |
| 1 or 2 Children | 509 (93.7%) | 34 (6.3%) |
| 3 or 4 Children | 134 (99.3%) | 1 (0.7%) |
| 5 or more Children | 41 (100.0%) | 0 (0.0%) |
| Total | 1,495 (94.0%) | 96 (6.0%) |
Income Below Poverty Among Single-Parent Households in Arab
According to the poverty data in Arab, 16.4% or 27 single-father households and 32.4% or 130 single-mother households are living below the poverty line. Among single-father households, those with 3 or 4 children have the highest poverty rate, with 4 households (50.0%) experiencing poverty. Likewise, among single-mother households, those with 3 or 4 children have the highest poverty rate, with 40 households (80.0%) falling below the poverty line.
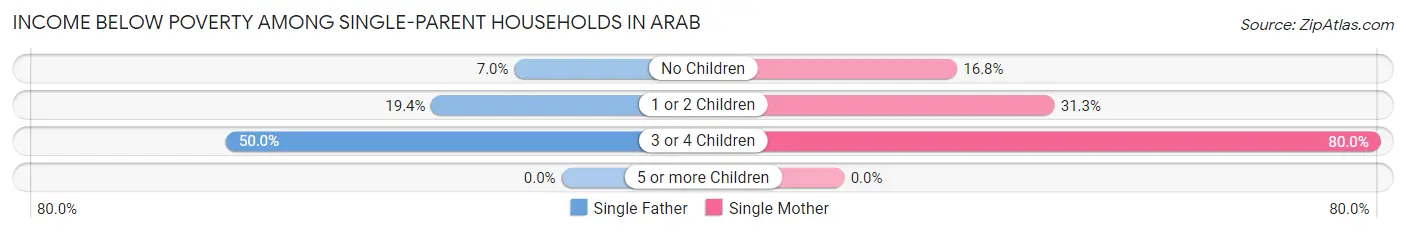
| Children | Single Father | Single Mother |
| No Children | 4 (7.0%) | 23 (16.8%) |
| 1 or 2 Children | 19 (19.4%) | 67 (31.3%) |
| 3 or 4 Children | 4 (50.0%) | 40 (80.0%) |
| 5 or more Children | 0 (0.0%) | 0 (0.0%) |
| Total | 27 (16.4%) | 130 (32.4%) |
Income Below Poverty Among Married-Couple vs Single-Parent Households in Arab
The poverty data for Arab shows that 96 of the married-couple family households (6.0%) and 157 of the single-parent households (27.7%) are living below the poverty level. Within the married-couple family households, those with no children have the highest poverty rate, with 61 households (7.0%) falling below the poverty line. Among the single-parent households, those with 3 or 4 children have the highest poverty rate, with 44 household (75.9%) living below poverty.
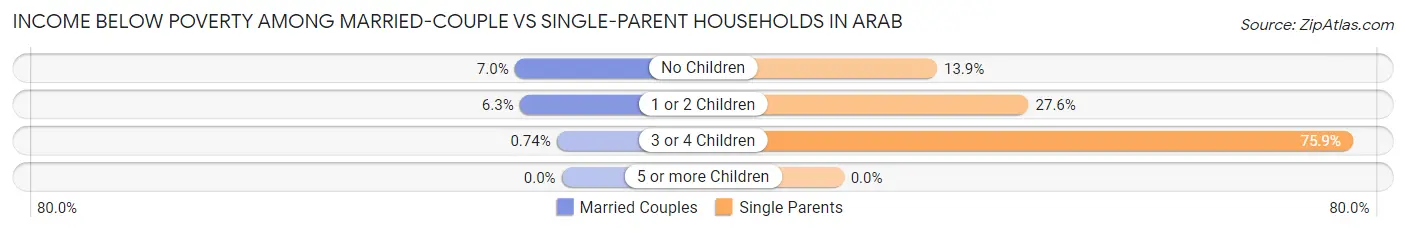
| Children | Married-Couple Families | Single-Parent Households |
| No Children | 61 (7.0%) | 27 (13.9%) |
| 1 or 2 Children | 34 (6.3%) | 86 (27.6%) |
| 3 or 4 Children | 1 (0.7%) | 44 (75.9%) |
| 5 or more Children | 0 (0.0%) | 0 (0.0%) |
| Total | 96 (6.0%) | 157 (27.7%) |
Race in Arab
The most populous races in Arab are White / Caucasian (7,822 | 91.5%), Hispanic or Latino (530 | 6.2%), and Two or more Races (317 | 3.7%).
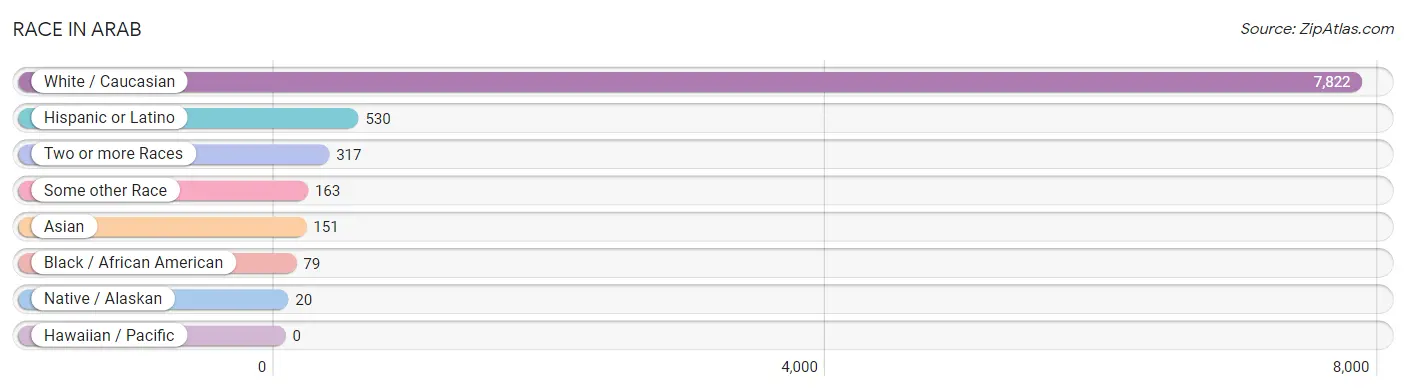
| Race | # Population | % Population |
| Asian | 151 | 1.8% |
| Black / African American | 79 | 0.9% |
| Hawaiian / Pacific | 0 | 0.0% |
| Hispanic or Latino | 530 | 6.2% |
| Native / Alaskan | 20 | 0.2% |
| White / Caucasian | 7,822 | 91.5% |
| Two or more Races | 317 | 3.7% |
| Some other Race | 163 | 1.9% |
| Total | 8,552 | 100.0% |
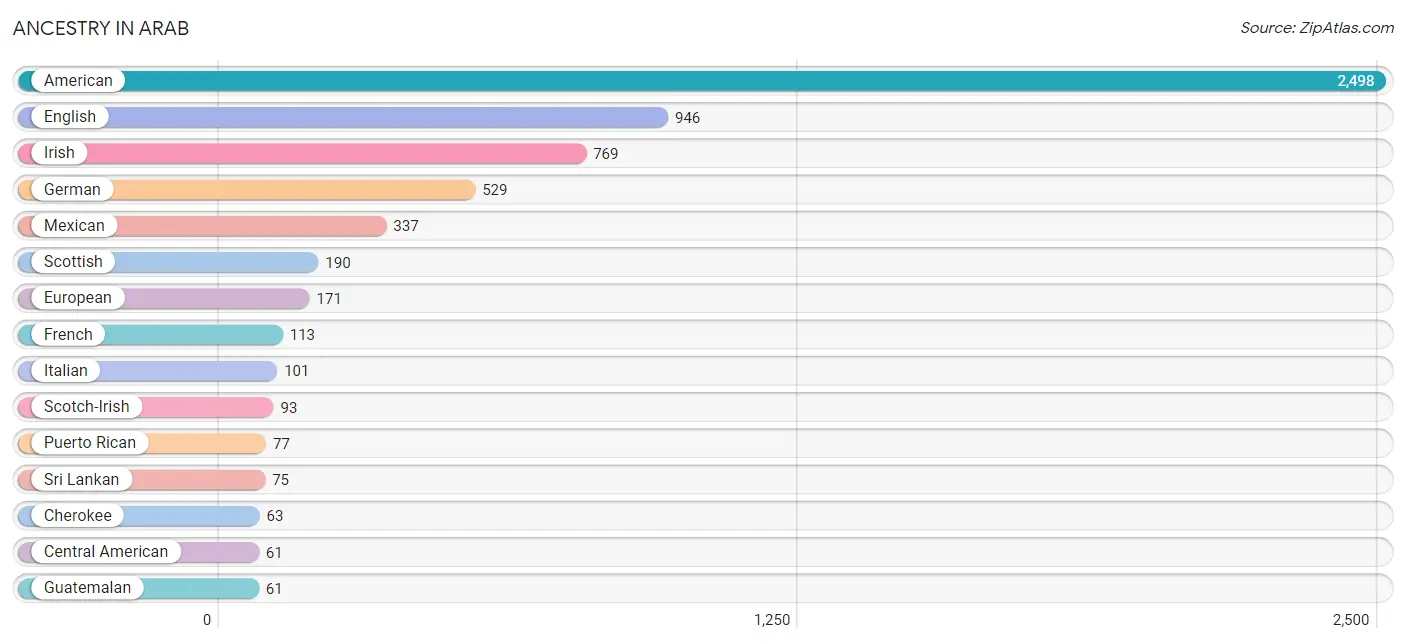
Ancestry in Arab
The most populous ancestries reported in Arab are American (2,498 | 29.2%), English (946 | 11.1%), Irish (769 | 9.0%), German (529 | 6.2%), and Mexican (337 | 3.9%), together accounting for 59.4% of all Arab residents.
| Ancestry | # Population | % Population |
| African | 2 | 0.0% |
| American | 2,498 | 29.2% |
| Apache | 1 | 0.0% |
| Arab | 3 | 0.0% |
| Armenian | 3 | 0.0% |
| Australian | 1 | 0.0% |
| Bhutanese | 1 | 0.0% |
| Blackfeet | 12 | 0.1% |
| British | 37 | 0.4% |
| Burmese | 3 | 0.0% |
| Canadian | 2 | 0.0% |
| Celtic | 7 | 0.1% |
| Central American | 61 | 0.7% |
| Central American Indian | 2 | 0.0% |
| Cherokee | 63 | 0.7% |
| Chinese | 2 | 0.0% |
| Chippewa | 3 | 0.0% |
| Choctaw | 6 | 0.1% |
| Comanche | 4 | 0.1% |
| Creek | 3 | 0.0% |
| Croatian | 2 | 0.0% |
| Czech | 2 | 0.0% |
| Danish | 1 | 0.0% |
| Dutch | 29 | 0.3% |
| Eastern European | 8 | 0.1% |
| English | 946 | 11.1% |
| European | 171 | 2.0% |
| Finnish | 1 | 0.0% |
| French | 113 | 1.3% |
| French Canadian | 43 | 0.5% |
| German | 529 | 6.2% |
| Greek | 11 | 0.1% |
| Guatemalan | 61 | 0.7% |
| Haitian | 14 | 0.2% |
| Hungarian | 1 | 0.0% |
| Indian (Asian) | 25 | 0.3% |
| Irish | 769 | 9.0% |
| Italian | 101 | 1.2% |
| Korean | 22 | 0.3% |
| Mexican | 337 | 3.9% |
| Mexican American Indian | 6 | 0.1% |
| Native Hawaiian | 4 | 0.1% |
| Navajo | 1 | 0.0% |
| Northern European | 4 | 0.1% |
| Norwegian | 22 | 0.3% |
| Pakistani | 4 | 0.1% |
| Polish | 59 | 0.7% |
| Portuguese | 10 | 0.1% |
| Puerto Rican | 77 | 0.9% |
| Romanian | 6 | 0.1% |
| Russian | 15 | 0.2% |
| Samoan | 1 | 0.0% |
| Scandinavian | 2 | 0.0% |
| Scotch-Irish | 93 | 1.1% |
| Scottish | 190 | 2.2% |
| Serbian | 2 | 0.0% |
| Shoshone | 1 | 0.0% |
| Slavic | 1 | 0.0% |
| Slovak | 1 | 0.0% |
| Spaniard | 14 | 0.2% |
| Spanish | 23 | 0.3% |
| Sri Lankan | 75 | 0.9% |
| Subsaharan African | 2 | 0.0% |
| Swedish | 11 | 0.1% |
| Thai | 45 | 0.5% |
| Tongan | 1 | 0.0% |
| Ukrainian | 8 | 0.1% |
| Welsh | 51 | 0.6% |
| Yugoslavian | 9 | 0.1% | View All 69 Rows |
Immigrants in Arab
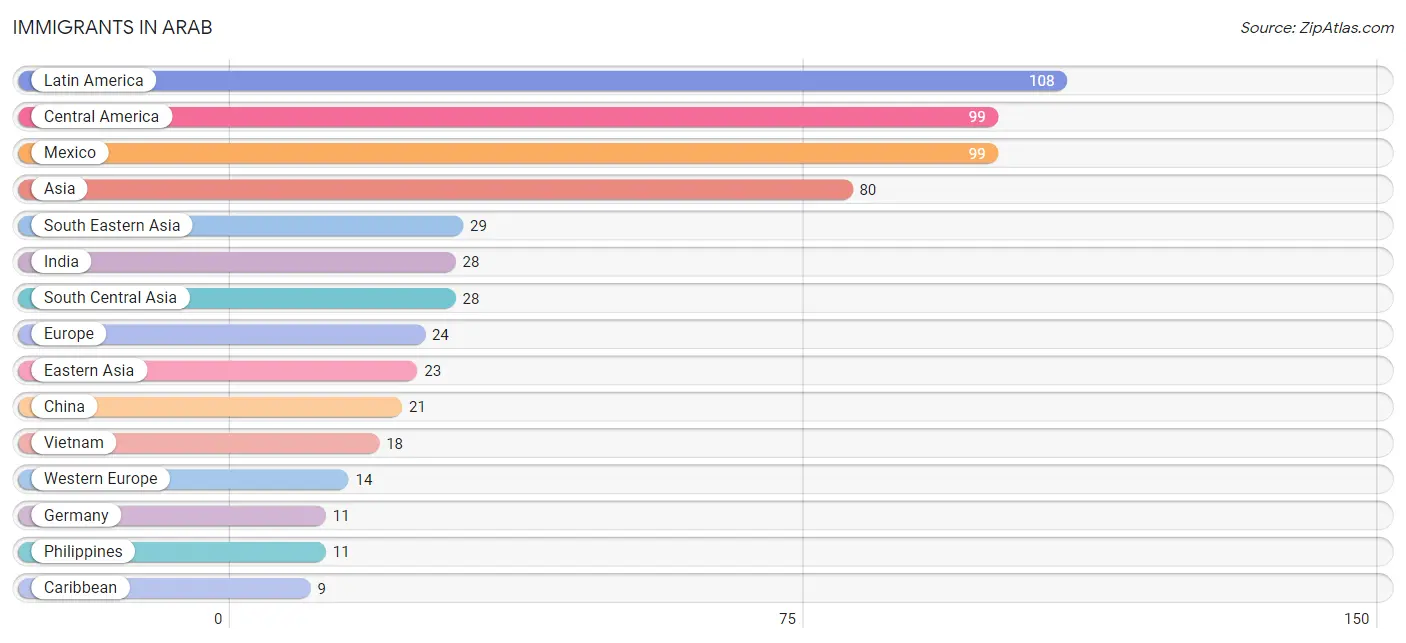
The most numerous immigrant groups reported in Arab came from Latin America (108 | 1.3%), Central America (99 | 1.2%), Mexico (99 | 1.2%), Asia (80 | 0.9%), and South Eastern Asia (29 | 0.3%), together accounting for 4.9% of all Arab residents.
| Immigration Origin | # Population | % Population |
| Asia | 80 | 0.9% |
| Canada | 3 | 0.0% |
| Caribbean | 9 | 0.1% |
| Central America | 99 | 1.2% |
| China | 21 | 0.3% |
| Eastern Asia | 23 | 0.3% |
| Eastern Europe | 6 | 0.1% |
| Europe | 24 | 0.3% |
| France | 3 | 0.0% |
| Germany | 11 | 0.1% |
| Haiti | 9 | 0.1% |
| India | 28 | 0.3% |
| Korea | 2 | 0.0% |
| Latin America | 108 | 1.3% |
| Mexico | 99 | 1.2% |
| Northern Europe | 4 | 0.1% |
| Philippines | 11 | 0.1% |
| Russia | 3 | 0.0% |
| Scotland | 4 | 0.1% |
| South Central Asia | 28 | 0.3% |
| South Eastern Asia | 29 | 0.3% |
| Ukraine | 3 | 0.0% |
| Vietnam | 18 | 0.2% |
| Western Europe | 14 | 0.2% | View All 24 Rows |
Sex and Age in Arab
Sex and Age in Arab
The most populous age groups in Arab are 10 to 14 Years (422 | 9.7%) for men and 45 to 49 Years (309 | 7.4%) for women.
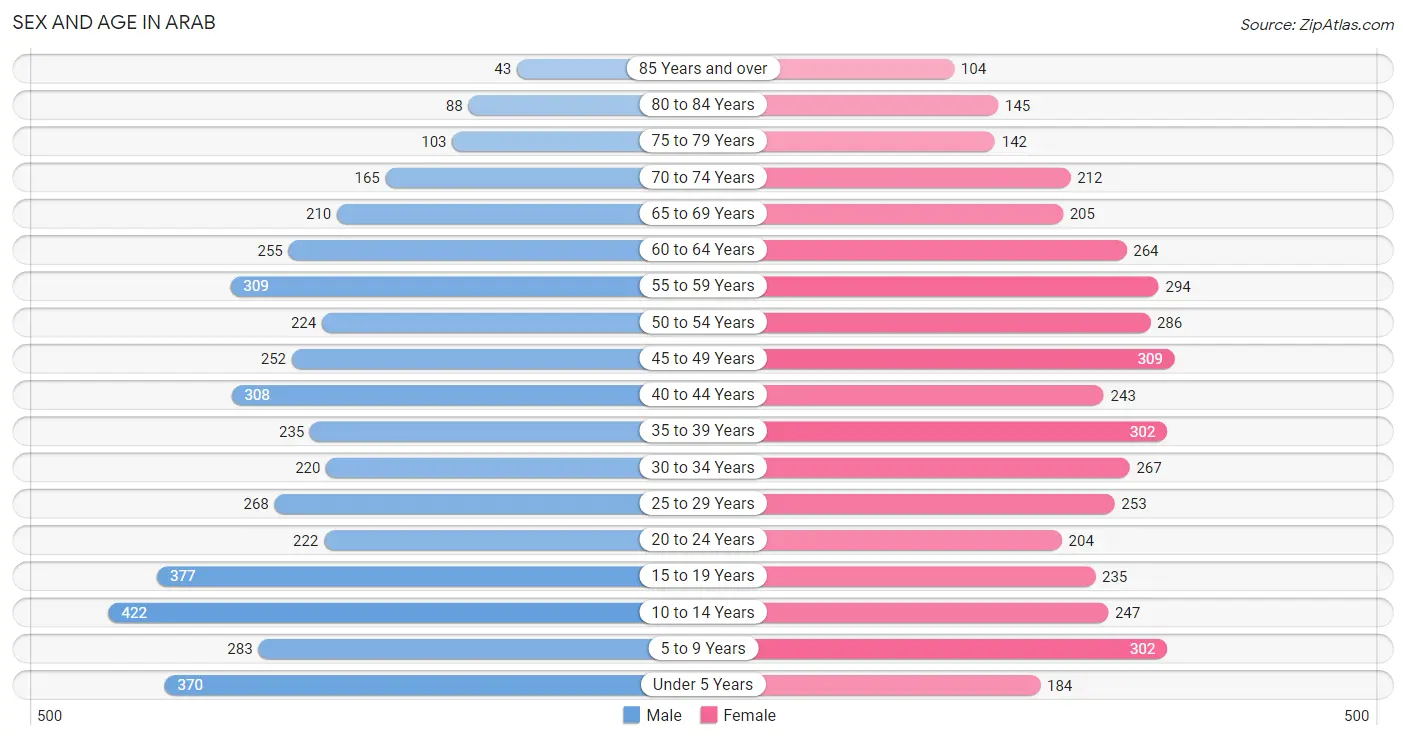
| Age Bracket | Male | Female |
| Under 5 Years | 370 (8.5%) | 184 (4.4%) |
| 5 to 9 Years | 283 (6.5%) | 302 (7.2%) |
| 10 to 14 Years | 422 (9.7%) | 247 (5.9%) |
| 15 to 19 Years | 377 (8.7%) | 235 (5.6%) |
| 20 to 24 Years | 222 (5.1%) | 204 (4.9%) |
| 25 to 29 Years | 268 (6.2%) | 253 (6.0%) |
| 30 to 34 Years | 220 (5.1%) | 267 (6.4%) |
| 35 to 39 Years | 235 (5.4%) | 302 (7.2%) |
| 40 to 44 Years | 308 (7.1%) | 243 (5.8%) |
| 45 to 49 Years | 252 (5.8%) | 309 (7.4%) |
| 50 to 54 Years | 224 (5.1%) | 286 (6.8%) |
| 55 to 59 Years | 309 (7.1%) | 294 (7.0%) |
| 60 to 64 Years | 255 (5.9%) | 264 (6.3%) |
| 65 to 69 Years | 210 (4.8%) | 205 (4.9%) |
| 70 to 74 Years | 165 (3.8%) | 212 (5.1%) |
| 75 to 79 Years | 103 (2.4%) | 142 (3.4%) |
| 80 to 84 Years | 88 (2.0%) | 145 (3.5%) |
| 85 Years and over | 43 (1.0%) | 104 (2.5%) |
| Total | 4,354 (100.0%) | 4,198 (100.0%) |
Families and Households in Arab
Median Family Size in Arab
The median family size in Arab is 3.24 persons per family, with single female/mother families (401 | 18.6%) accounting for the largest median family size of 3.35 persons per family. On the other hand, single male/father families (165 | 7.6%) represent the smallest median family size with 2.66 persons per family.
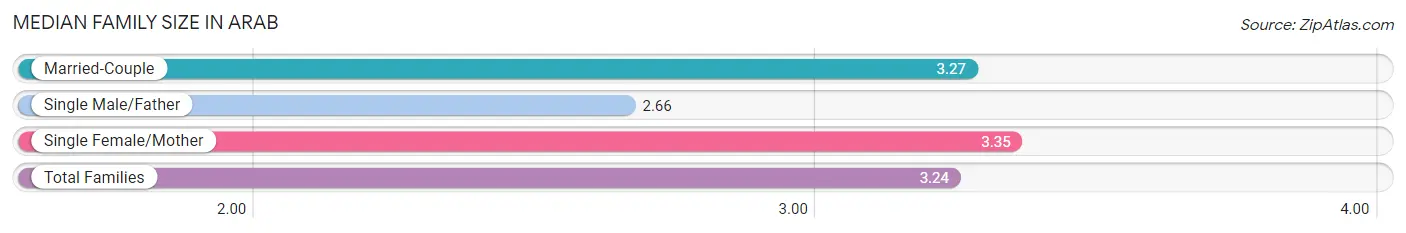
| Family Type | # Families | Family Size |
| Married-Couple | 1,591 (73.8%) | 3.27 |
| Single Male/Father | 165 (7.6%) | 2.66 |
| Single Female/Mother | 401 (18.6%) | 3.35 |
| Total Families | 2,157 (100.0%) | 3.24 |
Median Household Size in Arab
The median household size in Arab is 2.53 persons per household, with single female/mother households (401 | 12.0%) accounting for the largest median household size of 3.44 persons per household. non-family households (1,179 | 35.3%) represent the smallest median household size with 1.14 persons per household.
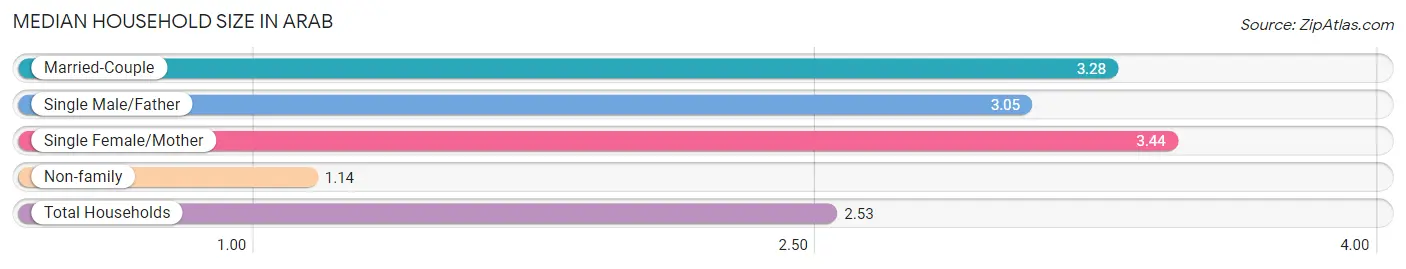
| Household Type | # Households | Household Size |
| Married-Couple | 1,591 (47.7%) | 3.28 |
| Single Male/Father | 165 (5.0%) | 3.05 |
| Single Female/Mother | 401 (12.0%) | 3.44 |
| Non-family | 1,179 (35.3%) | 1.14 |
| Total Households | 3,336 (100.0%) | 2.53 |
Household Size by Marriage Status in Arab
Out of a total of 3,336 households in Arab, 2,157 (64.7%) are family households, while 1,179 (35.3%) are nonfamily households. The most numerous type of family households are 2-person households, comprising 967, and the most common type of nonfamily households are 1-person households, comprising 1,058.
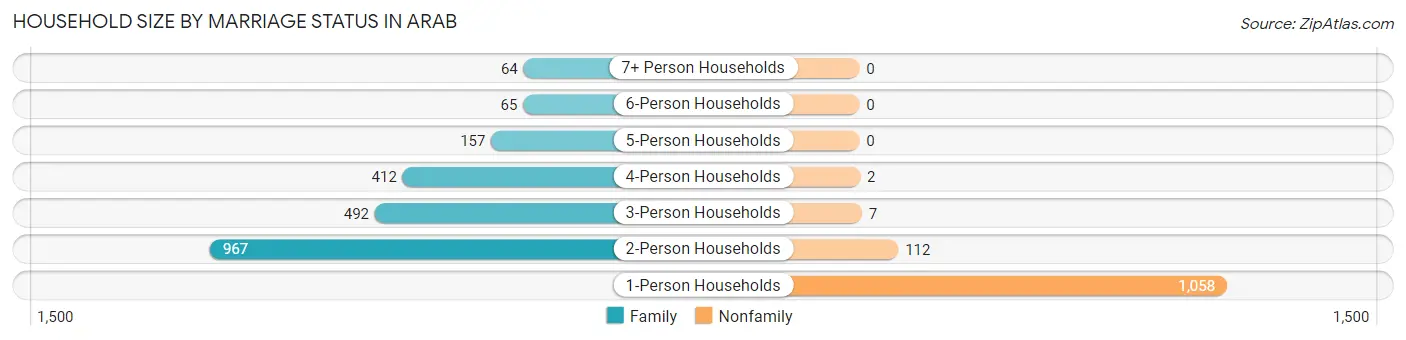
| Household Size | Family Households | Nonfamily Households |
| 1-Person Households | - | 1,058 (31.7%) |
| 2-Person Households | 967 (29.0%) | 112 (3.4%) |
| 3-Person Households | 492 (14.7%) | 7 (0.2%) |
| 4-Person Households | 412 (12.3%) | 2 (0.1%) |
| 5-Person Households | 157 (4.7%) | 0 (0.0%) |
| 6-Person Households | 65 (1.9%) | 0 (0.0%) |
| 7+ Person Households | 64 (1.9%) | 0 (0.0%) |
| Total | 2,157 (64.7%) | 1,179 (35.3%) |
Female Fertility in Arab
Fertility by Age in Arab
Average fertility rate in Arab is 56.0 births per 1,000 women. Women in the age bracket of 20 to 34 years have the highest fertility rate with 113.0 births per 1,000 women. Women in the age bracket of 20 to 34 years acount for 79.6% of all women with births.
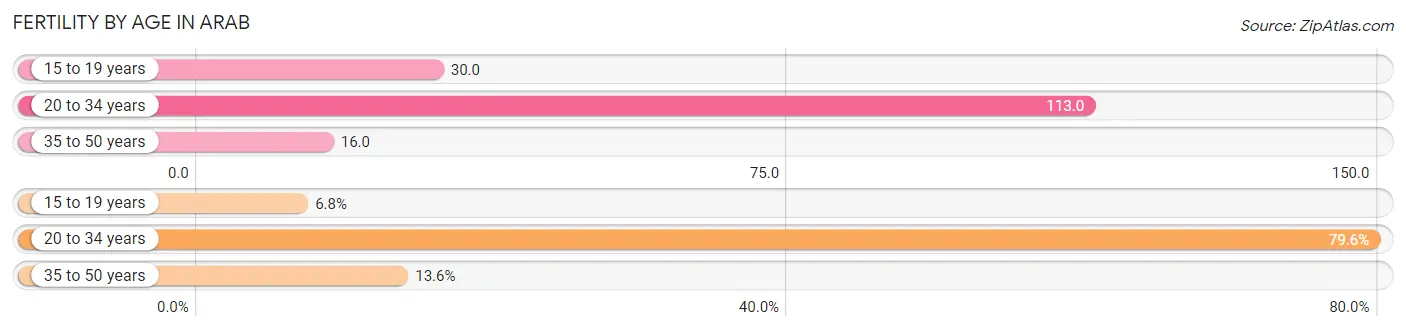
| Age Bracket | Women with Births | Births / 1,000 Women |
| 15 to 19 years | 7 (6.8%) | 30.0 |
| 20 to 34 years | 82 (79.6%) | 113.0 |
| 35 to 50 years | 14 (13.6%) | 16.0 |
| Total | 103 (100.0%) | 56.0 |
Fertility by Age by Marriage Status in Arab
72.8% of women with births (103) in Arab are married. The highest percentage of unmarried women with births falls into 15 to 19 years age bracket with 71.4% of them unmarried at the time of birth, while the lowest percentage of unmarried women with births belong to 35 to 50 years age bracket with 14.3% of them unmarried.
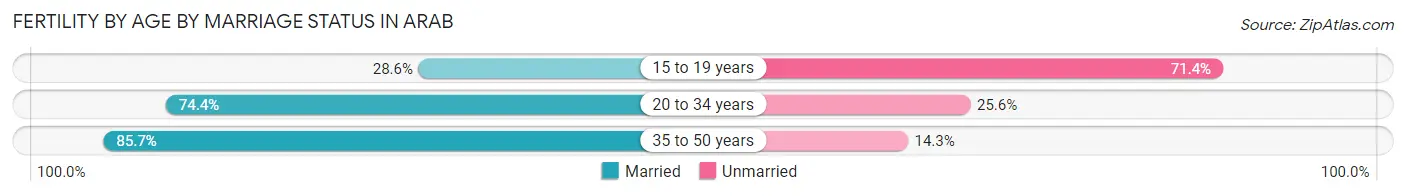
| Age Bracket | Married | Unmarried |
| 15 to 19 years | 2 (28.6%) | 5 (71.4%) |
| 20 to 34 years | 61 (74.4%) | 21 (25.6%) |
| 35 to 50 years | 12 (85.7%) | 2 (14.3%) |
| Total | 75 (72.8%) | 28 (27.2%) |
Fertility by Education in Arab
Average fertility rate in Arab is 56.0 births per 1,000 women. Women with the education attainment of bachelor's degree have the highest fertility rate of 121.0 births per 1,000 women, while women with the education attainment of less than high school have the lowest fertility at 7.0 births per 1,000 women. Women with the education attainment of high school diploma represent 33.0% of all women with births.
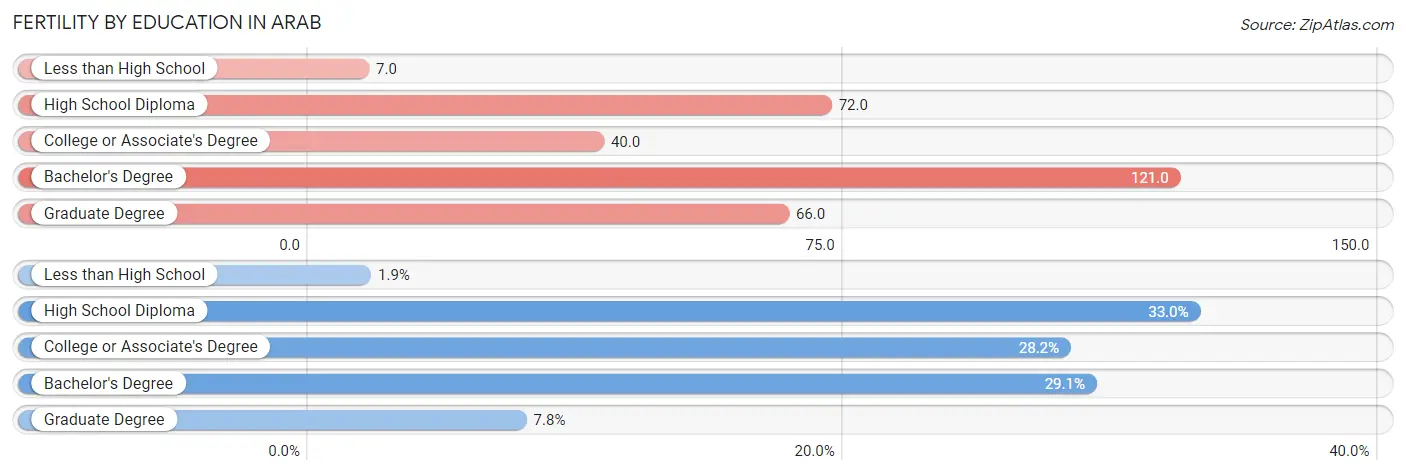
| Educational Attainment | Women with Births | Births / 1,000 Women |
| Less than High School | 2 (1.9%) | 7.0 |
| High School Diploma | 34 (33.0%) | 72.0 |
| College or Associate's Degree | 29 (28.2%) | 40.0 |
| Bachelor's Degree | 30 (29.1%) | 121.0 |
| Graduate Degree | 8 (7.8%) | 66.0 |
| Total | 103 (100.0%) | 56.0 |
Fertility by Education by Marriage Status in Arab
27.2% of women with births in Arab are unmarried. Women with the educational attainment of graduate degree are most likely to be married with 100.0% of them married at childbirth, while women with the educational attainment of less than high school are least likely to be married with 100.0% of them unmarried at childbirth.
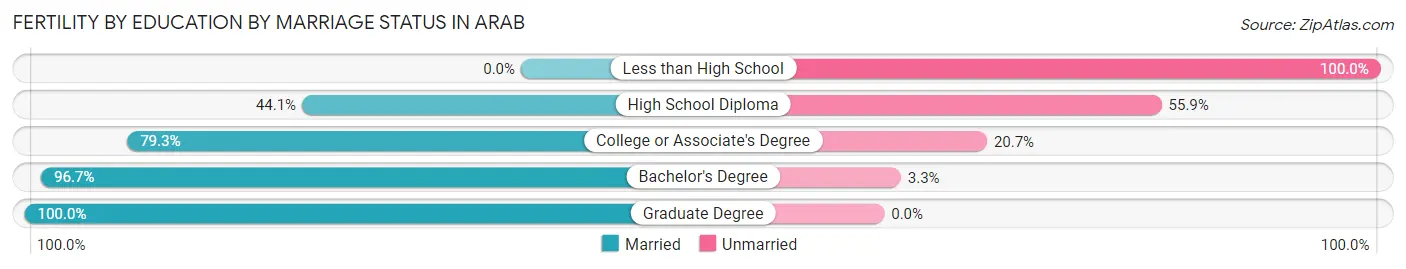
| Educational Attainment | Married | Unmarried |
| Less than High School | 0 (0.0%) | 2 (100.0%) |
| High School Diploma | 15 (44.1%) | 19 (55.9%) |
| College or Associate's Degree | 23 (79.3%) | 6 (20.7%) |
| Bachelor's Degree | 29 (96.7%) | 1 (3.3%) |
| Graduate Degree | 8 (100.0%) | 0 (0.0%) |
| Total | 75 (72.8%) | 28 (27.2%) |
Employment Characteristics in Arab
Employment by Class of Employer in Arab
Among the 3,712 employed individuals in Arab, private company employees (2,451 | 66.0%), self-employed (not incorporated) (297 | 8.0%), and not-for-profit organizations (285 | 7.7%) make up the most common classes of employment.
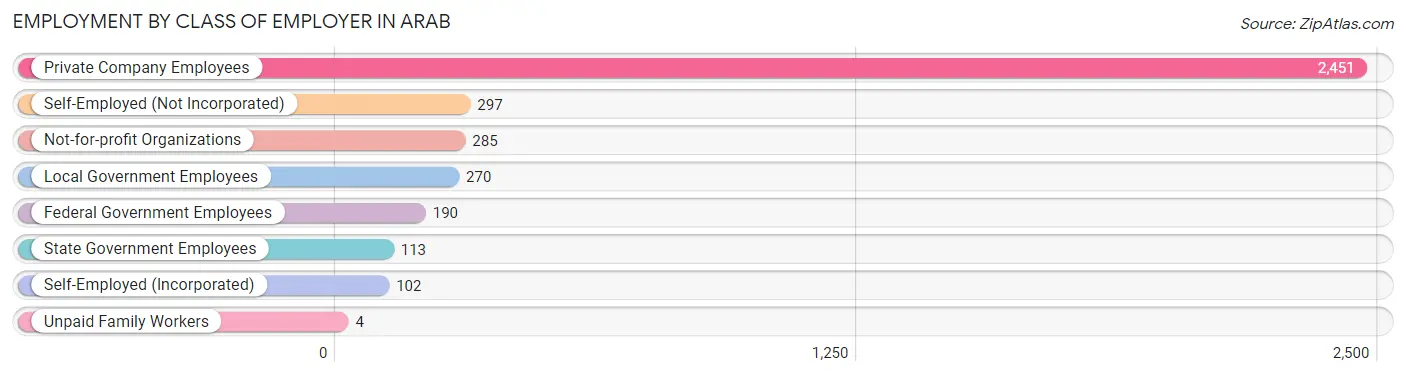
| Employer Class | # Employees | % Employees |
| Private Company Employees | 2,451 | 66.0% |
| Self-Employed (Incorporated) | 102 | 2.8% |
| Self-Employed (Not Incorporated) | 297 | 8.0% |
| Not-for-profit Organizations | 285 | 7.7% |
| Local Government Employees | 270 | 7.3% |
| State Government Employees | 113 | 3.0% |
| Federal Government Employees | 190 | 5.1% |
| Unpaid Family Workers | 4 | 0.1% |
| Total | 3,712 | 100.0% |
Employment Status by Age in Arab
According to the labor force statistics for Arab, out of the total population over 16 years of age (6,604), 59.0% or 3,896 individuals are in the labor force, with 3.0% or 117 of them unemployed. The age group with the highest labor force participation rate is 35 to 44 years, with 82.4% or 897 individuals in the labor force. Within the labor force, the 16 to 19 years age range has the highest percentage of unemployed individuals, with 13.9% or 28 of them being unemployed.
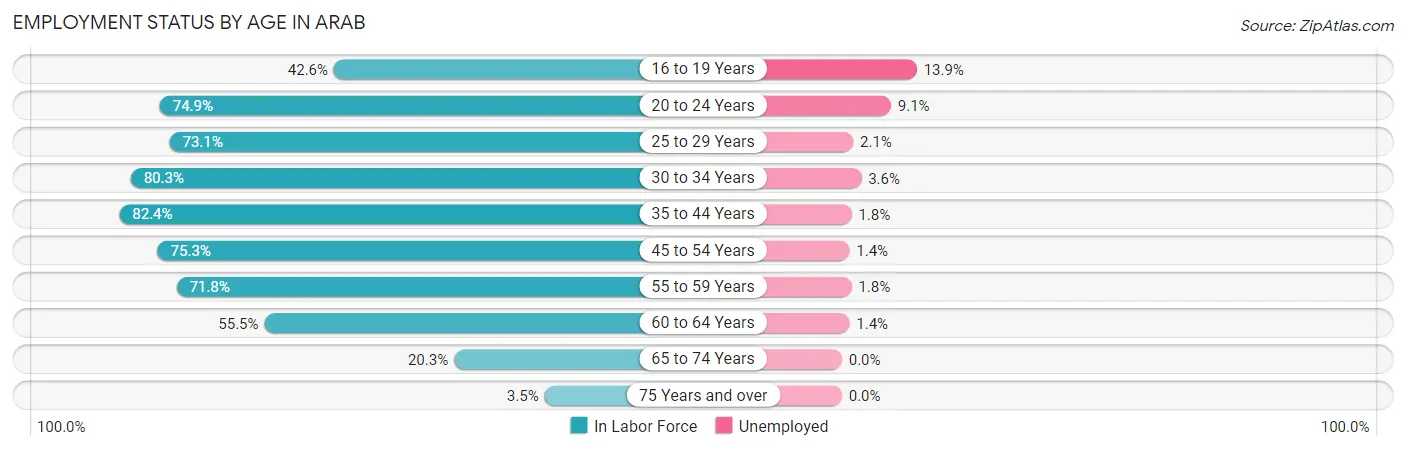
| Age Bracket | In Labor Force | Unemployed |
| 16 to 19 Years | 201 (42.6%) | 28 (13.9%) |
| 20 to 24 Years | 319 (74.9%) | 29 (9.1%) |
| 25 to 29 Years | 381 (73.1%) | 8 (2.1%) |
| 30 to 34 Years | 391 (80.3%) | 14 (3.6%) |
| 35 to 44 Years | 897 (82.4%) | 16 (1.8%) |
| 45 to 54 Years | 806 (75.3%) | 11 (1.4%) |
| 55 to 59 Years | 433 (71.8%) | 8 (1.8%) |
| 60 to 64 Years | 288 (55.5%) | 4 (1.4%) |
| 65 to 74 Years | 161 (20.3%) | 0 (0.0%) |
| 75 Years and over | 22 (3.5%) | 0 (0.0%) |
| Total | 3,896 (59.0%) | 117 (3.0%) |
Employment Status by Educational Attainment in Arab
According to labor force statistics for Arab, 74.5% of individuals (3,195) out of the total population between 25 and 64 years of age (4,289) are in the labor force, with 1.9% or 61 of them being unemployed. The group with the highest labor force participation rate are those with the educational attainment of bachelor's degree or higher, with 89.6% or 969 individuals in the labor force. Within the labor force, individuals with less than high school education have the highest percentage of unemployment, with 5.6% or 10 of them being unemployed.
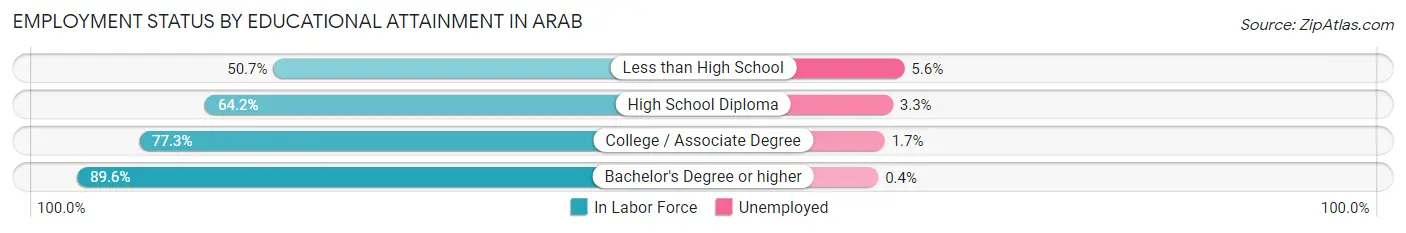
| Educational Attainment | In Labor Force | Unemployed |
| Less than High School | 177 (50.7%) | 20 (5.6%) |
| High School Diploma | 787 (64.2%) | 40 (3.3%) |
| College / Associate Degree | 1,262 (77.3%) | 28 (1.7%) |
| Bachelor's Degree or higher | 969 (89.6%) | 4 (0.4%) |
| Total | 3,195 (74.5%) | 81 (1.9%) |
Employment Occupations by Sex in Arab
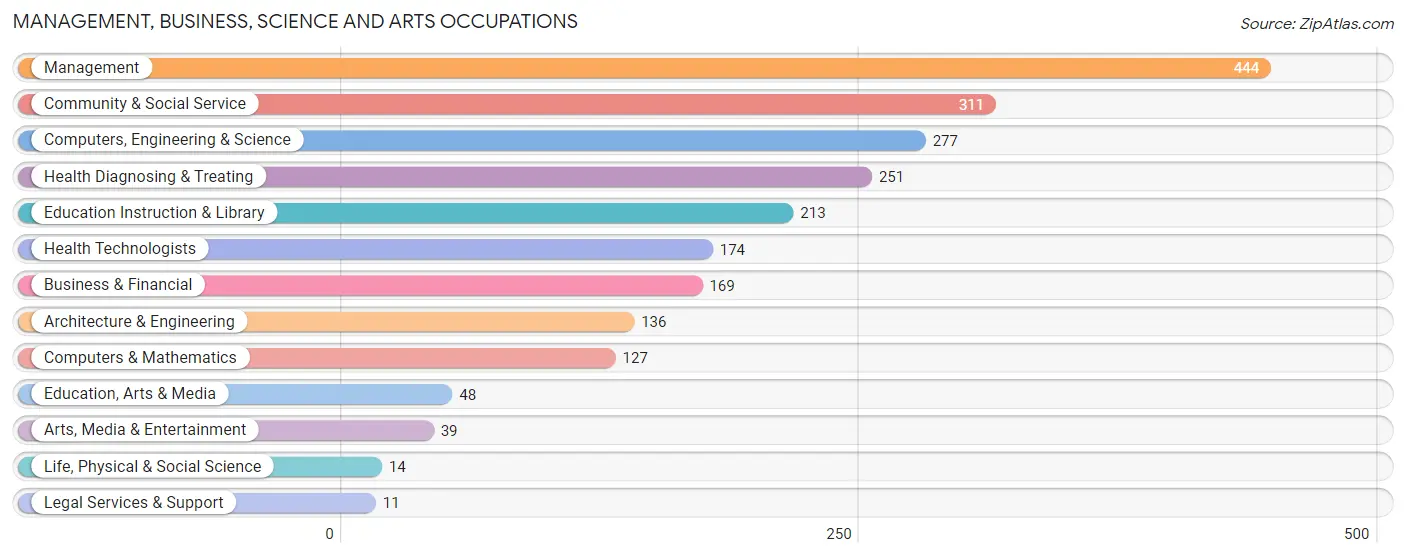
Management, Business, Science and Arts Occupations
The most common Management, Business, Science and Arts occupations in Arab are Management (444 | 11.7%), Community & Social Service (311 | 8.2%), Computers, Engineering & Science (277 | 7.3%), Health Diagnosing & Treating (251 | 6.6%), and Education Instruction & Library (213 | 5.6%).
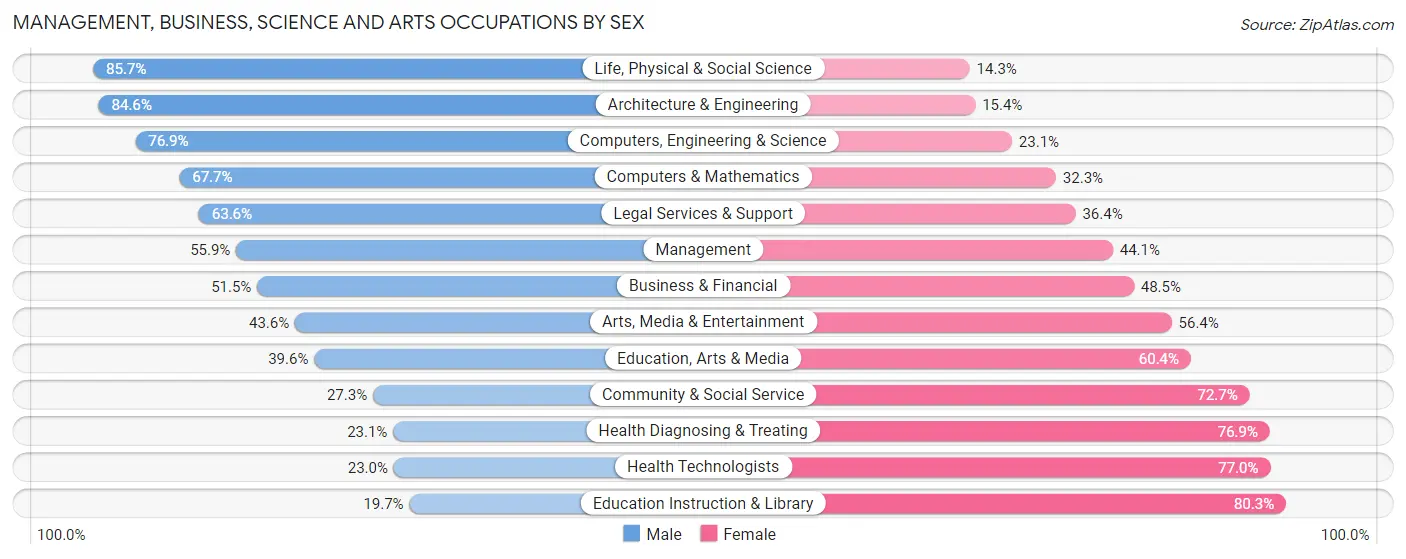
Management, Business, Science and Arts Occupations by Sex
Within the Management, Business, Science and Arts occupations in Arab, the most male-oriented occupations are Life, Physical & Social Science (85.7%), Architecture & Engineering (84.6%), and Computers, Engineering & Science (76.9%), while the most female-oriented occupations are Education Instruction & Library (80.3%), Health Technologists (77.0%), and Health Diagnosing & Treating (76.9%).
| Occupation | Male | Female |
| Management | 248 (55.9%) | 196 (44.1%) |
| Business & Financial | 87 (51.5%) | 82 (48.5%) |
| Computers, Engineering & Science | 213 (76.9%) | 64 (23.1%) |
| Computers & Mathematics | 86 (67.7%) | 41 (32.3%) |
| Architecture & Engineering | 115 (84.6%) | 21 (15.4%) |
| Life, Physical & Social Science | 12 (85.7%) | 2 (14.3%) |
| Community & Social Service | 85 (27.3%) | 226 (72.7%) |
| Education, Arts & Media | 19 (39.6%) | 29 (60.4%) |
| Legal Services & Support | 7 (63.6%) | 4 (36.4%) |
| Education Instruction & Library | 42 (19.7%) | 171 (80.3%) |
| Arts, Media & Entertainment | 17 (43.6%) | 22 (56.4%) |
| Health Diagnosing & Treating | 58 (23.1%) | 193 (76.9%) |
| Health Technologists | 40 (23.0%) | 134 (77.0%) |
| Total (Category) | 691 (47.6%) | 761 (52.4%) |
| Total (Overall) | 2,108 (55.8%) | 1,670 (44.2%) |
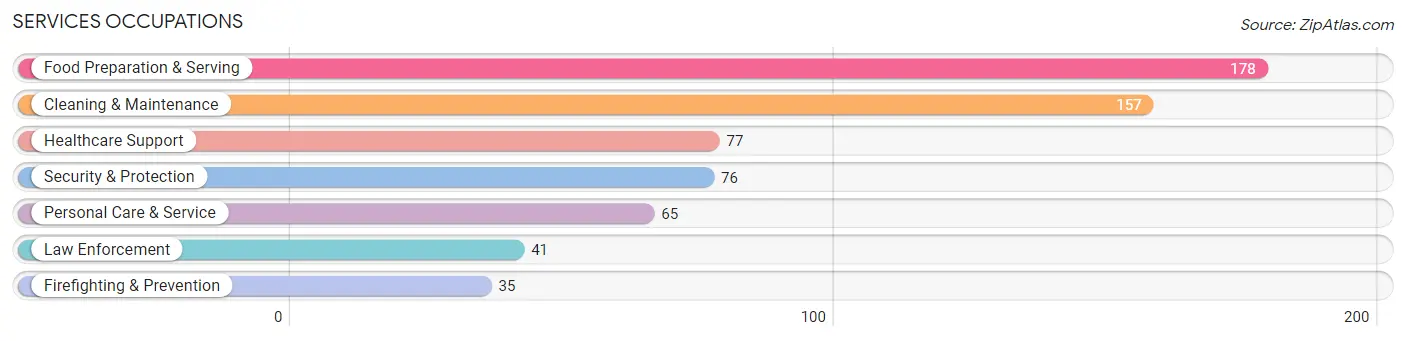
Services Occupations
The most common Services occupations in Arab are Food Preparation & Serving (178 | 4.7%), Cleaning & Maintenance (157 | 4.2%), Healthcare Support (77 | 2.0%), Security & Protection (76 | 2.0%), and Personal Care & Service (65 | 1.7%).
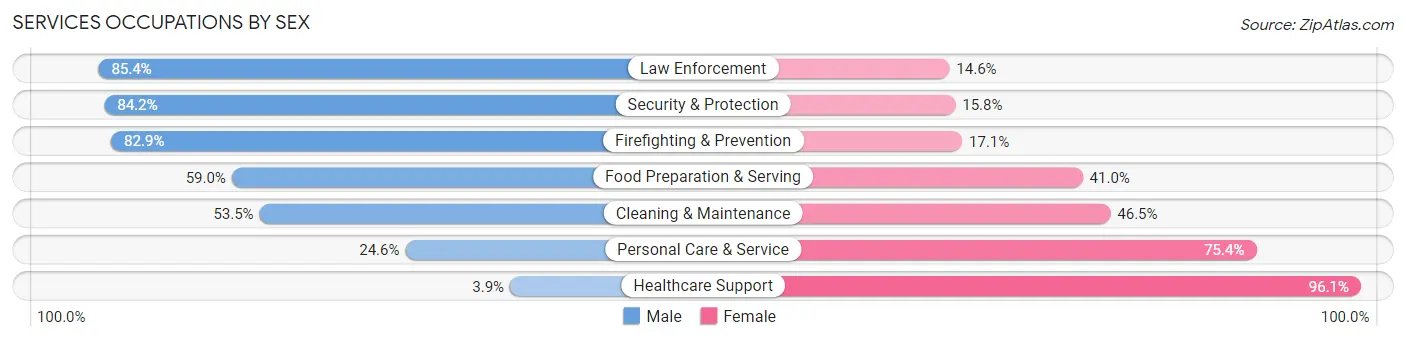
Services Occupations by Sex
Within the Services occupations in Arab, the most male-oriented occupations are Law Enforcement (85.4%), Security & Protection (84.2%), and Firefighting & Prevention (82.9%), while the most female-oriented occupations are Healthcare Support (96.1%), Personal Care & Service (75.4%), and Cleaning & Maintenance (46.5%).
| Occupation | Male | Female |
| Healthcare Support | 3 (3.9%) | 74 (96.1%) |
| Security & Protection | 64 (84.2%) | 12 (15.8%) |
| Firefighting & Prevention | 29 (82.9%) | 6 (17.1%) |
| Law Enforcement | 35 (85.4%) | 6 (14.6%) |
| Food Preparation & Serving | 105 (59.0%) | 73 (41.0%) |
| Cleaning & Maintenance | 84 (53.5%) | 73 (46.5%) |
| Personal Care & Service | 16 (24.6%) | 49 (75.4%) |
| Total (Category) | 272 (49.2%) | 281 (50.8%) |
| Total (Overall) | 2,108 (55.8%) | 1,670 (44.2%) |
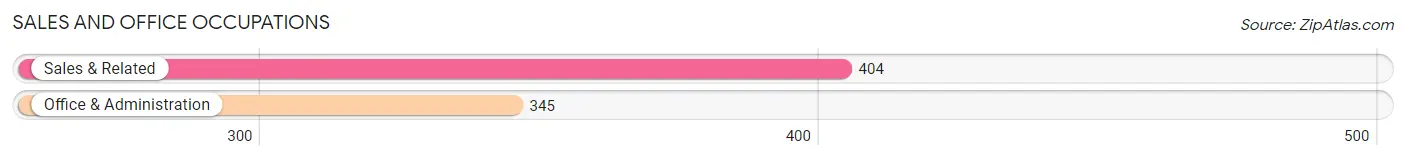
Sales and Office Occupations
The most common Sales and Office occupations in Arab are Sales & Related (404 | 10.7%), and Office & Administration (345 | 9.1%).
Sales and Office Occupations by Sex
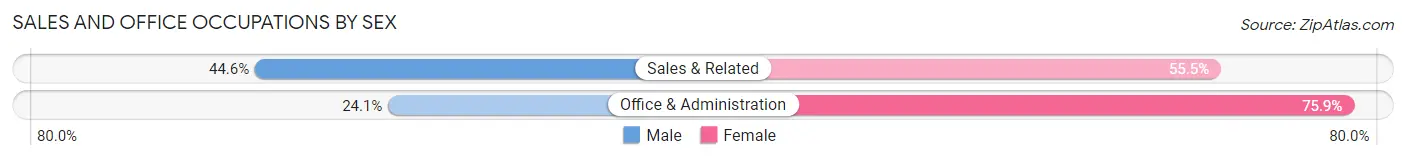
| Occupation | Male | Female |
| Sales & Related | 180 (44.6%) | 224 (55.4%) |
| Office & Administration | 83 (24.1%) | 262 (75.9%) |
| Total (Category) | 263 (35.1%) | 486 (64.9%) |
| Total (Overall) | 2,108 (55.8%) | 1,670 (44.2%) |
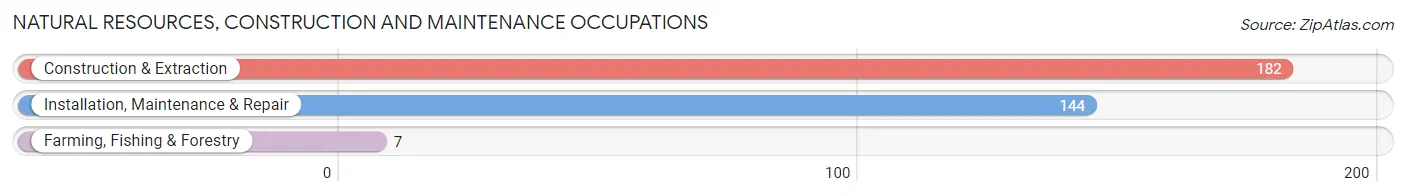
Natural Resources, Construction and Maintenance Occupations
The most common Natural Resources, Construction and Maintenance occupations in Arab are Construction & Extraction (182 | 4.8%), Installation, Maintenance & Repair (144 | 3.8%), and Farming, Fishing & Forestry (7 | 0.2%).
Natural Resources, Construction and Maintenance Occupations by Sex
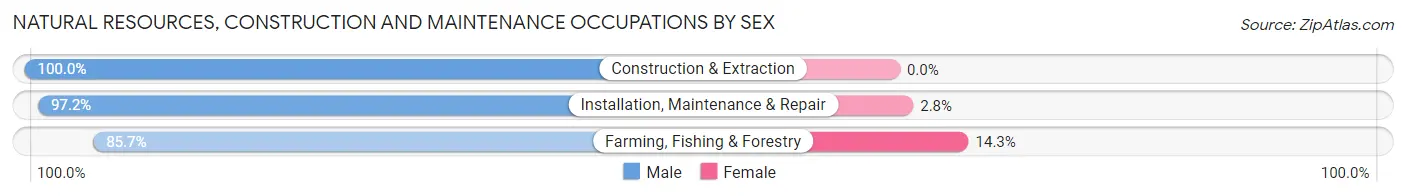
| Occupation | Male | Female |
| Farming, Fishing & Forestry | 6 (85.7%) | 1 (14.3%) |
| Construction & Extraction | 182 (100.0%) | 0 (0.0%) |
| Installation, Maintenance & Repair | 140 (97.2%) | 4 (2.8%) |
| Total (Category) | 328 (98.5%) | 5 (1.5%) |
| Total (Overall) | 2,108 (55.8%) | 1,670 (44.2%) |
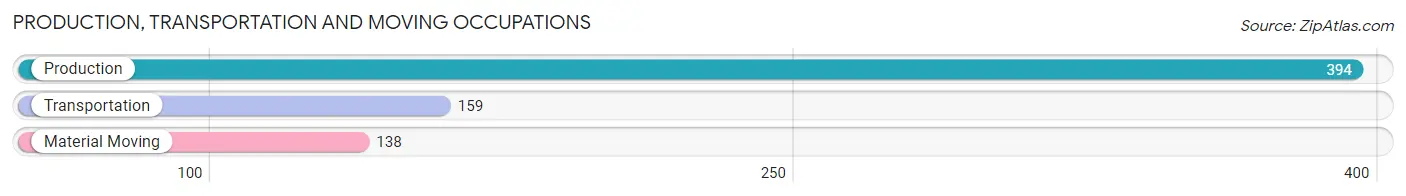
Production, Transportation and Moving Occupations
The most common Production, Transportation and Moving occupations in Arab are Production (394 | 10.4%), Transportation (159 | 4.2%), and Material Moving (138 | 3.6%).
Production, Transportation and Moving Occupations by Sex
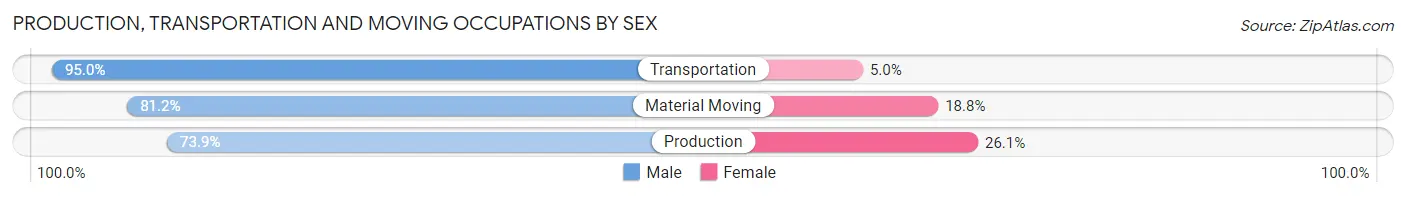
| Occupation | Male | Female |
| Production | 291 (73.9%) | 103 (26.1%) |
| Transportation | 151 (95.0%) | 8 (5.0%) |
| Material Moving | 112 (81.2%) | 26 (18.8%) |
| Total (Category) | 554 (80.2%) | 137 (19.8%) |
| Total (Overall) | 2,108 (55.8%) | 1,670 (44.2%) |
Employment Industries by Sex in Arab
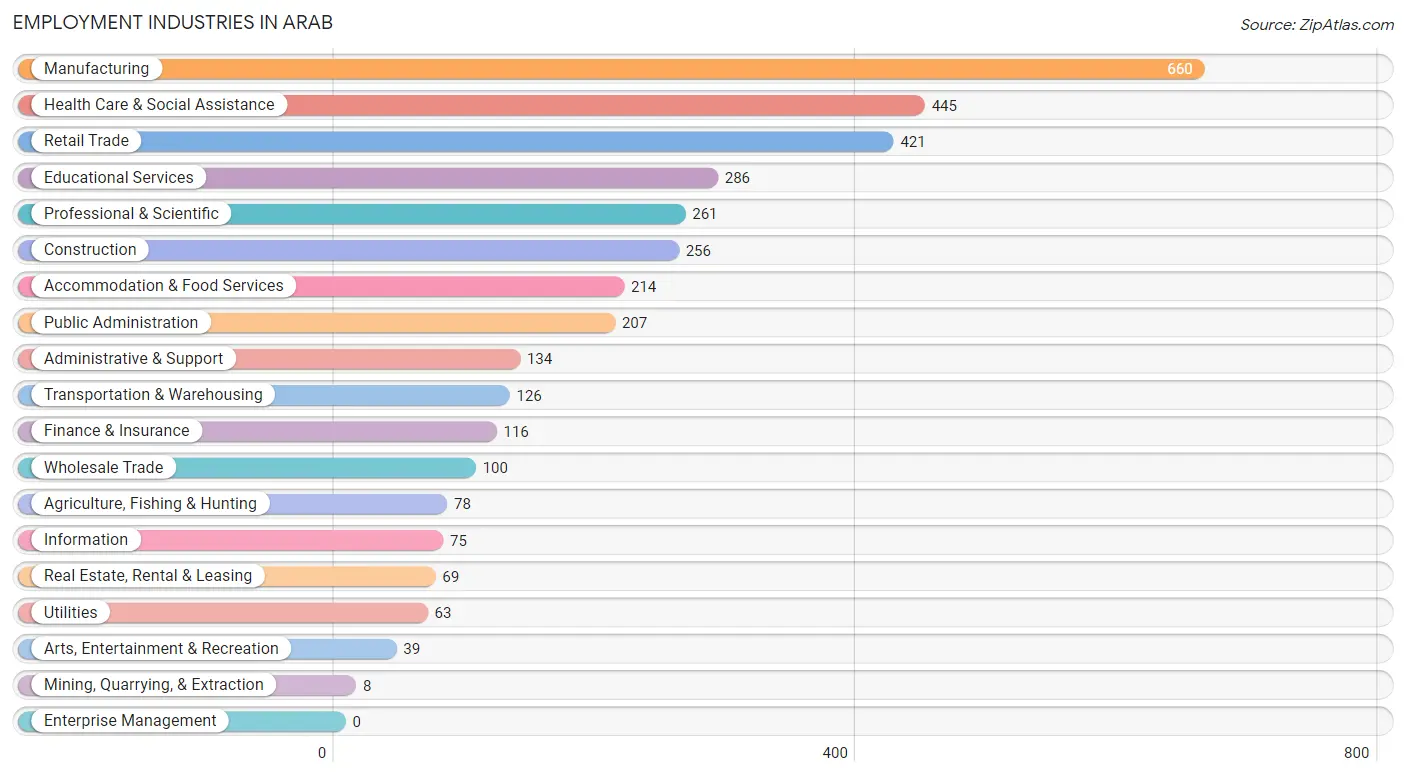
Employment Industries in Arab
The major employment industries in Arab include Manufacturing (660 | 17.5%), Health Care & Social Assistance (445 | 11.8%), Retail Trade (421 | 11.1%), Educational Services (286 | 7.6%), and Professional & Scientific (261 | 6.9%).
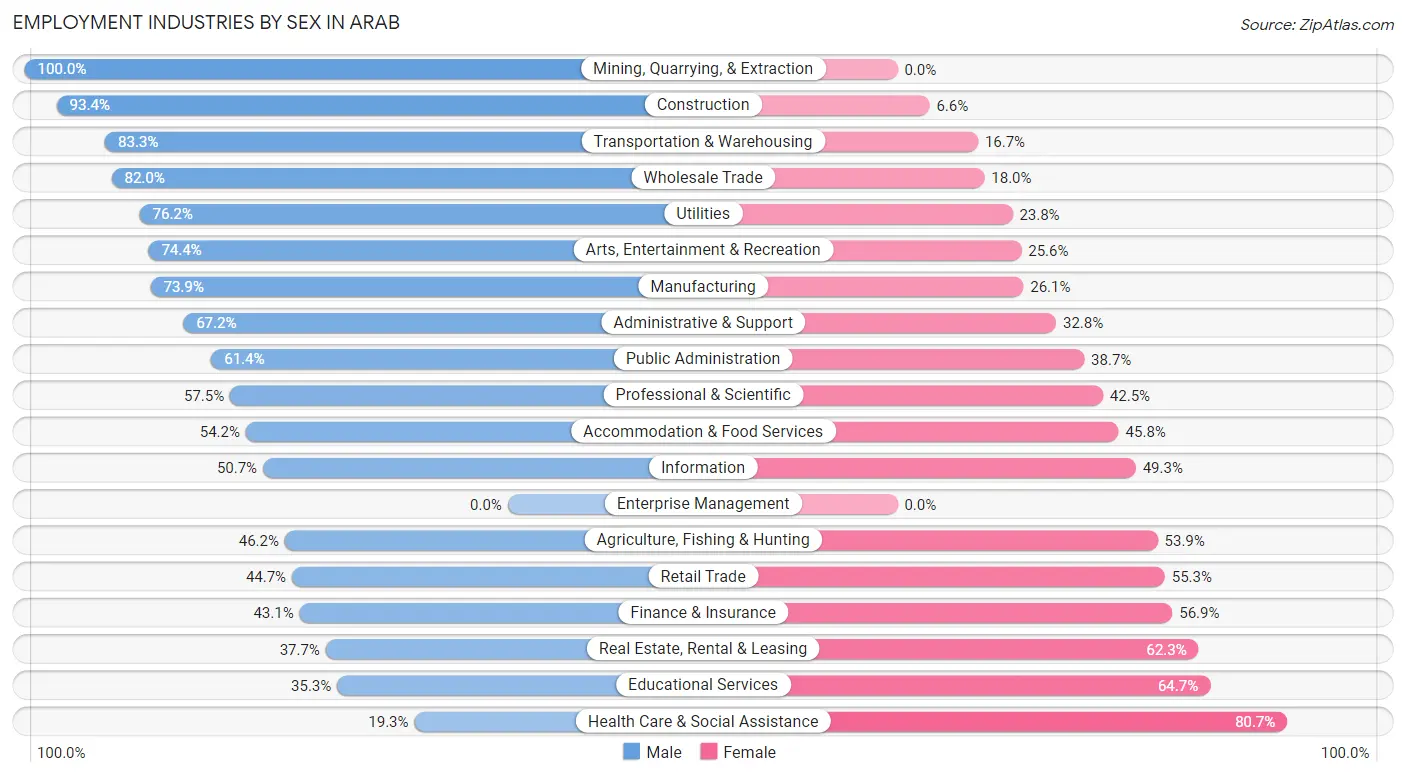
Employment Industries by Sex in Arab
The Arab industries that see more men than women are Mining, Quarrying, & Extraction (100.0%), Construction (93.4%), and Transportation & Warehousing (83.3%), whereas the industries that tend to have a higher number of women are Health Care & Social Assistance (80.7%), Educational Services (64.7%), and Real Estate, Rental & Leasing (62.3%).
| Industry | Male | Female |
| Agriculture, Fishing & Hunting | 36 (46.2%) | 42 (53.8%) |
| Mining, Quarrying, & Extraction | 8 (100.0%) | 0 (0.0%) |
| Construction | 239 (93.4%) | 17 (6.6%) |
| Manufacturing | 488 (73.9%) | 172 (26.1%) |
| Wholesale Trade | 82 (82.0%) | 18 (18.0%) |
| Retail Trade | 188 (44.7%) | 233 (55.3%) |
| Transportation & Warehousing | 105 (83.3%) | 21 (16.7%) |
| Utilities | 48 (76.2%) | 15 (23.8%) |
| Information | 38 (50.7%) | 37 (49.3%) |
| Finance & Insurance | 50 (43.1%) | 66 (56.9%) |
| Real Estate, Rental & Leasing | 26 (37.7%) | 43 (62.3%) |
| Professional & Scientific | 150 (57.5%) | 111 (42.5%) |
| Enterprise Management | 0 (0.0%) | 0 (0.0%) |
| Administrative & Support | 90 (67.2%) | 44 (32.8%) |
| Educational Services | 101 (35.3%) | 185 (64.7%) |
| Health Care & Social Assistance | 86 (19.3%) | 359 (80.7%) |
| Arts, Entertainment & Recreation | 29 (74.4%) | 10 (25.6%) |
| Accommodation & Food Services | 116 (54.2%) | 98 (45.8%) |
| Public Administration | 127 (61.4%) | 80 (38.7%) |
| Total | 2,108 (55.8%) | 1,670 (44.2%) |
Education in Arab
School Enrollment in Arab
The most common levels of schooling among the 2,035 students in Arab are elementary school (511 | 25.1%), high school (507 | 24.9%), and middle school (494 | 24.3%).
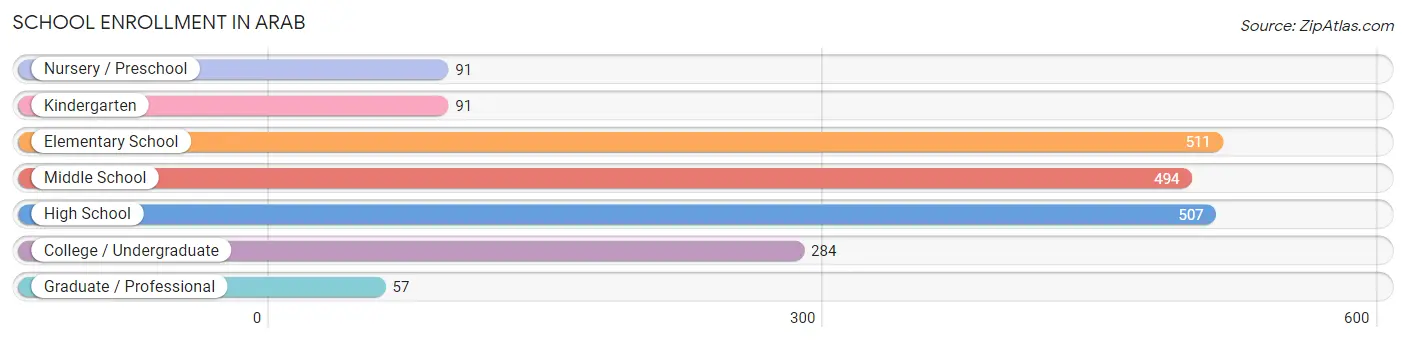
| School Level | # Students | % Students |
| Nursery / Preschool | 91 | 4.5% |
| Kindergarten | 91 | 4.5% |
| Elementary School | 511 | 25.1% |
| Middle School | 494 | 24.3% |
| High School | 507 | 24.9% |
| College / Undergraduate | 284 | 14.0% |
| Graduate / Professional | 57 | 2.8% |
| Total | 2,035 | 100.0% |
School Enrollment by Age by Funding Source in Arab
Out of a total of 2,035 students who are enrolled in schools in Arab, 132 (6.5%) attend a private institution, while the remaining 1,903 (93.5%) are enrolled in public schools. The age group of 3 to 4 year olds has the highest likelihood of being enrolled in private schools, with 11 (16.4% in the age bracket) enrolled. Conversely, the age group of 20 to 24 year olds has the lowest likelihood of being enrolled in a private school, with 118 (95.2% in the age bracket) attending a public institution.
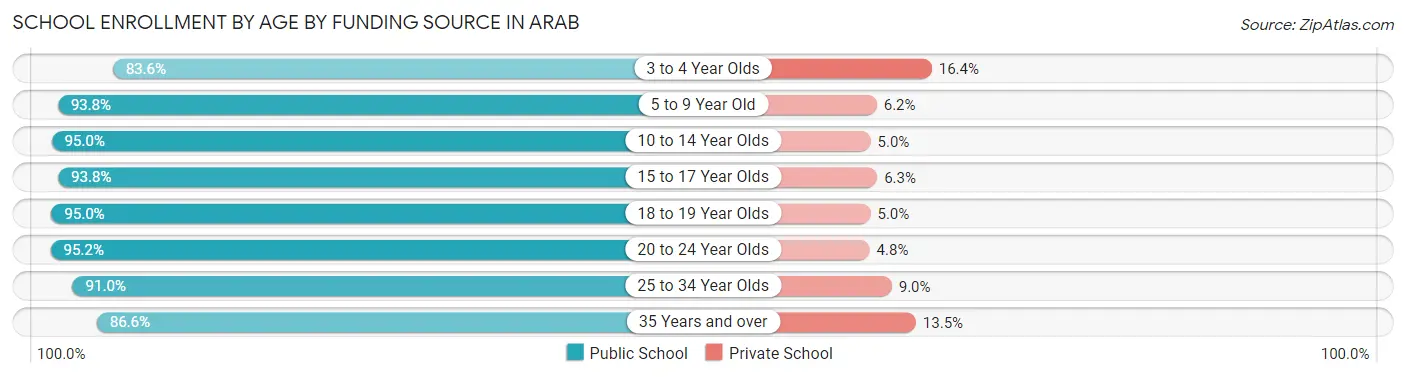
| Age Bracket | Public School | Private School |
| 3 to 4 Year Olds | 56 (83.6%) | 11 (16.4%) |
| 5 to 9 Year Old | 502 (93.8%) | 33 (6.2%) |
| 10 to 14 Year Olds | 607 (95.0%) | 32 (5.0%) |
| 15 to 17 Year Olds | 360 (93.8%) | 24 (6.2%) |
| 18 to 19 Year Olds | 95 (95.0%) | 5 (5.0%) |
| 20 to 24 Year Olds | 118 (95.2%) | 6 (4.8%) |
| 25 to 34 Year Olds | 61 (91.0%) | 6 (9.0%) |
| 35 Years and over | 103 (86.6%) | 16 (13.5%) |
| Total | 1,903 (93.5%) | 132 (6.5%) |
Educational Attainment by Field of Study in Arab
Business (388 | 26.9%), education (270 | 18.7%), science & technology (173 | 12.0%), engineering (122 | 8.4%), and computers & mathematics (109 | 7.5%) are the most common fields of study among 1,445 individuals in Arab who have obtained a bachelor's degree or higher.
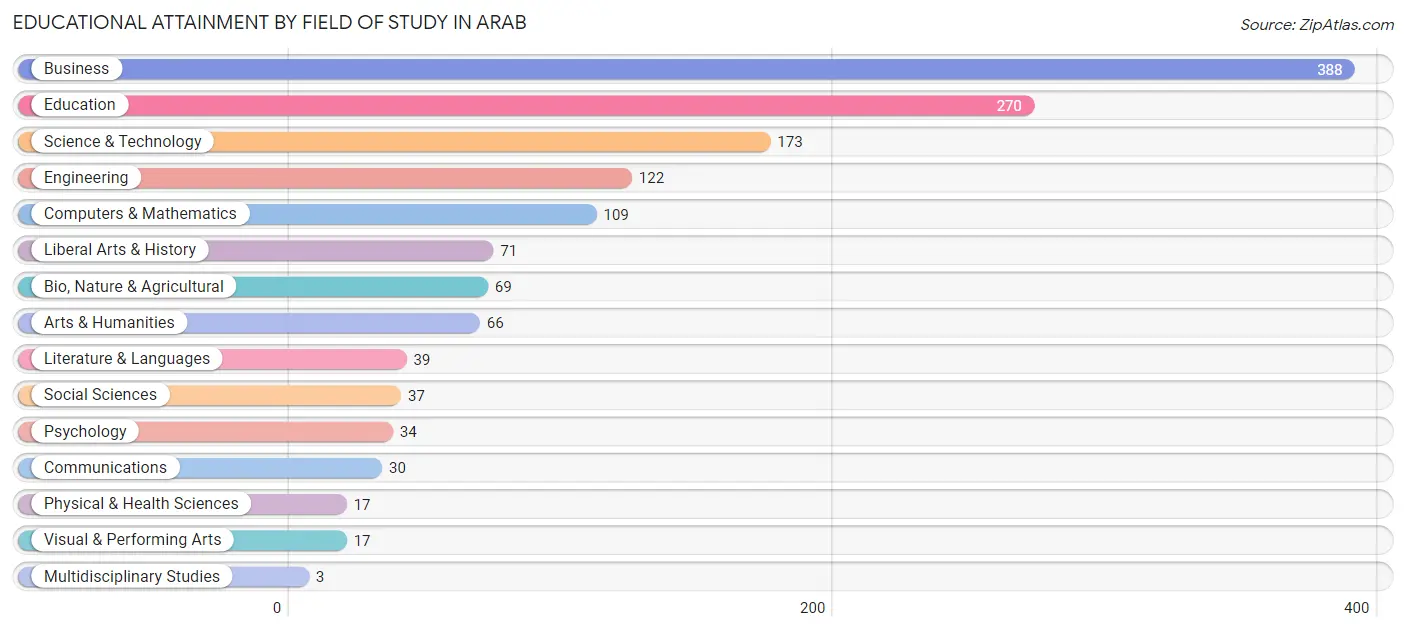
| Field of Study | # Graduates | % Graduates |
| Computers & Mathematics | 109 | 7.5% |
| Bio, Nature & Agricultural | 69 | 4.8% |
| Physical & Health Sciences | 17 | 1.2% |
| Psychology | 34 | 2.4% |
| Social Sciences | 37 | 2.6% |
| Engineering | 122 | 8.4% |
| Multidisciplinary Studies | 3 | 0.2% |
| Science & Technology | 173 | 12.0% |
| Business | 388 | 26.9% |
| Education | 270 | 18.7% |
| Literature & Languages | 39 | 2.7% |
| Liberal Arts & History | 71 | 4.9% |
| Visual & Performing Arts | 17 | 1.2% |
| Communications | 30 | 2.1% |
| Arts & Humanities | 66 | 4.6% |
| Total | 1,445 | 100.0% |
Transportation & Commute in Arab
Vehicle Availability by Sex in Arab
The most prevalent vehicle ownership categories in Arab are males with 2 vehicles (748, accounting for 36.3%) and females with 2 vehicles (540, making up 45.3%).
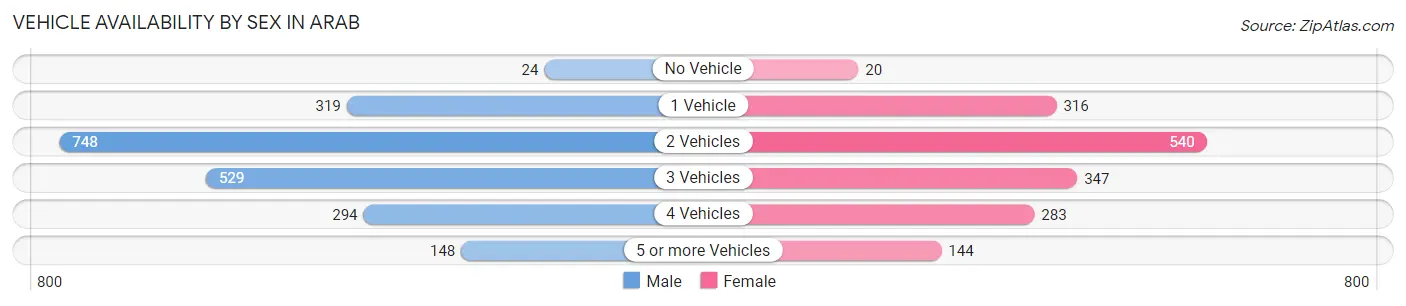
| Vehicles Available | Male | Female |
| No Vehicle | 24 (1.2%) | 20 (1.2%) |
| 1 Vehicle | 319 (15.5%) | 316 (19.2%) |
| 2 Vehicles | 748 (36.3%) | 540 (32.7%) |
| 3 Vehicles | 529 (25.7%) | 347 (21.0%) |
| 4 Vehicles | 294 (14.3%) | 283 (17.2%) |
| 5 or more Vehicles | 148 (7.2%) | 144 (8.7%) |
| Total | 2,062 (100.0%) | 1,650 (100.0%) |
Commute Time in Arab
The most frequently occuring commute durations in Arab are 5 to 9 minutes (659 commuters, 18.9%), 45 to 59 minutes (520 commuters, 14.9%), and 10 to 14 minutes (339 commuters, 9.7%).
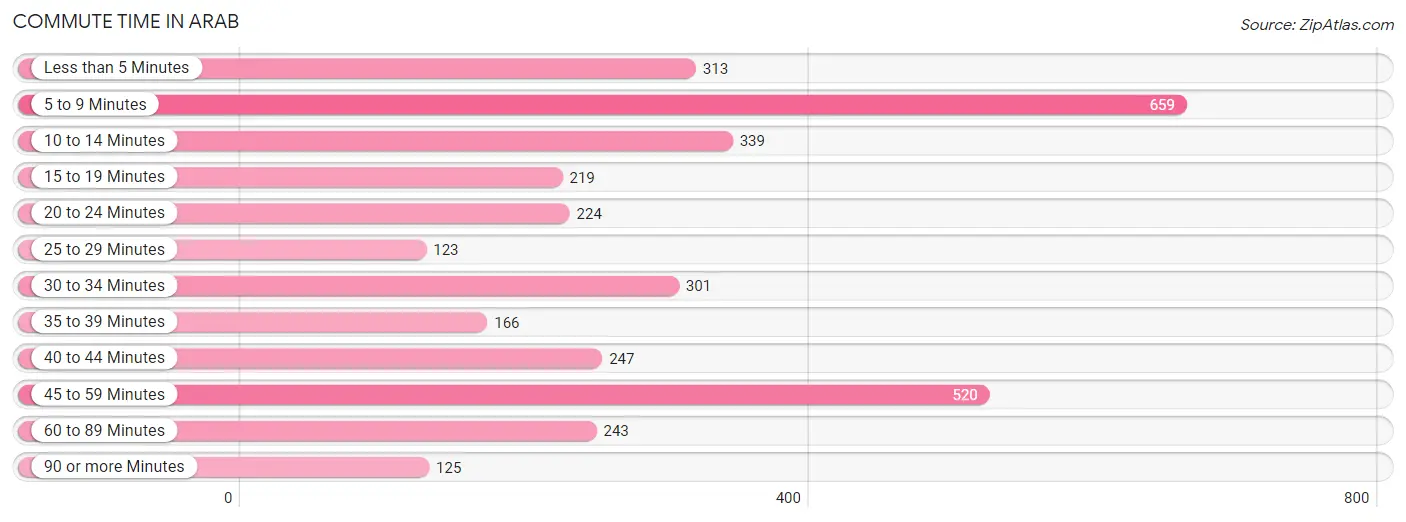
| Commute Time | # Commuters | % Commuters |
| Less than 5 Minutes | 313 | 9.0% |
| 5 to 9 Minutes | 659 | 18.9% |
| 10 to 14 Minutes | 339 | 9.7% |
| 15 to 19 Minutes | 219 | 6.3% |
| 20 to 24 Minutes | 224 | 6.4% |
| 25 to 29 Minutes | 123 | 3.5% |
| 30 to 34 Minutes | 301 | 8.6% |
| 35 to 39 Minutes | 166 | 4.8% |
| 40 to 44 Minutes | 247 | 7.1% |
| 45 to 59 Minutes | 520 | 14.9% |
| 60 to 89 Minutes | 243 | 7.0% |
| 90 or more Minutes | 125 | 3.6% |
Commute Time by Sex in Arab
The most common commute times in Arab are 45 to 59 minutes (328 commuters, 16.7%) for males and 5 to 9 minutes (390 commuters, 25.7%) for females.
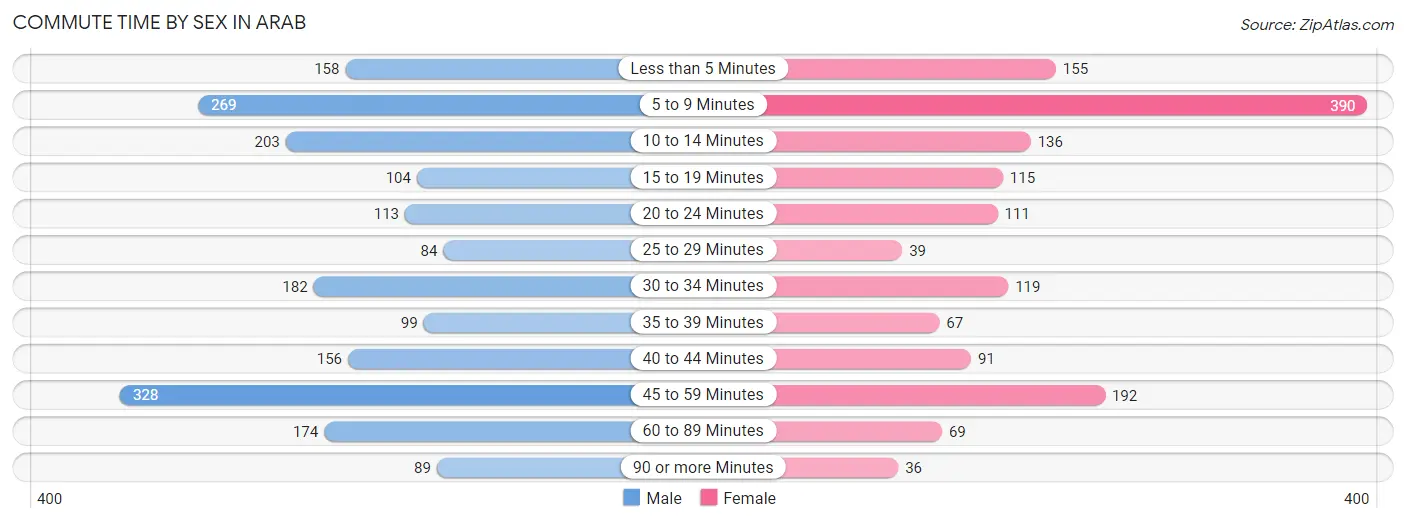
| Commute Time | Male | Female |
| Less than 5 Minutes | 158 (8.1%) | 155 (10.2%) |
| 5 to 9 Minutes | 269 (13.7%) | 390 (25.7%) |
| 10 to 14 Minutes | 203 (10.4%) | 136 (8.9%) |
| 15 to 19 Minutes | 104 (5.3%) | 115 (7.6%) |
| 20 to 24 Minutes | 113 (5.8%) | 111 (7.3%) |
| 25 to 29 Minutes | 84 (4.3%) | 39 (2.6%) |
| 30 to 34 Minutes | 182 (9.3%) | 119 (7.8%) |
| 35 to 39 Minutes | 99 (5.1%) | 67 (4.4%) |
| 40 to 44 Minutes | 156 (8.0%) | 91 (6.0%) |
| 45 to 59 Minutes | 328 (16.7%) | 192 (12.6%) |
| 60 to 89 Minutes | 174 (8.9%) | 69 (4.5%) |
| 90 or more Minutes | 89 (4.5%) | 36 (2.4%) |
Time of Departure to Work by Sex in Arab
The most frequent times of departure to work in Arab are 6:00 AM to 6:29 AM (304, 15.5%) for males and 7:00 AM to 7:29 AM (330, 21.7%) for females.
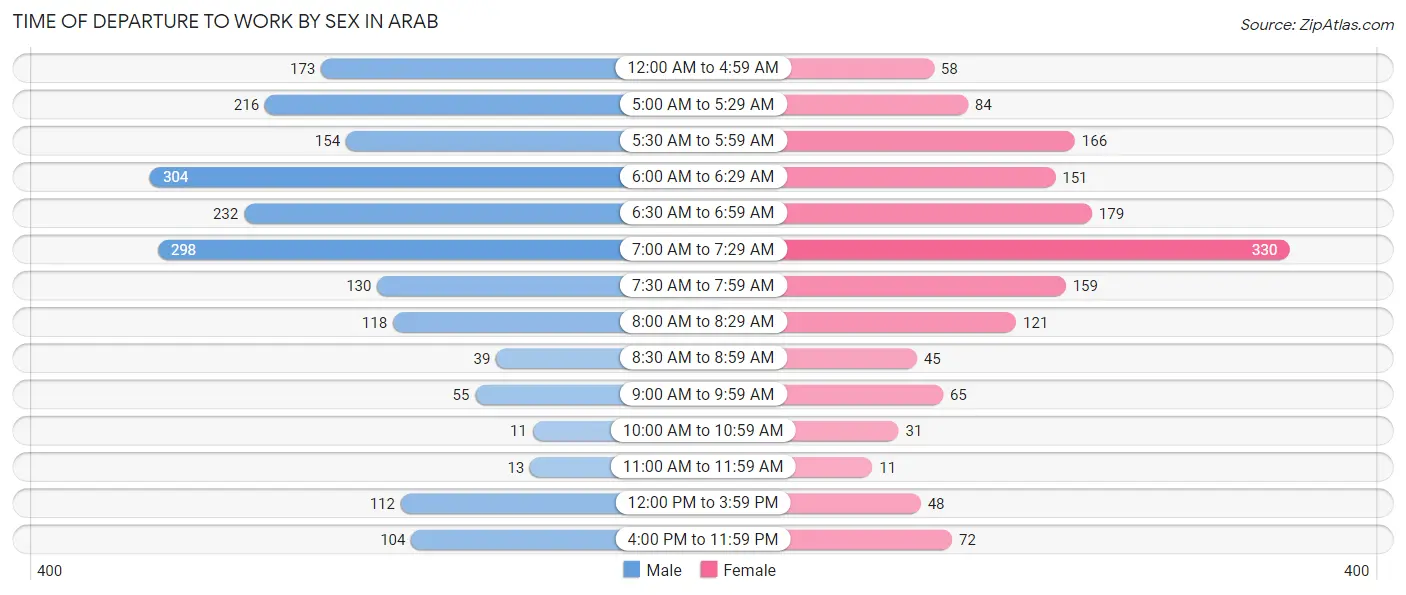
| Time of Departure | Male | Female |
| 12:00 AM to 4:59 AM | 173 (8.8%) | 58 (3.8%) |
| 5:00 AM to 5:29 AM | 216 (11.0%) | 84 (5.5%) |
| 5:30 AM to 5:59 AM | 154 (7.9%) | 166 (10.9%) |
| 6:00 AM to 6:29 AM | 304 (15.5%) | 151 (9.9%) |
| 6:30 AM to 6:59 AM | 232 (11.8%) | 179 (11.8%) |
| 7:00 AM to 7:29 AM | 298 (15.2%) | 330 (21.7%) |
| 7:30 AM to 7:59 AM | 130 (6.6%) | 159 (10.5%) |
| 8:00 AM to 8:29 AM | 118 (6.0%) | 121 (8.0%) |
| 8:30 AM to 8:59 AM | 39 (2.0%) | 45 (3.0%) |
| 9:00 AM to 9:59 AM | 55 (2.8%) | 65 (4.3%) |
| 10:00 AM to 10:59 AM | 11 (0.6%) | 31 (2.0%) |
| 11:00 AM to 11:59 AM | 13 (0.7%) | 11 (0.7%) |
| 12:00 PM to 3:59 PM | 112 (5.7%) | 48 (3.2%) |
| 4:00 PM to 11:59 PM | 104 (5.3%) | 72 (4.7%) |
| Total | 1,959 (100.0%) | 1,520 (100.0%) |
Housing Occupancy in Arab
Occupancy by Ownership in Arab
Of the total 3,336 dwellings in Arab, owner-occupied units account for 2,262 (67.8%), while renter-occupied units make up 1,074 (32.2%).
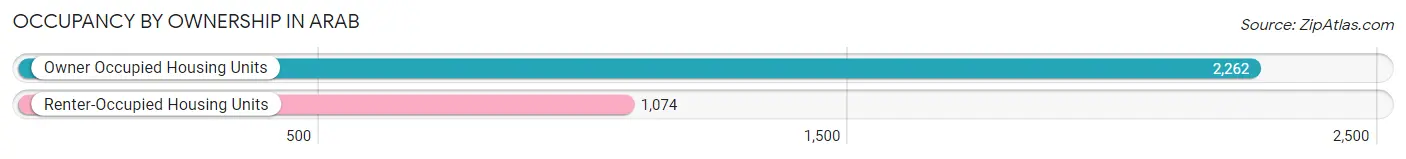
| Occupancy | # Housing Units | % Housing Units |
| Owner Occupied Housing Units | 2,262 | 67.8% |
| Renter-Occupied Housing Units | 1,074 | 32.2% |
| Total Occupied Housing Units | 3,336 | 100.0% |
Occupancy by Household Size in Arab
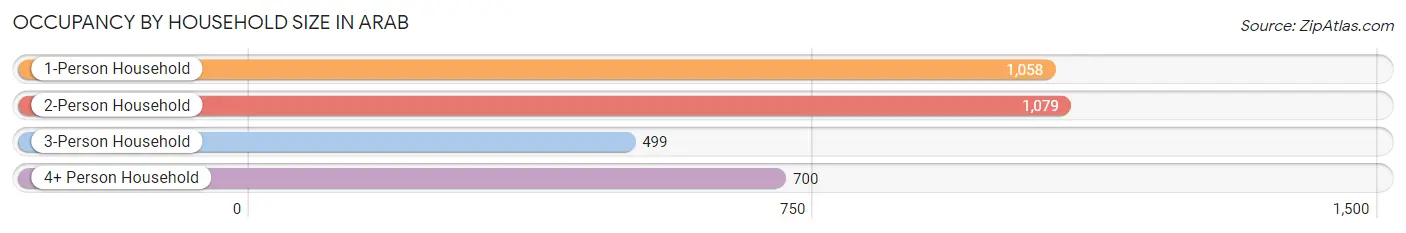
| Household Size | # Housing Units | % Housing Units |
| 1-Person Household | 1,058 | 31.7% |
| 2-Person Household | 1,079 | 32.3% |
| 3-Person Household | 499 | 15.0% |
| 4+ Person Household | 700 | 21.0% |
| Total Housing Units | 3,336 | 100.0% |
Occupancy by Ownership by Household Size in Arab
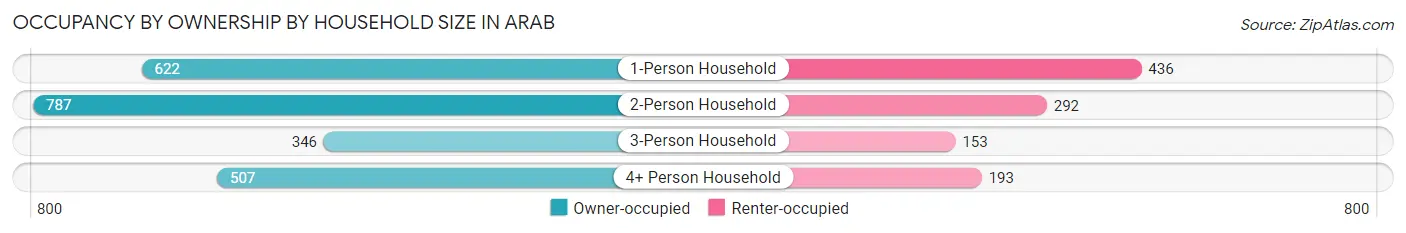
| Household Size | Owner-occupied | Renter-occupied |
| 1-Person Household | 622 (58.8%) | 436 (41.2%) |
| 2-Person Household | 787 (72.9%) | 292 (27.1%) |
| 3-Person Household | 346 (69.3%) | 153 (30.7%) |
| 4+ Person Household | 507 (72.4%) | 193 (27.6%) |
| Total Housing Units | 2,262 (67.8%) | 1,074 (32.2%) |
Occupancy by Educational Attainment in Arab
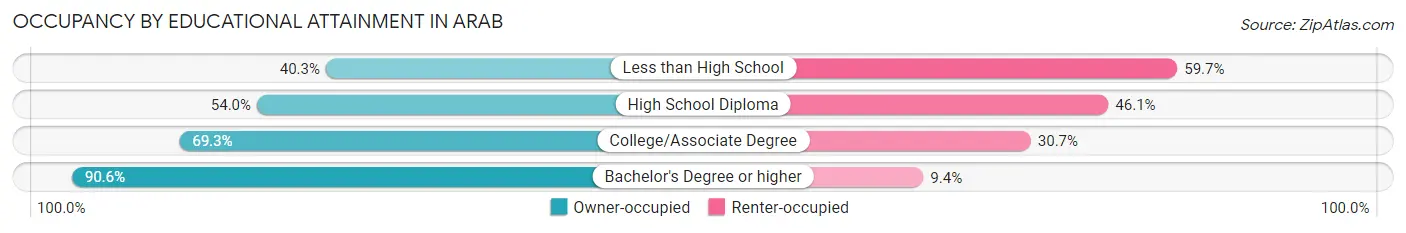
| Household Size | Owner-occupied | Renter-occupied |
| Less than High School | 112 (40.3%) | 166 (59.7%) |
| High School Diploma | 533 (53.9%) | 455 (46.1%) |
| College/Associate Degree | 843 (69.3%) | 373 (30.7%) |
| Bachelor's Degree or higher | 774 (90.6%) | 80 (9.4%) |
Occupancy by Age of Householder in Arab
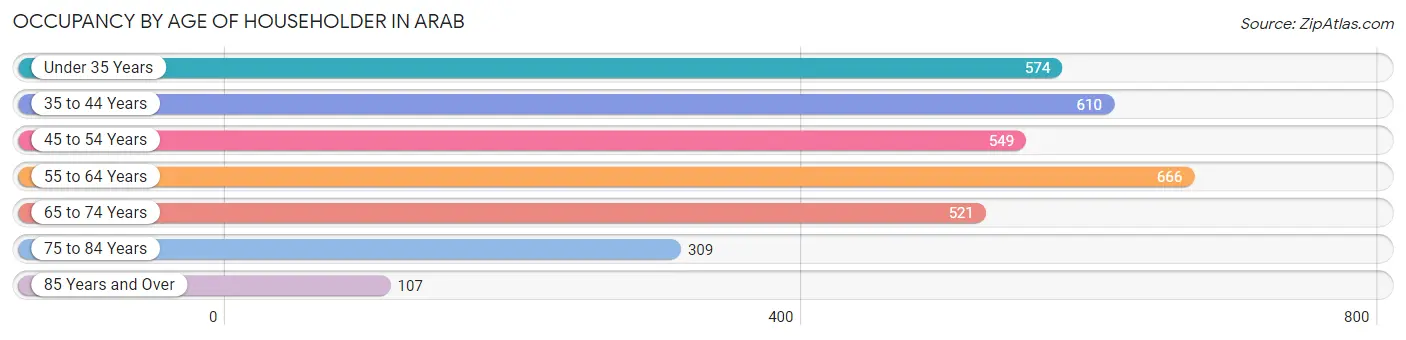
| Age Bracket | # Households | % Households |
| Under 35 Years | 574 | 17.2% |
| 35 to 44 Years | 610 | 18.3% |
| 45 to 54 Years | 549 | 16.5% |
| 55 to 64 Years | 666 | 20.0% |
| 65 to 74 Years | 521 | 15.6% |
| 75 to 84 Years | 309 | 9.3% |
| 85 Years and Over | 107 | 3.2% |
| Total | 3,336 | 100.0% |
Housing Finances in Arab
Median Income by Occupancy in Arab
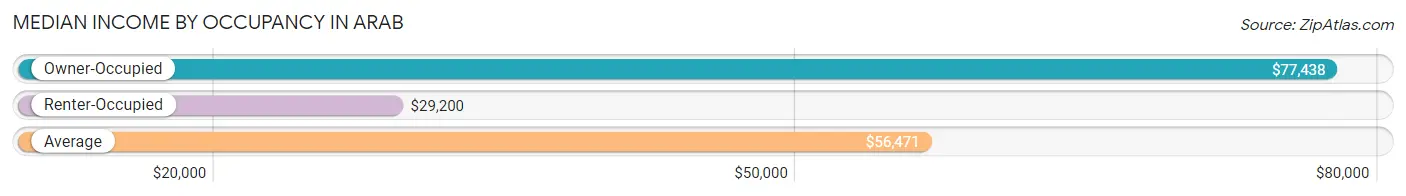
| Occupancy Type | # Households | Median Income |
| Owner-Occupied | 2,262 (67.8%) | $77,438 |
| Renter-Occupied | 1,074 (32.2%) | $29,200 |
| Average | 3,336 (100.0%) | $56,471 |
Occupancy by Householder Income Bracket in Arab
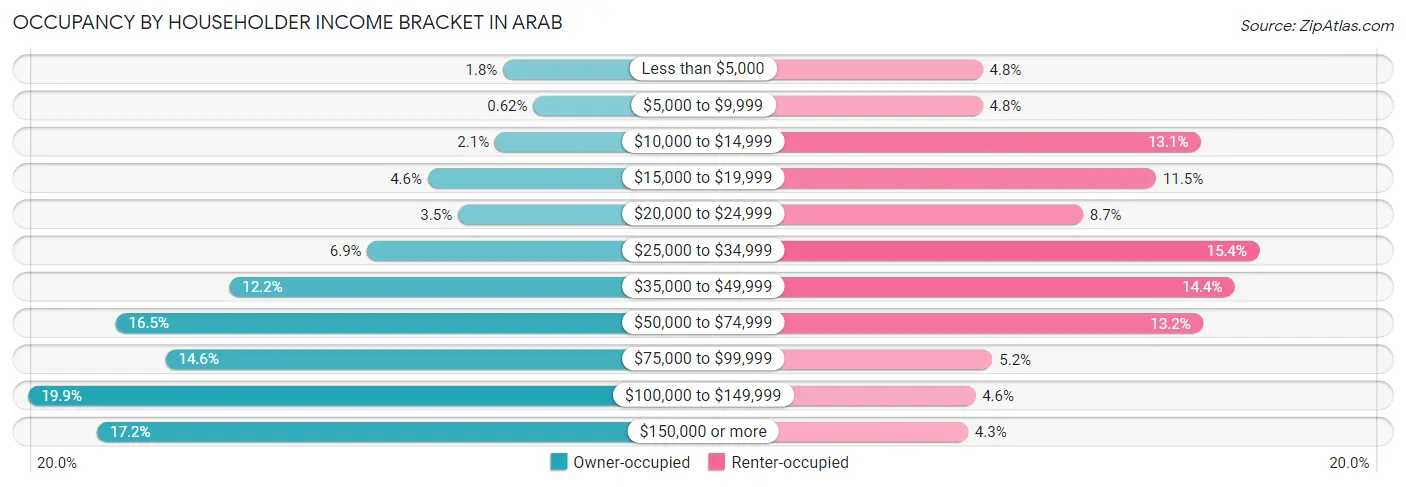
| Income Bracket | Owner-occupied | Renter-occupied |
| Less than $5,000 | 40 (1.8%) | 52 (4.8%) |
| $5,000 to $9,999 | 14 (0.6%) | 52 (4.8%) |
| $10,000 to $14,999 | 47 (2.1%) | 141 (13.1%) |
| $15,000 to $19,999 | 105 (4.6%) | 123 (11.5%) |
| $20,000 to $24,999 | 79 (3.5%) | 93 (8.7%) |
| $25,000 to $34,999 | 157 (6.9%) | 165 (15.4%) |
| $35,000 to $49,999 | 276 (12.2%) | 155 (14.4%) |
| $50,000 to $74,999 | 374 (16.5%) | 142 (13.2%) |
| $75,000 to $99,999 | 331 (14.6%) | 56 (5.2%) |
| $100,000 to $149,999 | 449 (19.9%) | 49 (4.6%) |
| $150,000 or more | 390 (17.2%) | 46 (4.3%) |
| Total | 2,262 (100.0%) | 1,074 (100.0%) |
Monthly Housing Cost Tiers in Arab
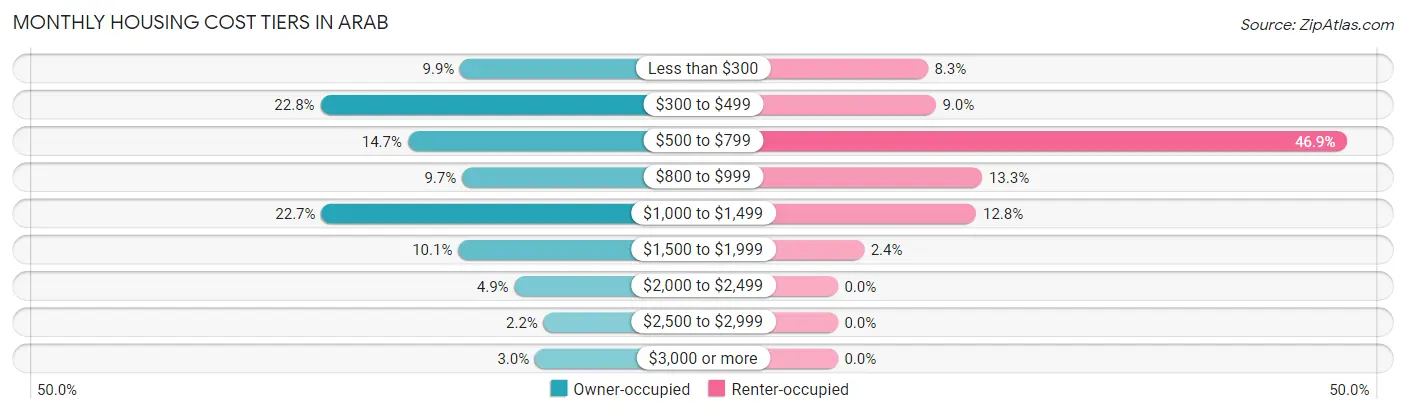
| Monthly Cost | Owner-occupied | Renter-occupied |
| Less than $300 | 224 (9.9%) | 89 (8.3%) |
| $300 to $499 | 515 (22.8%) | 97 (9.0%) |
| $500 to $799 | 333 (14.7%) | 504 (46.9%) |
| $800 to $999 | 220 (9.7%) | 143 (13.3%) |
| $1,000 to $1,499 | 513 (22.7%) | 137 (12.8%) |
| $1,500 to $1,999 | 228 (10.1%) | 26 (2.4%) |
| $2,000 to $2,499 | 111 (4.9%) | 0 (0.0%) |
| $2,500 to $2,999 | 50 (2.2%) | 0 (0.0%) |
| $3,000 or more | 68 (3.0%) | 0 (0.0%) |
| Total | 2,262 (100.0%) | 1,074 (100.0%) |
Physical Housing Characteristics in Arab
Housing Structures in Arab
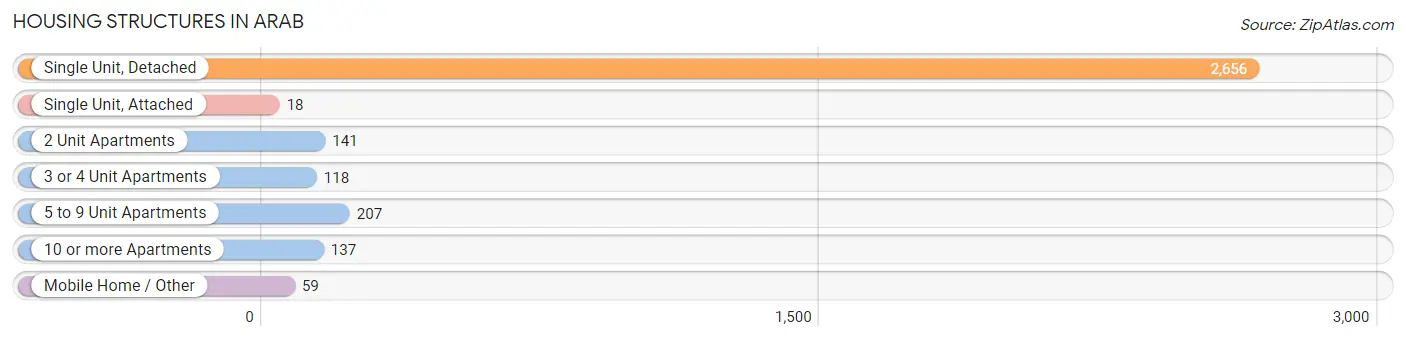
| Structure Type | # Housing Units | % Housing Units |
| Single Unit, Detached | 2,656 | 79.6% |
| Single Unit, Attached | 18 | 0.5% |
| 2 Unit Apartments | 141 | 4.2% |
| 3 or 4 Unit Apartments | 118 | 3.5% |
| 5 to 9 Unit Apartments | 207 | 6.2% |
| 10 or more Apartments | 137 | 4.1% |
| Mobile Home / Other | 59 | 1.8% |
| Total | 3,336 | 100.0% |
Housing Structures by Occupancy in Arab
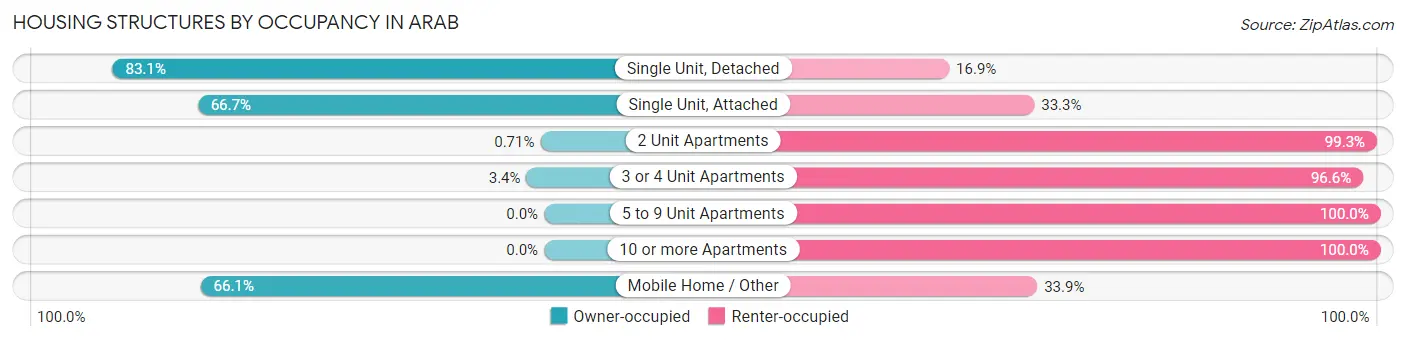
| Structure Type | Owner-occupied | Renter-occupied |
| Single Unit, Detached | 2,206 (83.1%) | 450 (16.9%) |
| Single Unit, Attached | 12 (66.7%) | 6 (33.3%) |
| 2 Unit Apartments | 1 (0.7%) | 140 (99.3%) |
| 3 or 4 Unit Apartments | 4 (3.4%) | 114 (96.6%) |
| 5 to 9 Unit Apartments | 0 (0.0%) | 207 (100.0%) |
| 10 or more Apartments | 0 (0.0%) | 137 (100.0%) |
| Mobile Home / Other | 39 (66.1%) | 20 (33.9%) |
| Total | 2,262 (67.8%) | 1,074 (32.2%) |
Housing Structures by Number of Rooms in Arab
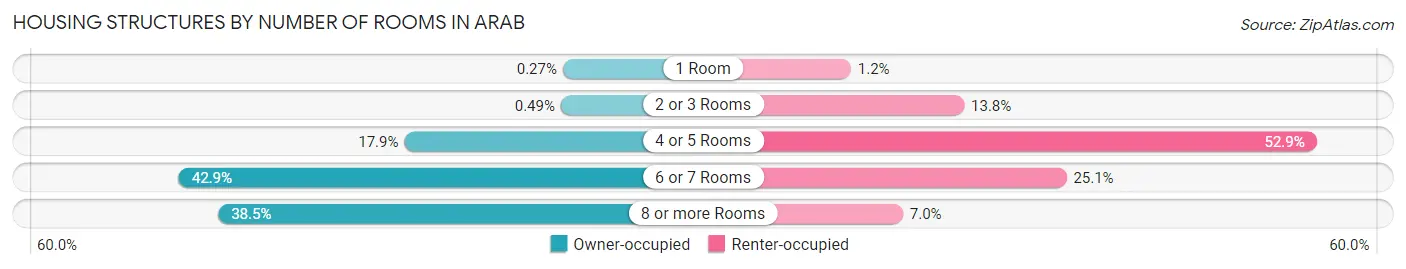
| Number of Rooms | Owner-occupied | Renter-occupied |
| 1 Room | 6 (0.3%) | 13 (1.2%) |
| 2 or 3 Rooms | 11 (0.5%) | 148 (13.8%) |
| 4 or 5 Rooms | 404 (17.9%) | 568 (52.9%) |
| 6 or 7 Rooms | 970 (42.9%) | 270 (25.1%) |
| 8 or more Rooms | 871 (38.5%) | 75 (7.0%) |
| Total | 2,262 (100.0%) | 1,074 (100.0%) |
Housing Structure by Heating Type in Arab
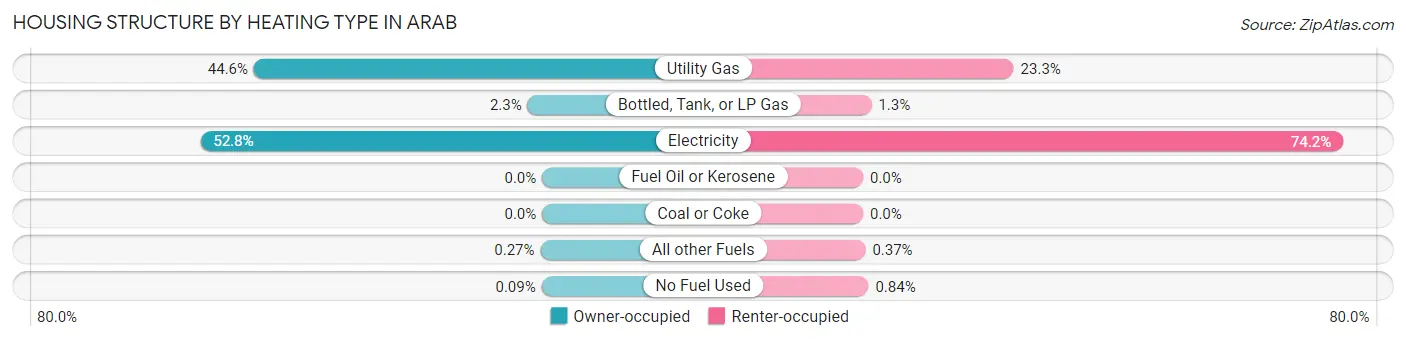
| Heating Type | Owner-occupied | Renter-occupied |
| Utility Gas | 1,008 (44.6%) | 250 (23.3%) |
| Bottled, Tank, or LP Gas | 51 (2.2%) | 14 (1.3%) |
| Electricity | 1,195 (52.8%) | 797 (74.2%) |
| Fuel Oil or Kerosene | 0 (0.0%) | 0 (0.0%) |
| Coal or Coke | 0 (0.0%) | 0 (0.0%) |
| All other Fuels | 6 (0.3%) | 4 (0.4%) |
| No Fuel Used | 2 (0.1%) | 9 (0.8%) |
| Total | 2,262 (100.0%) | 1,074 (100.0%) |
Household Vehicle Usage in Arab
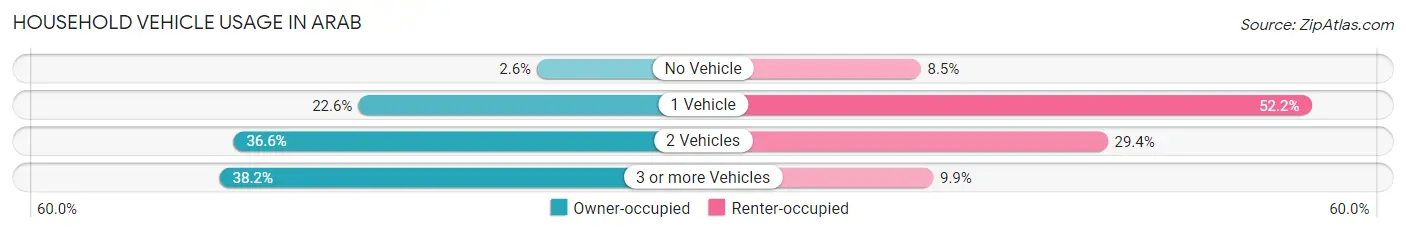
| Vehicles per Household | Owner-occupied | Renter-occupied |
| No Vehicle | 59 (2.6%) | 91 (8.5%) |
| 1 Vehicle | 512 (22.6%) | 561 (52.2%) |
| 2 Vehicles | 828 (36.6%) | 316 (29.4%) |
| 3 or more Vehicles | 863 (38.2%) | 106 (9.9%) |
| Total | 2,262 (100.0%) | 1,074 (100.0%) |
Real Estate & Mortgages in Arab
Real Estate and Mortgage Overview in Arab
| Characteristic | Without Mortgage | With Mortgage |
| Housing Units | 958 | 1,304 |
| Median Property Value | $181,400 | $185,700 |
| Median Household Income | $53,667 | $295 |
| Monthly Housing Costs | $400 | $68 |
| Real Estate Taxes | $692 | $108 |
Property Value by Mortgage Status in Arab
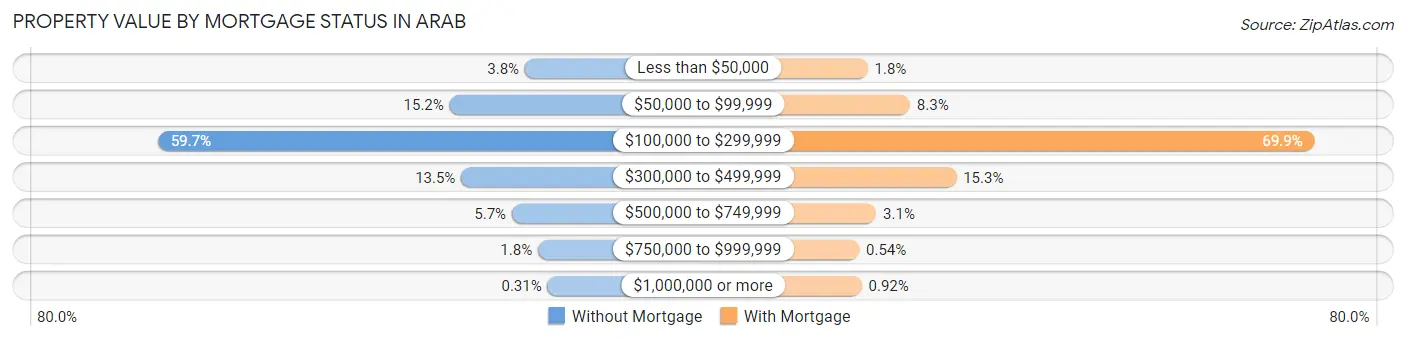
| Property Value | Without Mortgage | With Mortgage |
| Less than $50,000 | 36 (3.8%) | 24 (1.8%) |
| $50,000 to $99,999 | 146 (15.2%) | 108 (8.3%) |
| $100,000 to $299,999 | 572 (59.7%) | 912 (69.9%) |
| $300,000 to $499,999 | 129 (13.5%) | 200 (15.3%) |
| $500,000 to $749,999 | 55 (5.7%) | 41 (3.1%) |
| $750,000 to $999,999 | 17 (1.8%) | 7 (0.5%) |
| $1,000,000 or more | 3 (0.3%) | 12 (0.9%) |
| Total | 958 (100.0%) | 1,304 (100.0%) |
Household Income by Mortgage Status in Arab
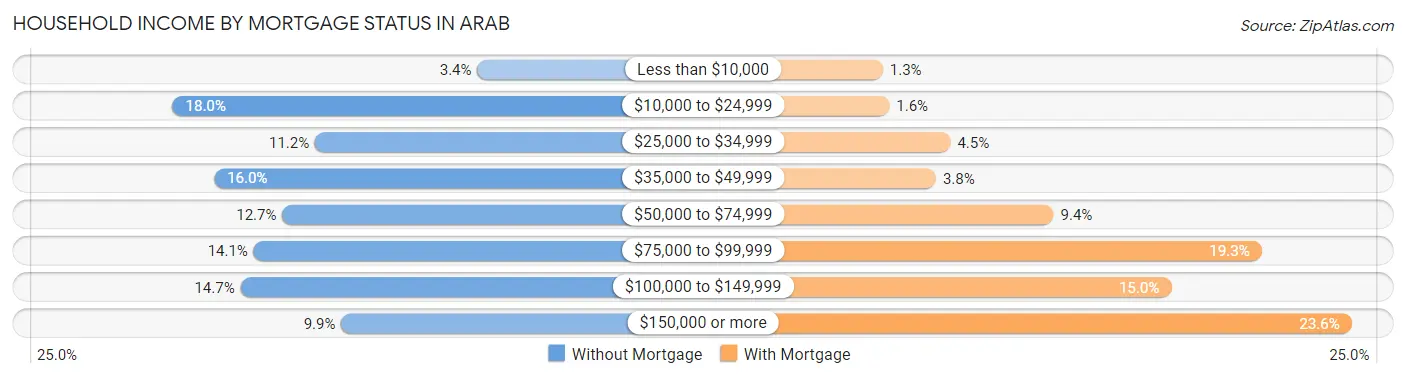
| Household Income | Without Mortgage | With Mortgage |
| Less than $10,000 | 33 (3.4%) | 17 (1.3%) |
| $10,000 to $24,999 | 172 (17.9%) | 21 (1.6%) |
| $25,000 to $34,999 | 107 (11.2%) | 59 (4.5%) |
| $35,000 to $49,999 | 153 (16.0%) | 50 (3.8%) |
| $50,000 to $74,999 | 122 (12.7%) | 123 (9.4%) |
| $75,000 to $99,999 | 135 (14.1%) | 252 (19.3%) |
| $100,000 to $149,999 | 141 (14.7%) | 196 (15.0%) |
| $150,000 or more | 95 (9.9%) | 308 (23.6%) |
| Total | 958 (100.0%) | 1,304 (100.0%) |
Property Value to Household Income Ratio in Arab
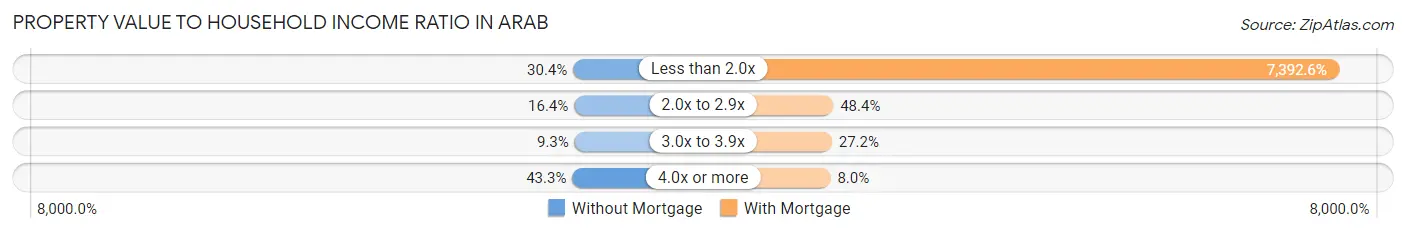
| Value-to-Income Ratio | Without Mortgage | With Mortgage |
| Less than 2.0x | 291 (30.4%) | 96,400 (7,392.6%) |
| 2.0x to 2.9x | 157 (16.4%) | 631 (48.4%) |
| 3.0x to 3.9x | 89 (9.3%) | 354 (27.2%) |
| 4.0x or more | 415 (43.3%) | 104 (8.0%) |
| Total | 958 (100.0%) | 1,304 (100.0%) |
Real Estate Taxes by Mortgage Status in Arab
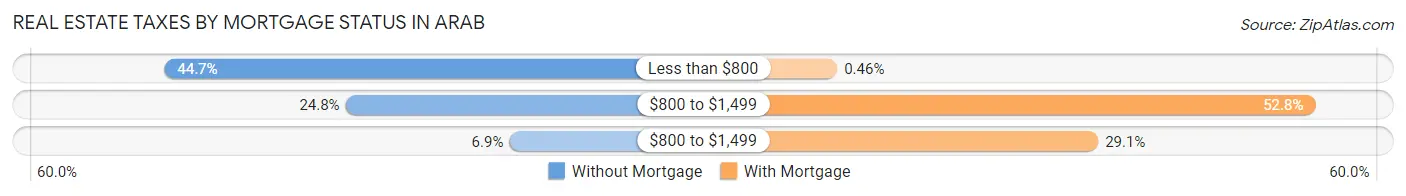
| Property Taxes | Without Mortgage | With Mortgage |
| Less than $800 | 428 (44.7%) | 6 (0.5%) |
| $800 to $1,499 | 238 (24.8%) | 689 (52.8%) |
| $800 to $1,499 | 66 (6.9%) | 379 (29.1%) |
| Total | 958 (100.0%) | 1,304 (100.0%) |
Health & Disability in Arab
Health Insurance Coverage by Age in Arab
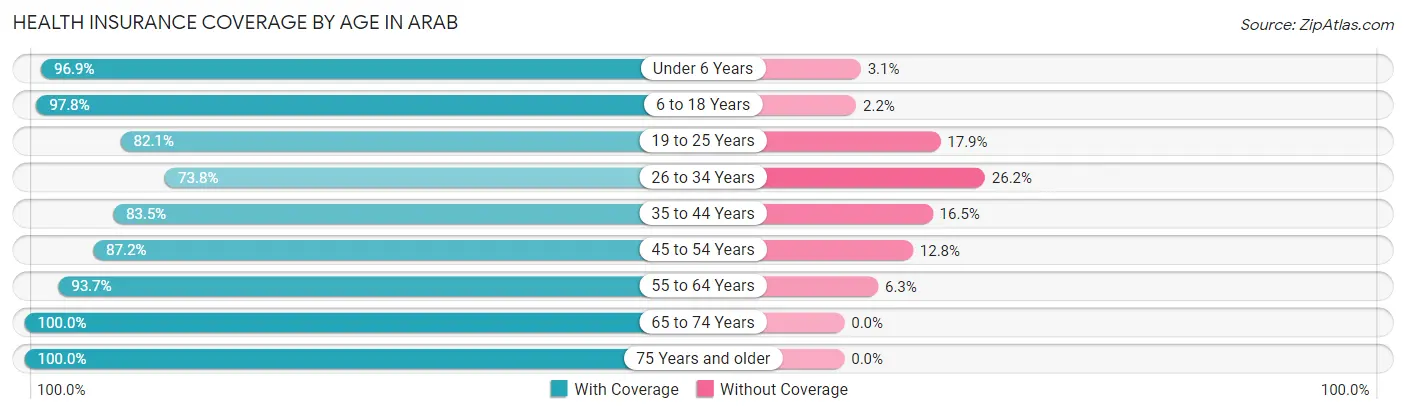
| Age Bracket | With Coverage | Without Coverage |
| Under 6 Years | 664 (96.9%) | 21 (3.1%) |
| 6 to 18 Years | 1,601 (97.8%) | 36 (2.2%) |
| 19 to 25 Years | 518 (82.1%) | 113 (17.9%) |
| 26 to 34 Years | 653 (73.8%) | 232 (26.2%) |
| 35 to 44 Years | 907 (83.5%) | 179 (16.5%) |
| 45 to 54 Years | 927 (87.2%) | 136 (12.8%) |
| 55 to 64 Years | 1,042 (93.7%) | 70 (6.3%) |
| 65 to 74 Years | 773 (100.0%) | 0 (0.0%) |
| 75 Years and older | 573 (100.0%) | 0 (0.0%) |
| Total | 7,658 (90.7%) | 787 (9.3%) |
Health Insurance Coverage by Citizenship Status in Arab
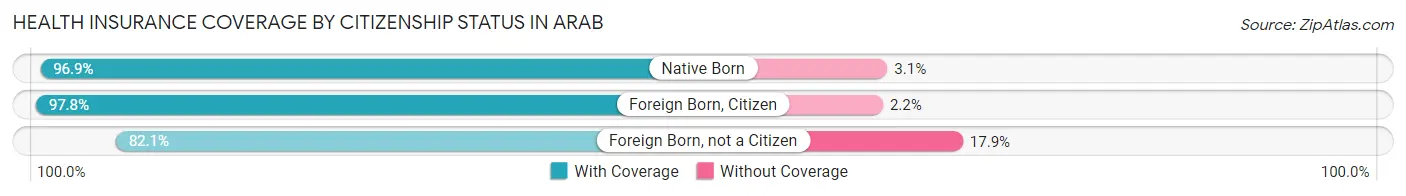
| Citizenship Status | With Coverage | Without Coverage |
| Native Born | 664 (96.9%) | 21 (3.1%) |
| Foreign Born, Citizen | 1,601 (97.8%) | 36 (2.2%) |
| Foreign Born, not a Citizen | 518 (82.1%) | 113 (17.9%) |
Health Insurance Coverage by Household Income in Arab
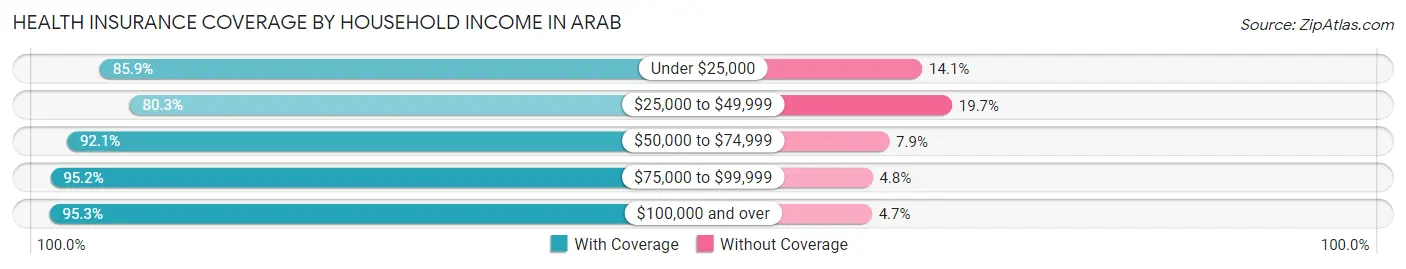
| Household Income | With Coverage | Without Coverage |
| Under $25,000 | 1,095 (85.9%) | 180 (14.1%) |
| $25,000 to $49,999 | 1,207 (80.3%) | 296 (19.7%) |
| $50,000 to $74,999 | 1,263 (92.1%) | 109 (7.9%) |
| $75,000 to $99,999 | 1,050 (95.2%) | 53 (4.8%) |
| $100,000 and over | 3,042 (95.3%) | 149 (4.7%) |
Public vs Private Health Insurance Coverage by Age in Arab
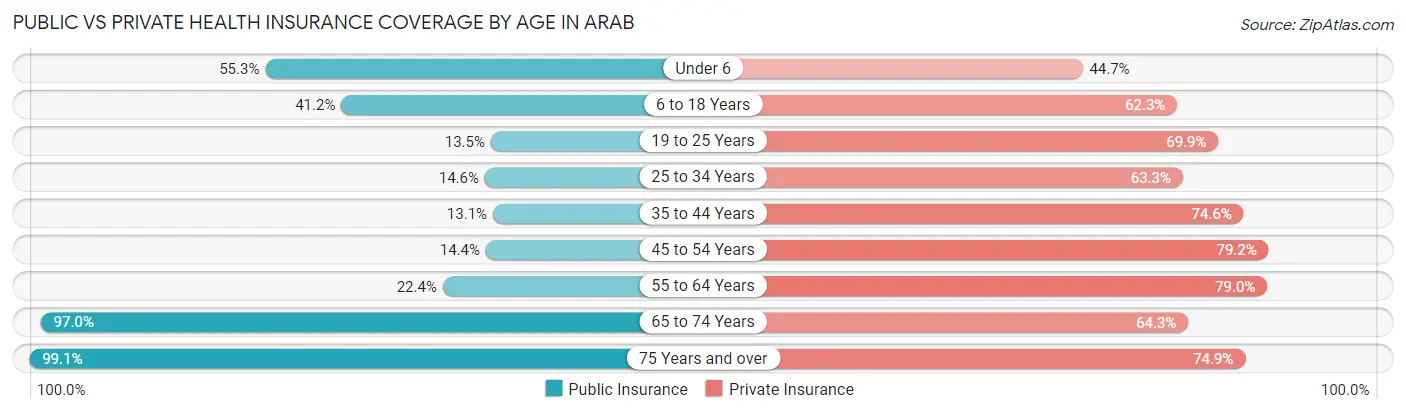
| Age Bracket | Public Insurance | Private Insurance |
| Under 6 | 379 (55.3%) | 306 (44.7%) |
| 6 to 18 Years | 675 (41.2%) | 1,019 (62.3%) |
| 19 to 25 Years | 85 (13.5%) | 441 (69.9%) |
| 25 to 34 Years | 129 (14.6%) | 560 (63.3%) |
| 35 to 44 Years | 142 (13.1%) | 810 (74.6%) |
| 45 to 54 Years | 153 (14.4%) | 842 (79.2%) |
| 55 to 64 Years | 249 (22.4%) | 878 (79.0%) |
| 65 to 74 Years | 750 (97.0%) | 497 (64.3%) |
| 75 Years and over | 568 (99.1%) | 429 (74.9%) |
| Total | 3,130 (37.1%) | 5,782 (68.5%) |
Disability Status by Sex by Age in Arab
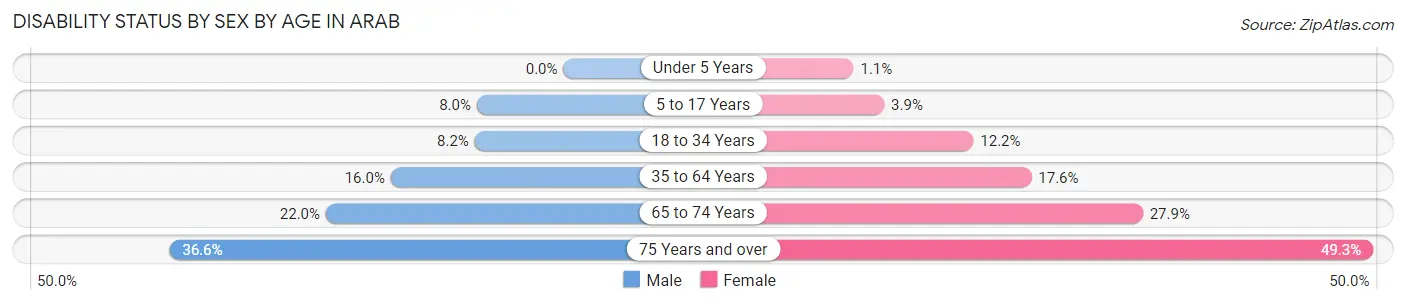
| Age Bracket | Male | Female |
| Under 5 Years | 0 (0.0%) | 2 (1.1%) |
| 5 to 17 Years | 76 (8.0%) | 28 (3.9%) |
| 18 to 34 Years | 69 (8.2%) | 96 (12.2%) |
| 35 to 64 Years | 252 (16.0%) | 297 (17.6%) |
| 65 to 74 Years | 82 (22.0%) | 112 (27.9%) |
| 75 Years and over | 79 (36.6%) | 176 (49.3%) |
Disability Class by Sex by Age in Arab
Disability Class: Hearing Difficulty
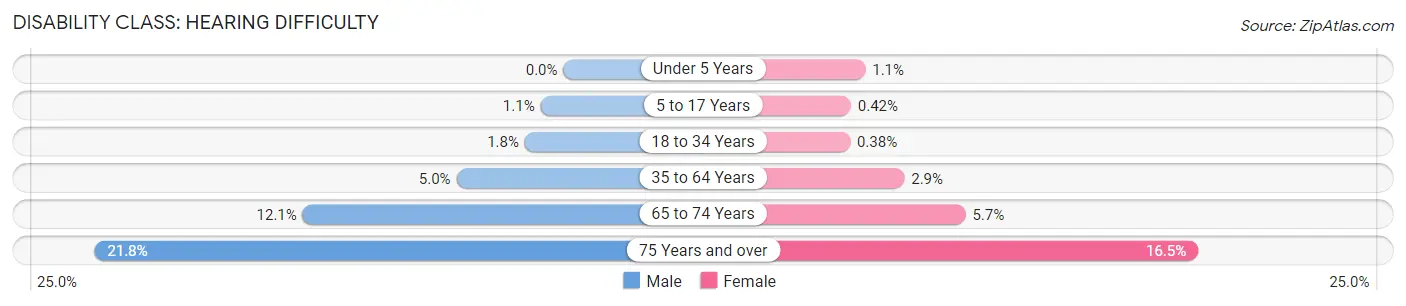
| Age Bracket | Male | Female |
| Under 5 Years | 0 (0.0%) | 2 (1.1%) |
| 5 to 17 Years | 10 (1.1%) | 3 (0.4%) |
| 18 to 34 Years | 15 (1.8%) | 3 (0.4%) |
| 35 to 64 Years | 78 (5.0%) | 49 (2.9%) |
| 65 to 74 Years | 45 (12.1%) | 23 (5.7%) |
| 75 Years and over | 47 (21.8%) | 59 (16.5%) |
Disability Class: Vision Difficulty
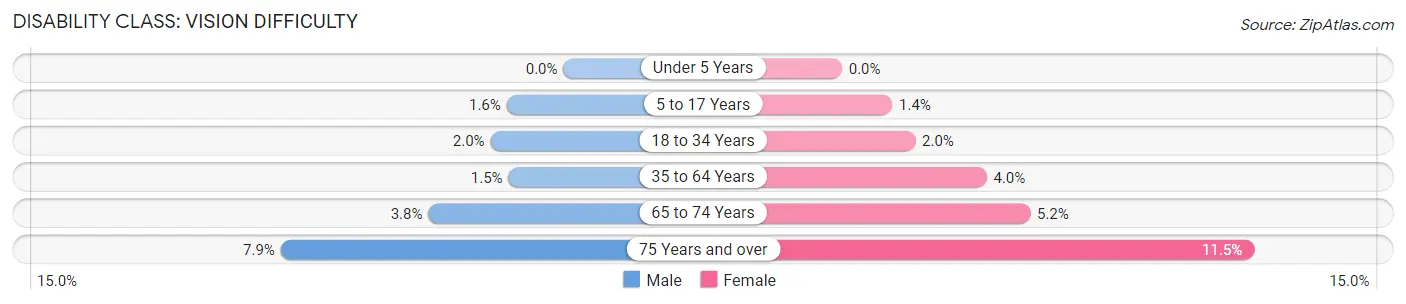
| Age Bracket | Male | Female |
| Under 5 Years | 0 (0.0%) | 0 (0.0%) |
| 5 to 17 Years | 15 (1.6%) | 10 (1.4%) |
| 18 to 34 Years | 17 (2.0%) | 16 (2.0%) |
| 35 to 64 Years | 24 (1.5%) | 68 (4.0%) |
| 65 to 74 Years | 14 (3.8%) | 21 (5.2%) |
| 75 Years and over | 17 (7.9%) | 41 (11.5%) |
Disability Class: Cognitive Difficulty
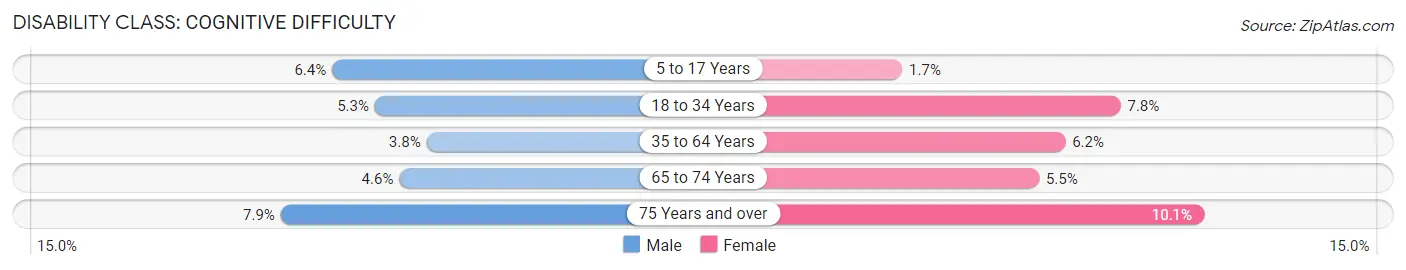
| Age Bracket | Male | Female |
| 5 to 17 Years | 61 (6.4%) | 12 (1.7%) |
| 18 to 34 Years | 44 (5.2%) | 61 (7.8%) |
| 35 to 64 Years | 60 (3.8%) | 105 (6.2%) |
| 65 to 74 Years | 17 (4.6%) | 22 (5.5%) |
| 75 Years and over | 17 (7.9%) | 36 (10.1%) |
Disability Class: Ambulatory Difficulty
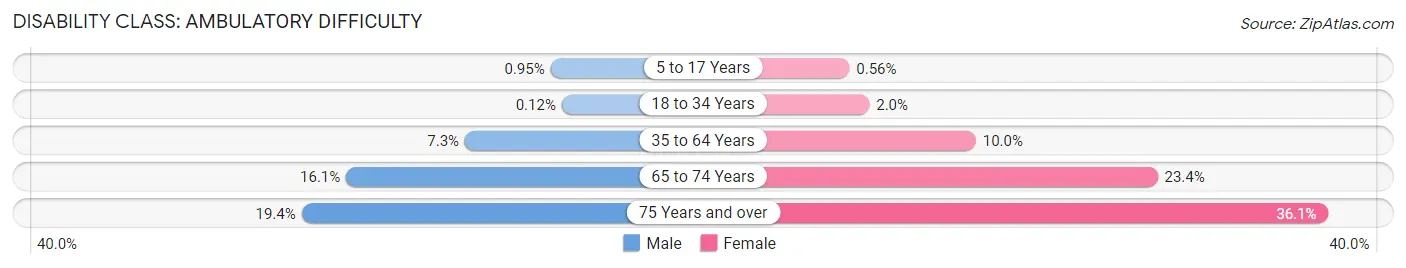
| Age Bracket | Male | Female |
| 5 to 17 Years | 9 (0.9%) | 4 (0.6%) |
| 18 to 34 Years | 1 (0.1%) | 16 (2.0%) |
| 35 to 64 Years | 115 (7.3%) | 168 (10.0%) |
| 65 to 74 Years | 60 (16.1%) | 94 (23.4%) |
| 75 Years and over | 42 (19.4%) | 129 (36.1%) |
Disability Class: Self-Care Difficulty
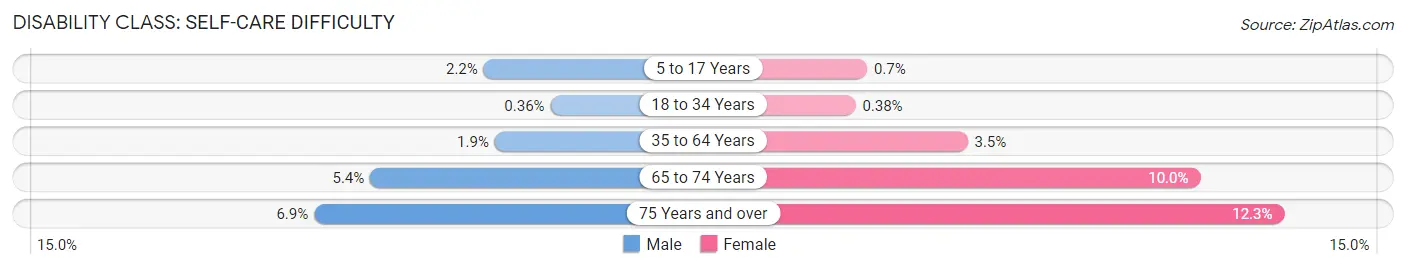
| Age Bracket | Male | Female |
| 5 to 17 Years | 21 (2.2%) | 5 (0.7%) |
| 18 to 34 Years | 3 (0.4%) | 3 (0.4%) |
| 35 to 64 Years | 30 (1.9%) | 59 (3.5%) |
| 65 to 74 Years | 20 (5.4%) | 40 (10.0%) |
| 75 Years and over | 15 (6.9%) | 44 (12.3%) |
Technology Access in Arab
Computing Device Access in Arab
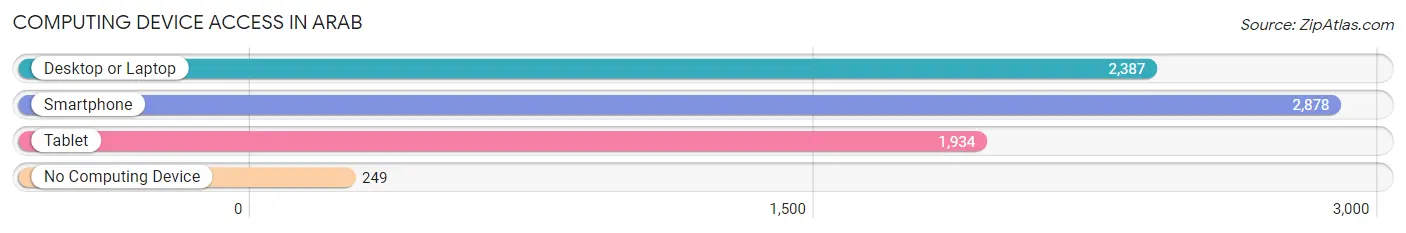
| Device Type | # Households | % Households |
| Desktop or Laptop | 2,387 | 71.6% |
| Smartphone | 2,878 | 86.3% |
| Tablet | 1,934 | 58.0% |
| No Computing Device | 249 | 7.5% |
| Total | 3,336 | 100.0% |
Internet Access in Arab
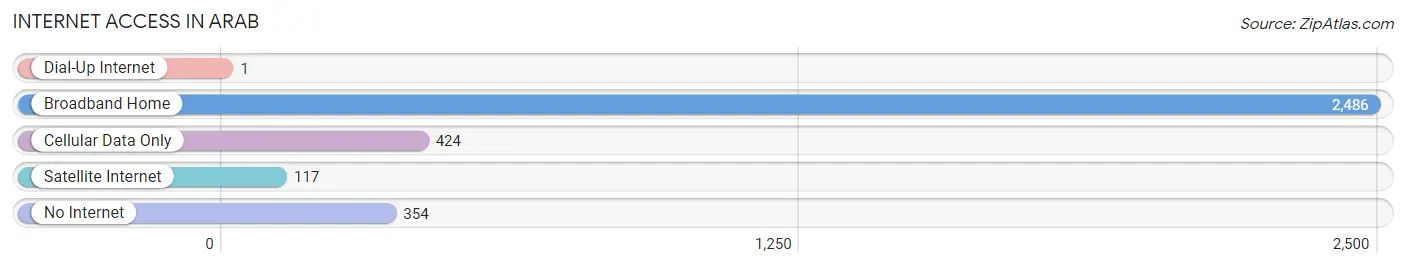
| Internet Type | # Households | % Households |
| Dial-Up Internet | 1 | 0.0% |
| Broadband Home | 2,486 | 74.5% |
| Cellular Data Only | 424 | 12.7% |
| Satellite Internet | 117 | 3.5% |
| No Internet | 354 | 10.6% |
| Total | 3,336 | 100.0% |
Arab Summary
Arab is a term used to refer to a group of people who speak Arabic as their native language and share a common cultural heritage. The Arab world is a region that spans from the Atlantic Ocean in the west to the Arabian Sea in the east, and from the Mediterranean Sea in the north to the Indian Ocean in the south. It includes 22 countries and territories, including the countries of the Middle East and North Africa.
History
The history of the Arab world is long and complex, stretching back to ancient times. The region has been home to many different civilizations, including the ancient Egyptians, Babylonians, Assyrians, and Persians. It was also the birthplace of the three major monotheistic religions: Judaism, Christianity, and Islam.
The Arab world has seen many changes over the centuries, including the rise and fall of empires, the spread of Islam, and the colonization of the region by European powers. In the 20th century, the Arab world experienced a period of decolonization and the emergence of independent nation-states.
Geography
The Arab world is a large and diverse region, with a variety of landscapes and climates. The region is divided into two main geographic regions: the Arabian Peninsula and the Fertile Crescent. The Arabian Peninsula is a large desert region that includes the countries of Saudi Arabia, Yemen, Oman, the United Arab Emirates, Qatar, and Kuwait. The Fertile Crescent is a region of fertile land that stretches from the eastern Mediterranean coast to the Persian Gulf. It includes the countries of Iraq, Syria, Lebanon, Jordan, and Palestine.
Economy
The economy of the Arab world is largely based on oil and gas production, with many countries relying heavily on exports of these resources. Other important industries include agriculture, manufacturing, and tourism.
The Arab world is home to some of the world’s wealthiest countries, such as Qatar and the United Arab Emirates. However, the region also has some of the world’s poorest countries, such as Yemen and Syria.
Demographics
The Arab world is home to more than 400 million people, making it one of the most populous regions in the world. The majority of the population is Muslim, with a small minority of Christians and other religious groups. Arabic is the official language of the region, although English and French are also widely spoken.
The Arab world is a region of great cultural diversity, with many different ethnic groups and languages. The region is also home to a large number of refugees and displaced persons, due to conflicts in the region.
Common Questions
What is Per Capita Income in Arab?
Per Capita income in Arab is $32,269.
What is the Median Family Income in Arab?
Median Family Income in Arab is $80,236.
What is the Median Household income in Arab?
Median Household Income in Arab is $56,471.
What is Income or Wage Gap in Arab?
Income or Wage Gap in Arab is 24.6%.
Women in Arab earn 75.4 cents for every dollar earned by a man.
What is Family Income Deficit in Arab?
Family Income Deficit in Arab is $8,590.
Families that are below poverty line in Arab earn $8,590 less on average than the poverty threshold level.
What is Inequality or Gini Index in Arab?
Inequality or Gini Index in Arab is 0.46.
What is the Total Population of Arab?
Total Population of Arab is 8,552.
What is the Total Male Population of Arab?
Total Male Population of Arab is 4,354.
What is the Total Female Population of Arab?
Total Female Population of Arab is 4,198.
What is the Ratio of Males per 100 Females in Arab?
There are 103.72 Males per 100 Females in Arab.
What is the Ratio of Females per 100 Males in Arab?
There are 96.42 Females per 100 Males in Arab.
What is the Median Population Age in Arab?
Median Population Age in Arab is 38.7 Years.
What is the Average Family Size in Arab
Average Family Size in Arab is 3.2 People.
What is the Average Household Size in Arab
Average Household Size in Arab is 2.5 People.
How Large is the Labor Force in Arab?
There are 3,896 People in the Labor Forcein in Arab.
What is the Percentage of People in the Labor Force in Arab?
59.0% of People are in the Labor Force in Arab.
What is the Unemployment Rate in Arab?
Unemployment Rate in Arab is 3.0%.