Alexander City, AL Map & Demographics
Alexander City Map
Alexander City Overview
$26,388
PER CAPITA INCOME
$58,266
AVG FAMILY INCOME
$42,141
AVG HOUSEHOLD INCOME
25.1%
WAGE / INCOME GAP [ % ]
74.9¢/ $1
WAGE / INCOME GAP [ $ ]
$9,936
FAMILY INCOME DEFICIT
0.49
INEQUALITY / GINI INDEX
14,788
TOTAL POPULATION
7,285
MALE POPULATION
7,503
FEMALE POPULATION
97.09
MALES / 100 FEMALES
102.99
FEMALES / 100 MALES
41.2
MEDIAN AGE
3.1
AVG FAMILY SIZE
2.4
AVG HOUSEHOLD SIZE
5,807
LABOR FORCE [ PEOPLE ]
49.8%
PERCENT IN LABOR FORCE
8.2%
UNEMPLOYMENT RATE
Alexander City Zip Codes
Alexander City Area Codes
Income in Alexander City
Income Overview in Alexander City
Per Capita Income in Alexander City is $26,388, while median incomes of families and households are $58,266 and $42,141 respectively.
| Characteristic | Number | Measure |
| Per Capita Income | 14,788 | $26,388 |
| Median Family Income | 3,649 | $58,266 |
| Mean Family Income | 3,649 | $71,568 |
| Median Household Income | 5,978 | $42,141 |
| Mean Household Income | 5,978 | $61,187 |
| Income Deficit | 3,649 | $9,936 |
| Wage / Income Gap (%) | 14,788 | 25.12% |
| Wage / Income Gap ($) | 14,788 | 74.88¢ per $1 |
| Gini / Inequality Index | 14,788 | 0.49 |
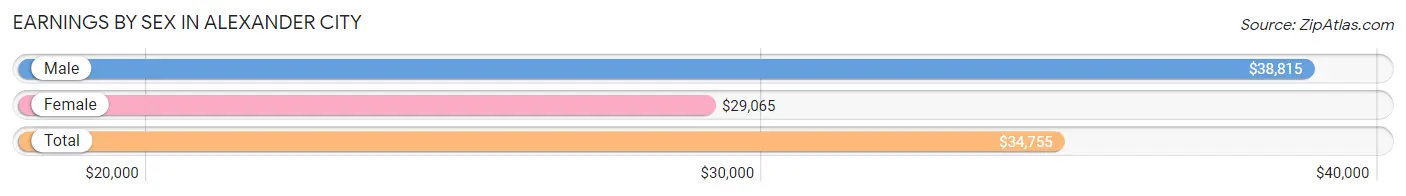
Earnings by Sex in Alexander City
Average Earnings in Alexander City are $34,755, $38,815 for men and $29,065 for women, a difference of 25.1%.
| Sex | Number | Average Earnings |
| Male | 3,303 (56.0%) | $38,815 |
| Female | 2,595 (44.0%) | $29,065 |
| Total | 5,898 (100.0%) | $34,755 |
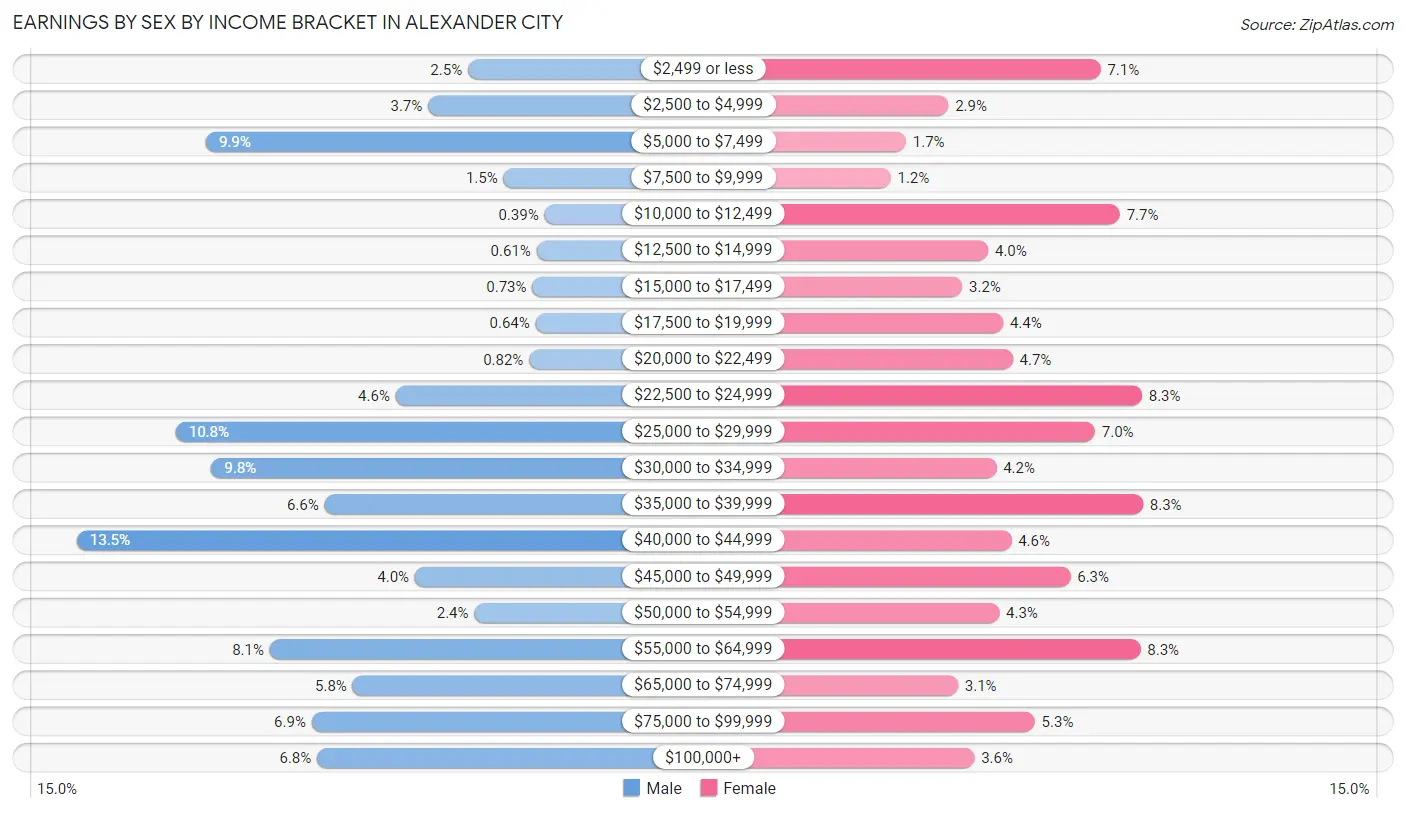
Earnings by Sex by Income Bracket in Alexander City
The most common earnings brackets in Alexander City are $40,000 to $44,999 for men (447 | 13.5%) and $35,000 to $39,999 for women (216 | 8.3%).
| Income | Male | Female |
| $2,499 or less | 84 (2.5%) | 185 (7.1%) |
| $2,500 to $4,999 | 121 (3.7%) | 74 (2.9%) |
| $5,000 to $7,499 | 327 (9.9%) | 43 (1.7%) |
| $7,500 to $9,999 | 51 (1.5%) | 32 (1.2%) |
| $10,000 to $12,499 | 13 (0.4%) | 199 (7.7%) |
| $12,500 to $14,999 | 20 (0.6%) | 103 (4.0%) |
| $15,000 to $17,499 | 24 (0.7%) | 84 (3.2%) |
| $17,500 to $19,999 | 21 (0.6%) | 114 (4.4%) |
| $20,000 to $22,499 | 27 (0.8%) | 121 (4.7%) |
| $22,500 to $24,999 | 151 (4.6%) | 215 (8.3%) |
| $25,000 to $29,999 | 355 (10.7%) | 181 (7.0%) |
| $30,000 to $34,999 | 322 (9.8%) | 109 (4.2%) |
| $35,000 to $39,999 | 217 (6.6%) | 216 (8.3%) |
| $40,000 to $44,999 | 447 (13.5%) | 120 (4.6%) |
| $45,000 to $49,999 | 133 (4.0%) | 163 (6.3%) |
| $50,000 to $54,999 | 78 (2.4%) | 111 (4.3%) |
| $55,000 to $64,999 | 268 (8.1%) | 214 (8.3%) |
| $65,000 to $74,999 | 191 (5.8%) | 81 (3.1%) |
| $75,000 to $99,999 | 229 (6.9%) | 137 (5.3%) |
| $100,000+ | 224 (6.8%) | 93 (3.6%) |
| Total | 3,303 (100.0%) | 2,595 (100.0%) |
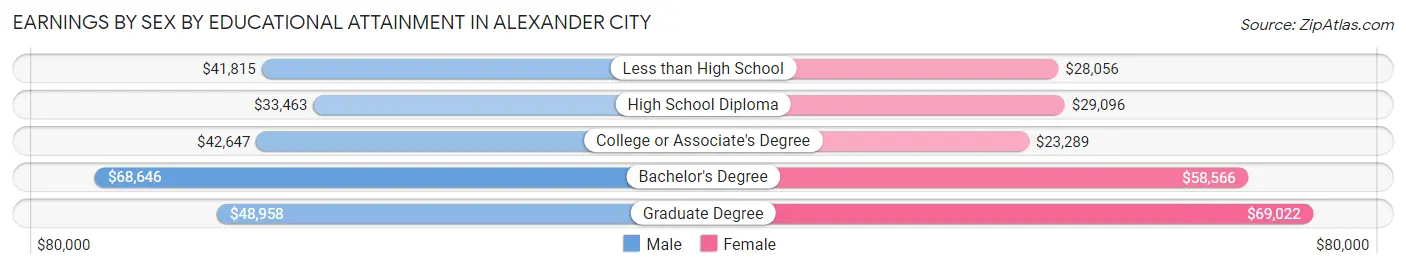
Earnings by Sex by Educational Attainment in Alexander City
Average earnings in Alexander City are $40,758 for men and $30,875 for women, a difference of 24.2%. Men with an educational attainment of bachelor's degree enjoy the highest average annual earnings of $68,646, while those with high school diploma education earn the least with $33,463. Women with an educational attainment of graduate degree earn the most with the average annual earnings of $69,022, while those with college or associate's degree education have the smallest earnings of $23,289.
| Educational Attainment | Male Income | Female Income |
| Less than High School | $41,815 | $28,056 |
| High School Diploma | $33,463 | $29,096 |
| College or Associate's Degree | $42,647 | $23,289 |
| Bachelor's Degree | $68,646 | $58,566 |
| Graduate Degree | $48,958 | $69,022 |
| Total | $40,758 | $30,875 |
Family Income in Alexander City
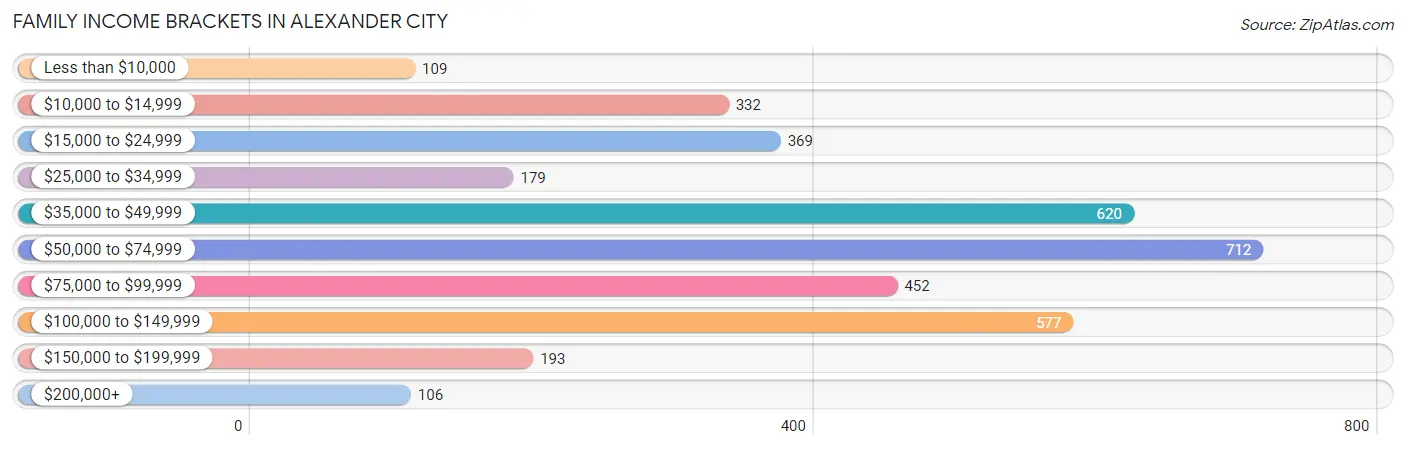
Family Income Brackets in Alexander City
According to the Alexander City family income data, there are 712 families falling into the $50,000 to $74,999 income range, which is the most common income bracket and makes up 19.5% of all families. Conversely, the $200,000+ income bracket is the least frequent group with only 106 families (2.9%) belonging to this category.
| Income Bracket | # Families | % Families |
| Less than $10,000 | 109 | 3.0% |
| $10,000 to $14,999 | 332 | 9.1% |
| $15,000 to $24,999 | 369 | 10.1% |
| $25,000 to $34,999 | 179 | 4.9% |
| $35,000 to $49,999 | 620 | 17.0% |
| $50,000 to $74,999 | 712 | 19.5% |
| $75,000 to $99,999 | 452 | 12.4% |
| $100,000 to $149,999 | 577 | 15.8% |
| $150,000 to $199,999 | 193 | 5.3% |
| $200,000+ | 106 | 2.9% |
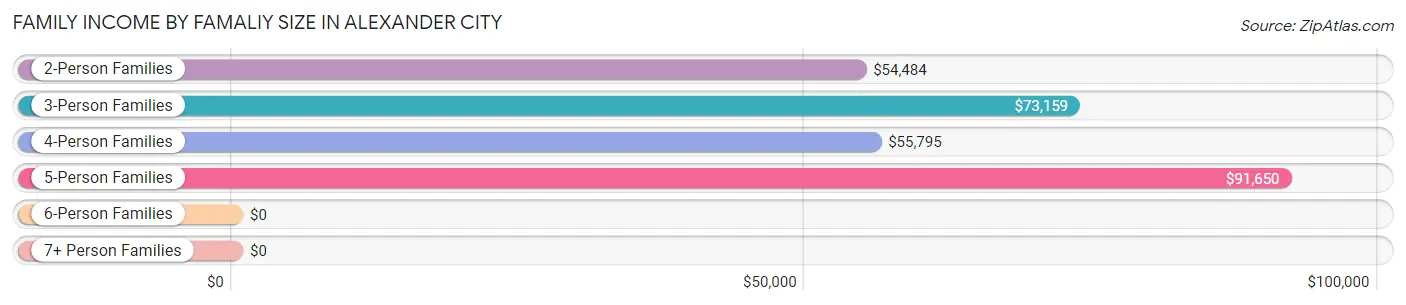
Family Income by Famaliy Size in Alexander City
5-person families (94 | 2.6%) account for the highest median family income in Alexander City with $91,650 per family, while 2-person families (1,987 | 54.4%) have the highest median income of $27,242 per family member.
| Income Bracket | # Families | Median Income |
| 2-Person Families | 1,987 (54.4%) | $54,484 |
| 3-Person Families | 825 (22.6%) | $73,159 |
| 4-Person Families | 690 (18.9%) | $55,795 |
| 5-Person Families | 94 (2.6%) | $91,650 |
| 6-Person Families | 17 (0.5%) | $0 |
| 7+ Person Families | 36 (1.0%) | $0 |
| Total | 3,649 (100.0%) | $58,266 |
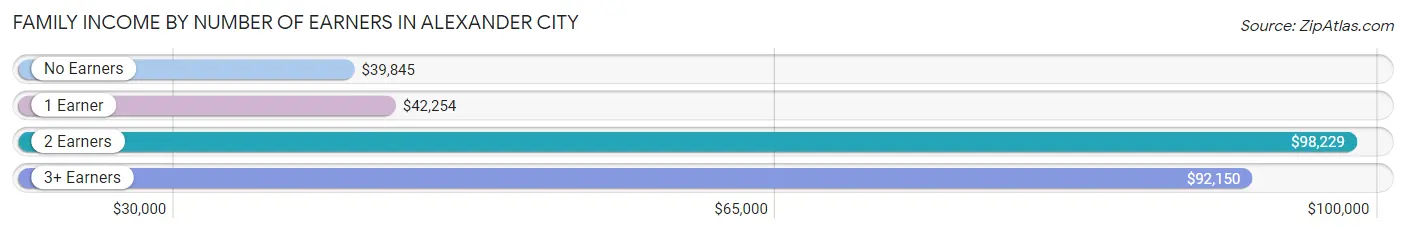
Family Income by Number of Earners in Alexander City
The median family income in Alexander City is $58,266, with families comprising 2 earners (1,035) having the highest median family income of $98,229, while families with no earners (1,020) have the lowest median family income of $39,845, accounting for 28.4% and 28.0% of families, respectively.
| Number of Earners | # Families | Median Income |
| No Earners | 1,020 (28.0%) | $39,845 |
| 1 Earner | 1,446 (39.6%) | $42,254 |
| 2 Earners | 1,035 (28.4%) | $98,229 |
| 3+ Earners | 148 (4.1%) | $92,150 |
| Total | 3,649 (100.0%) | $58,266 |
Household Income in Alexander City
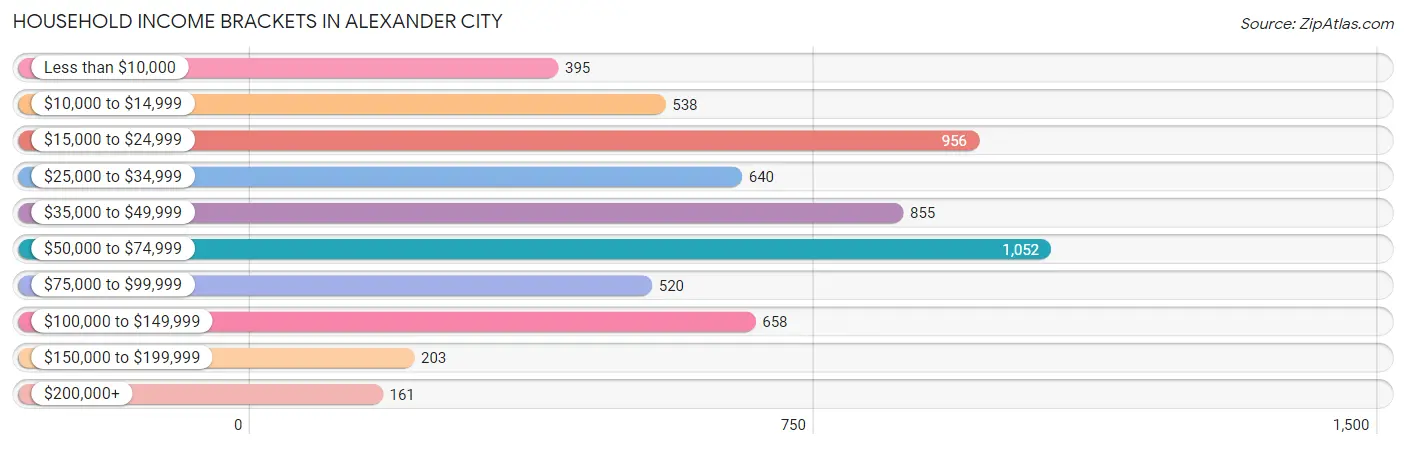
Household Income Brackets in Alexander City
With 1,052 households falling in the category, the $50,000 to $74,999 income range is the most frequent in Alexander City, accounting for 17.6% of all households. In contrast, only 161 households (2.7%) fall into the $200,000+ income bracket, making it the least populous group.
| Income Bracket | # Households | % Households |
| Less than $10,000 | 395 | 6.6% |
| $10,000 to $14,999 | 538 | 9.0% |
| $15,000 to $24,999 | 956 | 16.0% |
| $25,000 to $34,999 | 640 | 10.7% |
| $35,000 to $49,999 | 855 | 14.3% |
| $50,000 to $74,999 | 1,052 | 17.6% |
| $75,000 to $99,999 | 520 | 8.7% |
| $100,000 to $149,999 | 658 | 11.0% |
| $150,000 to $199,999 | 203 | 3.4% |
| $200,000+ | 161 | 2.7% |
Household Income by Householder Age in Alexander City
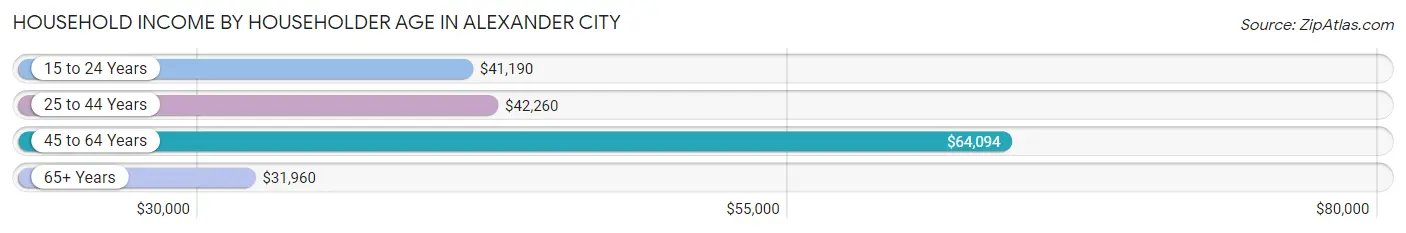
The median household income in Alexander City is $42,141, with the highest median household income of $64,094 found in the 45 to 64 years age bracket for the primary householder. A total of 2,267 households (37.9%) fall into this category. Meanwhile, the 65+ years age bracket for the primary householder has the lowest median household income of $31,960, with 1,945 households (32.5%) in this group.
| Income Bracket | # Households | Median Income |
| 15 to 24 Years | 84 (1.4%) | $41,190 |
| 25 to 44 Years | 1,682 (28.1%) | $42,260 |
| 45 to 64 Years | 2,267 (37.9%) | $64,094 |
| 65+ Years | 1,945 (32.5%) | $31,960 |
| Total | 5,978 (100.0%) | $42,141 |
Poverty in Alexander City
Income Below Poverty by Sex and Age in Alexander City
With 16.7% poverty level for males and 25.2% for females among the residents of Alexander City, 15 year old males and 5 year old females are the most vulnerable to poverty, with 23 males (57.5%) and 70 females (56.9%) in their respective age groups living below the poverty level.
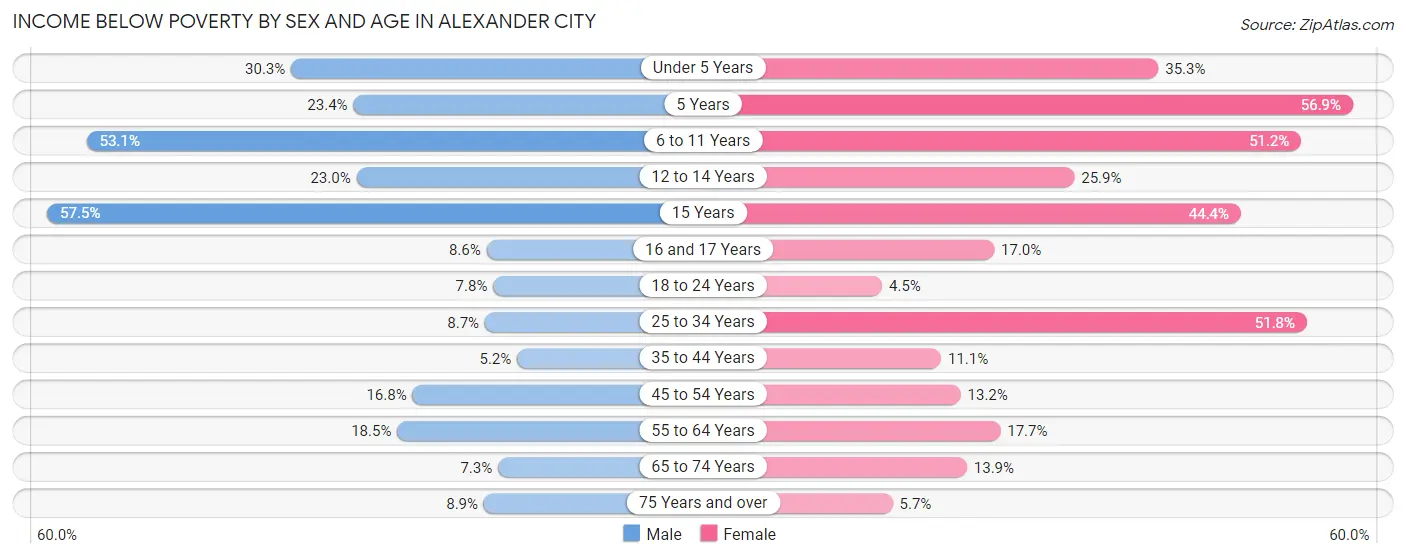
| Age Bracket | Male | Female |
| Under 5 Years | 124 (30.3%) | 221 (35.2%) |
| 5 Years | 18 (23.4%) | 70 (56.9%) |
| 6 to 11 Years | 343 (53.1%) | 353 (51.2%) |
| 12 to 14 Years | 50 (23.0%) | 58 (25.9%) |
| 15 Years | 23 (57.5%) | 28 (44.4%) |
| 16 and 17 Years | 26 (8.6%) | 19 (17.0%) |
| 18 to 24 Years | 50 (7.8%) | 18 (4.5%) |
| 25 to 34 Years | 60 (8.7%) | 563 (51.8%) |
| 35 to 44 Years | 41 (5.1%) | 63 (11.1%) |
| 45 to 54 Years | 126 (16.8%) | 115 (13.2%) |
| 55 to 64 Years | 200 (18.5%) | 186 (17.6%) |
| 65 to 74 Years | 65 (7.3%) | 130 (13.9%) |
| 75 Years and over | 36 (8.8%) | 36 (5.7%) |
| Total | 1,162 (16.7%) | 1,860 (25.2%) |
Income Above Poverty by Sex and Age in Alexander City
According to the poverty statistics in Alexander City, males aged 35 to 44 years and females aged 18 to 24 years are the age groups that are most secure financially, with 94.9% of males and 95.5% of females in these age groups living above the poverty line.
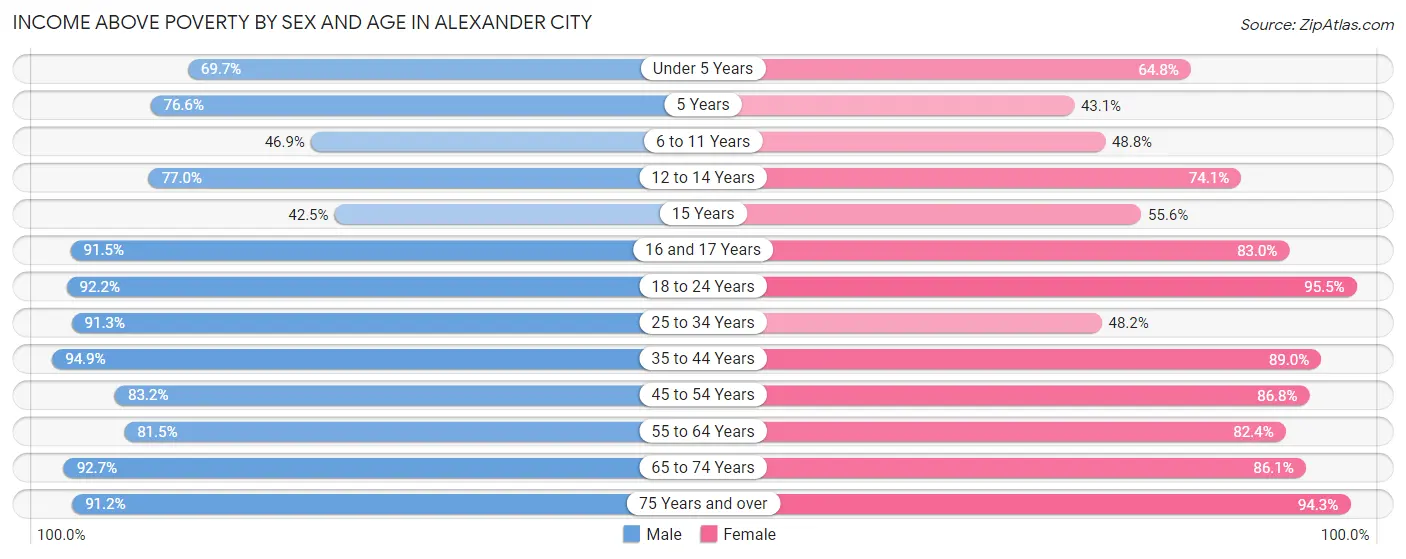
| Age Bracket | Male | Female |
| Under 5 Years | 285 (69.7%) | 406 (64.7%) |
| 5 Years | 59 (76.6%) | 53 (43.1%) |
| 6 to 11 Years | 303 (46.9%) | 337 (48.8%) |
| 12 to 14 Years | 167 (77.0%) | 166 (74.1%) |
| 15 Years | 17 (42.5%) | 35 (55.6%) |
| 16 and 17 Years | 278 (91.4%) | 93 (83.0%) |
| 18 to 24 Years | 590 (92.2%) | 383 (95.5%) |
| 25 to 34 Years | 627 (91.3%) | 524 (48.2%) |
| 35 to 44 Years | 755 (94.9%) | 507 (88.9%) |
| 45 to 54 Years | 624 (83.2%) | 754 (86.8%) |
| 55 to 64 Years | 881 (81.5%) | 868 (82.4%) |
| 65 to 74 Years | 829 (92.7%) | 803 (86.1%) |
| 75 Years and over | 371 (91.1%) | 600 (94.3%) |
| Total | 5,786 (83.3%) | 5,529 (74.8%) |
Income Below Poverty Among Married-Couple Families in Alexander City
The poverty statistics for married-couple families in Alexander City show that 7.6% or 165 of the total 2,173 families live below the poverty line. Families with 3 or 4 children have the highest poverty rate of 24.2%, comprising of 8 families. On the other hand, families with no children have the lowest poverty rate of 6.2%, which includes 84 families.
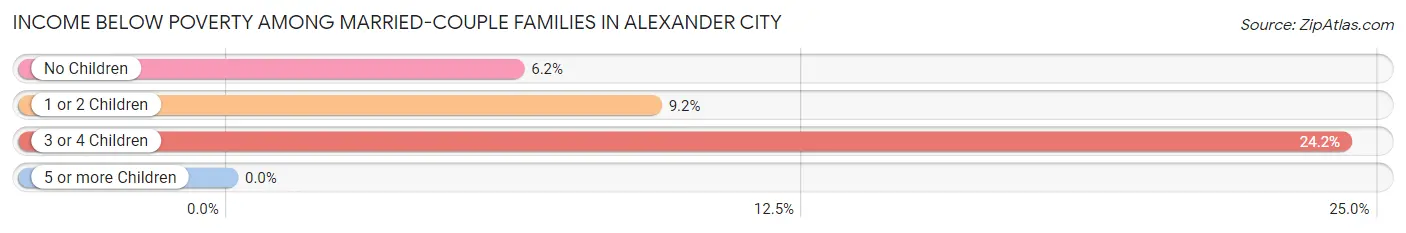
| Children | Above Poverty | Below Poverty |
| No Children | 1,264 (93.8%) | 84 (6.2%) |
| 1 or 2 Children | 719 (90.8%) | 73 (9.2%) |
| 3 or 4 Children | 25 (75.8%) | 8 (24.2%) |
| 5 or more Children | 0 (0.0%) | 0 (0.0%) |
| Total | 2,008 (92.4%) | 165 (7.6%) |
Income Below Poverty Among Single-Parent Households in Alexander City
According to the poverty data in Alexander City, 7.3% or 29 single-father households and 44.7% or 482 single-mother households are living below the poverty line. Among single-father households, those with 1 or 2 children have the highest poverty rate, with 24 households (9.8%) experiencing poverty. Likewise, among single-mother households, those with 5 or more children have the highest poverty rate, with 25 households (100.0%) falling below the poverty line.
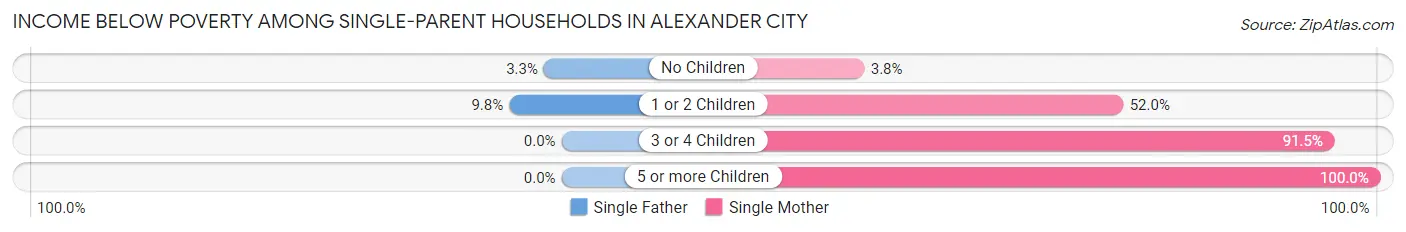
| Children | Single Father | Single Mother |
| No Children | 5 (3.3%) | 11 (3.7%) |
| 1 or 2 Children | 24 (9.8%) | 328 (52.0%) |
| 3 or 4 Children | 0 (0.0%) | 118 (91.5%) |
| 5 or more Children | 0 (0.0%) | 25 (100.0%) |
| Total | 29 (7.3%) | 482 (44.7%) |
Income Below Poverty Among Married-Couple vs Single-Parent Households in Alexander City
The poverty data for Alexander City shows that 165 of the married-couple family households (7.6%) and 511 of the single-parent households (34.6%) are living below the poverty level. Within the married-couple family households, those with 3 or 4 children have the highest poverty rate, with 8 households (24.2%) falling below the poverty line. Among the single-parent households, those with 5 or more children have the highest poverty rate, with 25 household (100.0%) living below poverty.
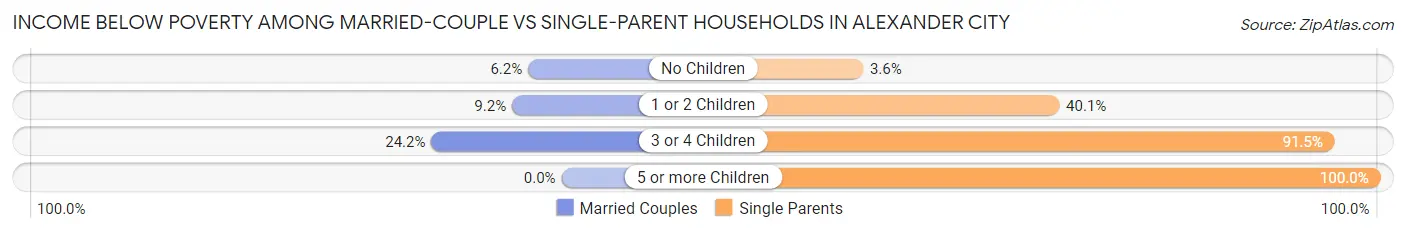
| Children | Married-Couple Families | Single-Parent Households |
| No Children | 84 (6.2%) | 16 (3.6%) |
| 1 or 2 Children | 73 (9.2%) | 352 (40.1%) |
| 3 or 4 Children | 8 (24.2%) | 118 (91.5%) |
| 5 or more Children | 0 (0.0%) | 25 (100.0%) |
| Total | 165 (7.6%) | 511 (34.6%) |
Race in Alexander City
The most populous races in Alexander City are White / Caucasian (8,825 | 59.7%), Black / African American (4,893 | 33.1%), and Hispanic or Latino (854 | 5.8%).
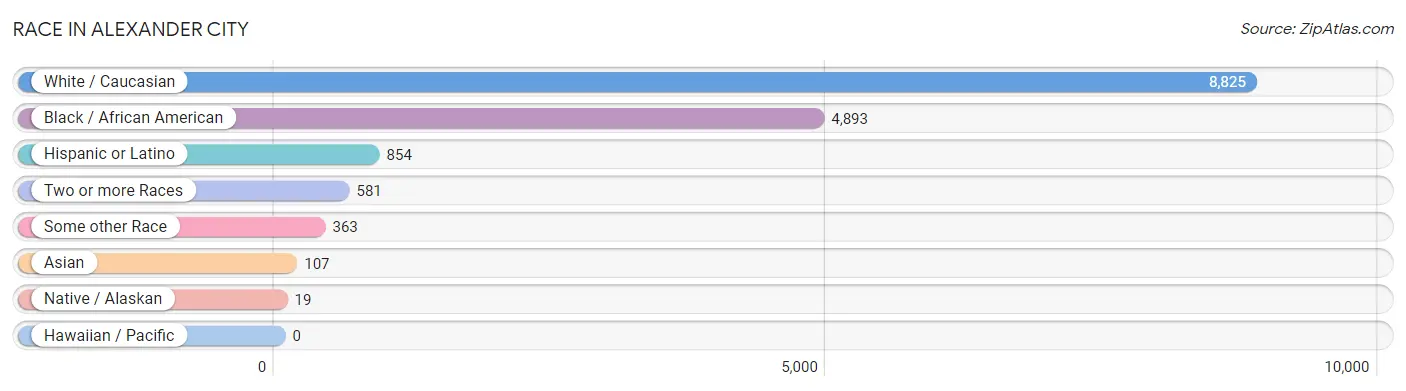
| Race | # Population | % Population |
| Asian | 107 | 0.7% |
| Black / African American | 4,893 | 33.1% |
| Hawaiian / Pacific | 0 | 0.0% |
| Hispanic or Latino | 854 | 5.8% |
| Native / Alaskan | 19 | 0.1% |
| White / Caucasian | 8,825 | 59.7% |
| Two or more Races | 581 | 3.9% |
| Some other Race | 363 | 2.5% |
| Total | 14,788 | 100.0% |
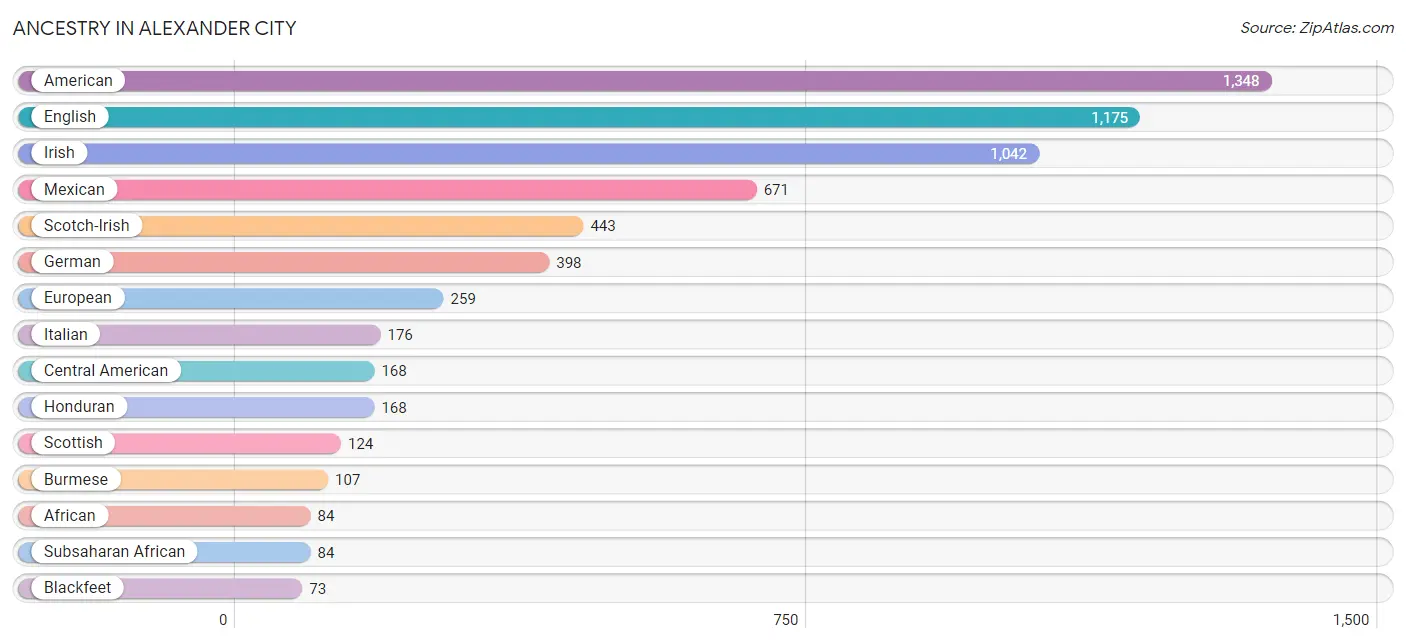
Ancestry in Alexander City
The most populous ancestries reported in Alexander City are American (1,348 | 9.1%), English (1,175 | 8.0%), Irish (1,042 | 7.0%), Mexican (671 | 4.5%), and Scotch-Irish (443 | 3.0%), together accounting for 31.7% of all Alexander City residents.
| Ancestry | # Population | % Population |
| African | 84 | 0.6% |
| American | 1,348 | 9.1% |
| Arab | 25 | 0.2% |
| Austrian | 10 | 0.1% |
| Bhutanese | 11 | 0.1% |
| Blackfeet | 73 | 0.5% |
| Bulgarian | 14 | 0.1% |
| Burmese | 107 | 0.7% |
| Canadian | 27 | 0.2% |
| Central American | 168 | 1.1% |
| Cherokee | 66 | 0.4% |
| Choctaw | 73 | 0.5% |
| Creek | 3 | 0.0% |
| Danish | 2 | 0.0% |
| Dominican | 11 | 0.1% |
| Dutch | 29 | 0.2% |
| Eastern European | 25 | 0.2% |
| English | 1,175 | 8.0% |
| European | 259 | 1.8% |
| French | 57 | 0.4% |
| German | 398 | 2.7% |
| Haitian | 11 | 0.1% |
| Honduran | 168 | 1.1% |
| Hungarian | 43 | 0.3% |
| Irish | 1,042 | 7.0% |
| Italian | 176 | 1.2% |
| Lebanese | 25 | 0.2% |
| Mexican | 671 | 4.5% |
| Polish | 35 | 0.2% |
| Puerto Rican | 4 | 0.0% |
| Scandinavian | 43 | 0.3% |
| Scotch-Irish | 443 | 3.0% |
| Scottish | 124 | 0.8% |
| Subsaharan African | 84 | 0.6% |
| Swedish | 8 | 0.1% |
| Swiss | 10 | 0.1% |
| Welsh | 7 | 0.1% | View All 37 Rows |
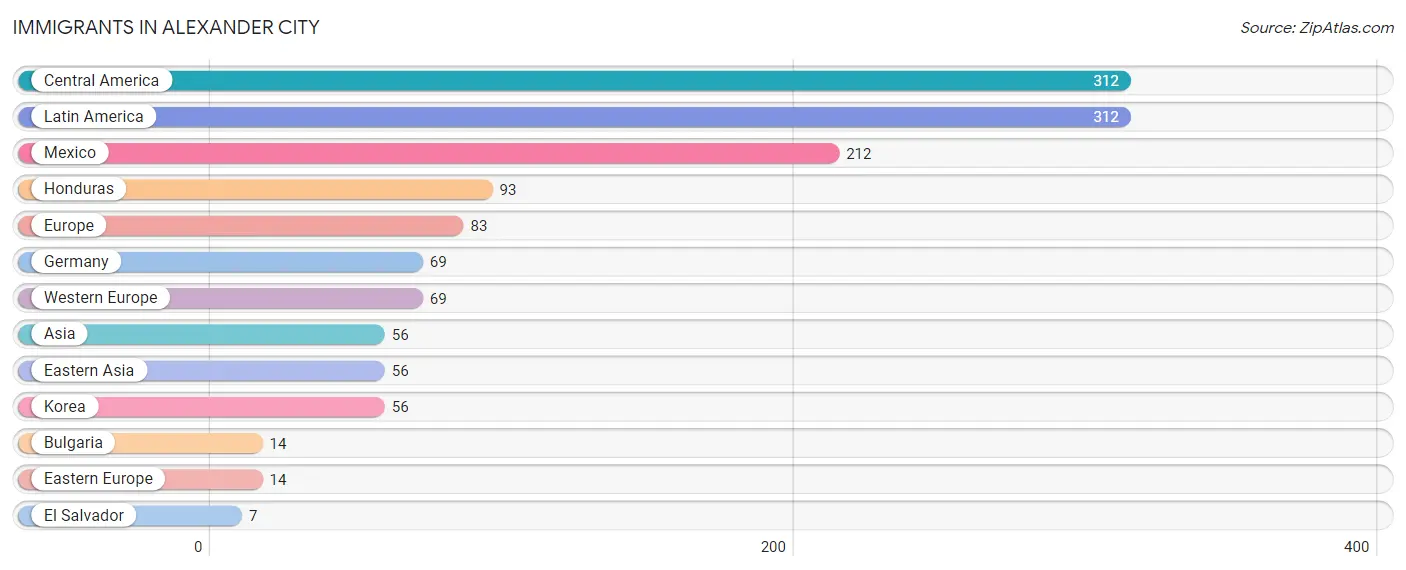
Immigrants in Alexander City
The most numerous immigrant groups reported in Alexander City came from Central America (312 | 2.1%), Latin America (312 | 2.1%), Mexico (212 | 1.4%), Honduras (93 | 0.6%), and Europe (83 | 0.6%), together accounting for 6.8% of all Alexander City residents.
| Immigration Origin | # Population | % Population |
| Asia | 56 | 0.4% |
| Bulgaria | 14 | 0.1% |
| Central America | 312 | 2.1% |
| Eastern Asia | 56 | 0.4% |
| Eastern Europe | 14 | 0.1% |
| El Salvador | 7 | 0.1% |
| Europe | 83 | 0.6% |
| Germany | 69 | 0.5% |
| Honduras | 93 | 0.6% |
| Korea | 56 | 0.4% |
| Latin America | 312 | 2.1% |
| Mexico | 212 | 1.4% |
| Western Europe | 69 | 0.5% | View All 13 Rows |
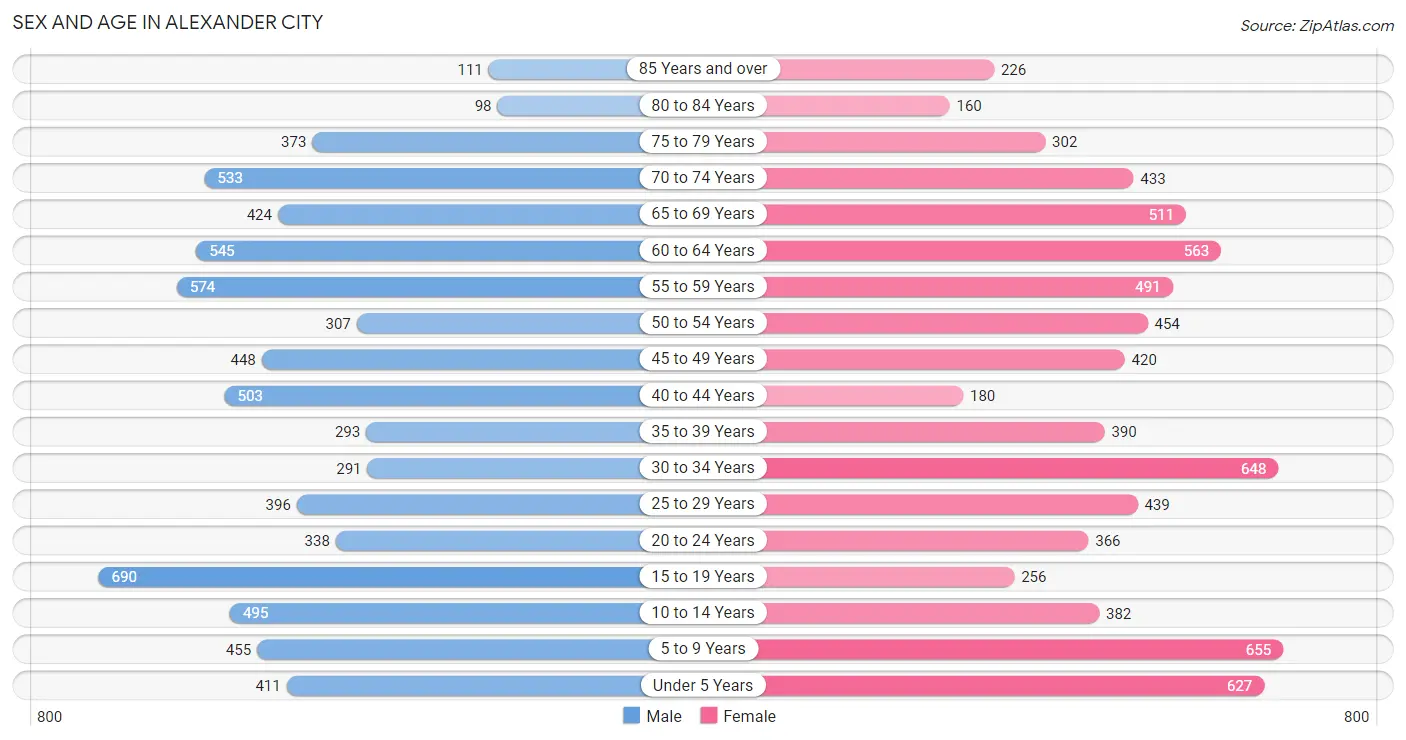
Sex and Age in Alexander City
Sex and Age in Alexander City
The most populous age groups in Alexander City are 15 to 19 Years (690 | 9.5%) for men and 5 to 9 Years (655 | 8.7%) for women.
| Age Bracket | Male | Female |
| Under 5 Years | 411 (5.6%) | 627 (8.4%) |
| 5 to 9 Years | 455 (6.2%) | 655 (8.7%) |
| 10 to 14 Years | 495 (6.8%) | 382 (5.1%) |
| 15 to 19 Years | 690 (9.5%) | 256 (3.4%) |
| 20 to 24 Years | 338 (4.6%) | 366 (4.9%) |
| 25 to 29 Years | 396 (5.4%) | 439 (5.9%) |
| 30 to 34 Years | 291 (4.0%) | 648 (8.6%) |
| 35 to 39 Years | 293 (4.0%) | 390 (5.2%) |
| 40 to 44 Years | 503 (6.9%) | 180 (2.4%) |
| 45 to 49 Years | 448 (6.1%) | 420 (5.6%) |
| 50 to 54 Years | 307 (4.2%) | 454 (6.0%) |
| 55 to 59 Years | 574 (7.9%) | 491 (6.5%) |
| 60 to 64 Years | 545 (7.5%) | 563 (7.5%) |
| 65 to 69 Years | 424 (5.8%) | 511 (6.8%) |
| 70 to 74 Years | 533 (7.3%) | 433 (5.8%) |
| 75 to 79 Years | 373 (5.1%) | 302 (4.0%) |
| 80 to 84 Years | 98 (1.3%) | 160 (2.1%) |
| 85 Years and over | 111 (1.5%) | 226 (3.0%) |
| Total | 7,285 (100.0%) | 7,503 (100.0%) |
Families and Households in Alexander City
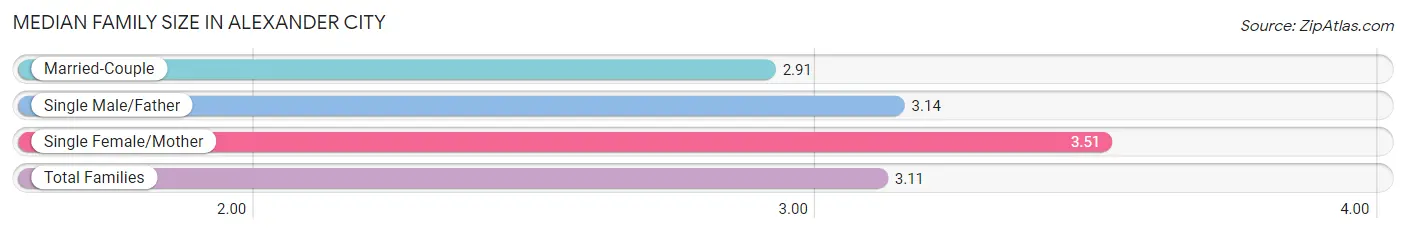
Median Family Size in Alexander City
The median family size in Alexander City is 3.11 persons per family, with single female/mother families (1,078 | 29.5%) accounting for the largest median family size of 3.51 persons per family. On the other hand, married-couple families (2,173 | 59.6%) represent the smallest median family size with 2.91 persons per family.
| Family Type | # Families | Family Size |
| Married-Couple | 2,173 (59.6%) | 2.91 |
| Single Male/Father | 398 (10.9%) | 3.14 |
| Single Female/Mother | 1,078 (29.5%) | 3.51 |
| Total Families | 3,649 (100.0%) | 3.11 |
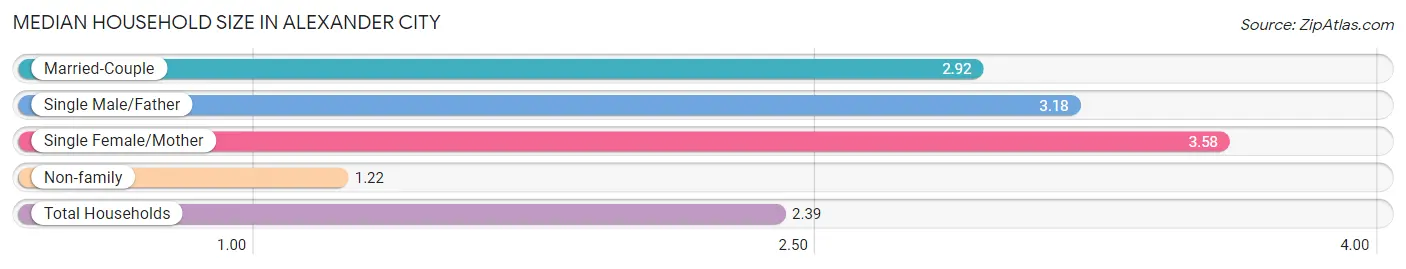
Median Household Size in Alexander City
The median household size in Alexander City is 2.39 persons per household, with single female/mother households (1,078 | 18.0%) accounting for the largest median household size of 3.58 persons per household. non-family households (2,329 | 39.0%) represent the smallest median household size with 1.22 persons per household.
| Household Type | # Households | Household Size |
| Married-Couple | 2,173 (36.3%) | 2.92 |
| Single Male/Father | 398 (6.7%) | 3.18 |
| Single Female/Mother | 1,078 (18.0%) | 3.58 |
| Non-family | 2,329 (39.0%) | 1.22 |
| Total Households | 5,978 (100.0%) | 2.39 |
Household Size by Marriage Status in Alexander City
Out of a total of 5,978 households in Alexander City, 3,649 (61.0%) are family households, while 2,329 (39.0%) are nonfamily households. The most numerous type of family households are 2-person households, comprising 1,965, and the most common type of nonfamily households are 1-person households, comprising 2,044.
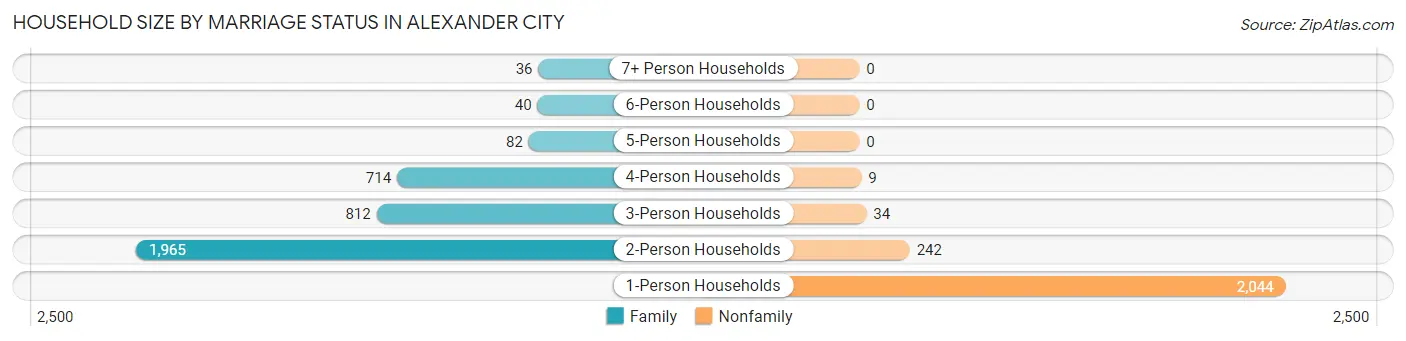
| Household Size | Family Households | Nonfamily Households |
| 1-Person Households | - | 2,044 (34.2%) |
| 2-Person Households | 1,965 (32.9%) | 242 (4.1%) |
| 3-Person Households | 812 (13.6%) | 34 (0.6%) |
| 4-Person Households | 714 (11.9%) | 9 (0.2%) |
| 5-Person Households | 82 (1.4%) | 0 (0.0%) |
| 6-Person Households | 40 (0.7%) | 0 (0.0%) |
| 7+ Person Households | 36 (0.6%) | 0 (0.0%) |
| Total | 3,649 (61.0%) | 2,329 (39.0%) |
Female Fertility in Alexander City
Fertility by Age in Alexander City
Average fertility rate in Alexander City is 118.0 births per 1,000 women. Women in the age bracket of 15 to 19 years have the highest fertility rate with 273.0 births per 1,000 women. Women in the age bracket of 20 to 34 years acount for 68.3% of all women with births.
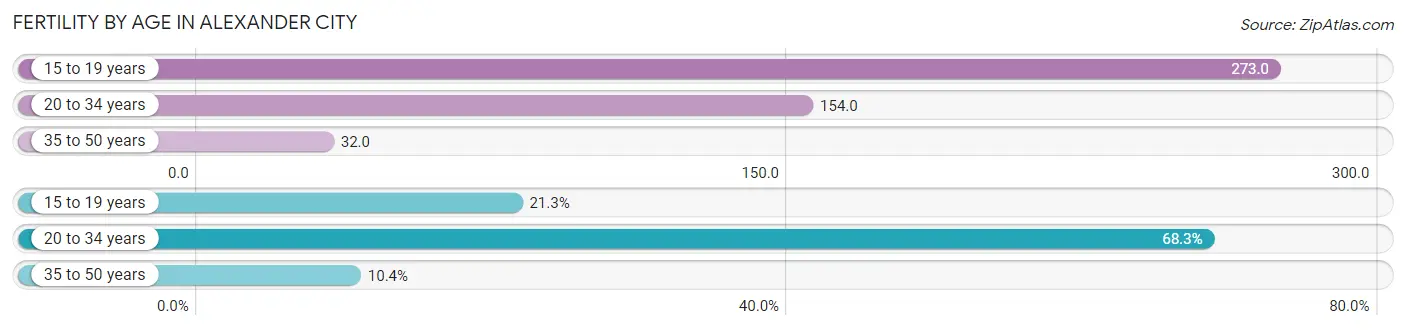
| Age Bracket | Women with Births | Births / 1,000 Women |
| 15 to 19 years | 70 (21.3%) | 273.0 |
| 20 to 34 years | 224 (68.3%) | 154.0 |
| 35 to 50 years | 34 (10.4%) | 32.0 |
| Total | 328 (100.0%) | 118.0 |
Fertility by Age by Marriage Status in Alexander City
29.0% of women with births (328) in Alexander City are married. The highest percentage of unmarried women with births falls into 15 to 19 years age bracket with 100.0% of them unmarried at the time of birth, while the lowest percentage of unmarried women with births belong to 35 to 50 years age bracket with 0.0% of them unmarried.
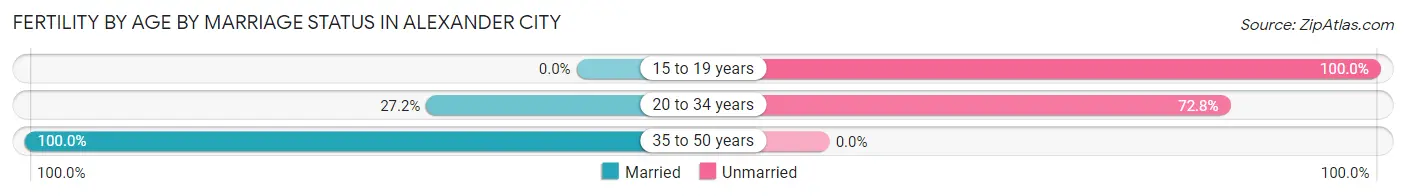
| Age Bracket | Married | Unmarried |
| 15 to 19 years | 0 (0.0%) | 70 (100.0%) |
| 20 to 34 years | 61 (27.2%) | 163 (72.8%) |
| 35 to 50 years | 34 (100.0%) | 0 (0.0%) |
| Total | 95 (29.0%) | 233 (71.0%) |
Fertility by Education in Alexander City
Average fertility rate in Alexander City is 118.0 births per 1,000 women. Women with the education attainment of less than high school have the highest fertility rate of 207.0 births per 1,000 women, while women with the education attainment of college or associate's degree have the lowest fertility at 50.0 births per 1,000 women. Women with the education attainment of less than high school represent 46.7% of all women with births.
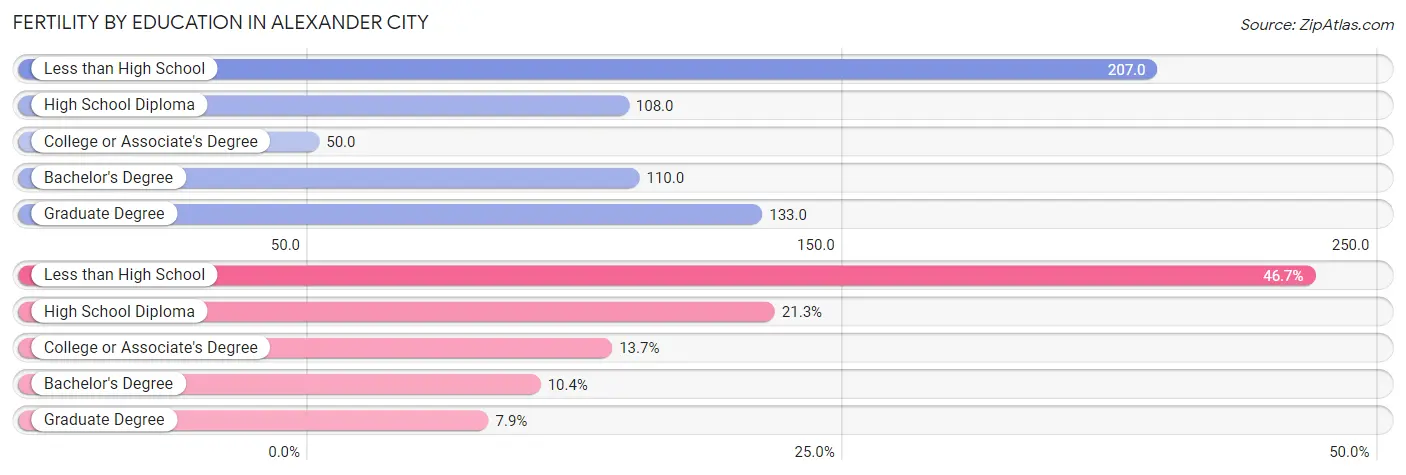
| Educational Attainment | Women with Births | Births / 1,000 Women |
| Less than High School | 153 (46.7%) | 207.0 |
| High School Diploma | 70 (21.3%) | 108.0 |
| College or Associate's Degree | 45 (13.7%) | 50.0 |
| Bachelor's Degree | 34 (10.4%) | 110.0 |
| Graduate Degree | 26 (7.9%) | 133.0 |
| Total | 328 (100.0%) | 118.0 |
Fertility by Education by Marriage Status in Alexander City
71.0% of women with births in Alexander City are unmarried. Women with the educational attainment of bachelor's degree are most likely to be married with 100.0% of them married at childbirth, while women with the educational attainment of high school diploma are least likely to be married with 100.0% of them unmarried at childbirth.
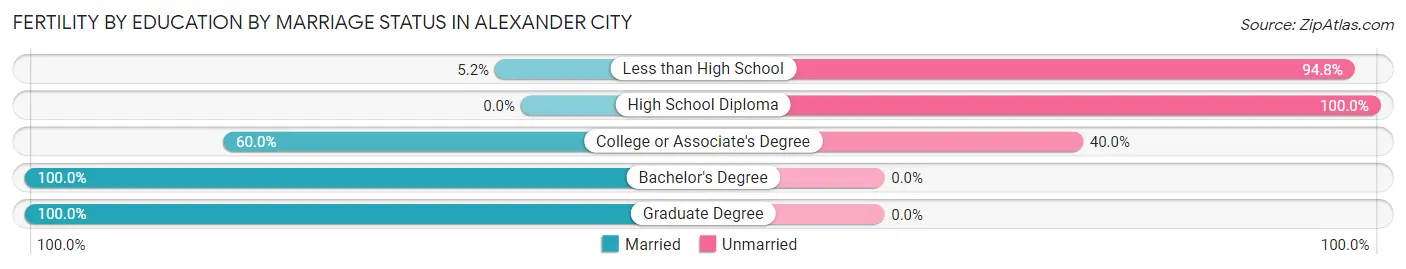
| Educational Attainment | Married | Unmarried |
| Less than High School | 8 (5.2%) | 145 (94.8%) |
| High School Diploma | 0 (0.0%) | 70 (100.0%) |
| College or Associate's Degree | 27 (60.0%) | 18 (40.0%) |
| Bachelor's Degree | 34 (100.0%) | 0 (0.0%) |
| Graduate Degree | 26 (100.0%) | 0 (0.0%) |
| Total | 95 (29.0%) | 233 (71.0%) |
Employment Characteristics in Alexander City
Employment by Class of Employer in Alexander City
Among the 5,260 employed individuals in Alexander City, private company employees (3,591 | 68.3%), local government employees (388 | 7.4%), and self-employed (not incorporated) (369 | 7.0%) make up the most common classes of employment.
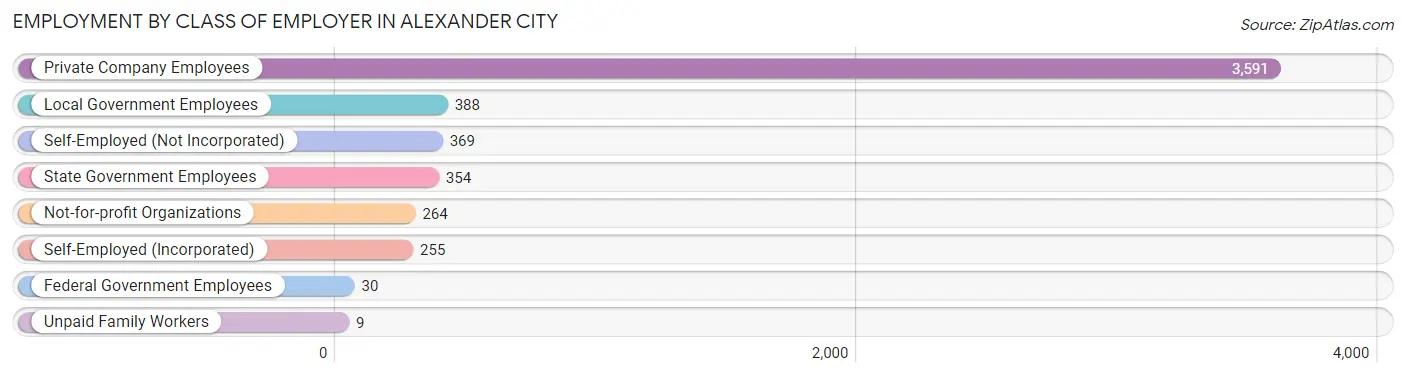
| Employer Class | # Employees | % Employees |
| Private Company Employees | 3,591 | 68.3% |
| Self-Employed (Incorporated) | 255 | 4.9% |
| Self-Employed (Not Incorporated) | 369 | 7.0% |
| Not-for-profit Organizations | 264 | 5.0% |
| Local Government Employees | 388 | 7.4% |
| State Government Employees | 354 | 6.7% |
| Federal Government Employees | 30 | 0.6% |
| Unpaid Family Workers | 9 | 0.2% |
| Total | 5,260 | 100.0% |
Employment Status by Age in Alexander City
According to the labor force statistics for Alexander City, out of the total population over 16 years of age (11,660), 49.8% or 5,807 individuals are in the labor force, with 8.2% or 476 of them unemployed. The age group with the highest labor force participation rate is 55 to 59 years, with 74.7% or 796 individuals in the labor force. Within the labor force, the 20 to 24 years age range has the highest percentage of unemployed individuals, with 32.1% or 142 of them being unemployed.
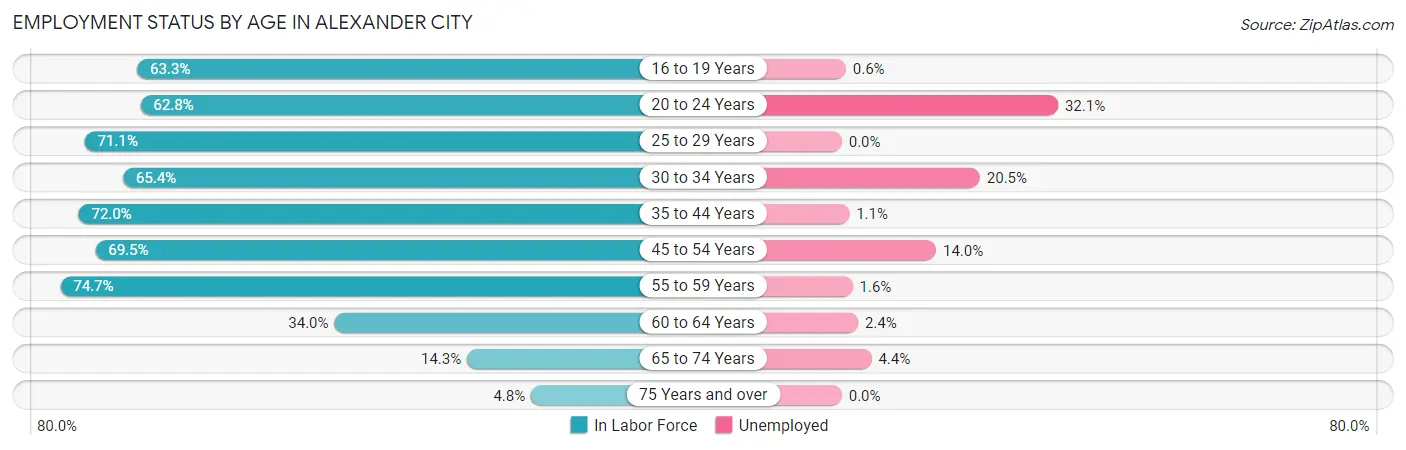
| Age Bracket | In Labor Force | Unemployed |
| 16 to 19 Years | 534 (63.3%) | 3 (0.6%) |
| 20 to 24 Years | 442 (62.8%) | 142 (32.1%) |
| 25 to 29 Years | 594 (71.1%) | 0 (0.0%) |
| 30 to 34 Years | 614 (65.4%) | 126 (20.5%) |
| 35 to 44 Years | 984 (72.0%) | 11 (1.1%) |
| 45 to 54 Years | 1,132 (69.5%) | 158 (14.0%) |
| 55 to 59 Years | 796 (74.7%) | 13 (1.6%) |
| 60 to 64 Years | 377 (34.0%) | 9 (2.4%) |
| 65 to 74 Years | 272 (14.3%) | 12 (4.4%) |
| 75 Years and over | 61 (4.8%) | 0 (0.0%) |
| Total | 5,807 (49.8%) | 476 (8.2%) |
Employment Status by Educational Attainment in Alexander City
According to labor force statistics for Alexander City, 64.8% of individuals (4,498) out of the total population between 25 and 64 years of age (6,942) are in the labor force, with 7.0% or 315 of them being unemployed. The group with the highest labor force participation rate are those with the educational attainment of bachelor's degree or higher, with 79.9% or 888 individuals in the labor force. Within the labor force, individuals with college / associate degree education have the highest percentage of unemployment, with 12.5% or 191 of them being unemployed.
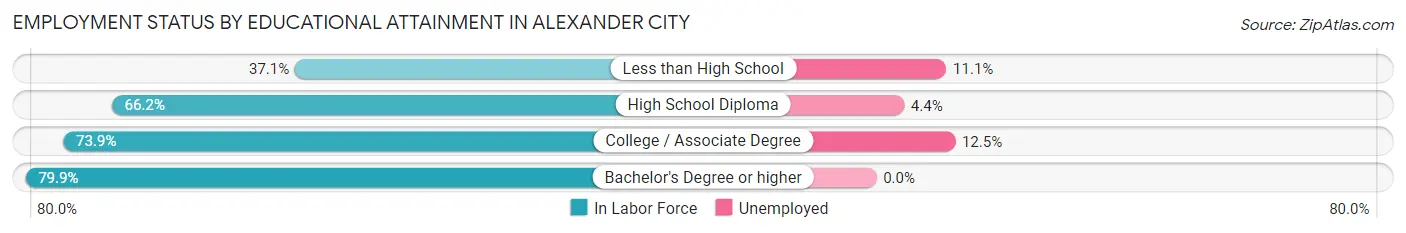
| Educational Attainment | In Labor Force | Unemployed |
| Less than High School | 522 (37.1%) | 156 (11.1%) |
| High School Diploma | 1,557 (66.2%) | 103 (4.4%) |
| College / Associate Degree | 1,530 (73.9%) | 259 (12.5%) |
| Bachelor's Degree or higher | 888 (79.9%) | 0 (0.0%) |
| Total | 4,498 (64.8%) | 486 (7.0%) |
Employment Occupations by Sex in Alexander City
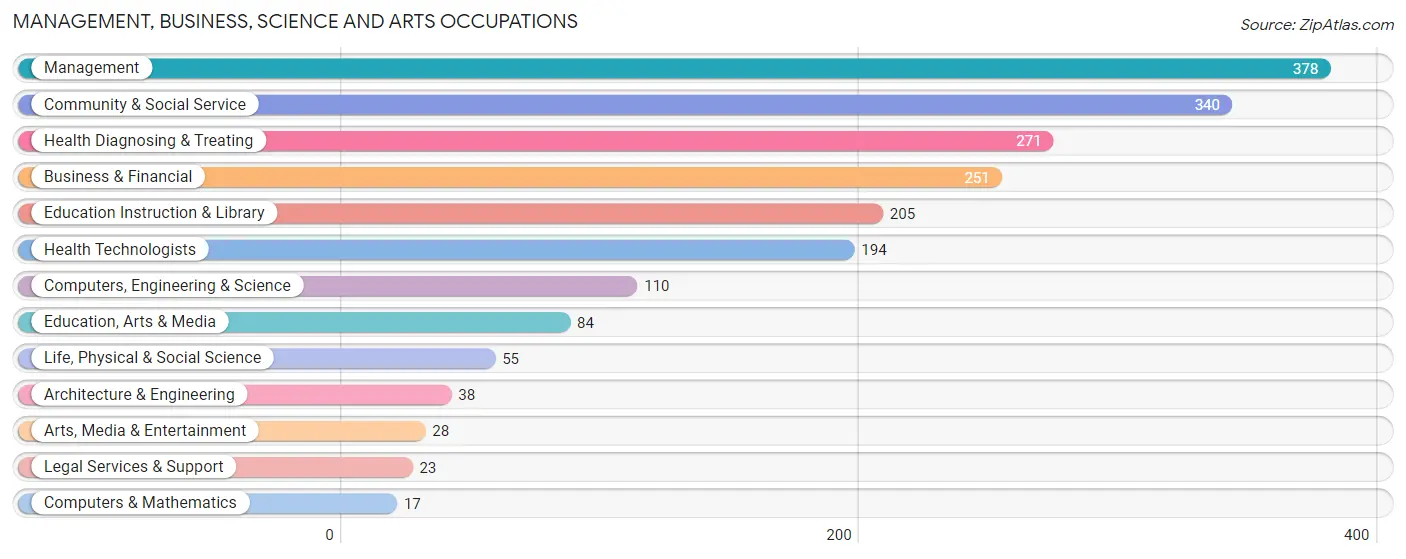
Management, Business, Science and Arts Occupations
The most common Management, Business, Science and Arts occupations in Alexander City are Management (378 | 7.1%), Community & Social Service (340 | 6.4%), Health Diagnosing & Treating (271 | 5.1%), Business & Financial (251 | 4.7%), and Education Instruction & Library (205 | 3.8%).
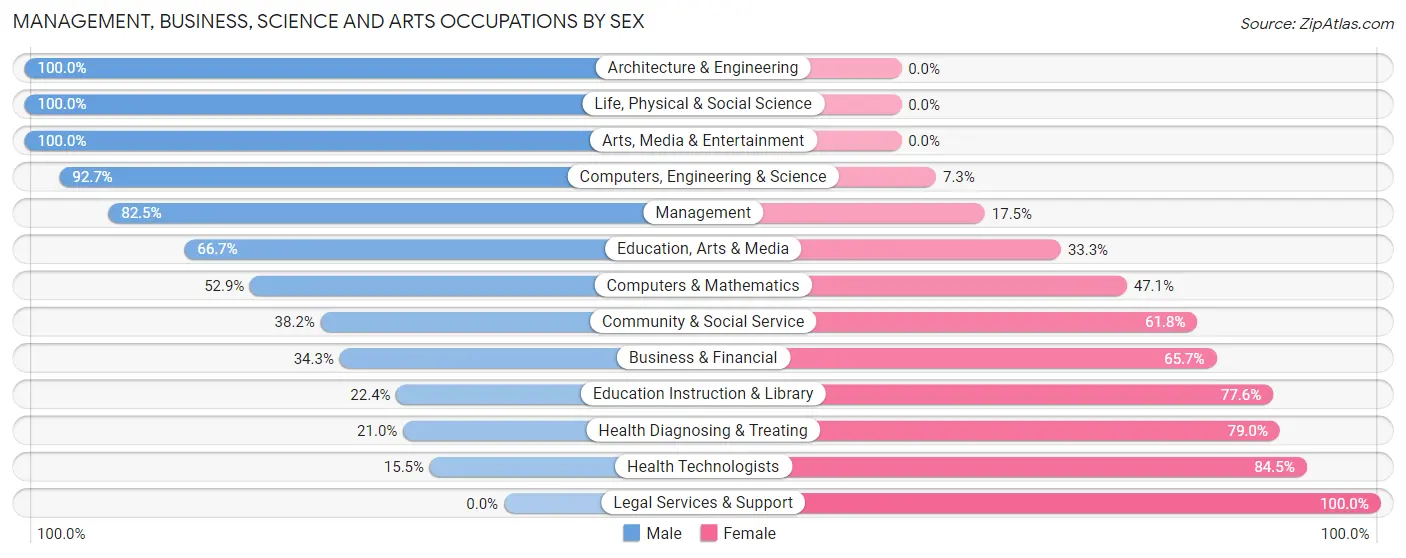
Management, Business, Science and Arts Occupations by Sex
Within the Management, Business, Science and Arts occupations in Alexander City, the most male-oriented occupations are Architecture & Engineering (100.0%), Life, Physical & Social Science (100.0%), and Arts, Media & Entertainment (100.0%), while the most female-oriented occupations are Legal Services & Support (100.0%), Health Technologists (84.5%), and Health Diagnosing & Treating (79.0%).
| Occupation | Male | Female |
| Management | 312 (82.5%) | 66 (17.5%) |
| Business & Financial | 86 (34.3%) | 165 (65.7%) |
| Computers, Engineering & Science | 102 (92.7%) | 8 (7.3%) |
| Computers & Mathematics | 9 (52.9%) | 8 (47.1%) |
| Architecture & Engineering | 38 (100.0%) | 0 (0.0%) |
| Life, Physical & Social Science | 55 (100.0%) | 0 (0.0%) |
| Community & Social Service | 130 (38.2%) | 210 (61.8%) |
| Education, Arts & Media | 56 (66.7%) | 28 (33.3%) |
| Legal Services & Support | 0 (0.0%) | 23 (100.0%) |
| Education Instruction & Library | 46 (22.4%) | 159 (77.6%) |
| Arts, Media & Entertainment | 28 (100.0%) | 0 (0.0%) |
| Health Diagnosing & Treating | 57 (21.0%) | 214 (79.0%) |
| Health Technologists | 30 (15.5%) | 164 (84.5%) |
| Total (Category) | 687 (50.9%) | 663 (49.1%) |
| Total (Overall) | 3,224 (60.5%) | 2,108 (39.5%) |
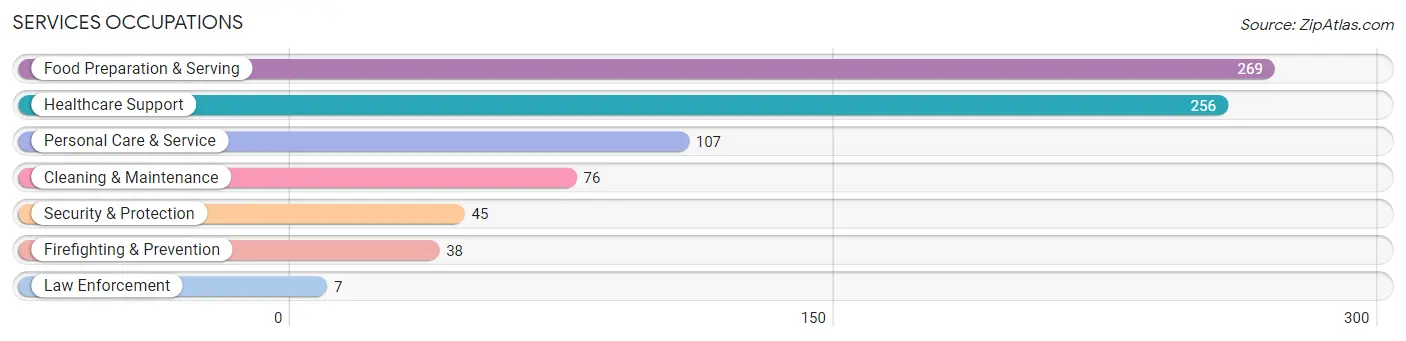
Services Occupations
The most common Services occupations in Alexander City are Food Preparation & Serving (269 | 5.1%), Healthcare Support (256 | 4.8%), Personal Care & Service (107 | 2.0%), Cleaning & Maintenance (76 | 1.4%), and Security & Protection (45 | 0.8%).
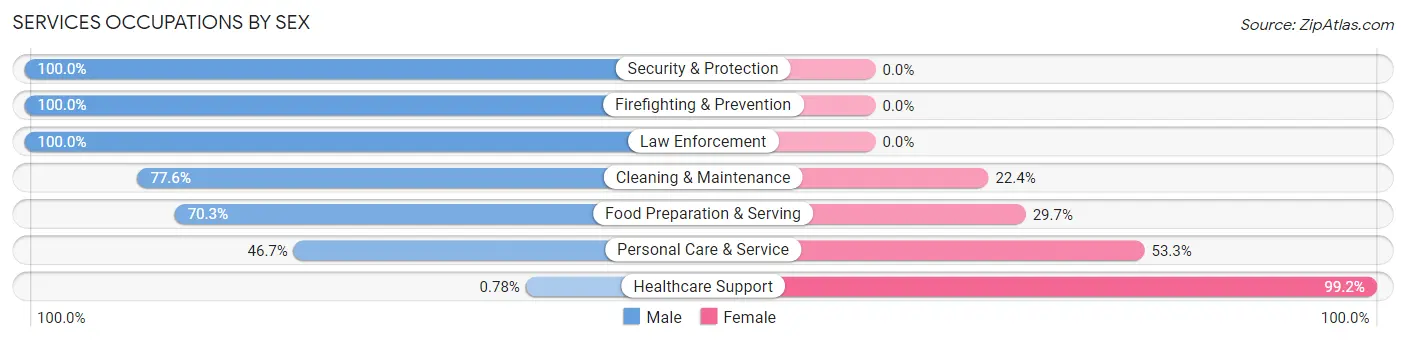
Services Occupations by Sex
Within the Services occupations in Alexander City, the most male-oriented occupations are Security & Protection (100.0%), Firefighting & Prevention (100.0%), and Law Enforcement (100.0%), while the most female-oriented occupations are Healthcare Support (99.2%), Personal Care & Service (53.3%), and Food Preparation & Serving (29.7%).
| Occupation | Male | Female |
| Healthcare Support | 2 (0.8%) | 254 (99.2%) |
| Security & Protection | 45 (100.0%) | 0 (0.0%) |
| Firefighting & Prevention | 38 (100.0%) | 0 (0.0%) |
| Law Enforcement | 7 (100.0%) | 0 (0.0%) |
| Food Preparation & Serving | 189 (70.3%) | 80 (29.7%) |
| Cleaning & Maintenance | 59 (77.6%) | 17 (22.4%) |
| Personal Care & Service | 50 (46.7%) | 57 (53.3%) |
| Total (Category) | 345 (45.8%) | 408 (54.2%) |
| Total (Overall) | 3,224 (60.5%) | 2,108 (39.5%) |
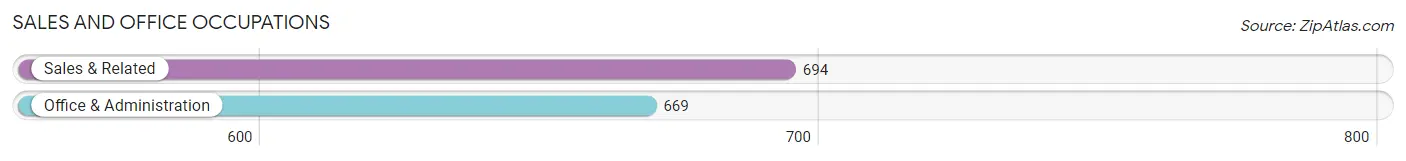
Sales and Office Occupations
The most common Sales and Office occupations in Alexander City are Sales & Related (694 | 13.0%), and Office & Administration (669 | 12.6%).
Sales and Office Occupations by Sex
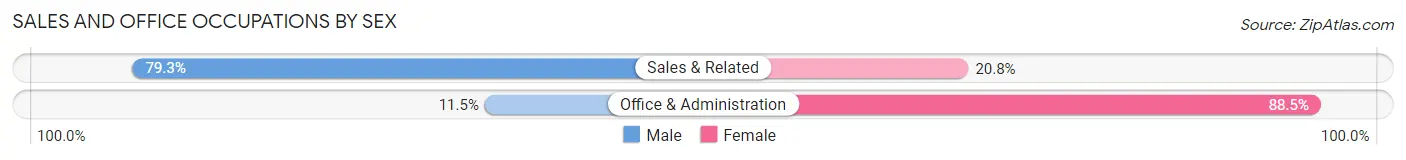
| Occupation | Male | Female |
| Sales & Related | 550 (79.2%) | 144 (20.7%) |
| Office & Administration | 77 (11.5%) | 592 (88.5%) |
| Total (Category) | 627 (46.0%) | 736 (54.0%) |
| Total (Overall) | 3,224 (60.5%) | 2,108 (39.5%) |
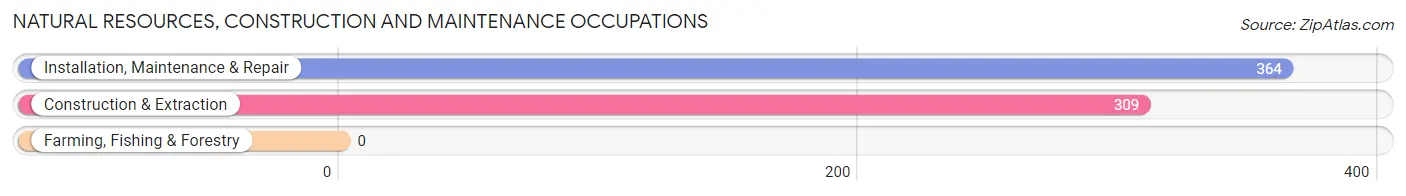
Natural Resources, Construction and Maintenance Occupations
The most common Natural Resources, Construction and Maintenance occupations in Alexander City are Installation, Maintenance & Repair (364 | 6.8%), and Construction & Extraction (309 | 5.8%).
Natural Resources, Construction and Maintenance Occupations by Sex
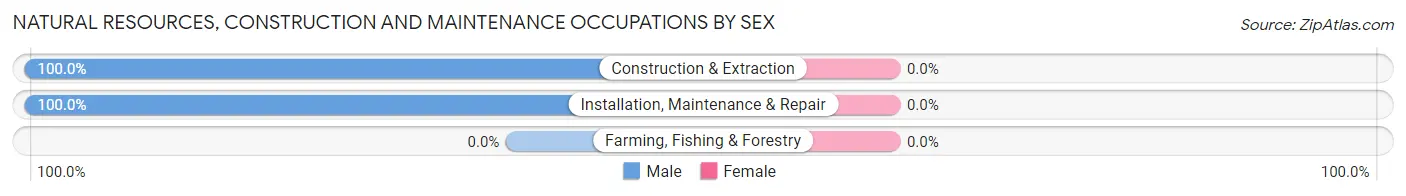
| Occupation | Male | Female |
| Farming, Fishing & Forestry | 0 (0.0%) | 0 (0.0%) |
| Construction & Extraction | 309 (100.0%) | 0 (0.0%) |
| Installation, Maintenance & Repair | 364 (100.0%) | 0 (0.0%) |
| Total (Category) | 673 (100.0%) | 0 (0.0%) |
| Total (Overall) | 3,224 (60.5%) | 2,108 (39.5%) |
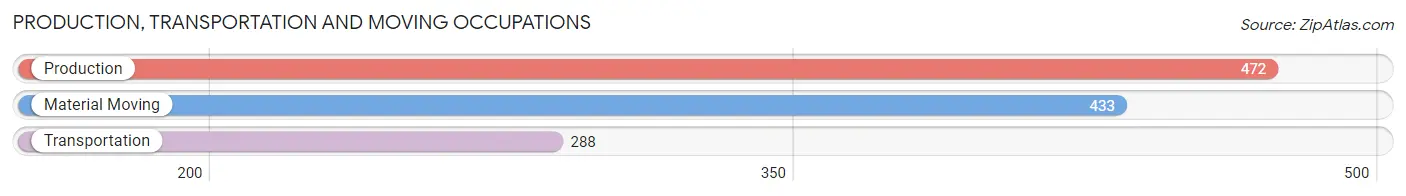
Production, Transportation and Moving Occupations
The most common Production, Transportation and Moving occupations in Alexander City are Production (472 | 8.8%), Material Moving (433 | 8.1%), and Transportation (288 | 5.4%).
Production, Transportation and Moving Occupations by Sex
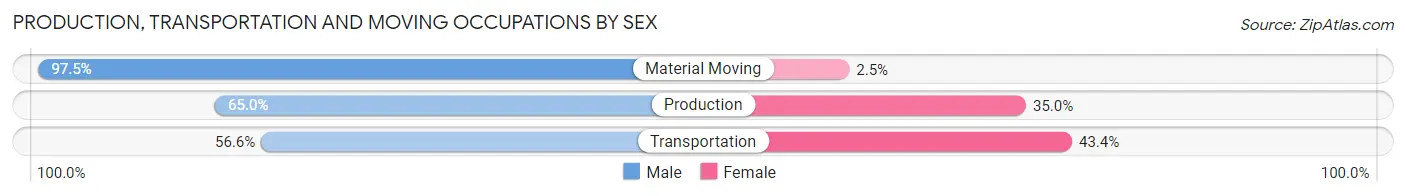
| Occupation | Male | Female |
| Production | 307 (65.0%) | 165 (35.0%) |
| Transportation | 163 (56.6%) | 125 (43.4%) |
| Material Moving | 422 (97.5%) | 11 (2.5%) |
| Total (Category) | 892 (74.8%) | 301 (25.2%) |
| Total (Overall) | 3,224 (60.5%) | 2,108 (39.5%) |
Employment Industries by Sex in Alexander City
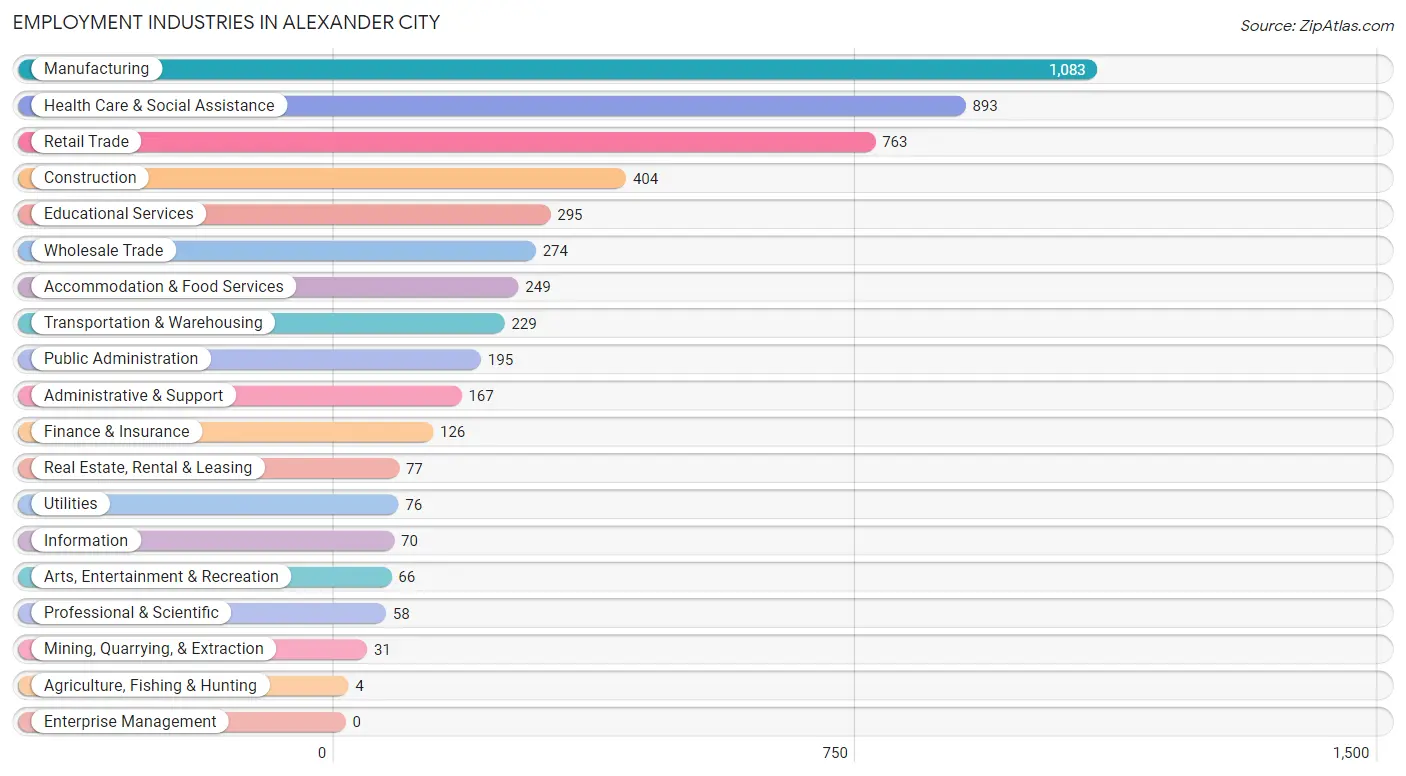
Employment Industries in Alexander City
The major employment industries in Alexander City include Manufacturing (1,083 | 20.3%), Health Care & Social Assistance (893 | 16.8%), Retail Trade (763 | 14.3%), Construction (404 | 7.6%), and Educational Services (295 | 5.5%).
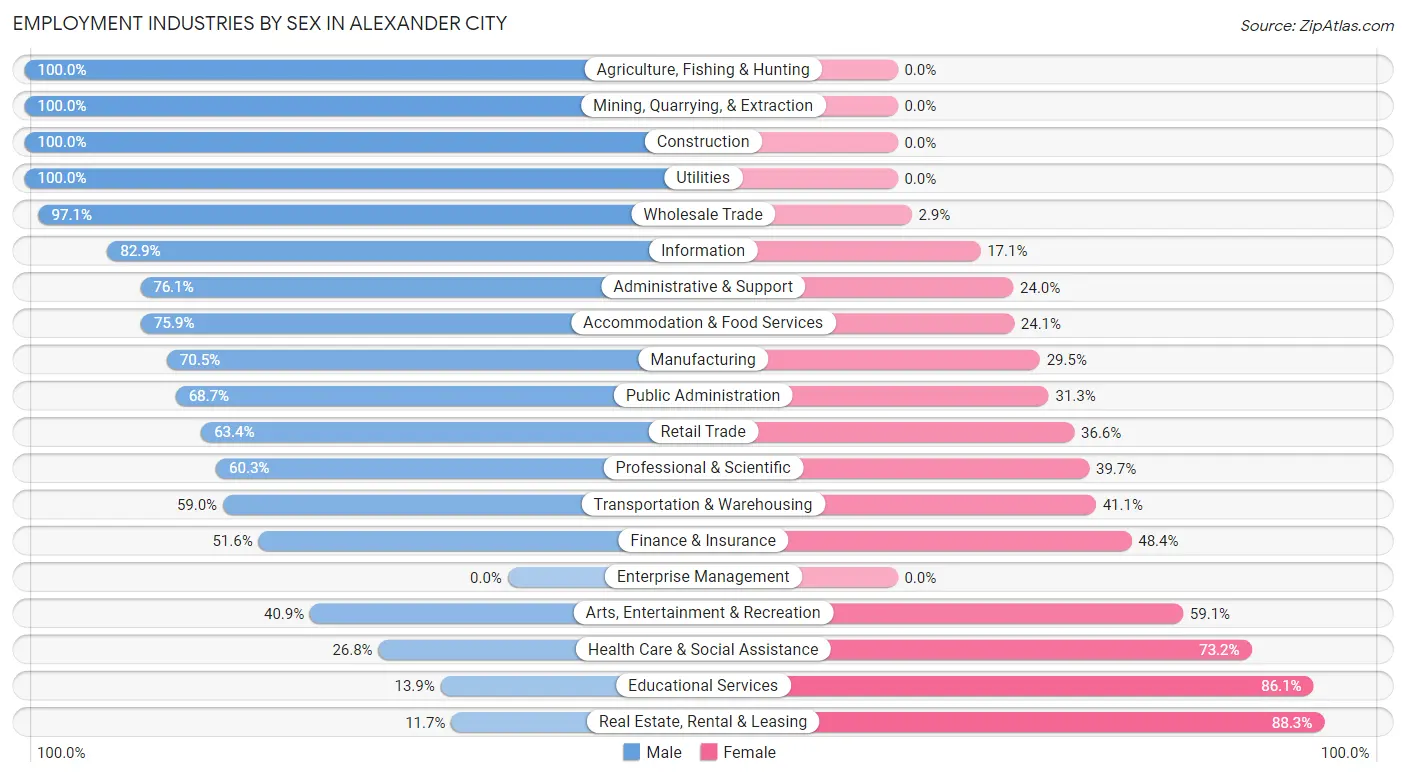
Employment Industries by Sex in Alexander City
The Alexander City industries that see more men than women are Agriculture, Fishing & Hunting (100.0%), Mining, Quarrying, & Extraction (100.0%), and Construction (100.0%), whereas the industries that tend to have a higher number of women are Real Estate, Rental & Leasing (88.3%), Educational Services (86.1%), and Health Care & Social Assistance (73.2%).
| Industry | Male | Female |
| Agriculture, Fishing & Hunting | 4 (100.0%) | 0 (0.0%) |
| Mining, Quarrying, & Extraction | 31 (100.0%) | 0 (0.0%) |
| Construction | 404 (100.0%) | 0 (0.0%) |
| Manufacturing | 764 (70.5%) | 319 (29.5%) |
| Wholesale Trade | 266 (97.1%) | 8 (2.9%) |
| Retail Trade | 484 (63.4%) | 279 (36.6%) |
| Transportation & Warehousing | 135 (59.0%) | 94 (41.0%) |
| Utilities | 76 (100.0%) | 0 (0.0%) |
| Information | 58 (82.9%) | 12 (17.1%) |
| Finance & Insurance | 65 (51.6%) | 61 (48.4%) |
| Real Estate, Rental & Leasing | 9 (11.7%) | 68 (88.3%) |
| Professional & Scientific | 35 (60.3%) | 23 (39.7%) |
| Enterprise Management | 0 (0.0%) | 0 (0.0%) |
| Administrative & Support | 127 (76.0%) | 40 (23.9%) |
| Educational Services | 41 (13.9%) | 254 (86.1%) |
| Health Care & Social Assistance | 239 (26.8%) | 654 (73.2%) |
| Arts, Entertainment & Recreation | 27 (40.9%) | 39 (59.1%) |
| Accommodation & Food Services | 189 (75.9%) | 60 (24.1%) |
| Public Administration | 134 (68.7%) | 61 (31.3%) |
| Total | 3,224 (60.5%) | 2,108 (39.5%) |
Education in Alexander City
School Enrollment in Alexander City
The most common levels of schooling among the 2,853 students in Alexander City are elementary school (918 | 32.2%), middle school (609 | 21.3%), and college / undergraduate (446 | 15.6%).
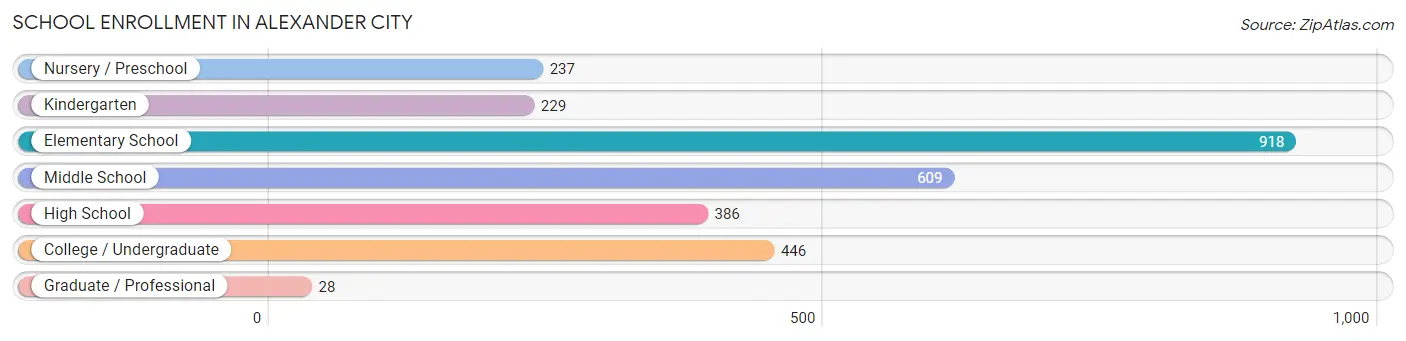
| School Level | # Students | % Students |
| Nursery / Preschool | 237 | 8.3% |
| Kindergarten | 229 | 8.0% |
| Elementary School | 918 | 32.2% |
| Middle School | 609 | 21.3% |
| High School | 386 | 13.5% |
| College / Undergraduate | 446 | 15.6% |
| Graduate / Professional | 28 | 1.0% |
| Total | 2,853 | 100.0% |
School Enrollment by Age by Funding Source in Alexander City
Out of a total of 2,853 students who are enrolled in schools in Alexander City, 217 (7.6%) attend a private institution, while the remaining 2,636 (92.4%) are enrolled in public schools. The age group of 25 to 34 year olds has the highest likelihood of being enrolled in private schools, with 57 (33.5% in the age bracket) enrolled. Conversely, the age group of 15 to 17 year olds has the lowest likelihood of being enrolled in a private school, with 308 (100.0% in the age bracket) attending a public institution.
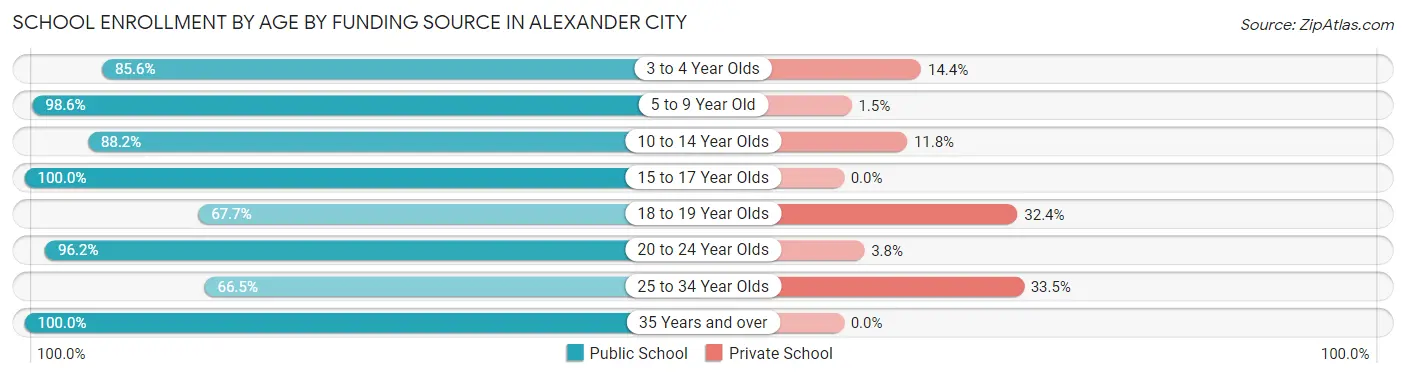
| Age Bracket | Public School | Private School |
| 3 to 4 Year Olds | 178 (85.6%) | 30 (14.4%) |
| 5 to 9 Year Old | 1,021 (98.6%) | 15 (1.5%) |
| 10 to 14 Year Olds | 703 (88.2%) | 94 (11.8%) |
| 15 to 17 Year Olds | 308 (100.0%) | 0 (0.0%) |
| 18 to 19 Year Olds | 23 (67.6%) | 11 (32.4%) |
| 20 to 24 Year Olds | 277 (96.2%) | 11 (3.8%) |
| 25 to 34 Year Olds | 113 (66.5%) | 57 (33.5%) |
| 35 Years and over | 12 (100.0%) | 0 (0.0%) |
| Total | 2,636 (92.4%) | 217 (7.6%) |
Educational Attainment by Field of Study in Alexander City
Business (541 | 27.8%), education (537 | 27.6%), science & technology (145 | 7.4%), arts & humanities (139 | 7.1%), and bio, nature & agricultural (122 | 6.3%) are the most common fields of study among 1,947 individuals in Alexander City who have obtained a bachelor's degree or higher.
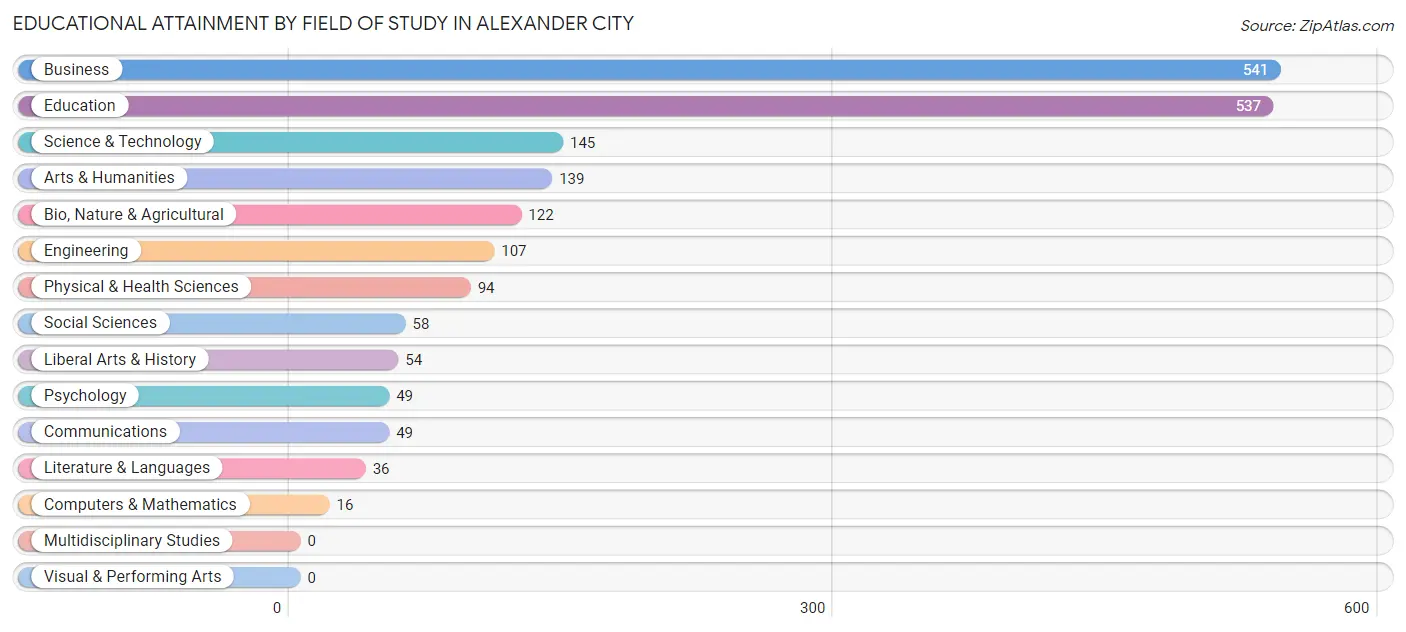
| Field of Study | # Graduates | % Graduates |
| Computers & Mathematics | 16 | 0.8% |
| Bio, Nature & Agricultural | 122 | 6.3% |
| Physical & Health Sciences | 94 | 4.8% |
| Psychology | 49 | 2.5% |
| Social Sciences | 58 | 3.0% |
| Engineering | 107 | 5.5% |
| Multidisciplinary Studies | 0 | 0.0% |
| Science & Technology | 145 | 7.4% |
| Business | 541 | 27.8% |
| Education | 537 | 27.6% |
| Literature & Languages | 36 | 1.8% |
| Liberal Arts & History | 54 | 2.8% |
| Visual & Performing Arts | 0 | 0.0% |
| Communications | 49 | 2.5% |
| Arts & Humanities | 139 | 7.1% |
| Total | 1,947 | 100.0% |
Transportation & Commute in Alexander City
Vehicle Availability by Sex in Alexander City
The most prevalent vehicle ownership categories in Alexander City are males with 2 vehicles (1,248, accounting for 39.0%) and females with 2 vehicles (815, making up 61.3%).
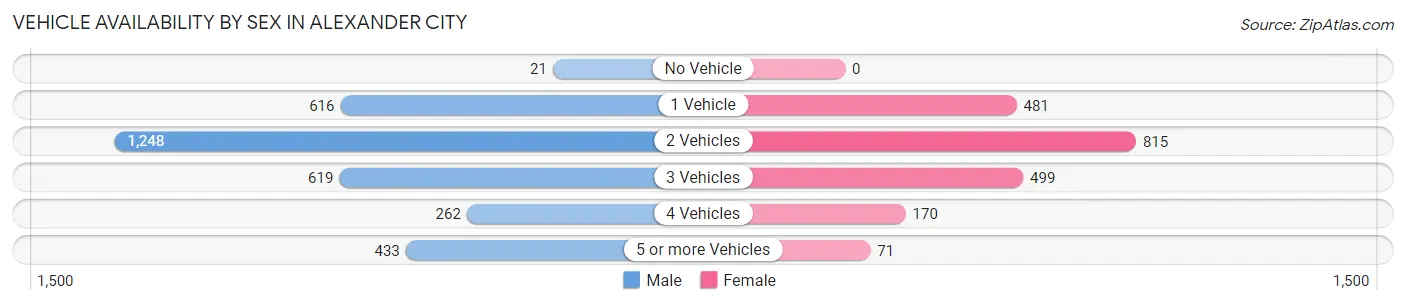
| Vehicles Available | Male | Female |
| No Vehicle | 21 (0.7%) | 0 (0.0%) |
| 1 Vehicle | 616 (19.3%) | 481 (23.6%) |
| 2 Vehicles | 1,248 (39.0%) | 815 (40.0%) |
| 3 Vehicles | 619 (19.4%) | 499 (24.5%) |
| 4 Vehicles | 262 (8.2%) | 170 (8.4%) |
| 5 or more Vehicles | 433 (13.5%) | 71 (3.5%) |
| Total | 3,199 (100.0%) | 2,036 (100.0%) |
Commute Time in Alexander City
The most frequently occuring commute durations in Alexander City are 5 to 9 minutes (1,236 commuters, 24.5%), 10 to 14 minutes (1,065 commuters, 21.1%), and 15 to 19 minutes (669 commuters, 13.3%).
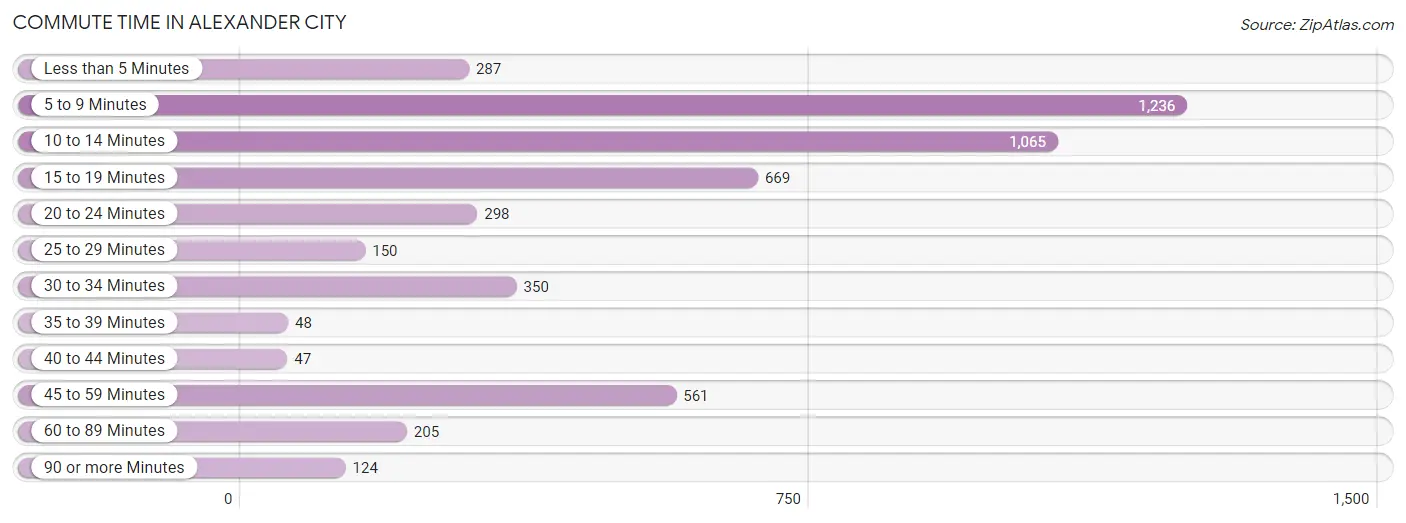
| Commute Time | # Commuters | % Commuters |
| Less than 5 Minutes | 287 | 5.7% |
| 5 to 9 Minutes | 1,236 | 24.5% |
| 10 to 14 Minutes | 1,065 | 21.1% |
| 15 to 19 Minutes | 669 | 13.3% |
| 20 to 24 Minutes | 298 | 5.9% |
| 25 to 29 Minutes | 150 | 3.0% |
| 30 to 34 Minutes | 350 | 6.9% |
| 35 to 39 Minutes | 48 | 0.9% |
| 40 to 44 Minutes | 47 | 0.9% |
| 45 to 59 Minutes | 561 | 11.1% |
| 60 to 89 Minutes | 205 | 4.1% |
| 90 or more Minutes | 124 | 2.5% |
Commute Time by Sex in Alexander City
The most common commute times in Alexander City are 5 to 9 minutes (869 commuters, 28.6%) for males and 10 to 14 minutes (470 commuters, 23.5%) for females.
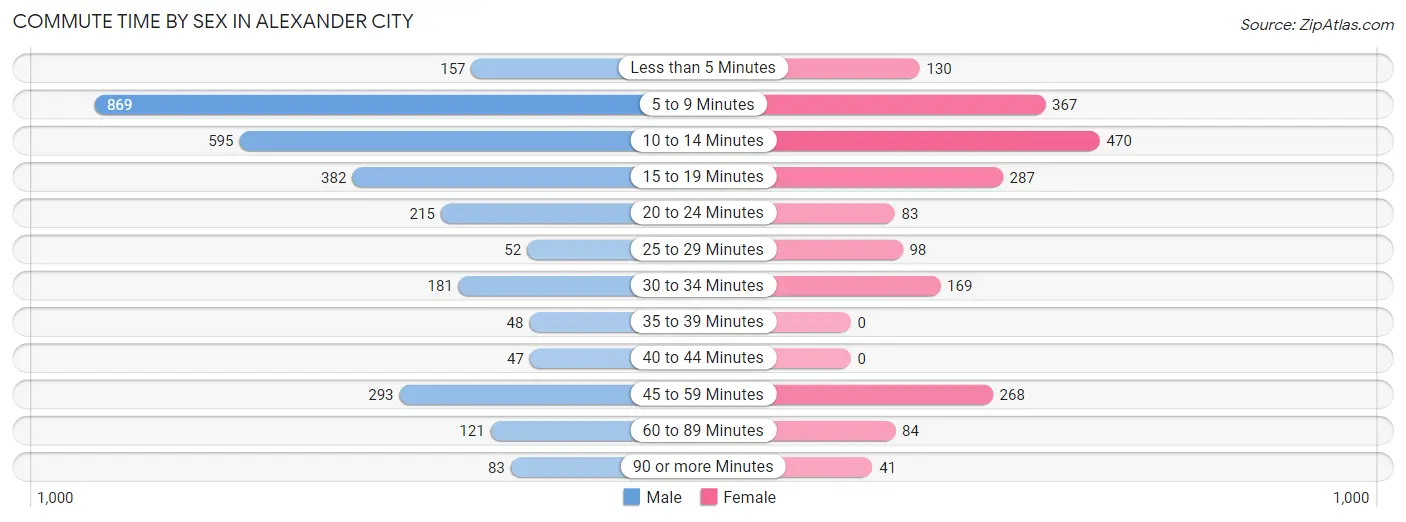
| Commute Time | Male | Female |
| Less than 5 Minutes | 157 (5.2%) | 130 (6.5%) |
| 5 to 9 Minutes | 869 (28.6%) | 367 (18.4%) |
| 10 to 14 Minutes | 595 (19.6%) | 470 (23.5%) |
| 15 to 19 Minutes | 382 (12.6%) | 287 (14.4%) |
| 20 to 24 Minutes | 215 (7.1%) | 83 (4.2%) |
| 25 to 29 Minutes | 52 (1.7%) | 98 (4.9%) |
| 30 to 34 Minutes | 181 (5.9%) | 169 (8.5%) |
| 35 to 39 Minutes | 48 (1.6%) | 0 (0.0%) |
| 40 to 44 Minutes | 47 (1.5%) | 0 (0.0%) |
| 45 to 59 Minutes | 293 (9.6%) | 268 (13.4%) |
| 60 to 89 Minutes | 121 (4.0%) | 84 (4.2%) |
| 90 or more Minutes | 83 (2.7%) | 41 (2.1%) |
Time of Departure to Work by Sex in Alexander City
The most frequent times of departure to work in Alexander City are 6:30 AM to 6:59 AM (385, 12.7%) for males and 6:30 AM to 6:59 AM (515, 25.8%) for females.
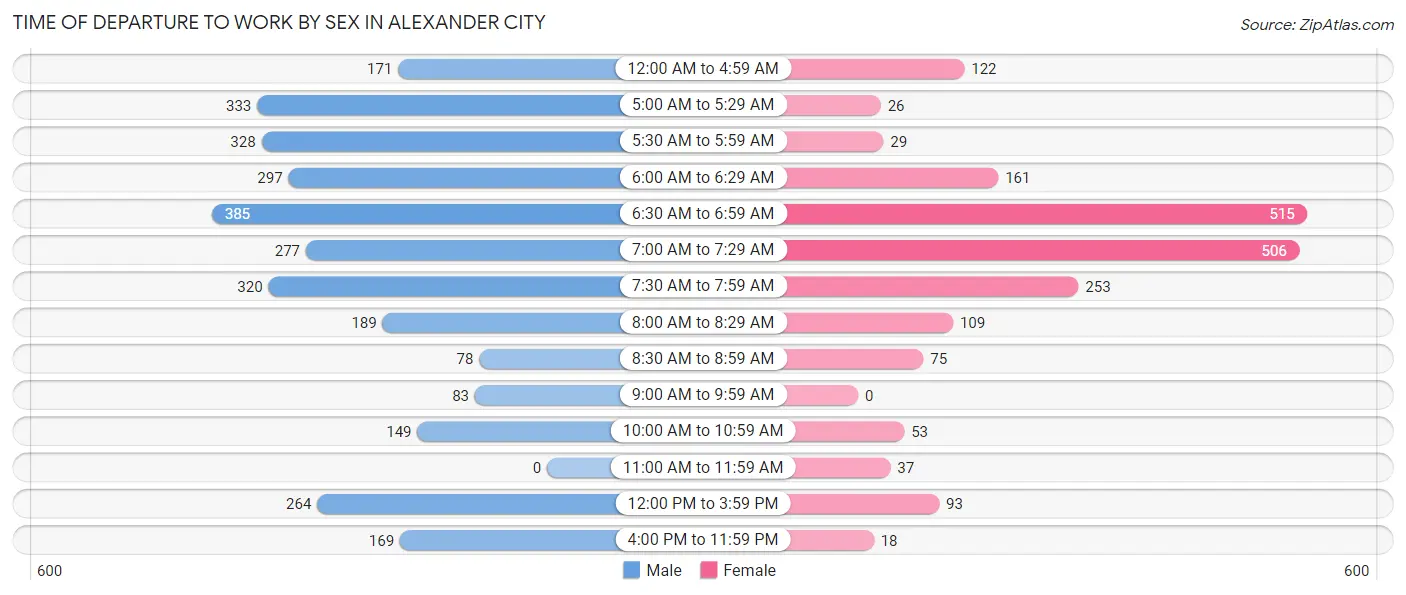
| Time of Departure | Male | Female |
| 12:00 AM to 4:59 AM | 171 (5.6%) | 122 (6.1%) |
| 5:00 AM to 5:29 AM | 333 (10.9%) | 26 (1.3%) |
| 5:30 AM to 5:59 AM | 328 (10.8%) | 29 (1.5%) |
| 6:00 AM to 6:29 AM | 297 (9.8%) | 161 (8.1%) |
| 6:30 AM to 6:59 AM | 385 (12.7%) | 515 (25.8%) |
| 7:00 AM to 7:29 AM | 277 (9.1%) | 506 (25.3%) |
| 7:30 AM to 7:59 AM | 320 (10.5%) | 253 (12.7%) |
| 8:00 AM to 8:29 AM | 189 (6.2%) | 109 (5.5%) |
| 8:30 AM to 8:59 AM | 78 (2.6%) | 75 (3.8%) |
| 9:00 AM to 9:59 AM | 83 (2.7%) | 0 (0.0%) |
| 10:00 AM to 10:59 AM | 149 (4.9%) | 53 (2.6%) |
| 11:00 AM to 11:59 AM | 0 (0.0%) | 37 (1.8%) |
| 12:00 PM to 3:59 PM | 264 (8.7%) | 93 (4.7%) |
| 4:00 PM to 11:59 PM | 169 (5.6%) | 18 (0.9%) |
| Total | 3,043 (100.0%) | 1,997 (100.0%) |
Housing Occupancy in Alexander City
Occupancy by Ownership in Alexander City
Of the total 5,978 dwellings in Alexander City, owner-occupied units account for 3,882 (64.9%), while renter-occupied units make up 2,096 (35.1%).
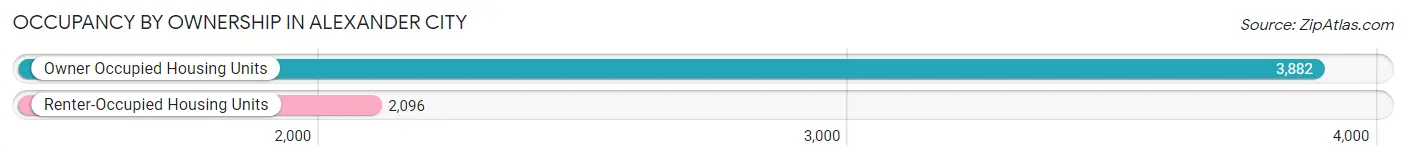
| Occupancy | # Housing Units | % Housing Units |
| Owner Occupied Housing Units | 3,882 | 64.9% |
| Renter-Occupied Housing Units | 2,096 | 35.1% |
| Total Occupied Housing Units | 5,978 | 100.0% |
Occupancy by Household Size in Alexander City
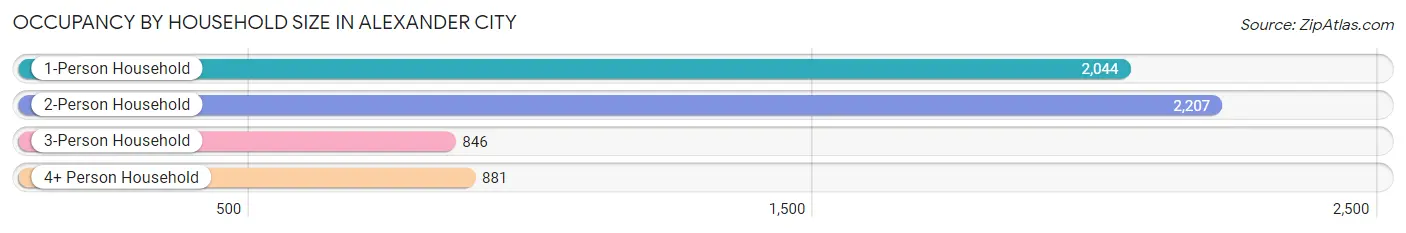
| Household Size | # Housing Units | % Housing Units |
| 1-Person Household | 2,044 | 34.2% |
| 2-Person Household | 2,207 | 36.9% |
| 3-Person Household | 846 | 14.1% |
| 4+ Person Household | 881 | 14.7% |
| Total Housing Units | 5,978 | 100.0% |
Occupancy by Ownership by Household Size in Alexander City
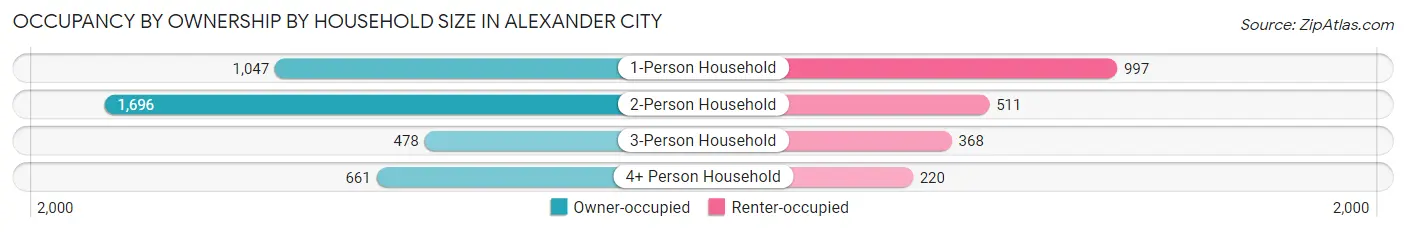
| Household Size | Owner-occupied | Renter-occupied |
| 1-Person Household | 1,047 (51.2%) | 997 (48.8%) |
| 2-Person Household | 1,696 (76.8%) | 511 (23.2%) |
| 3-Person Household | 478 (56.5%) | 368 (43.5%) |
| 4+ Person Household | 661 (75.0%) | 220 (25.0%) |
| Total Housing Units | 3,882 (64.9%) | 2,096 (35.1%) |
Occupancy by Educational Attainment in Alexander City
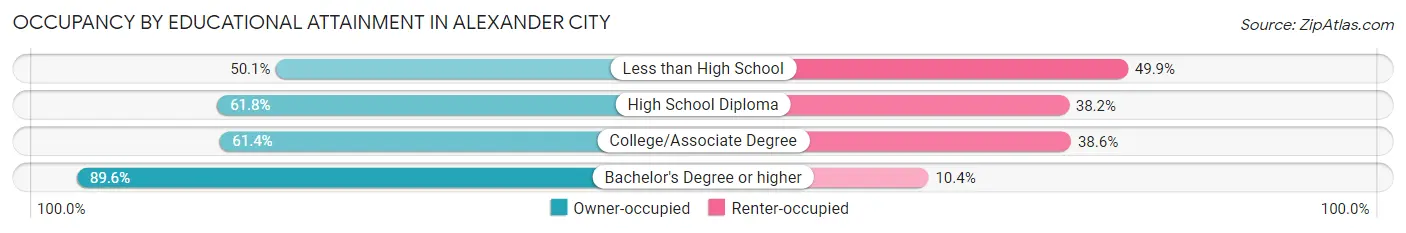
| Household Size | Owner-occupied | Renter-occupied |
| Less than High School | 506 (50.1%) | 504 (49.9%) |
| High School Diploma | 1,183 (61.8%) | 731 (38.2%) |
| College/Associate Degree | 1,182 (61.4%) | 744 (38.6%) |
| Bachelor's Degree or higher | 1,011 (89.6%) | 117 (10.4%) |
Occupancy by Age of Householder in Alexander City
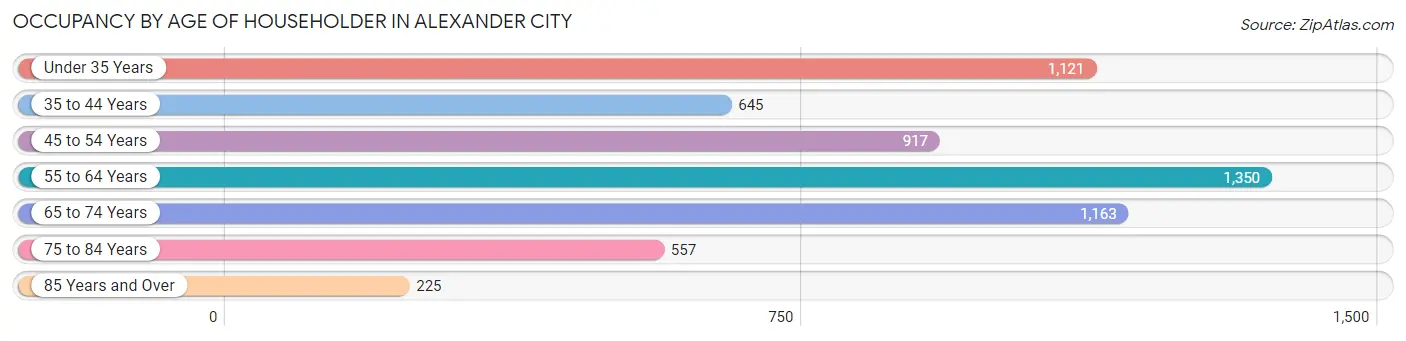
| Age Bracket | # Households | % Households |
| Under 35 Years | 1,121 | 18.8% |
| 35 to 44 Years | 645 | 10.8% |
| 45 to 54 Years | 917 | 15.3% |
| 55 to 64 Years | 1,350 | 22.6% |
| 65 to 74 Years | 1,163 | 19.5% |
| 75 to 84 Years | 557 | 9.3% |
| 85 Years and Over | 225 | 3.8% |
| Total | 5,978 | 100.0% |
Housing Finances in Alexander City
Median Income by Occupancy in Alexander City
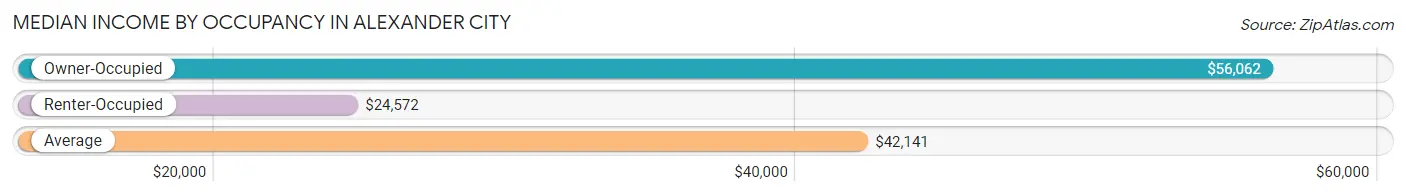
| Occupancy Type | # Households | Median Income |
| Owner-Occupied | 3,882 (64.9%) | $56,062 |
| Renter-Occupied | 2,096 (35.1%) | $24,572 |
| Average | 5,978 (100.0%) | $42,141 |
Occupancy by Householder Income Bracket in Alexander City
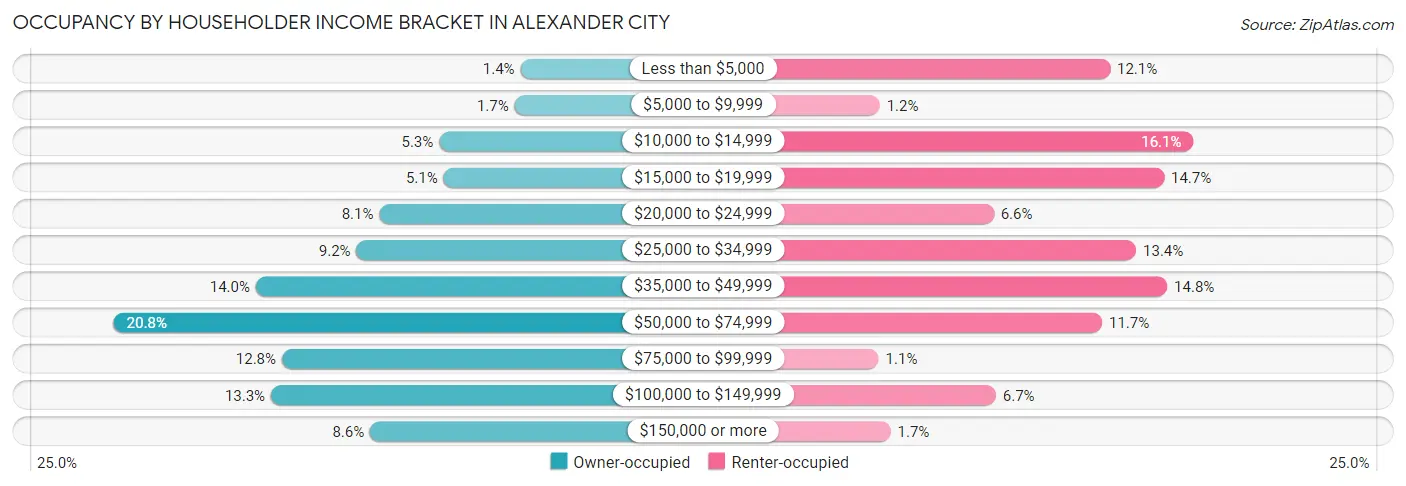
| Income Bracket | Owner-occupied | Renter-occupied |
| Less than $5,000 | 54 (1.4%) | 254 (12.1%) |
| $5,000 to $9,999 | 65 (1.7%) | 24 (1.1%) |
| $10,000 to $14,999 | 204 (5.3%) | 337 (16.1%) |
| $15,000 to $19,999 | 196 (5.1%) | 308 (14.7%) |
| $20,000 to $24,999 | 315 (8.1%) | 138 (6.6%) |
| $25,000 to $34,999 | 357 (9.2%) | 280 (13.4%) |
| $35,000 to $49,999 | 543 (14.0%) | 311 (14.8%) |
| $50,000 to $74,999 | 806 (20.8%) | 246 (11.7%) |
| $75,000 to $99,999 | 495 (12.8%) | 23 (1.1%) |
| $100,000 to $149,999 | 515 (13.3%) | 140 (6.7%) |
| $150,000 or more | 332 (8.6%) | 35 (1.7%) |
| Total | 3,882 (100.0%) | 2,096 (100.0%) |
Monthly Housing Cost Tiers in Alexander City
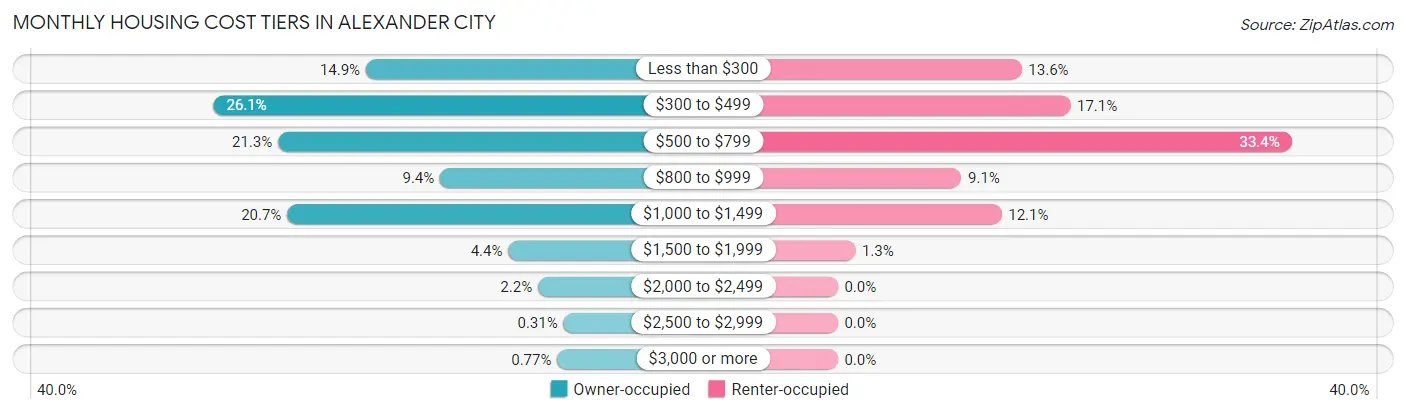
| Monthly Cost | Owner-occupied | Renter-occupied |
| Less than $300 | 577 (14.9%) | 284 (13.6%) |
| $300 to $499 | 1,013 (26.1%) | 359 (17.1%) |
| $500 to $799 | 828 (21.3%) | 701 (33.4%) |
| $800 to $999 | 365 (9.4%) | 191 (9.1%) |
| $1,000 to $1,499 | 802 (20.7%) | 253 (12.1%) |
| $1,500 to $1,999 | 170 (4.4%) | 27 (1.3%) |
| $2,000 to $2,499 | 85 (2.2%) | 0 (0.0%) |
| $2,500 to $2,999 | 12 (0.3%) | 0 (0.0%) |
| $3,000 or more | 30 (0.8%) | 0 (0.0%) |
| Total | 3,882 (100.0%) | 2,096 (100.0%) |
Physical Housing Characteristics in Alexander City
Housing Structures in Alexander City
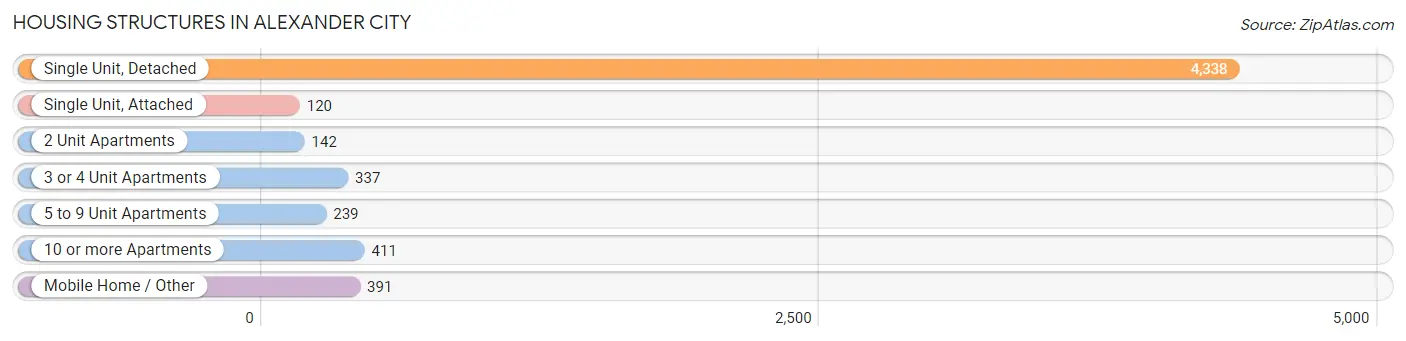
| Structure Type | # Housing Units | % Housing Units |
| Single Unit, Detached | 4,338 | 72.6% |
| Single Unit, Attached | 120 | 2.0% |
| 2 Unit Apartments | 142 | 2.4% |
| 3 or 4 Unit Apartments | 337 | 5.6% |
| 5 to 9 Unit Apartments | 239 | 4.0% |
| 10 or more Apartments | 411 | 6.9% |
| Mobile Home / Other | 391 | 6.5% |
| Total | 5,978 | 100.0% |
Housing Structures by Occupancy in Alexander City
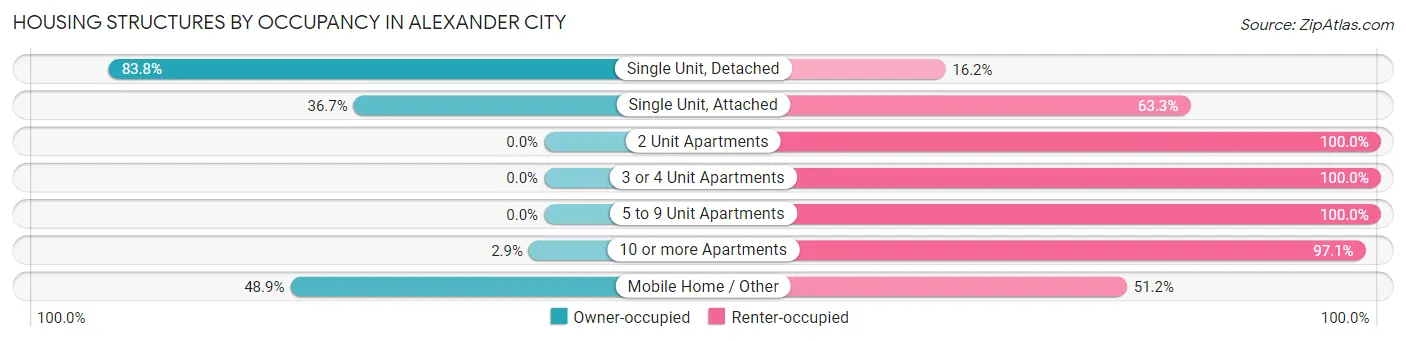
| Structure Type | Owner-occupied | Renter-occupied |
| Single Unit, Detached | 3,635 (83.8%) | 703 (16.2%) |
| Single Unit, Attached | 44 (36.7%) | 76 (63.3%) |
| 2 Unit Apartments | 0 (0.0%) | 142 (100.0%) |
| 3 or 4 Unit Apartments | 0 (0.0%) | 337 (100.0%) |
| 5 to 9 Unit Apartments | 0 (0.0%) | 239 (100.0%) |
| 10 or more Apartments | 12 (2.9%) | 399 (97.1%) |
| Mobile Home / Other | 191 (48.8%) | 200 (51.1%) |
| Total | 3,882 (64.9%) | 2,096 (35.1%) |
Housing Structures by Number of Rooms in Alexander City
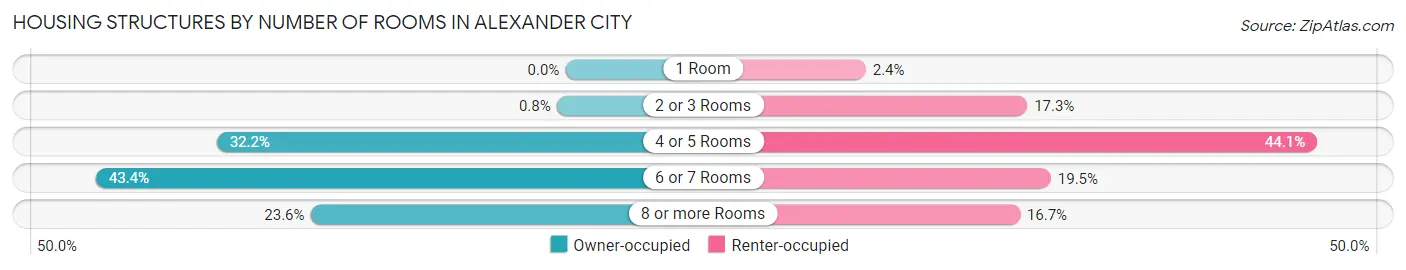
| Number of Rooms | Owner-occupied | Renter-occupied |
| 1 Room | 0 (0.0%) | 50 (2.4%) |
| 2 or 3 Rooms | 31 (0.8%) | 363 (17.3%) |
| 4 or 5 Rooms | 1,251 (32.2%) | 925 (44.1%) |
| 6 or 7 Rooms | 1,685 (43.4%) | 409 (19.5%) |
| 8 or more Rooms | 915 (23.6%) | 349 (16.7%) |
| Total | 3,882 (100.0%) | 2,096 (100.0%) |
Housing Structure by Heating Type in Alexander City
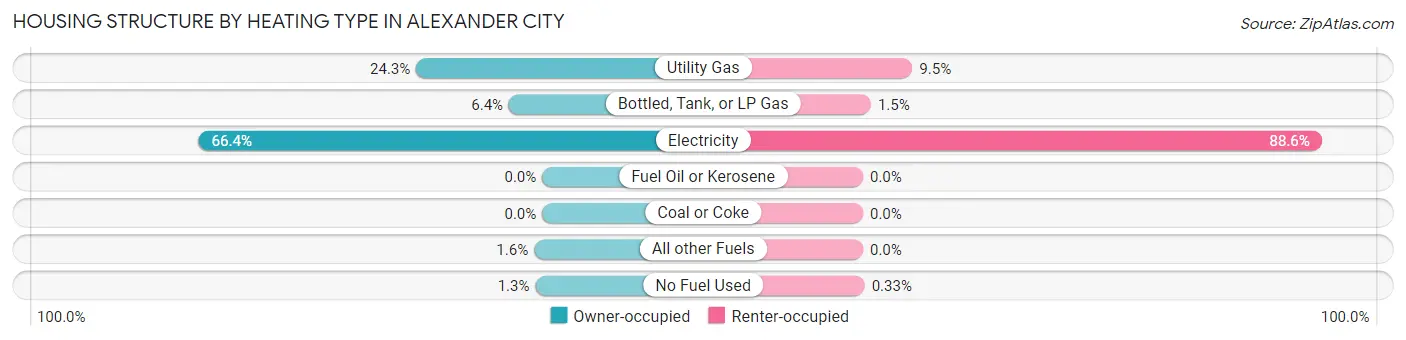
| Heating Type | Owner-occupied | Renter-occupied |
| Utility Gas | 945 (24.3%) | 200 (9.5%) |
| Bottled, Tank, or LP Gas | 249 (6.4%) | 32 (1.5%) |
| Electricity | 2,576 (66.4%) | 1,857 (88.6%) |
| Fuel Oil or Kerosene | 0 (0.0%) | 0 (0.0%) |
| Coal or Coke | 0 (0.0%) | 0 (0.0%) |
| All other Fuels | 61 (1.6%) | 0 (0.0%) |
| No Fuel Used | 51 (1.3%) | 7 (0.3%) |
| Total | 3,882 (100.0%) | 2,096 (100.0%) |
Household Vehicle Usage in Alexander City
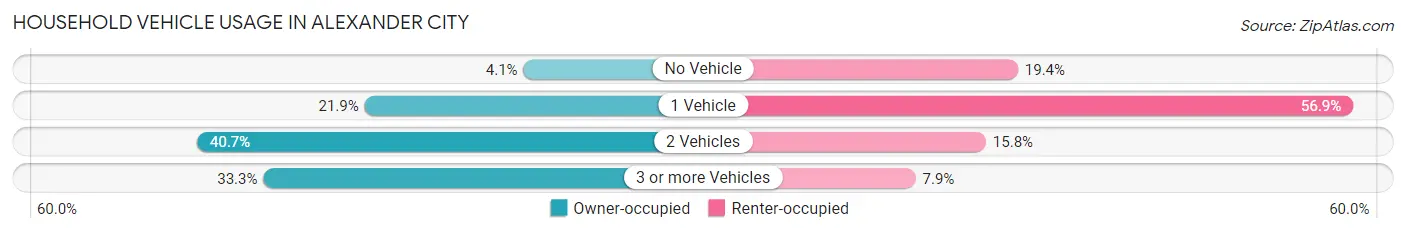
| Vehicles per Household | Owner-occupied | Renter-occupied |
| No Vehicle | 160 (4.1%) | 406 (19.4%) |
| 1 Vehicle | 851 (21.9%) | 1,193 (56.9%) |
| 2 Vehicles | 1,580 (40.7%) | 331 (15.8%) |
| 3 or more Vehicles | 1,291 (33.3%) | 166 (7.9%) |
| Total | 3,882 (100.0%) | 2,096 (100.0%) |
Real Estate & Mortgages in Alexander City
Real Estate and Mortgage Overview in Alexander City
| Characteristic | Without Mortgage | With Mortgage |
| Housing Units | 1,881 | 2,001 |
| Median Property Value | $139,700 | $115,700 |
| Median Household Income | $42,608 | $243 |
| Monthly Housing Costs | $395 | $30 |
| Real Estate Taxes | $425 | $472 |
Property Value by Mortgage Status in Alexander City
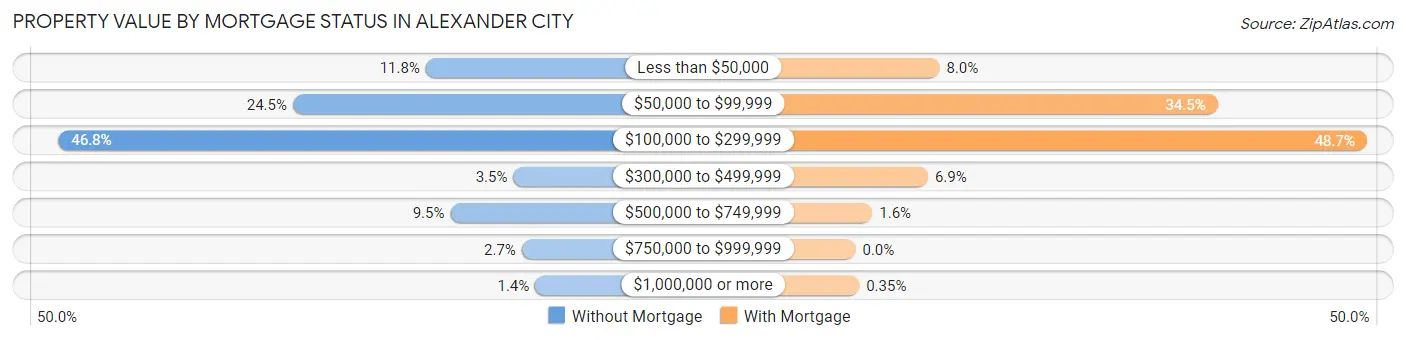
| Property Value | Without Mortgage | With Mortgage |
| Less than $50,000 | 222 (11.8%) | 160 (8.0%) |
| $50,000 to $99,999 | 460 (24.5%) | 690 (34.5%) |
| $100,000 to $299,999 | 880 (46.8%) | 974 (48.7%) |
| $300,000 to $499,999 | 65 (3.5%) | 138 (6.9%) |
| $500,000 to $749,999 | 178 (9.5%) | 32 (1.6%) |
| $750,000 to $999,999 | 50 (2.7%) | 0 (0.0%) |
| $1,000,000 or more | 26 (1.4%) | 7 (0.4%) |
| Total | 1,881 (100.0%) | 2,001 (100.0%) |
Household Income by Mortgage Status in Alexander City
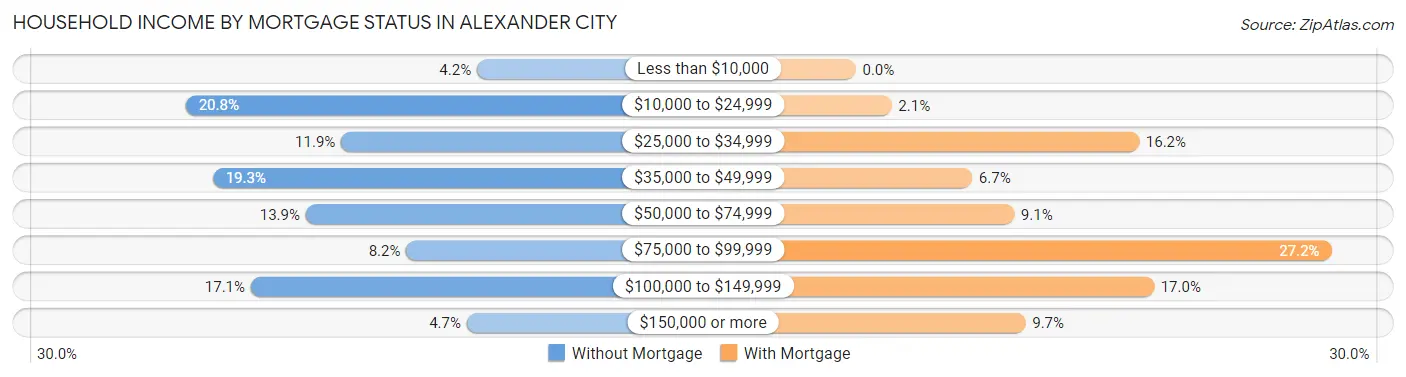
| Household Income | Without Mortgage | With Mortgage |
| Less than $10,000 | 78 (4.2%) | 0 (0.0%) |
| $10,000 to $24,999 | 391 (20.8%) | 41 (2.1%) |
| $25,000 to $34,999 | 224 (11.9%) | 324 (16.2%) |
| $35,000 to $49,999 | 362 (19.3%) | 133 (6.7%) |
| $50,000 to $74,999 | 262 (13.9%) | 181 (9.0%) |
| $75,000 to $99,999 | 154 (8.2%) | 544 (27.2%) |
| $100,000 to $149,999 | 321 (17.1%) | 341 (17.0%) |
| $150,000 or more | 89 (4.7%) | 194 (9.7%) |
| Total | 1,881 (100.0%) | 2,001 (100.0%) |
Property Value to Household Income Ratio in Alexander City
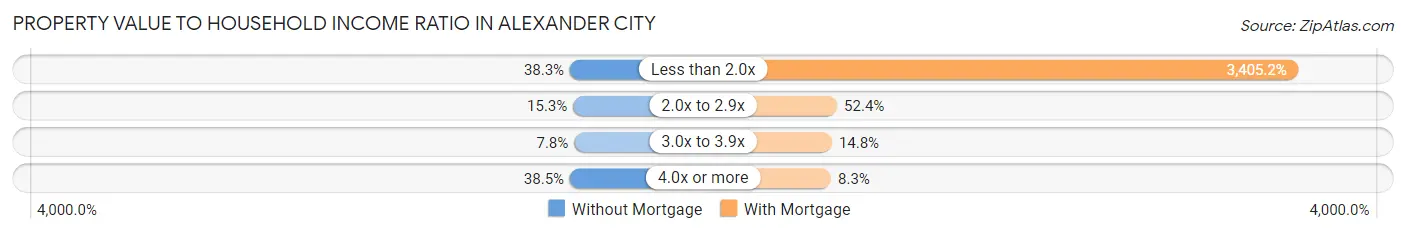
| Value-to-Income Ratio | Without Mortgage | With Mortgage |
| Less than 2.0x | 721 (38.3%) | 68,137 (3,405.1%) |
| 2.0x to 2.9x | 288 (15.3%) | 1,049 (52.4%) |
| 3.0x to 3.9x | 147 (7.8%) | 297 (14.8%) |
| 4.0x or more | 725 (38.5%) | 166 (8.3%) |
| Total | 1,881 (100.0%) | 2,001 (100.0%) |
Real Estate Taxes by Mortgage Status in Alexander City
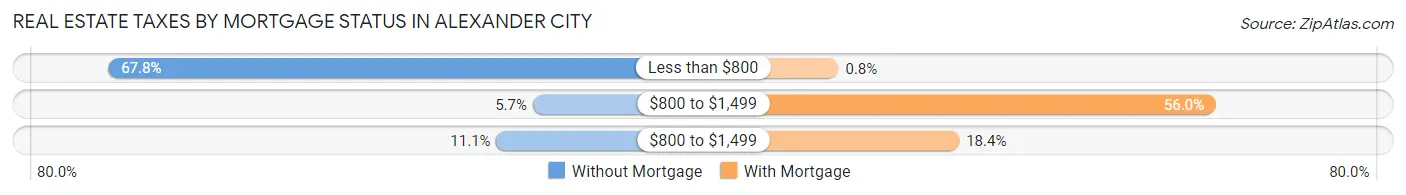
| Property Taxes | Without Mortgage | With Mortgage |
| Less than $800 | 1,275 (67.8%) | 16 (0.8%) |
| $800 to $1,499 | 108 (5.7%) | 1,120 (56.0%) |
| $800 to $1,499 | 208 (11.1%) | 369 (18.4%) |
| Total | 1,881 (100.0%) | 2,001 (100.0%) |
Health & Disability in Alexander City
Health Insurance Coverage by Age in Alexander City
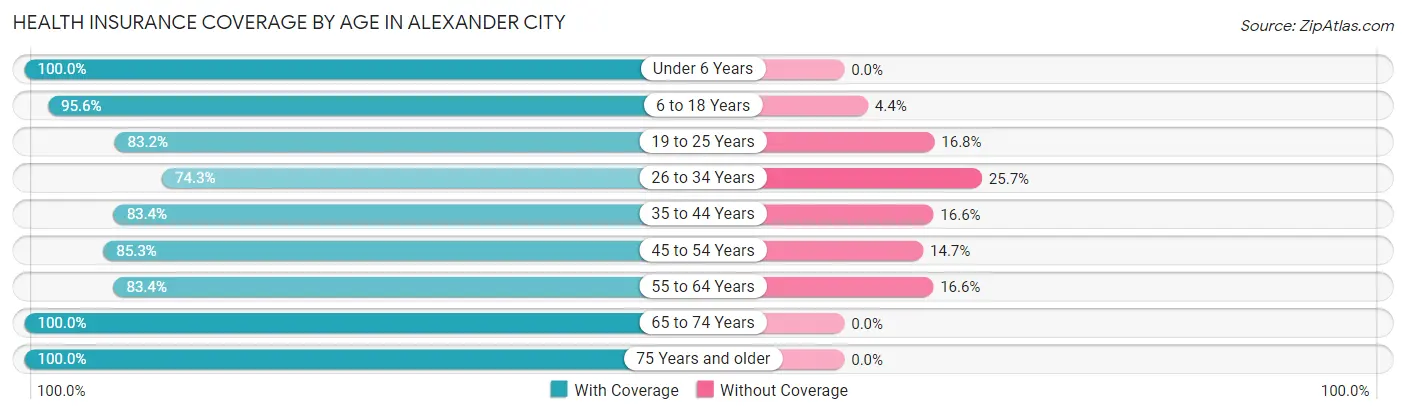
| Age Bracket | With Coverage | Without Coverage |
| Under 6 Years | 1,238 (100.0%) | 0 (0.0%) |
| 6 to 18 Years | 2,366 (95.6%) | 109 (4.4%) |
| 19 to 25 Years | 1,025 (83.2%) | 207 (16.8%) |
| 26 to 34 Years | 1,118 (74.3%) | 386 (25.7%) |
| 35 to 44 Years | 1,139 (83.4%) | 227 (16.6%) |
| 45 to 54 Years | 1,381 (85.3%) | 238 (14.7%) |
| 55 to 64 Years | 1,781 (83.4%) | 354 (16.6%) |
| 65 to 74 Years | 1,827 (100.0%) | 0 (0.0%) |
| 75 Years and older | 1,043 (100.0%) | 0 (0.0%) |
| Total | 12,918 (89.5%) | 1,521 (10.5%) |
Health Insurance Coverage by Citizenship Status in Alexander City
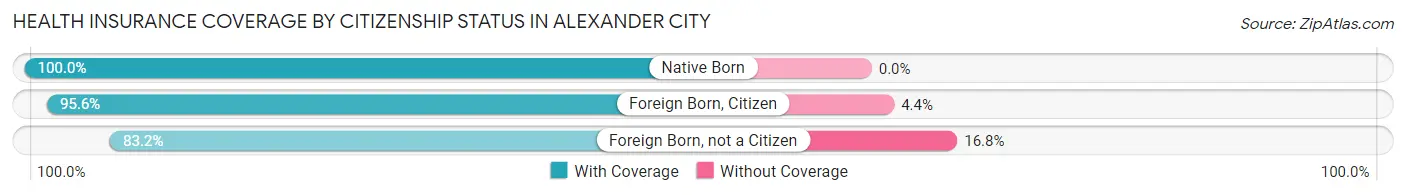
| Citizenship Status | With Coverage | Without Coverage |
| Native Born | 1,238 (100.0%) | 0 (0.0%) |
| Foreign Born, Citizen | 2,366 (95.6%) | 109 (4.4%) |
| Foreign Born, not a Citizen | 1,025 (83.2%) | 207 (16.8%) |
Health Insurance Coverage by Household Income in Alexander City
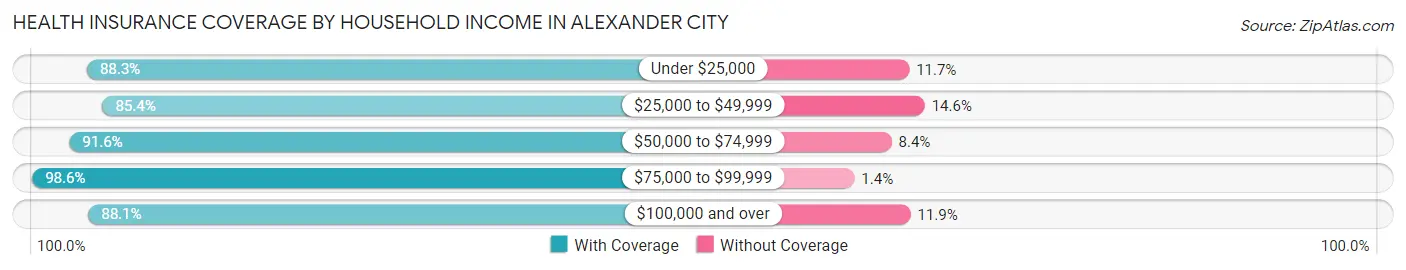
| Household Income | With Coverage | Without Coverage |
| Under $25,000 | 3,037 (88.3%) | 402 (11.7%) |
| $25,000 to $49,999 | 2,873 (85.4%) | 491 (14.6%) |
| $50,000 to $74,999 | 2,466 (91.6%) | 226 (8.4%) |
| $75,000 to $99,999 | 1,721 (98.6%) | 25 (1.4%) |
| $100,000 and over | 2,700 (88.1%) | 366 (11.9%) |
Public vs Private Health Insurance Coverage by Age in Alexander City
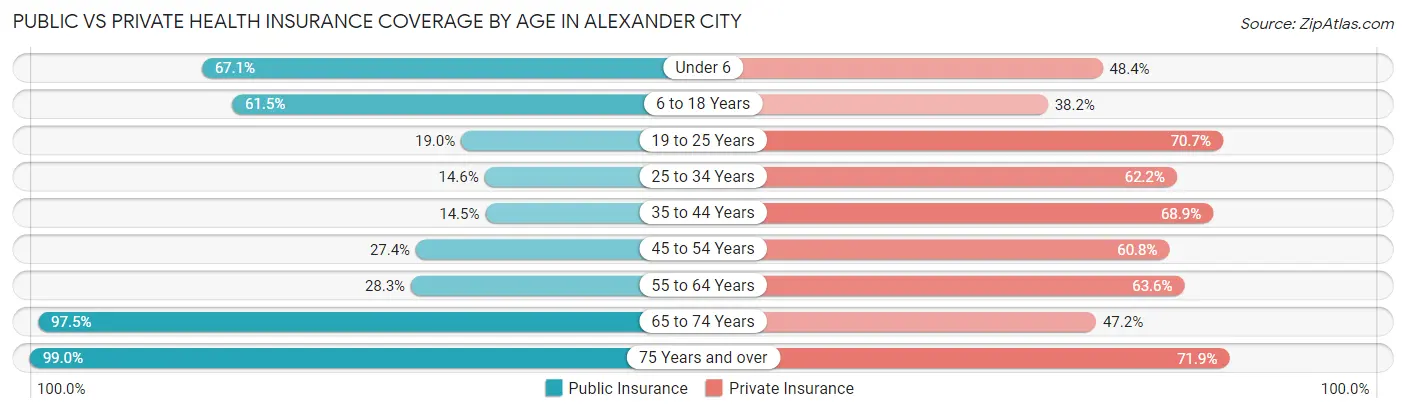
| Age Bracket | Public Insurance | Private Insurance |
| Under 6 | 831 (67.1%) | 599 (48.4%) |
| 6 to 18 Years | 1,522 (61.5%) | 946 (38.2%) |
| 19 to 25 Years | 234 (19.0%) | 871 (70.7%) |
| 25 to 34 Years | 220 (14.6%) | 935 (62.2%) |
| 35 to 44 Years | 198 (14.5%) | 941 (68.9%) |
| 45 to 54 Years | 443 (27.4%) | 984 (60.8%) |
| 55 to 64 Years | 604 (28.3%) | 1,357 (63.6%) |
| 65 to 74 Years | 1,781 (97.5%) | 862 (47.2%) |
| 75 Years and over | 1,033 (99.0%) | 750 (71.9%) |
| Total | 6,866 (47.5%) | 8,245 (57.1%) |
Disability Status by Sex by Age in Alexander City
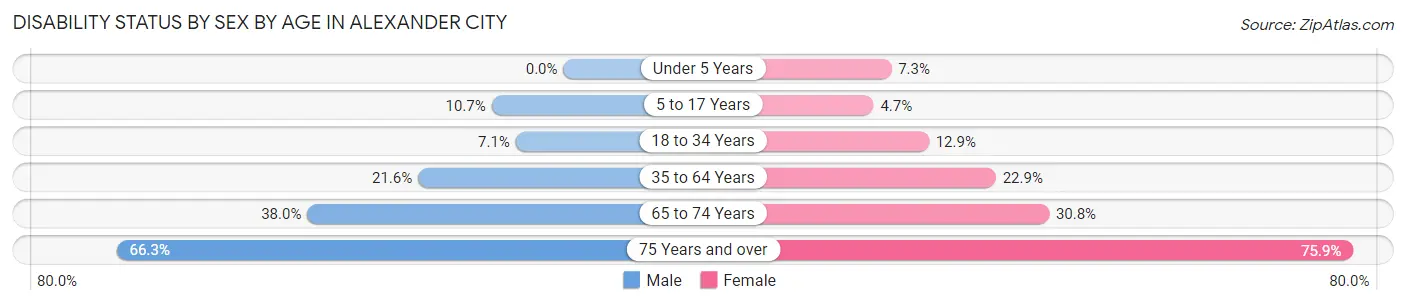
| Age Bracket | Male | Female |
| Under 5 Years | 0 (0.0%) | 46 (7.3%) |
| 5 to 17 Years | 138 (10.7%) | 57 (4.7%) |
| 18 to 34 Years | 97 (7.1%) | 198 (12.9%) |
| 35 to 64 Years | 567 (21.6%) | 570 (22.9%) |
| 65 to 74 Years | 340 (38.0%) | 287 (30.8%) |
| 75 Years and over | 270 (66.3%) | 483 (75.9%) |
Disability Class by Sex by Age in Alexander City
Disability Class: Hearing Difficulty
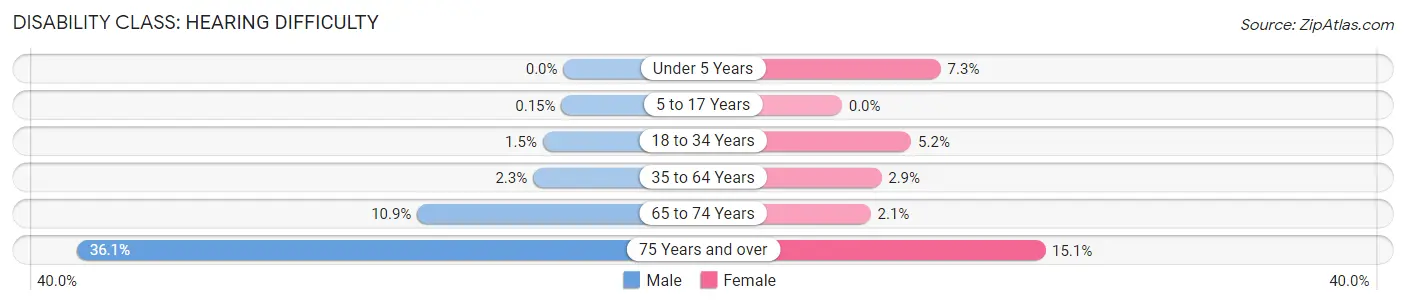
| Age Bracket | Male | Female |
| Under 5 Years | 0 (0.0%) | 46 (7.3%) |
| 5 to 17 Years | 2 (0.2%) | 0 (0.0%) |
| 18 to 34 Years | 21 (1.5%) | 79 (5.1%) |
| 35 to 64 Years | 59 (2.2%) | 73 (2.9%) |
| 65 to 74 Years | 97 (10.8%) | 20 (2.1%) |
| 75 Years and over | 147 (36.1%) | 96 (15.1%) |
Disability Class: Vision Difficulty
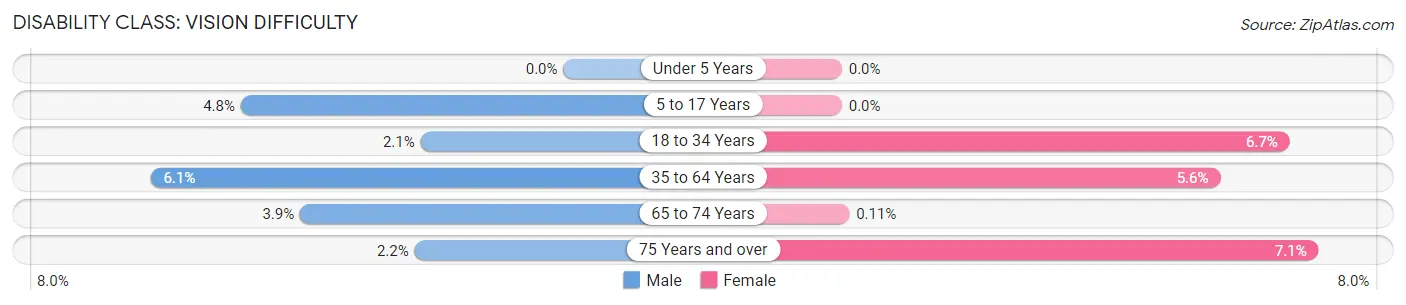
| Age Bracket | Male | Female |
| Under 5 Years | 0 (0.0%) | 0 (0.0%) |
| 5 to 17 Years | 62 (4.8%) | 0 (0.0%) |
| 18 to 34 Years | 29 (2.1%) | 102 (6.7%) |
| 35 to 64 Years | 161 (6.1%) | 140 (5.6%) |
| 65 to 74 Years | 35 (3.9%) | 1 (0.1%) |
| 75 Years and over | 9 (2.2%) | 45 (7.1%) |
Disability Class: Cognitive Difficulty
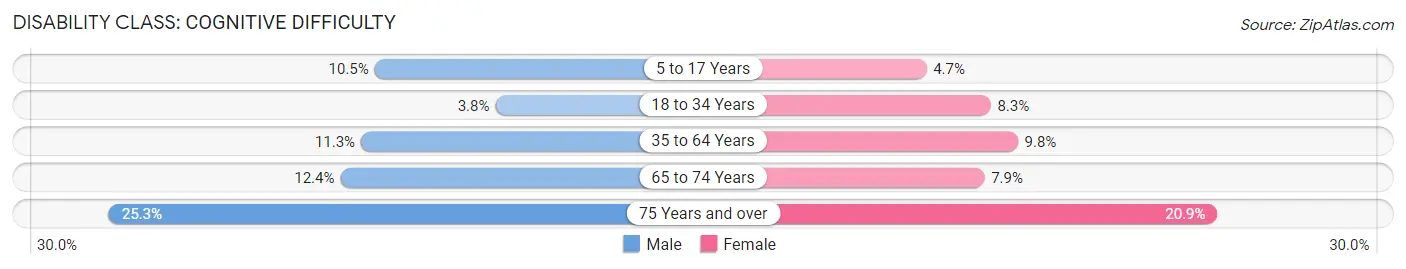
| Age Bracket | Male | Female |
| 5 to 17 Years | 136 (10.5%) | 57 (4.7%) |
| 18 to 34 Years | 52 (3.8%) | 127 (8.3%) |
| 35 to 64 Years | 296 (11.3%) | 244 (9.8%) |
| 65 to 74 Years | 111 (12.4%) | 74 (7.9%) |
| 75 Years and over | 103 (25.3%) | 133 (20.9%) |
Disability Class: Ambulatory Difficulty
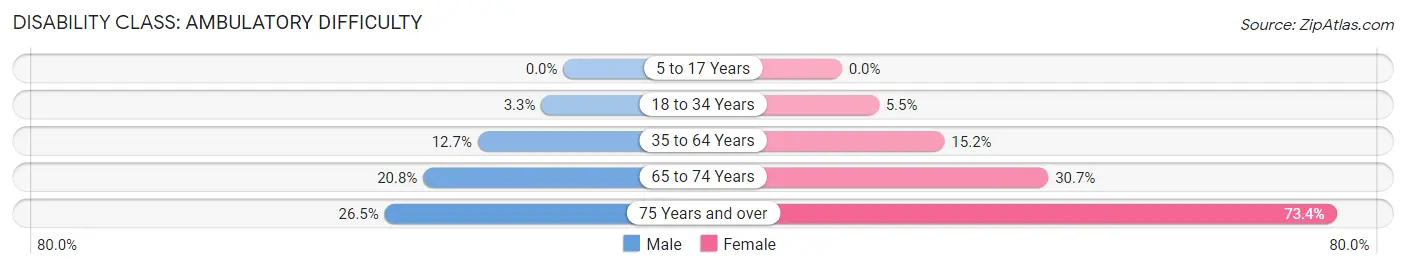
| Age Bracket | Male | Female |
| 5 to 17 Years | 0 (0.0%) | 0 (0.0%) |
| 18 to 34 Years | 45 (3.3%) | 84 (5.5%) |
| 35 to 64 Years | 334 (12.7%) | 380 (15.2%) |
| 65 to 74 Years | 186 (20.8%) | 286 (30.6%) |
| 75 Years and over | 108 (26.5%) | 467 (73.4%) |
Disability Class: Self-Care Difficulty
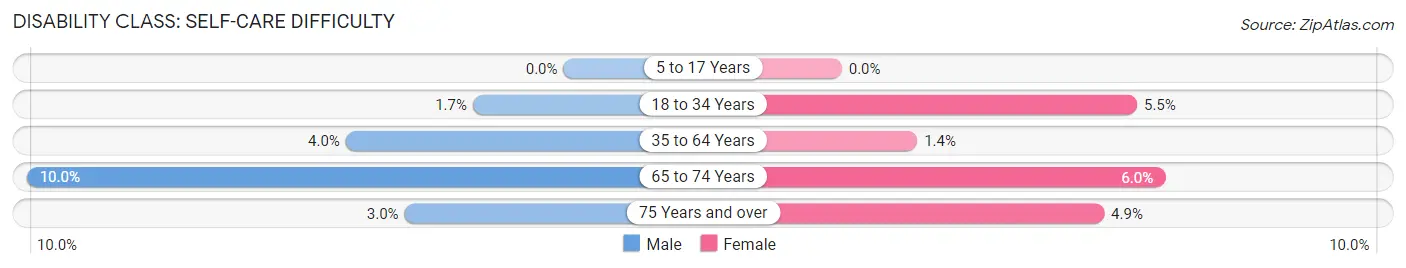
| Age Bracket | Male | Female |
| 5 to 17 Years | 0 (0.0%) | 0 (0.0%) |
| 18 to 34 Years | 23 (1.7%) | 84 (5.5%) |
| 35 to 64 Years | 106 (4.0%) | 35 (1.4%) |
| 65 to 74 Years | 89 (10.0%) | 56 (6.0%) |
| 75 Years and over | 12 (2.9%) | 31 (4.9%) |
Technology Access in Alexander City
Computing Device Access in Alexander City
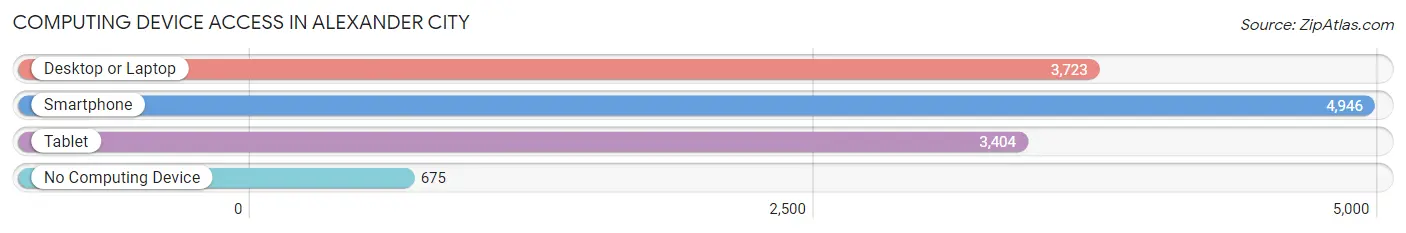
| Device Type | # Households | % Households |
| Desktop or Laptop | 3,723 | 62.3% |
| Smartphone | 4,946 | 82.7% |
| Tablet | 3,404 | 56.9% |
| No Computing Device | 675 | 11.3% |
| Total | 5,978 | 100.0% |
Internet Access in Alexander City
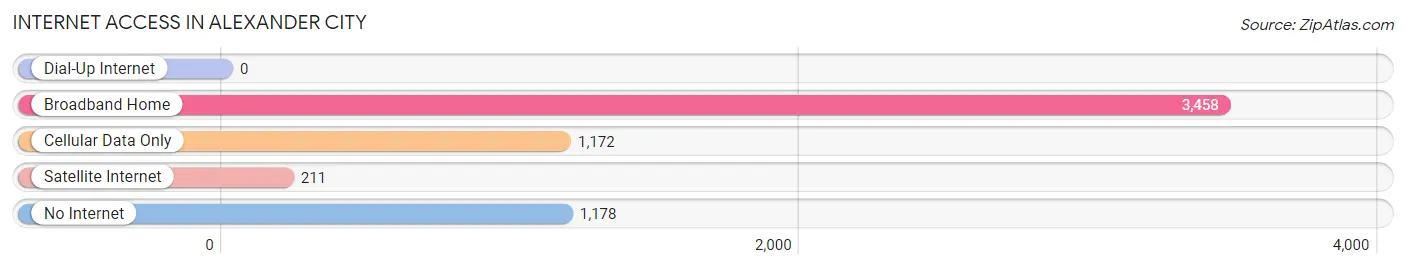
| Internet Type | # Households | % Households |
| Dial-Up Internet | 0 | 0.0% |
| Broadband Home | 3,458 | 57.9% |
| Cellular Data Only | 1,172 | 19.6% |
| Satellite Internet | 211 | 3.5% |
| No Internet | 1,178 | 19.7% |
| Total | 5,978 | 100.0% |
Alexander City Summary
Alexander City, Alabama is a city located in Tallapoosa County, Alabama. It is situated on the banks of Lake Martin, a 44,000-acre reservoir created by the construction of the Martin Dam on the Tallapoosa River. The city is the county seat of Tallapoosa County and is part of the Alexander City Micropolitan Statistical Area. As of the 2010 census, the population of Alexander City was 14,875.
History
Alexander City was founded in 1872 by a group of settlers led by John Alexander, a former Confederate soldier. The city was named in his honor. The city was incorporated in 1873 and was the first city in Tallapoosa County. The city quickly grew and by the 1880s, it was a thriving commercial center. The city was home to several cotton mills and other industries.
In the early 1900s, the city was a major producer of cotton and other agricultural products. The city was also home to several large lumber mills. In the 1920s, the city was home to several large automobile factories. The city was also home to several large textile mills.
In the 1950s, the city began to experience a decline in its industrial base. The city was hit hard by the Great Depression and the decline of the cotton industry. The city was also affected by the decline of the lumber industry. In the 1960s, the city began to experience a resurgence in its economy. The city was home to several large manufacturing plants and was a major producer of aluminum.
Geography
Alexander City is located in the east-central part of Alabama, about 40 miles east of Montgomery. The city is situated on the banks of Lake Martin, a 44,000-acre reservoir created by the construction of the Martin Dam on the Tallapoosa River. The city is located in the foothills of the Appalachian Mountains. The city has a total area of 16.2 square miles, of which 15.9 square miles is land and 0.3 square miles is water.
Economy
Alexander City is home to several large manufacturing plants, including Russell Corporation, which produces athletic apparel, and Russell Medical Center, which produces medical supplies. The city is also home to several large retail stores, including Walmart, Target, and Lowe's. The city is also home to several restaurants and other businesses.
Demographics
As of the 2010 census, the population of Alexander City was 14,875. The racial makeup of the city was 68.3% White, 28.3% African American, 0.3% Native American, 0.7% Asian, 0.1% Pacific Islander, 0.7% from other races, and 1.9% from two or more races. Hispanic or Latino of any race were 2.2% of the population.
The median income for a household in the city was $31,945, and the median income for a family was $41,945. The per capita income for the city was $17,945. About 17.3% of families and 21.3% of the population were below the poverty line, including 28.3% of those under age 18 and 16.3% of those age 65 or over.
Common Questions
What is Per Capita Income in Alexander City?
Per Capita income in Alexander City is $26,388.
What is the Median Family Income in Alexander City?
Median Family Income in Alexander City is $58,266.
What is the Median Household income in Alexander City?
Median Household Income in Alexander City is $42,141.
What is Income or Wage Gap in Alexander City?
Income or Wage Gap in Alexander City is 25.1%.
Women in Alexander City earn 74.9 cents for every dollar earned by a man.
What is Family Income Deficit in Alexander City?
Family Income Deficit in Alexander City is $9,936.
Families that are below poverty line in Alexander City earn $9,936 less on average than the poverty threshold level.
What is Inequality or Gini Index in Alexander City?
Inequality or Gini Index in Alexander City is 0.49.
What is the Total Population of Alexander City?
Total Population of Alexander City is 14,788.
What is the Total Male Population of Alexander City?
Total Male Population of Alexander City is 7,285.
What is the Total Female Population of Alexander City?
Total Female Population of Alexander City is 7,503.
What is the Ratio of Males per 100 Females in Alexander City?
There are 97.09 Males per 100 Females in Alexander City.
What is the Ratio of Females per 100 Males in Alexander City?
There are 102.99 Females per 100 Males in Alexander City.
What is the Median Population Age in Alexander City?
Median Population Age in Alexander City is 41.2 Years.
What is the Average Family Size in Alexander City
Average Family Size in Alexander City is 3.1 People.
What is the Average Household Size in Alexander City
Average Household Size in Alexander City is 2.4 People.
How Large is the Labor Force in Alexander City?
There are 5,807 People in the Labor Forcein in Alexander City.
What is the Percentage of People in the Labor Force in Alexander City?
49.8% of People are in the Labor Force in Alexander City.
What is the Unemployment Rate in Alexander City?
Unemployment Rate in Alexander City is 8.2%.