Albertville, AL Map & Demographics
Albertville Map
Albertville Overview
$25,852
PER CAPITA INCOME
$65,714
AVG FAMILY INCOME
$55,933
AVG HOUSEHOLD INCOME
15.6%
WAGE / INCOME GAP [ % ]
84.4¢/ $1
WAGE / INCOME GAP [ $ ]
0.45
INEQUALITY / GINI INDEX
22,433
TOTAL POPULATION
10,476
MALE POPULATION
11,957
FEMALE POPULATION
87.61
MALES / 100 FEMALES
114.14
FEMALES / 100 MALES
32.8
MEDIAN AGE
3.5
AVG FAMILY SIZE
2.9
AVG HOUSEHOLD SIZE
9,719
LABOR FORCE [ PEOPLE ]
60.2%
PERCENT IN LABOR FORCE
6.0%
UNEMPLOYMENT RATE
Albertville Area Codes
Income in Albertville
Income Overview in Albertville
Per Capita Income in Albertville is $25,852, while median incomes of families and households are $65,714 and $55,933 respectively.
| Characteristic | Number | Measure |
| Per Capita Income | 22,433 | $25,852 |
| Median Family Income | 5,398 | $65,714 |
| Mean Family Income | 5,398 | $84,347 |
| Median Household Income | 7,576 | $55,933 |
| Mean Household Income | 7,576 | $72,741 |
| Income Deficit | 5,398 | $0 |
| Wage / Income Gap (%) | 22,433 | 15.60% |
| Wage / Income Gap ($) | 22,433 | 84.40¢ per $1 |
| Gini / Inequality Index | 22,433 | 0.45 |
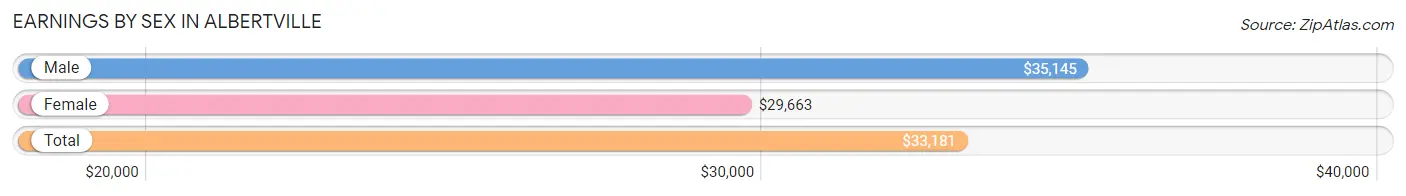
Earnings by Sex in Albertville
Average Earnings in Albertville are $33,181, $35,145 for men and $29,663 for women, a difference of 15.6%.
| Sex | Number | Average Earnings |
| Male | 5,305 (53.1%) | $35,145 |
| Female | 4,686 (46.9%) | $29,663 |
| Total | 9,991 (100.0%) | $33,181 |
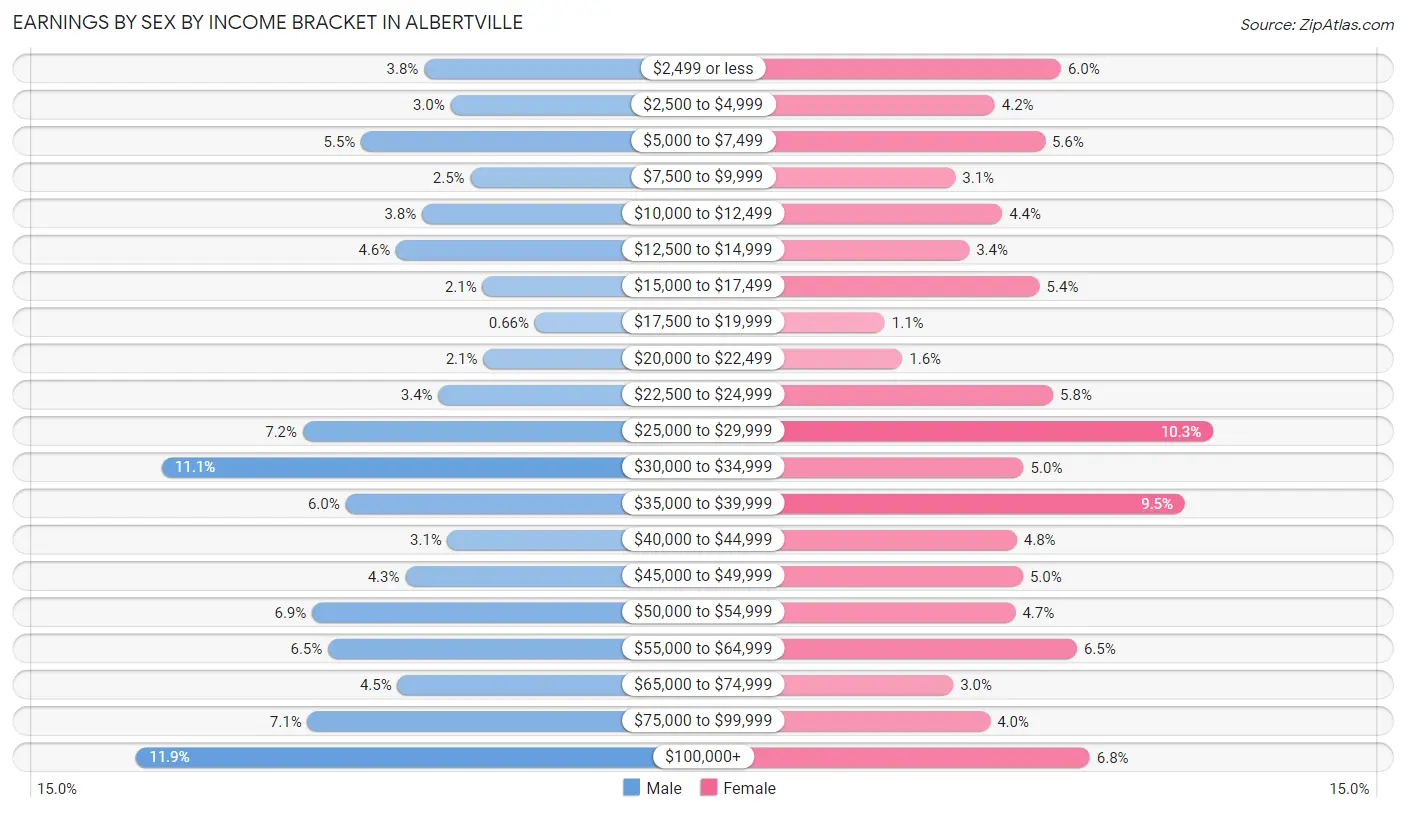
Earnings by Sex by Income Bracket in Albertville
The most common earnings brackets in Albertville are $100,000+ for men (629 | 11.9%) and $25,000 to $29,999 for women (482 | 10.3%).
| Income | Male | Female |
| $2,499 or less | 200 (3.8%) | 282 (6.0%) |
| $2,500 to $4,999 | 161 (3.0%) | 195 (4.2%) |
| $5,000 to $7,499 | 294 (5.5%) | 261 (5.6%) |
| $7,500 to $9,999 | 131 (2.5%) | 143 (3.0%) |
| $10,000 to $12,499 | 203 (3.8%) | 205 (4.4%) |
| $12,500 to $14,999 | 242 (4.6%) | 161 (3.4%) |
| $15,000 to $17,499 | 113 (2.1%) | 254 (5.4%) |
| $17,500 to $19,999 | 35 (0.7%) | 50 (1.1%) |
| $20,000 to $22,499 | 112 (2.1%) | 73 (1.6%) |
| $22,500 to $24,999 | 179 (3.4%) | 272 (5.8%) |
| $25,000 to $29,999 | 381 (7.2%) | 482 (10.3%) |
| $30,000 to $34,999 | 591 (11.1%) | 233 (5.0%) |
| $35,000 to $39,999 | 317 (6.0%) | 445 (9.5%) |
| $40,000 to $44,999 | 165 (3.1%) | 224 (4.8%) |
| $45,000 to $49,999 | 228 (4.3%) | 232 (5.0%) |
| $50,000 to $54,999 | 367 (6.9%) | 222 (4.7%) |
| $55,000 to $64,999 | 343 (6.5%) | 303 (6.5%) |
| $65,000 to $74,999 | 240 (4.5%) | 140 (3.0%) |
| $75,000 to $99,999 | 374 (7.0%) | 189 (4.0%) |
| $100,000+ | 629 (11.9%) | 320 (6.8%) |
| Total | 5,305 (100.0%) | 4,686 (100.0%) |
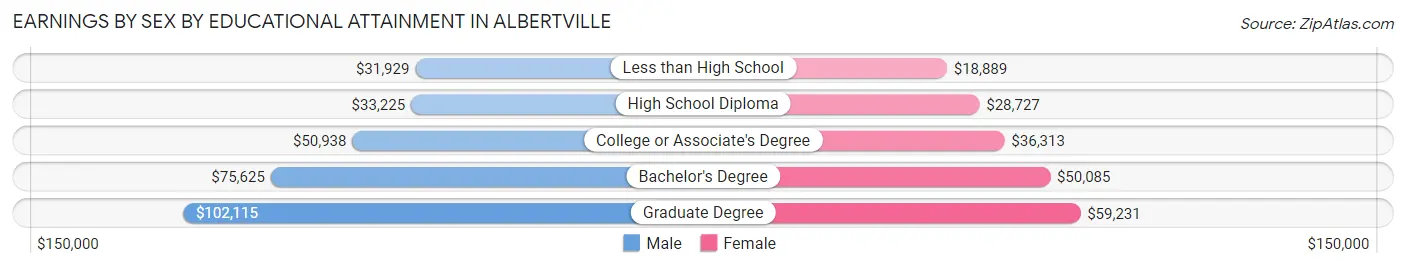
Earnings by Sex by Educational Attainment in Albertville
Average earnings in Albertville are $41,406 for men and $35,078 for women, a difference of 15.3%. Men with an educational attainment of graduate degree enjoy the highest average annual earnings of $102,115, while those with less than high school education earn the least with $31,929. Women with an educational attainment of graduate degree earn the most with the average annual earnings of $59,231, while those with less than high school education have the smallest earnings of $18,889.
| Educational Attainment | Male Income | Female Income |
| Less than High School | $31,929 | $18,889 |
| High School Diploma | $33,225 | $28,727 |
| College or Associate's Degree | $50,938 | $36,313 |
| Bachelor's Degree | $75,625 | $50,085 |
| Graduate Degree | $102,115 | $59,231 |
| Total | $41,406 | $35,078 |
Family Income in Albertville
Family Income Brackets in Albertville
According to the Albertville family income data, there are 1,015 families falling into the $50,000 to $74,999 income range, which is the most common income bracket and makes up 18.8% of all families. Conversely, the less than $10,000 income bracket is the least frequent group with only 200 families (3.7%) belonging to this category.
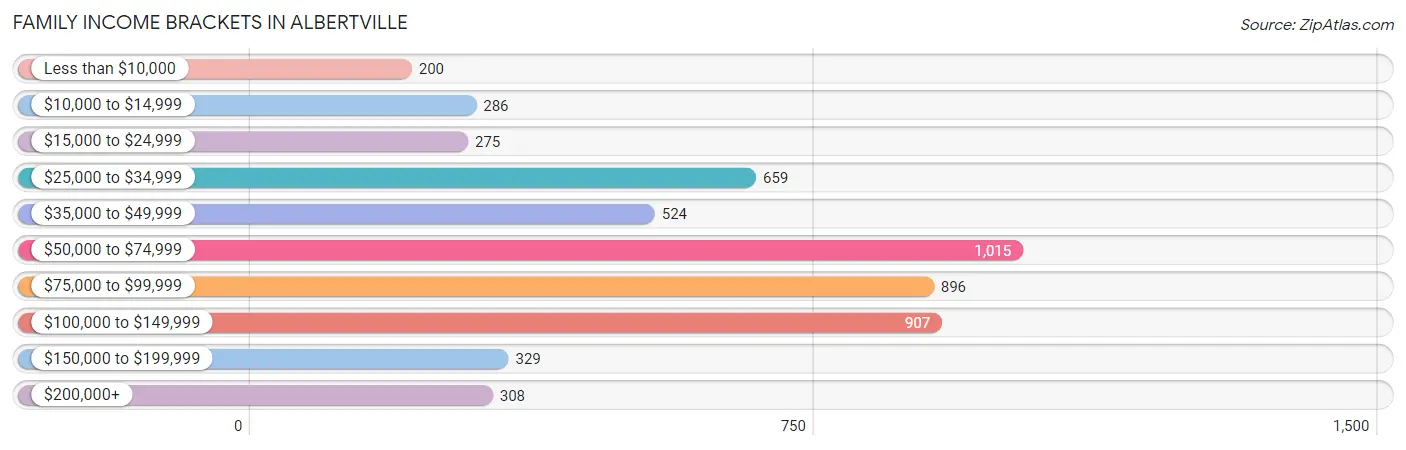
| Income Bracket | # Families | % Families |
| Less than $10,000 | 200 | 3.7% |
| $10,000 to $14,999 | 286 | 5.3% |
| $15,000 to $24,999 | 275 | 5.1% |
| $25,000 to $34,999 | 659 | 12.2% |
| $35,000 to $49,999 | 524 | 9.7% |
| $50,000 to $74,999 | 1,015 | 18.8% |
| $75,000 to $99,999 | 896 | 16.6% |
| $100,000 to $149,999 | 907 | 16.8% |
| $150,000 to $199,999 | 329 | 6.1% |
| $200,000+ | 308 | 5.7% |
Family Income by Famaliy Size in Albertville
5-person families (706 | 13.1%) account for the highest median family income in Albertville with $97,609 per family, while 2-person families (2,089 | 38.7%) have the highest median income of $28,238 per family member.
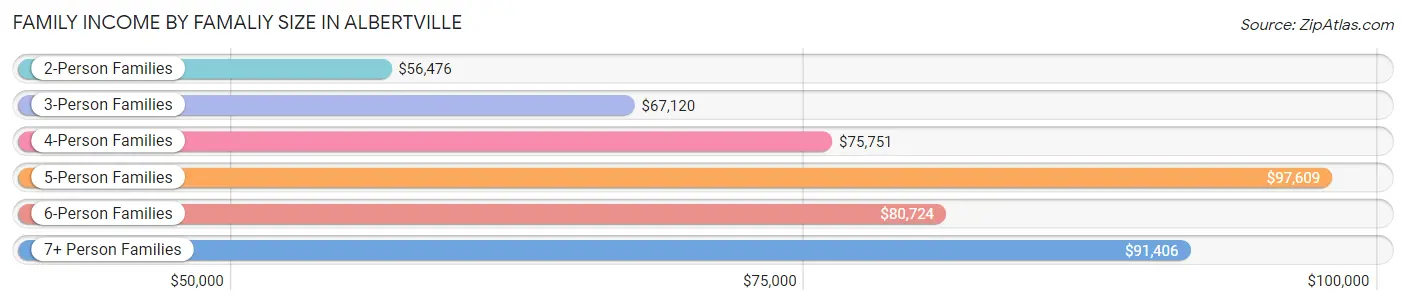
| Income Bracket | # Families | Median Income |
| 2-Person Families | 2,089 (38.7%) | $56,476 |
| 3-Person Families | 1,257 (23.3%) | $67,120 |
| 4-Person Families | 932 (17.3%) | $75,751 |
| 5-Person Families | 706 (13.1%) | $97,609 |
| 6-Person Families | 221 (4.1%) | $80,724 |
| 7+ Person Families | 193 (3.6%) | $91,406 |
| Total | 5,398 (100.0%) | $65,714 |
Family Income by Number of Earners in Albertville
The median family income in Albertville is $65,714, with families comprising 3+ earners (704) having the highest median family income of $129,556, while families with no earners (1,076) have the lowest median family income of $31,575, accounting for 13.0% and 19.9% of families, respectively.
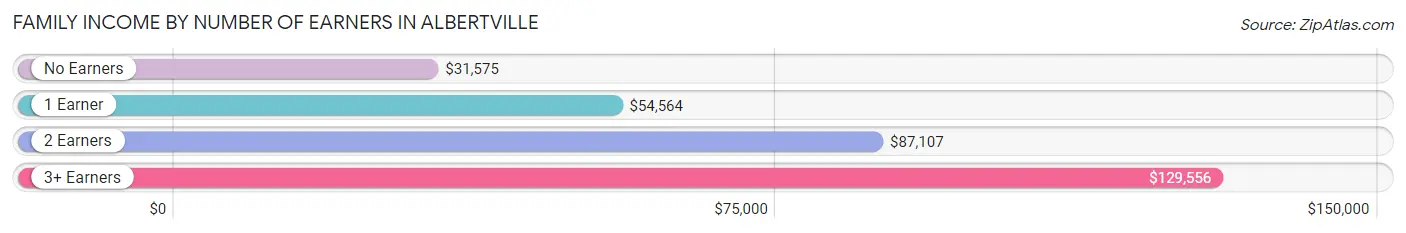
| Number of Earners | # Families | Median Income |
| No Earners | 1,076 (19.9%) | $31,575 |
| 1 Earner | 1,801 (33.4%) | $54,564 |
| 2 Earners | 1,817 (33.7%) | $87,107 |
| 3+ Earners | 704 (13.0%) | $129,556 |
| Total | 5,398 (100.0%) | $65,714 |
Household Income in Albertville
Household Income Brackets in Albertville
With 1,364 households falling in the category, the $50,000 to $74,999 income range is the most frequent in Albertville, accounting for 18.0% of all households. In contrast, only 333 households (4.4%) fall into the $150,000 to $199,999 income bracket, making it the least populous group.
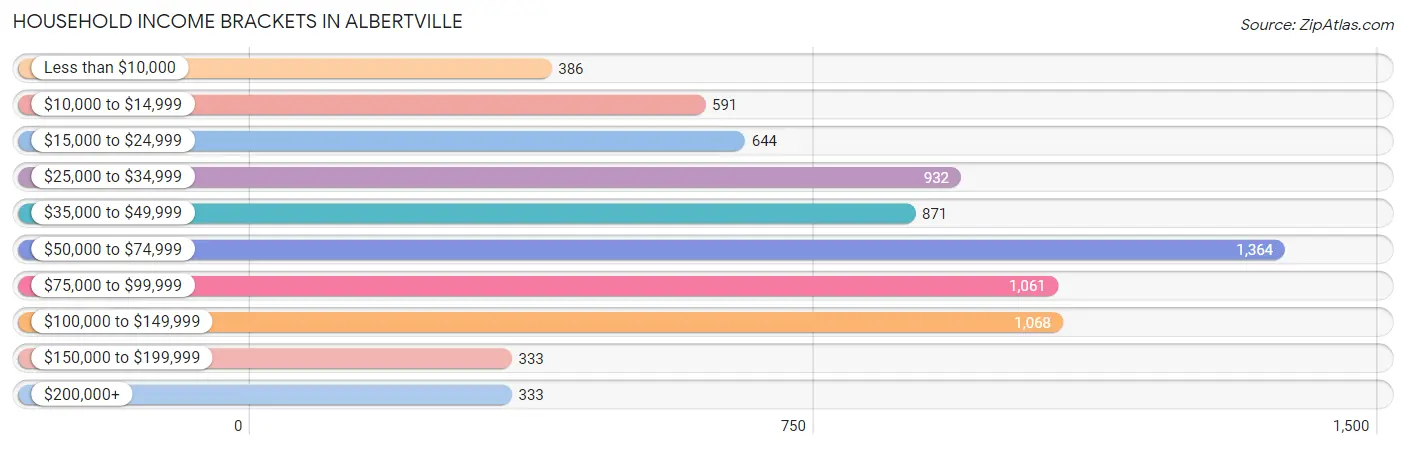
| Income Bracket | # Households | % Households |
| Less than $10,000 | 386 | 5.1% |
| $10,000 to $14,999 | 591 | 7.8% |
| $15,000 to $24,999 | 644 | 8.5% |
| $25,000 to $34,999 | 932 | 12.3% |
| $35,000 to $49,999 | 871 | 11.5% |
| $50,000 to $74,999 | 1,364 | 18.0% |
| $75,000 to $99,999 | 1,061 | 14.0% |
| $100,000 to $149,999 | 1,068 | 14.1% |
| $150,000 to $199,999 | 333 | 4.4% |
| $200,000+ | 333 | 4.4% |
Household Income by Householder Age in Albertville
The median household income in Albertville is $55,933, with the highest median household income of $68,772 found in the 45 to 64 years age bracket for the primary householder. A total of 2,594 households (34.2%) fall into this category. Meanwhile, the 15 to 24 years age bracket for the primary householder has the lowest median household income of $23,636, with 138 households (1.8%) in this group.
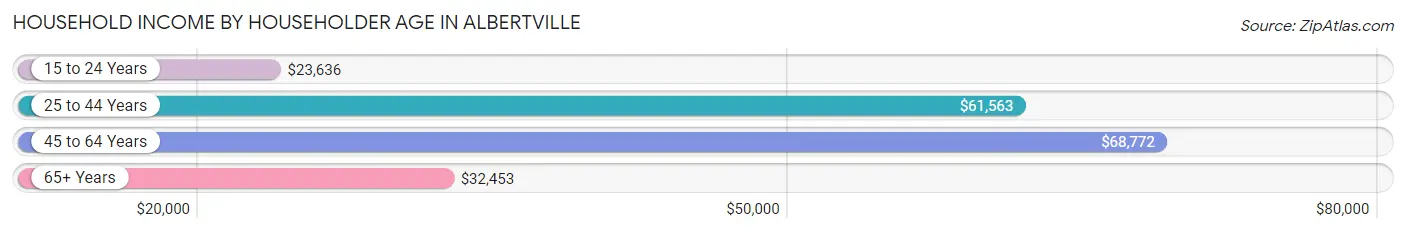
| Income Bracket | # Households | Median Income |
| 15 to 24 Years | 138 (1.8%) | $23,636 |
| 25 to 44 Years | 2,825 (37.3%) | $61,563 |
| 45 to 64 Years | 2,594 (34.2%) | $68,772 |
| 65+ Years | 2,019 (26.7%) | $32,453 |
| Total | 7,576 (100.0%) | $55,933 |
Poverty in Albertville
Income Below Poverty by Sex and Age in Albertville
With 14.0% poverty level for males and 19.1% for females among the residents of Albertville, 5 year old males and 15 year old females are the most vulnerable to poverty, with 100 males (36.2%) and 71 females (48.0%) in their respective age groups living below the poverty level.
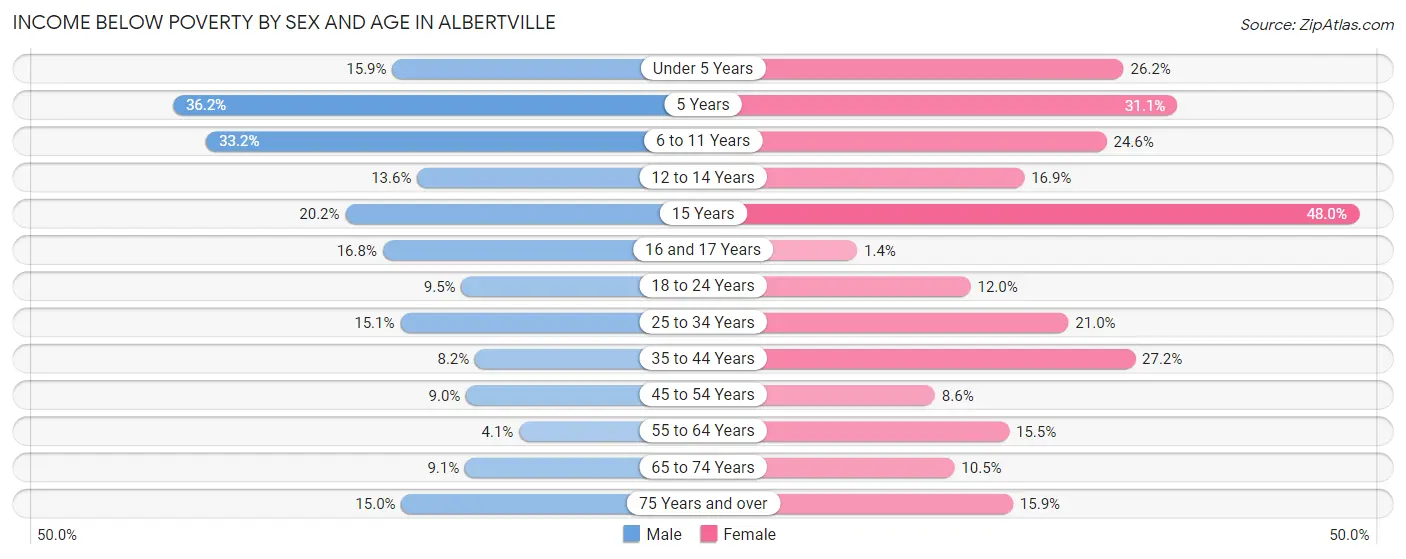
| Age Bracket | Male | Female |
| Under 5 Years | 66 (15.9%) | 288 (26.2%) |
| 5 Years | 100 (36.2%) | 61 (31.1%) |
| 6 to 11 Years | 358 (33.2%) | 318 (24.6%) |
| 12 to 14 Years | 96 (13.6%) | 117 (16.9%) |
| 15 Years | 53 (20.2%) | 71 (48.0%) |
| 16 and 17 Years | 61 (16.8%) | 3 (1.4%) |
| 18 to 24 Years | 92 (9.5%) | 104 (11.9%) |
| 25 to 34 Years | 212 (15.1%) | 323 (21.0%) |
| 35 to 44 Years | 102 (8.2%) | 433 (27.2%) |
| 45 to 54 Years | 111 (9.0%) | 88 (8.6%) |
| 55 to 64 Years | 42 (4.1%) | 212 (15.5%) |
| 65 to 74 Years | 74 (9.1%) | 90 (10.4%) |
| 75 Years and over | 75 (15.0%) | 134 (15.9%) |
| Total | 1,442 (14.0%) | 2,242 (19.1%) |
Income Above Poverty by Sex and Age in Albertville
According to the poverty statistics in Albertville, males aged 55 to 64 years and females aged 16 and 17 years are the age groups that are most secure financially, with 95.9% of males and 98.6% of females in these age groups living above the poverty line.
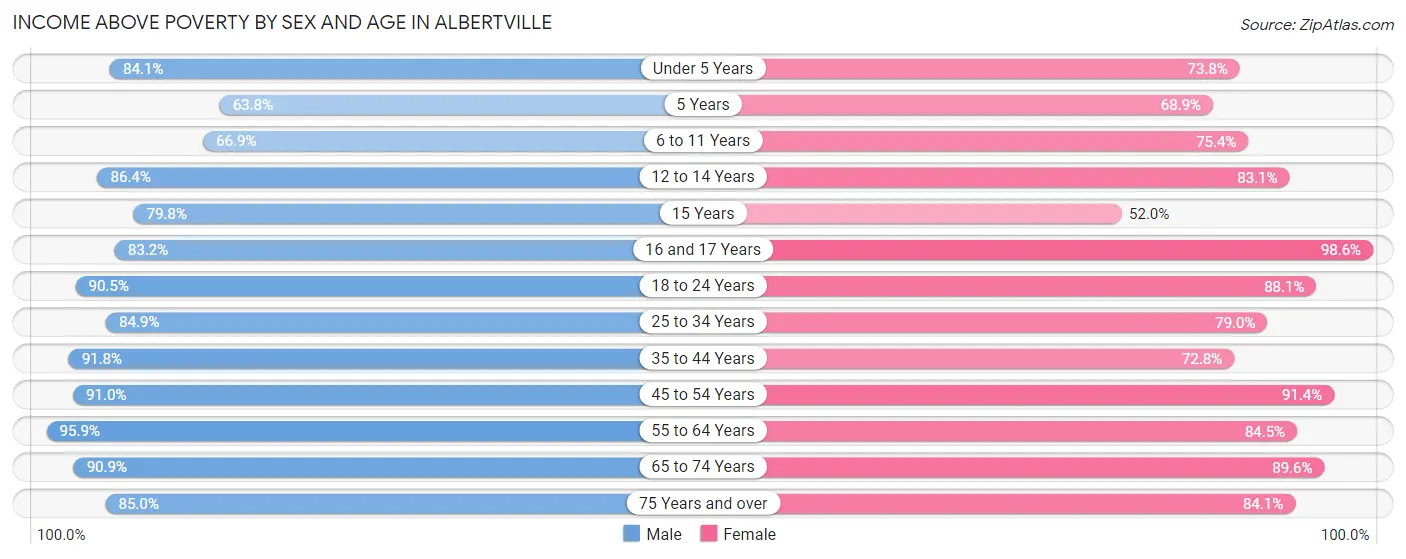
| Age Bracket | Male | Female |
| Under 5 Years | 350 (84.1%) | 813 (73.8%) |
| 5 Years | 176 (63.8%) | 135 (68.9%) |
| 6 to 11 Years | 722 (66.8%) | 976 (75.4%) |
| 12 to 14 Years | 612 (86.4%) | 574 (83.1%) |
| 15 Years | 209 (79.8%) | 77 (52.0%) |
| 16 and 17 Years | 303 (83.2%) | 209 (98.6%) |
| 18 to 24 Years | 881 (90.5%) | 766 (88.0%) |
| 25 to 34 Years | 1,189 (84.9%) | 1,213 (79.0%) |
| 35 to 44 Years | 1,143 (91.8%) | 1,158 (72.8%) |
| 45 to 54 Years | 1,120 (91.0%) | 931 (91.4%) |
| 55 to 64 Years | 983 (95.9%) | 1,154 (84.5%) |
| 65 to 74 Years | 737 (90.9%) | 771 (89.5%) |
| 75 Years and over | 424 (85.0%) | 710 (84.1%) |
| Total | 8,849 (86.0%) | 9,487 (80.9%) |
Income Below Poverty Among Married-Couple Families in Albertville
The poverty statistics for married-couple families in Albertville show that 7.7% or 292 of the total 3,785 families live below the poverty line. Families with 5 or more children have the highest poverty rate of 47.0%, comprising of 55 families. On the other hand, families with no children have the lowest poverty rate of 2.8%, which includes 57 families.
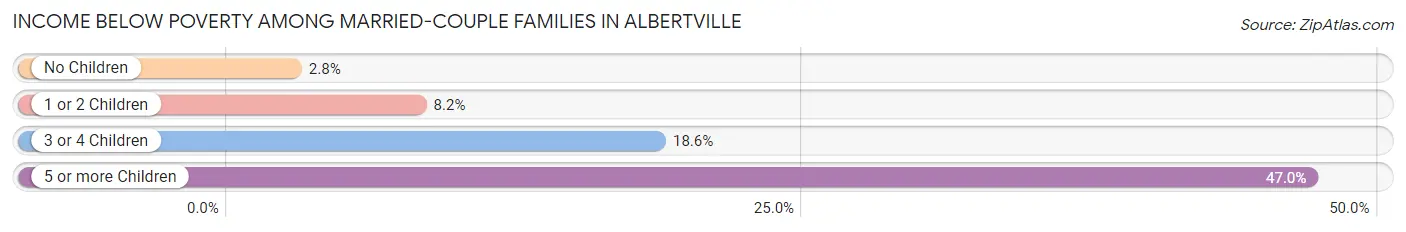
| Children | Above Poverty | Below Poverty |
| No Children | 1,991 (97.2%) | 57 (2.8%) |
| 1 or 2 Children | 1,073 (91.8%) | 96 (8.2%) |
| 3 or 4 Children | 367 (81.4%) | 84 (18.6%) |
| 5 or more Children | 62 (53.0%) | 55 (47.0%) |
| Total | 3,493 (92.3%) | 292 (7.7%) |
Income Below Poverty Among Single-Parent Households in Albertville
According to the poverty data in Albertville, 9.0% or 33 single-father households and 36.2% or 451 single-mother households are living below the poverty line. Among single-father households, those with no children have the highest poverty rate, with 33 households (27.3%) experiencing poverty. Likewise, among single-mother households, those with 5 or more children have the highest poverty rate, with 2 households (100.0%) falling below the poverty line.
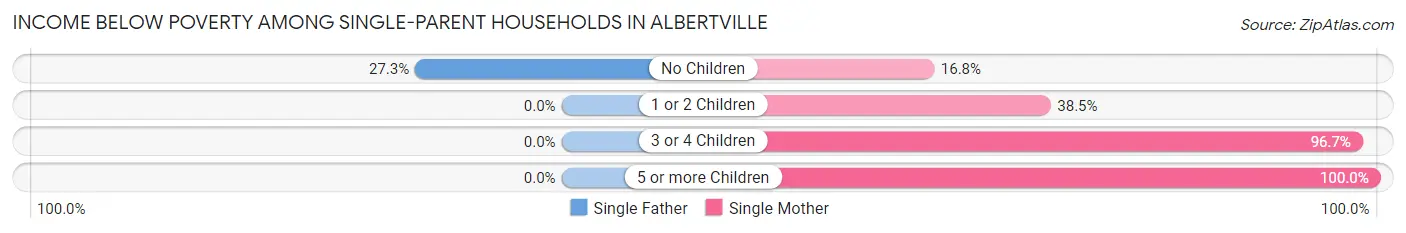
| Children | Single Father | Single Mother |
| No Children | 33 (27.3%) | 64 (16.8%) |
| 1 or 2 Children | 0 (0.0%) | 298 (38.5%) |
| 3 or 4 Children | 0 (0.0%) | 87 (96.7%) |
| 5 or more Children | 0 (0.0%) | 2 (100.0%) |
| Total | 33 (9.0%) | 451 (36.2%) |
Income Below Poverty Among Married-Couple vs Single-Parent Households in Albertville
The poverty data for Albertville shows that 292 of the married-couple family households (7.7%) and 484 of the single-parent households (30.0%) are living below the poverty level. Within the married-couple family households, those with 5 or more children have the highest poverty rate, with 55 households (47.0%) falling below the poverty line. Among the single-parent households, those with 5 or more children have the highest poverty rate, with 2 household (100.0%) living below poverty.
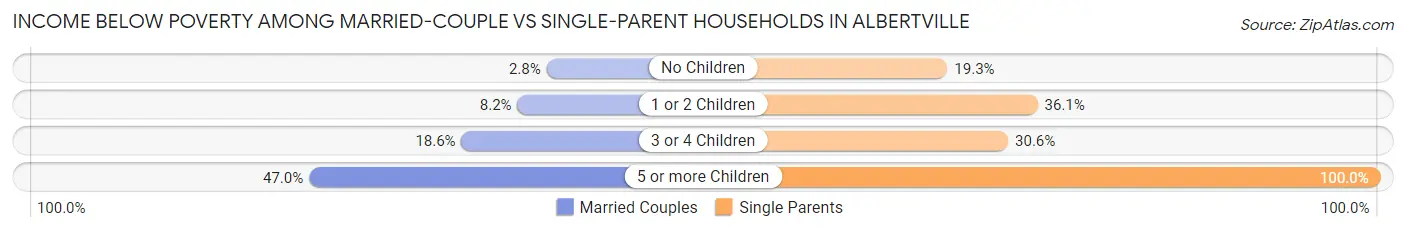
| Children | Married-Couple Families | Single-Parent Households |
| No Children | 57 (2.8%) | 97 (19.3%) |
| 1 or 2 Children | 96 (8.2%) | 298 (36.1%) |
| 3 or 4 Children | 84 (18.6%) | 87 (30.6%) |
| 5 or more Children | 55 (47.0%) | 2 (100.0%) |
| Total | 292 (7.7%) | 484 (30.0%) |
Race in Albertville
The most populous races in Albertville are White / Caucasian (17,519 | 78.1%), Hispanic or Latino (6,443 | 28.7%), and Two or more Races (1,753 | 7.8%).
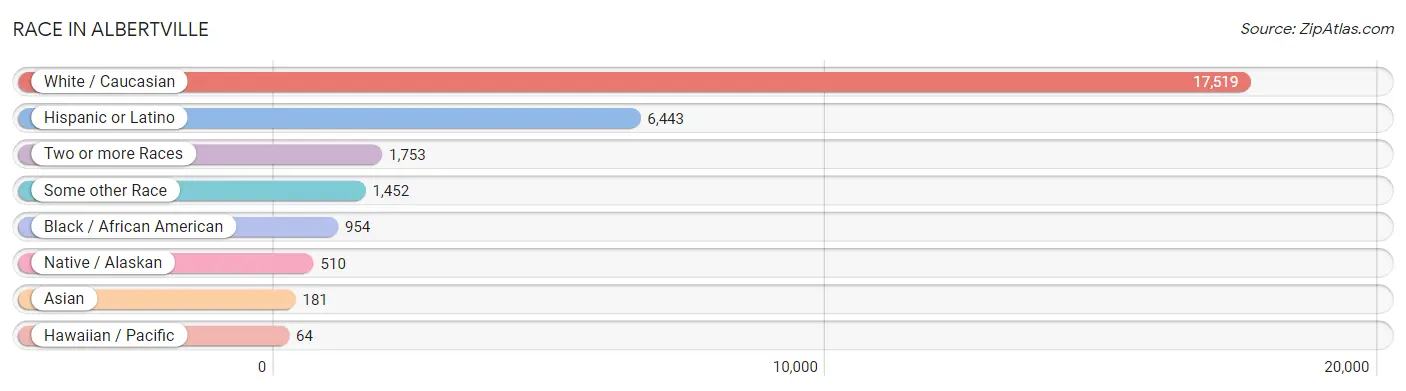
| Race | # Population | % Population |
| Asian | 181 | 0.8% |
| Black / African American | 954 | 4.3% |
| Hawaiian / Pacific | 64 | 0.3% |
| Hispanic or Latino | 6,443 | 28.7% |
| Native / Alaskan | 510 | 2.3% |
| White / Caucasian | 17,519 | 78.1% |
| Two or more Races | 1,753 | 7.8% |
| Some other Race | 1,452 | 6.5% |
| Total | 22,433 | 100.0% |
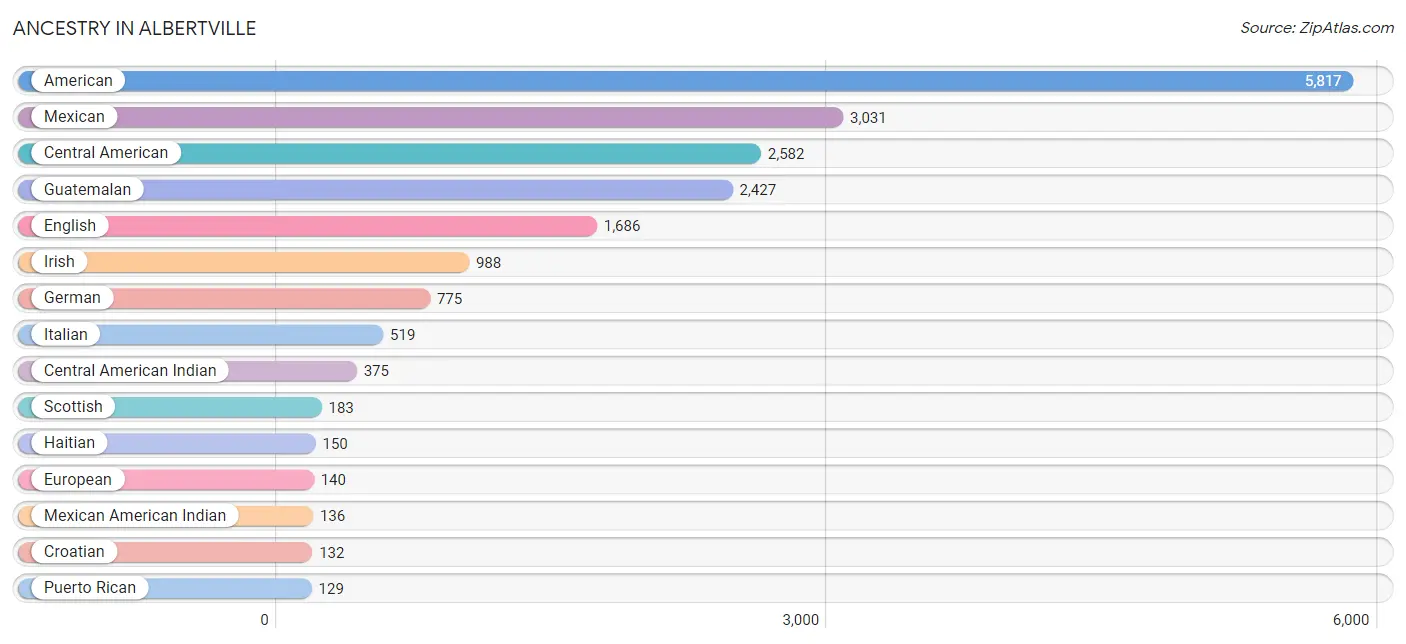
Ancestry in Albertville
The most populous ancestries reported in Albertville are American (5,817 | 25.9%), Mexican (3,031 | 13.5%), Central American (2,582 | 11.5%), Guatemalan (2,427 | 10.8%), and English (1,686 | 7.5%), together accounting for 69.3% of all Albertville residents.
| Ancestry | # Population | % Population |
| African | 53 | 0.2% |
| American | 5,817 | 25.9% |
| Arab | 1 | 0.0% |
| British | 45 | 0.2% |
| Burmese | 62 | 0.3% |
| Cajun | 2 | 0.0% |
| Central American | 2,582 | 11.5% |
| Central American Indian | 375 | 1.7% |
| Cherokee | 62 | 0.3% |
| Colombian | 9 | 0.0% |
| Comanche | 1 | 0.0% |
| Croatian | 132 | 0.6% |
| Cuban | 25 | 0.1% |
| Dutch | 55 | 0.3% |
| Eastern European | 2 | 0.0% |
| English | 1,686 | 7.5% |
| European | 140 | 0.6% |
| French | 53 | 0.2% |
| French Canadian | 29 | 0.1% |
| German | 775 | 3.5% |
| Greek | 22 | 0.1% |
| Guamanian / Chamorro | 4 | 0.0% |
| Guatemalan | 2,427 | 10.8% |
| Haitian | 150 | 0.7% |
| Honduran | 57 | 0.3% |
| Hungarian | 8 | 0.0% |
| Indian (Asian) | 29 | 0.1% |
| Irish | 988 | 4.4% |
| Italian | 519 | 2.3% |
| Korean | 27 | 0.1% |
| Mexican | 3,031 | 13.5% |
| Mexican American Indian | 136 | 0.6% |
| Moroccan | 1 | 0.0% |
| Nicaraguan | 76 | 0.3% |
| Polish | 74 | 0.3% |
| Puerto Rican | 129 | 0.6% |
| Salvadoran | 22 | 0.1% |
| Scotch-Irish | 92 | 0.4% |
| Scottish | 183 | 0.8% |
| Serbian | 18 | 0.1% |
| South American | 26 | 0.1% |
| Spanish | 16 | 0.1% |
| Sri Lankan | 95 | 0.4% |
| Subsaharan African | 53 | 0.2% |
| Swedish | 30 | 0.1% |
| Venezuelan | 17 | 0.1% |
| Welsh | 42 | 0.2% | View All 47 Rows |
Immigrants in Albertville
The most numerous immigrant groups reported in Albertville came from Latin America (2,765 | 12.3%), Central America (2,466 | 11.0%), Guatemala (1,171 | 5.2%), Mexico (1,152 | 5.1%), and Caribbean (273 | 1.2%), together accounting for 34.9% of all Albertville residents.
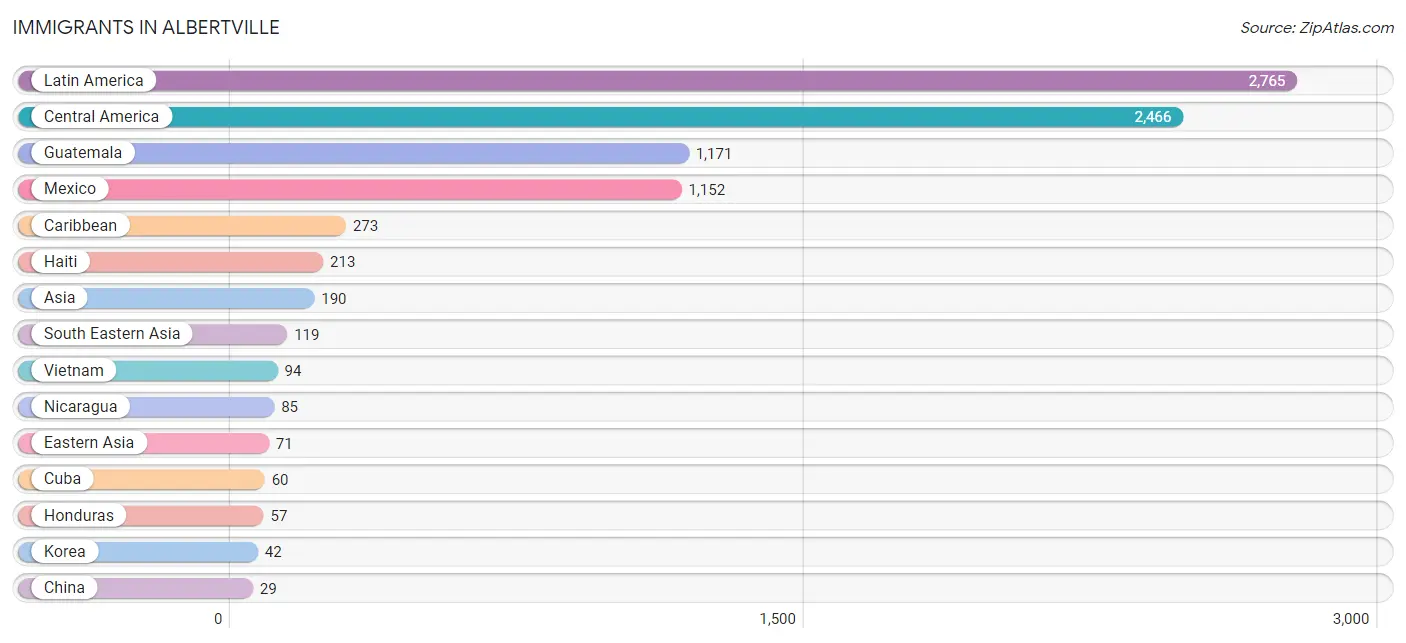
| Immigration Origin | # Population | % Population |
| Asia | 190 | 0.9% |
| Canada | 9 | 0.0% |
| Caribbean | 273 | 1.2% |
| Central America | 2,466 | 11.0% |
| China | 29 | 0.1% |
| Colombia | 9 | 0.0% |
| Cuba | 60 | 0.3% |
| Eastern Asia | 71 | 0.3% |
| El Salvador | 1 | 0.0% |
| Europe | 19 | 0.1% |
| Greece | 11 | 0.1% |
| Guatemala | 1,171 | 5.2% |
| Haiti | 213 | 0.9% |
| Honduras | 57 | 0.3% |
| Korea | 42 | 0.2% |
| Latin America | 2,765 | 12.3% |
| Mexico | 1,152 | 5.1% |
| Netherlands | 8 | 0.0% |
| Nicaragua | 85 | 0.4% |
| Philippines | 25 | 0.1% |
| South America | 26 | 0.1% |
| South Eastern Asia | 119 | 0.5% |
| Southern Europe | 11 | 0.1% |
| Venezuela | 17 | 0.1% |
| Vietnam | 94 | 0.4% |
| Western Europe | 8 | 0.0% | View All 26 Rows |
Sex and Age in Albertville
Sex and Age in Albertville
The most populous age groups in Albertville are 10 to 14 Years (1,237 | 11.8%) for men and Under 5 Years (1,164 | 9.7%) for women.
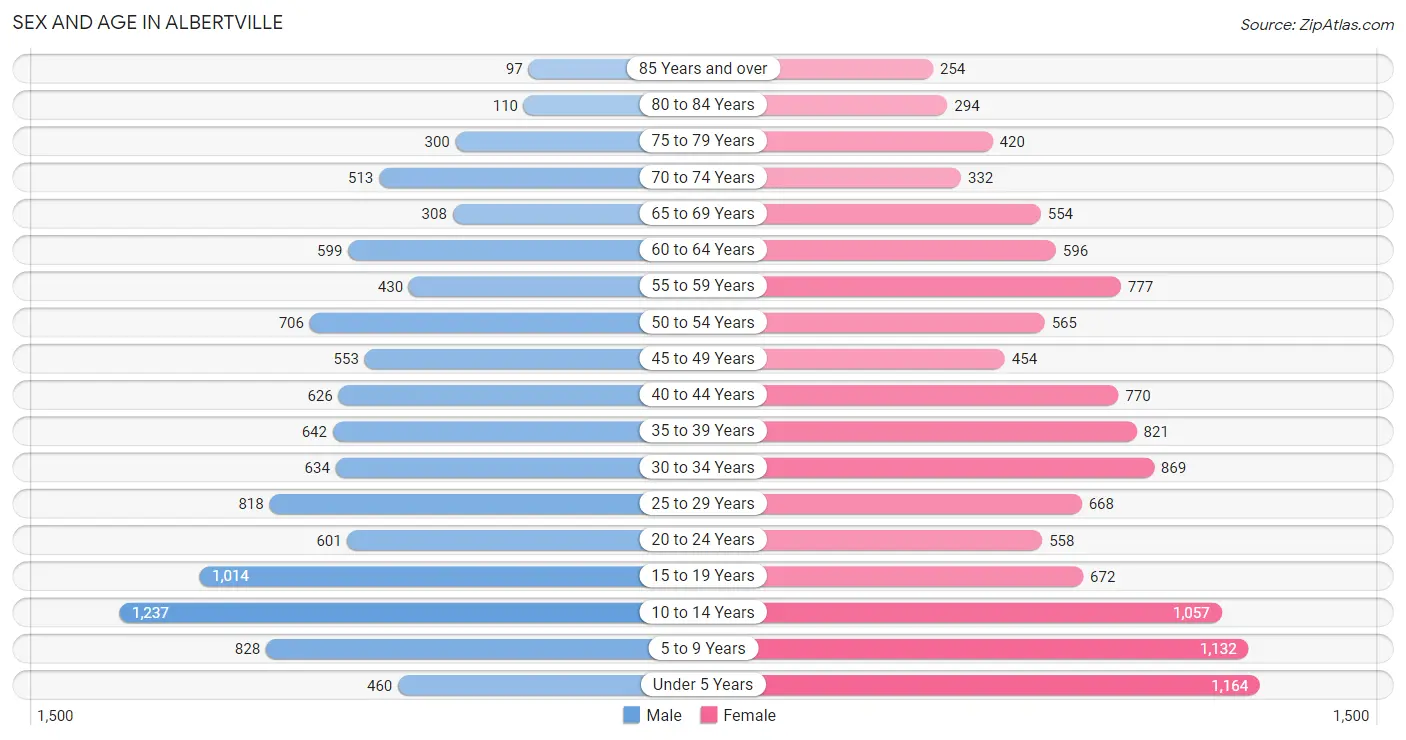
| Age Bracket | Male | Female |
| Under 5 Years | 460 (4.4%) | 1,164 (9.7%) |
| 5 to 9 Years | 828 (7.9%) | 1,132 (9.5%) |
| 10 to 14 Years | 1,237 (11.8%) | 1,057 (8.8%) |
| 15 to 19 Years | 1,014 (9.7%) | 672 (5.6%) |
| 20 to 24 Years | 601 (5.7%) | 558 (4.7%) |
| 25 to 29 Years | 818 (7.8%) | 668 (5.6%) |
| 30 to 34 Years | 634 (6.0%) | 869 (7.3%) |
| 35 to 39 Years | 642 (6.1%) | 821 (6.9%) |
| 40 to 44 Years | 626 (6.0%) | 770 (6.4%) |
| 45 to 49 Years | 553 (5.3%) | 454 (3.8%) |
| 50 to 54 Years | 706 (6.7%) | 565 (4.7%) |
| 55 to 59 Years | 430 (4.1%) | 777 (6.5%) |
| 60 to 64 Years | 599 (5.7%) | 596 (5.0%) |
| 65 to 69 Years | 308 (2.9%) | 554 (4.6%) |
| 70 to 74 Years | 513 (4.9%) | 332 (2.8%) |
| 75 to 79 Years | 300 (2.9%) | 420 (3.5%) |
| 80 to 84 Years | 110 (1.1%) | 294 (2.5%) |
| 85 Years and over | 97 (0.9%) | 254 (2.1%) |
| Total | 10,476 (100.0%) | 11,957 (100.0%) |
Families and Households in Albertville
Median Family Size in Albertville
The median family size in Albertville is 3.54 persons per family, with single female/mother families (1,247 | 23.1%) accounting for the largest median family size of 3.6 persons per family. On the other hand, single male/father families (366 | 6.8%) represent the smallest median family size with 3.15 persons per family.
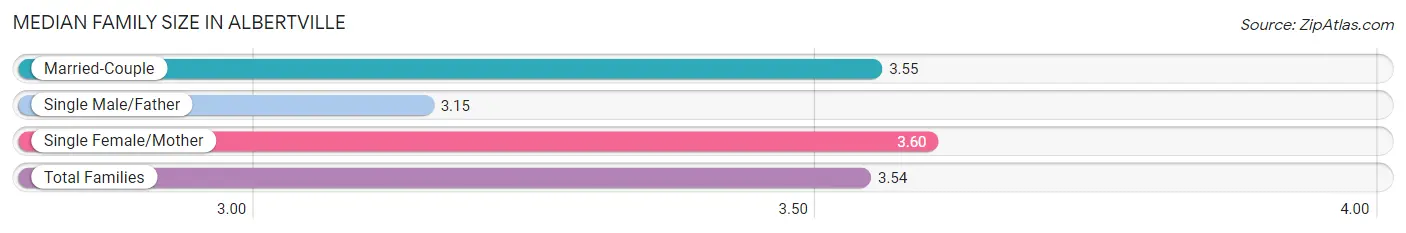
| Family Type | # Families | Family Size |
| Married-Couple | 3,785 (70.1%) | 3.55 |
| Single Male/Father | 366 (6.8%) | 3.15 |
| Single Female/Mother | 1,247 (23.1%) | 3.60 |
| Total Families | 5,398 (100.0%) | 3.54 |
Median Household Size in Albertville
The median household size in Albertville is 2.92 persons per household, with single female/mother households (1,247 | 16.5%) accounting for the largest median household size of 3.67 persons per household. non-family households (2,178 | 28.7%) represent the smallest median household size with 1.19 persons per household.
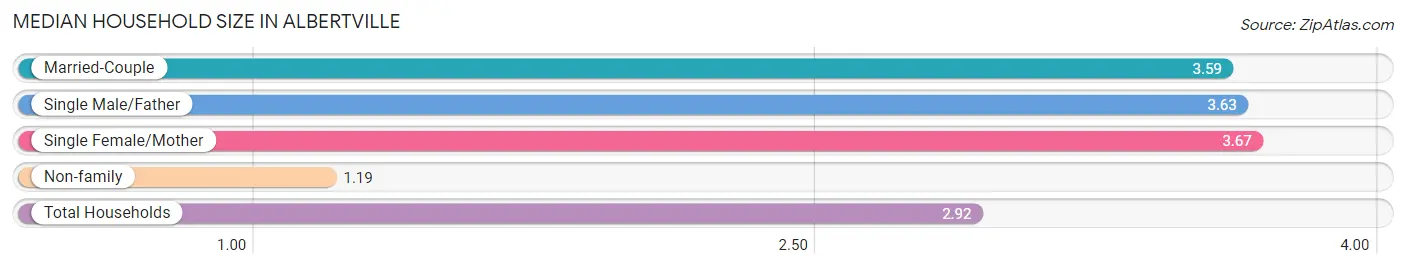
| Household Type | # Households | Household Size |
| Married-Couple | 3,785 (50.0%) | 3.59 |
| Single Male/Father | 366 (4.8%) | 3.63 |
| Single Female/Mother | 1,247 (16.5%) | 3.67 |
| Non-family | 2,178 (28.7%) | 1.19 |
| Total Households | 7,576 (100.0%) | 2.92 |
Household Size by Marriage Status in Albertville
Out of a total of 7,576 households in Albertville, 5,398 (71.3%) are family households, while 2,178 (28.7%) are nonfamily households. The most numerous type of family households are 2-person households, comprising 1,983, and the most common type of nonfamily households are 1-person households, comprising 1,990.
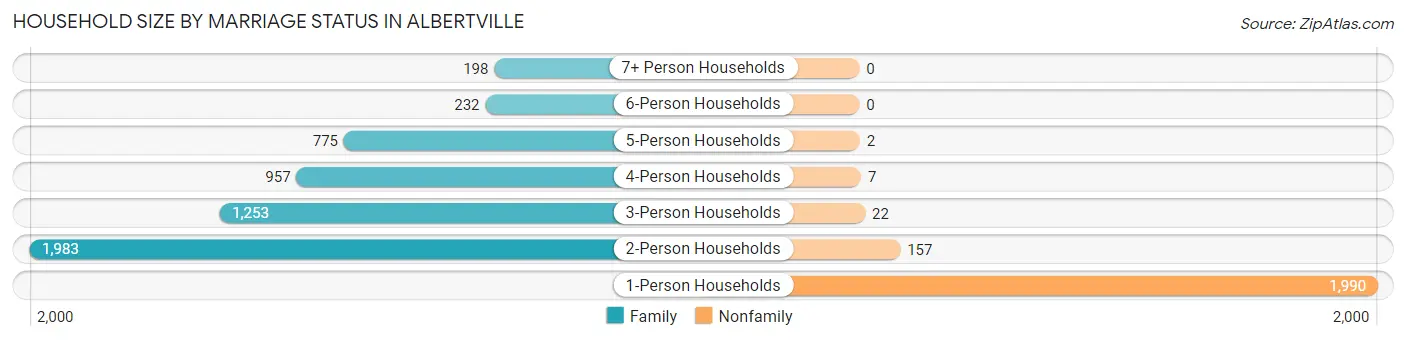
| Household Size | Family Households | Nonfamily Households |
| 1-Person Households | - | 1,990 (26.3%) |
| 2-Person Households | 1,983 (26.2%) | 157 (2.1%) |
| 3-Person Households | 1,253 (16.5%) | 22 (0.3%) |
| 4-Person Households | 957 (12.6%) | 7 (0.1%) |
| 5-Person Households | 775 (10.2%) | 2 (0.0%) |
| 6-Person Households | 232 (3.1%) | 0 (0.0%) |
| 7+ Person Households | 198 (2.6%) | 0 (0.0%) |
| Total | 5,398 (71.3%) | 2,178 (28.7%) |
Female Fertility in Albertville
Fertility by Age in Albertville
Average fertility rate in Albertville is 53.0 births per 1,000 women. Women in the age bracket of 20 to 34 years have the highest fertility rate with 77.0 births per 1,000 women. Women in the age bracket of 20 to 34 years acount for 61.2% of all women with births.
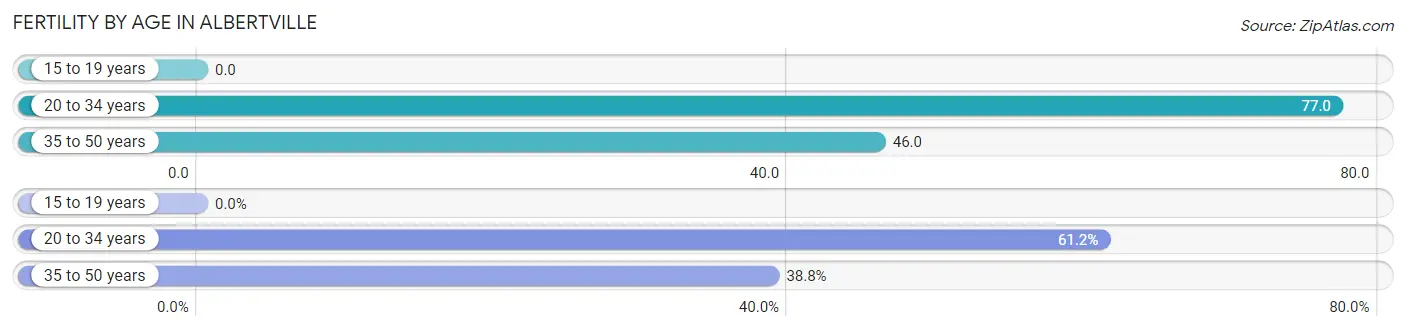
| Age Bracket | Women with Births | Births / 1,000 Women |
| 15 to 19 years | 0 (0.0%) | 0.0 |
| 20 to 34 years | 161 (61.2%) | 77.0 |
| 35 to 50 years | 102 (38.8%) | 46.0 |
| Total | 263 (100.0%) | 53.0 |
Fertility by Age by Marriage Status in Albertville
69.6% of women with births (263) in Albertville are married. The highest percentage of unmarried women with births falls into 35 to 50 years age bracket with 68.6% of them unmarried at the time of birth, while the lowest percentage of unmarried women with births belong to 20 to 34 years age bracket with 6.2% of them unmarried.
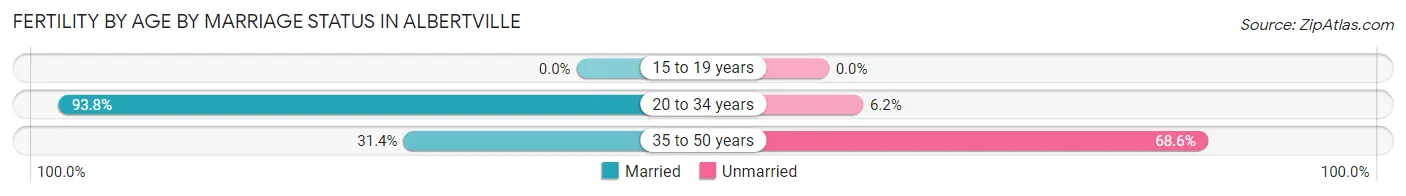
| Age Bracket | Married | Unmarried |
| 15 to 19 years | 0 (0.0%) | 0 (0.0%) |
| 20 to 34 years | 151 (93.8%) | 10 (6.2%) |
| 35 to 50 years | 32 (31.4%) | 70 (68.6%) |
| Total | 183 (69.6%) | 80 (30.4%) |
Fertility by Education in Albertville
Average fertility rate in Albertville is 53.0 births per 1,000 women. Women with the education attainment of bachelor's degree have the highest fertility rate of 153.0 births per 1,000 women, while women with the education attainment of less than high school have the lowest fertility at 25.0 births per 1,000 women. Women with the education attainment of bachelor's degree represent 37.6% of all women with births.
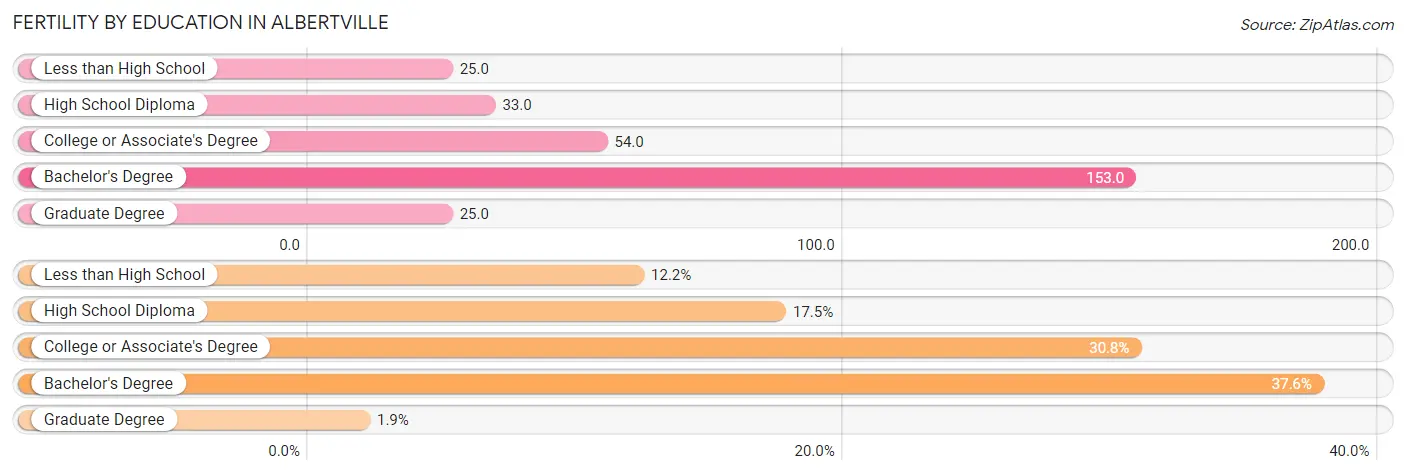
| Educational Attainment | Women with Births | Births / 1,000 Women |
| Less than High School | 32 (12.2%) | 25.0 |
| High School Diploma | 46 (17.5%) | 33.0 |
| College or Associate's Degree | 81 (30.8%) | 54.0 |
| Bachelor's Degree | 99 (37.6%) | 153.0 |
| Graduate Degree | 5 (1.9%) | 25.0 |
| Total | 263 (100.0%) | 53.0 |
Fertility by Education by Marriage Status in Albertville
30.4% of women with births in Albertville are unmarried. Women with the educational attainment of graduate degree are most likely to be married with 100.0% of them married at childbirth, while women with the educational attainment of college or associate's degree are least likely to be married with 53.1% of them unmarried at childbirth.
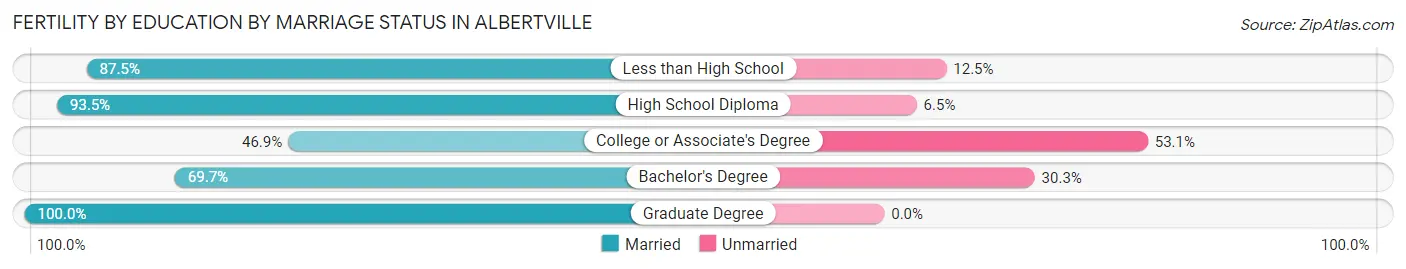
| Educational Attainment | Married | Unmarried |
| Less than High School | 28 (87.5%) | 4 (12.5%) |
| High School Diploma | 43 (93.5%) | 3 (6.5%) |
| College or Associate's Degree | 38 (46.9%) | 43 (53.1%) |
| Bachelor's Degree | 69 (69.7%) | 30 (30.3%) |
| Graduate Degree | 5 (100.0%) | 0 (0.0%) |
| Total | 183 (69.6%) | 80 (30.4%) |
Employment Characteristics in Albertville
Employment by Class of Employer in Albertville
Among the 9,002 employed individuals in Albertville, private company employees (6,308 | 70.1%), local government employees (813 | 9.0%), and self-employed (not incorporated) (496 | 5.5%) make up the most common classes of employment.
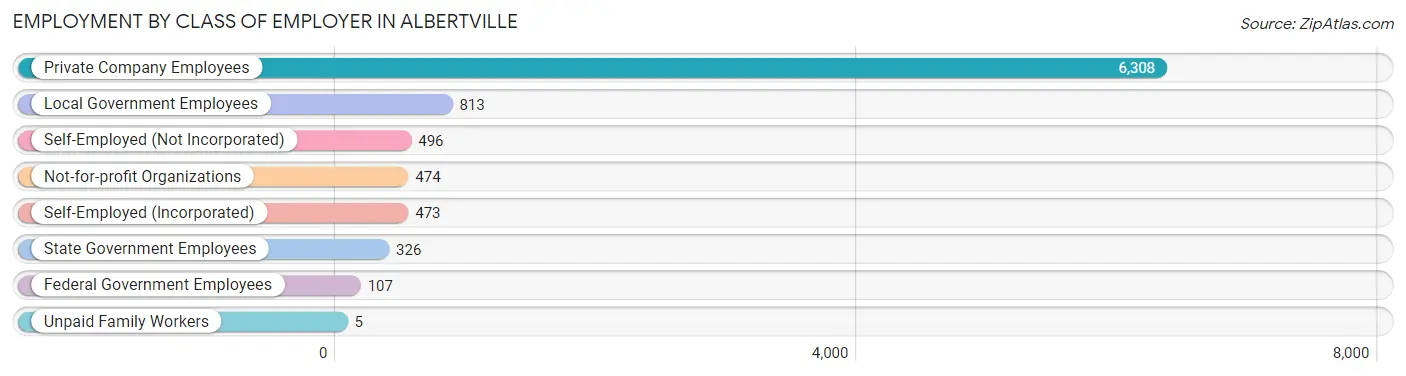
| Employer Class | # Employees | % Employees |
| Private Company Employees | 6,308 | 70.1% |
| Self-Employed (Incorporated) | 473 | 5.2% |
| Self-Employed (Not Incorporated) | 496 | 5.5% |
| Not-for-profit Organizations | 474 | 5.3% |
| Local Government Employees | 813 | 9.0% |
| State Government Employees | 326 | 3.6% |
| Federal Government Employees | 107 | 1.2% |
| Unpaid Family Workers | 5 | 0.1% |
| Total | 9,002 | 100.0% |
Employment Status by Age in Albertville
According to the labor force statistics for Albertville, out of the total population over 16 years of age (16,145), 60.2% or 9,719 individuals are in the labor force, with 6.0% or 583 of them unemployed. The age group with the highest labor force participation rate is 25 to 29 years, with 85.7% or 1,274 individuals in the labor force. Within the labor force, the 16 to 19 years age range has the highest percentage of unemployed individuals, with 21.0% or 120 of them being unemployed.
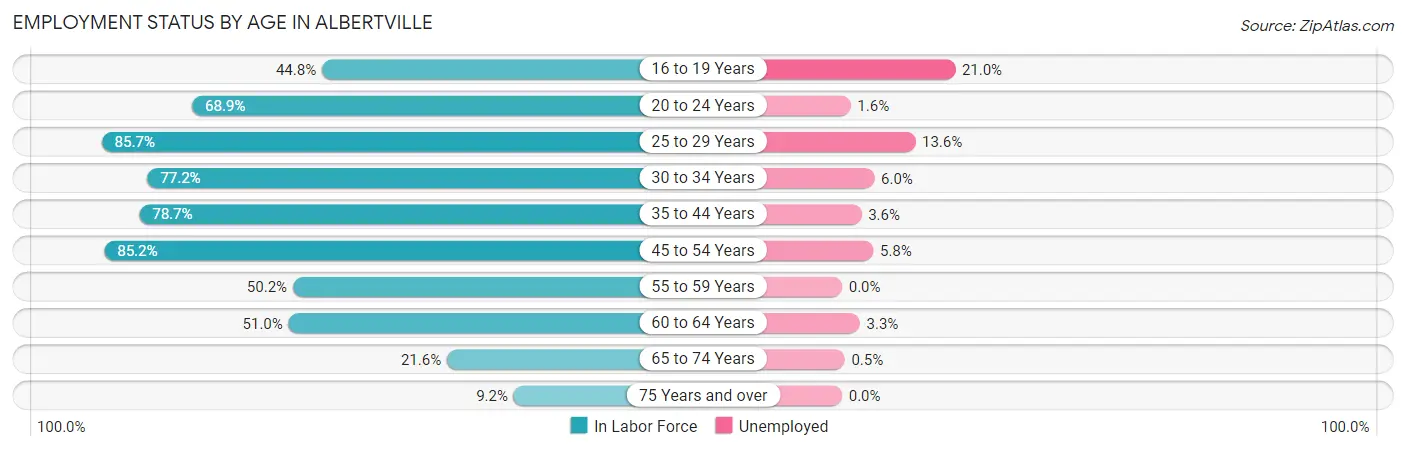
| Age Bracket | In Labor Force | Unemployed |
| 16 to 19 Years | 572 (44.8%) | 120 (21.0%) |
| 20 to 24 Years | 799 (68.9%) | 13 (1.6%) |
| 25 to 29 Years | 1,274 (85.7%) | 173 (13.6%) |
| 30 to 34 Years | 1,160 (77.2%) | 70 (6.0%) |
| 35 to 44 Years | 2,250 (78.7%) | 81 (3.6%) |
| 45 to 54 Years | 1,941 (85.2%) | 113 (5.8%) |
| 55 to 59 Years | 606 (50.2%) | 0 (0.0%) |
| 60 to 64 Years | 609 (51.0%) | 20 (3.3%) |
| 65 to 74 Years | 369 (21.6%) | 2 (0.5%) |
| 75 Years and over | 136 (9.2%) | 0 (0.0%) |
| Total | 9,719 (60.2%) | 583 (6.0%) |
Employment Status by Educational Attainment in Albertville
According to labor force statistics for Albertville, 74.5% of individuals (7,843) out of the total population between 25 and 64 years of age (10,528) are in the labor force, with 5.8% or 455 of them being unemployed. The group with the highest labor force participation rate are those with the educational attainment of bachelor's degree or higher, with 79.3% or 1,900 individuals in the labor force. Within the labor force, individuals with less than high school education have the highest percentage of unemployment, with 9.8% or 158 of them being unemployed.
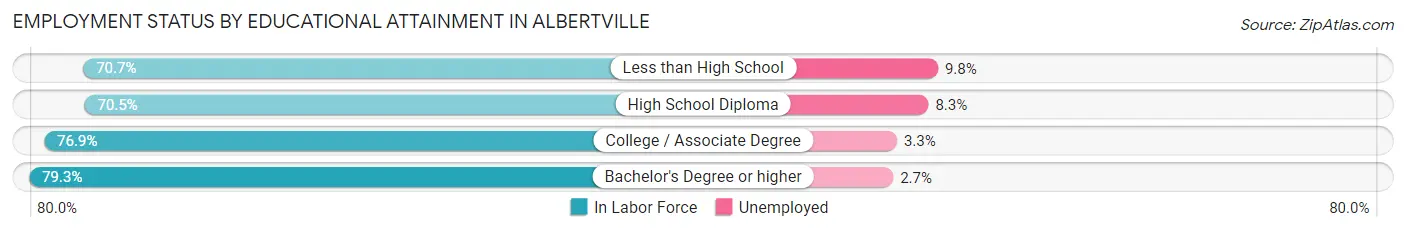
| Educational Attainment | In Labor Force | Unemployed |
| Less than High School | 1,617 (70.7%) | 224 (9.8%) |
| High School Diploma | 1,913 (70.5%) | 225 (8.3%) |
| College / Associate Degree | 2,409 (76.9%) | 103 (3.3%) |
| Bachelor's Degree or higher | 1,900 (79.3%) | 65 (2.7%) |
| Total | 7,843 (74.5%) | 611 (5.8%) |
Employment Occupations by Sex in Albertville
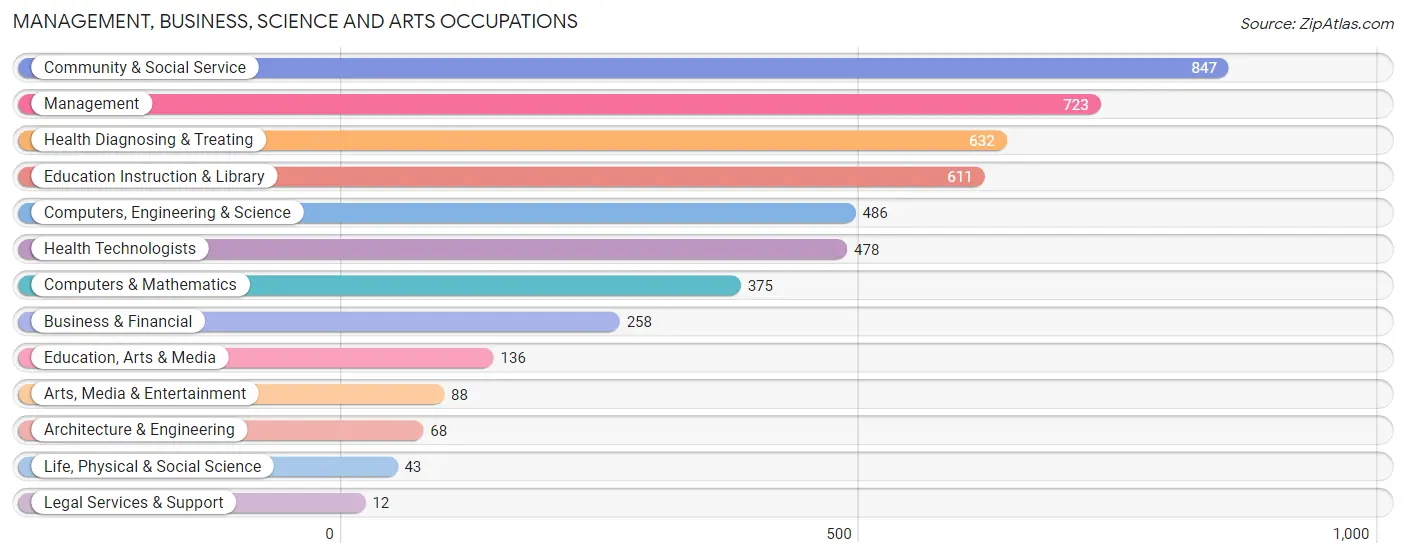
Management, Business, Science and Arts Occupations
The most common Management, Business, Science and Arts occupations in Albertville are Community & Social Service (847 | 9.3%), Management (723 | 8.0%), Health Diagnosing & Treating (632 | 7.0%), Education Instruction & Library (611 | 6.8%), and Computers, Engineering & Science (486 | 5.4%).
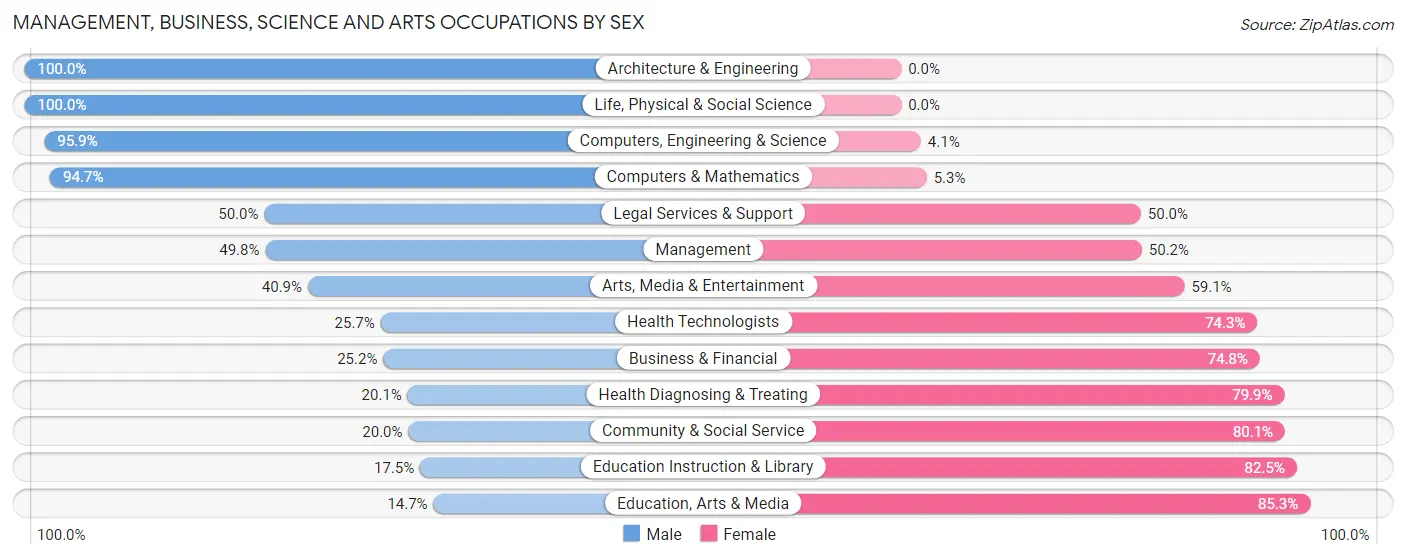
Management, Business, Science and Arts Occupations by Sex
Within the Management, Business, Science and Arts occupations in Albertville, the most male-oriented occupations are Architecture & Engineering (100.0%), Life, Physical & Social Science (100.0%), and Computers, Engineering & Science (95.9%), while the most female-oriented occupations are Education, Arts & Media (85.3%), Education Instruction & Library (82.5%), and Community & Social Service (80.0%).
| Occupation | Male | Female |
| Management | 360 (49.8%) | 363 (50.2%) |
| Business & Financial | 65 (25.2%) | 193 (74.8%) |
| Computers, Engineering & Science | 466 (95.9%) | 20 (4.1%) |
| Computers & Mathematics | 355 (94.7%) | 20 (5.3%) |
| Architecture & Engineering | 68 (100.0%) | 0 (0.0%) |
| Life, Physical & Social Science | 43 (100.0%) | 0 (0.0%) |
| Community & Social Service | 169 (20.0%) | 678 (80.0%) |
| Education, Arts & Media | 20 (14.7%) | 116 (85.3%) |
| Legal Services & Support | 6 (50.0%) | 6 (50.0%) |
| Education Instruction & Library | 107 (17.5%) | 504 (82.5%) |
| Arts, Media & Entertainment | 36 (40.9%) | 52 (59.1%) |
| Health Diagnosing & Treating | 127 (20.1%) | 505 (79.9%) |
| Health Technologists | 123 (25.7%) | 355 (74.3%) |
| Total (Category) | 1,187 (40.3%) | 1,759 (59.7%) |
| Total (Overall) | 4,723 (52.2%) | 4,331 (47.8%) |
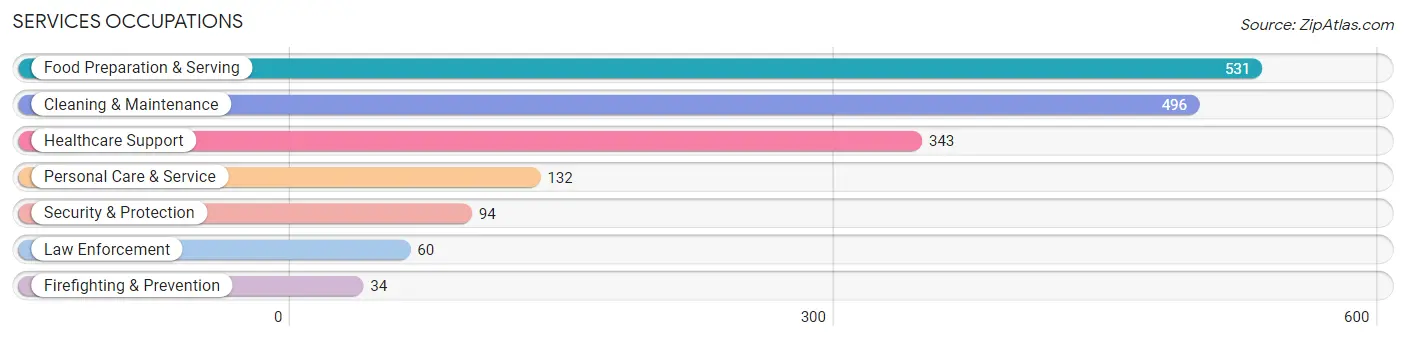
Services Occupations
The most common Services occupations in Albertville are Food Preparation & Serving (531 | 5.9%), Cleaning & Maintenance (496 | 5.5%), Healthcare Support (343 | 3.8%), Personal Care & Service (132 | 1.5%), and Security & Protection (94 | 1.0%).
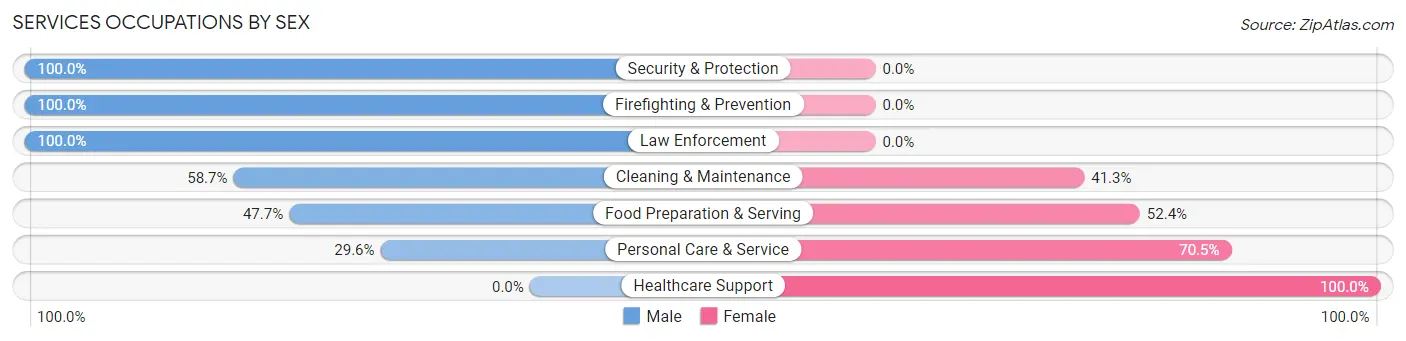
Services Occupations by Sex
Within the Services occupations in Albertville, the most male-oriented occupations are Security & Protection (100.0%), Firefighting & Prevention (100.0%), and Law Enforcement (100.0%), while the most female-oriented occupations are Healthcare Support (100.0%), Personal Care & Service (70.5%), and Food Preparation & Serving (52.3%).
| Occupation | Male | Female |
| Healthcare Support | 0 (0.0%) | 343 (100.0%) |
| Security & Protection | 94 (100.0%) | 0 (0.0%) |
| Firefighting & Prevention | 34 (100.0%) | 0 (0.0%) |
| Law Enforcement | 60 (100.0%) | 0 (0.0%) |
| Food Preparation & Serving | 253 (47.6%) | 278 (52.3%) |
| Cleaning & Maintenance | 291 (58.7%) | 205 (41.3%) |
| Personal Care & Service | 39 (29.5%) | 93 (70.5%) |
| Total (Category) | 677 (42.4%) | 919 (57.6%) |
| Total (Overall) | 4,723 (52.2%) | 4,331 (47.8%) |
Sales and Office Occupations
The most common Sales and Office occupations in Albertville are Office & Administration (776 | 8.6%), and Sales & Related (725 | 8.0%).
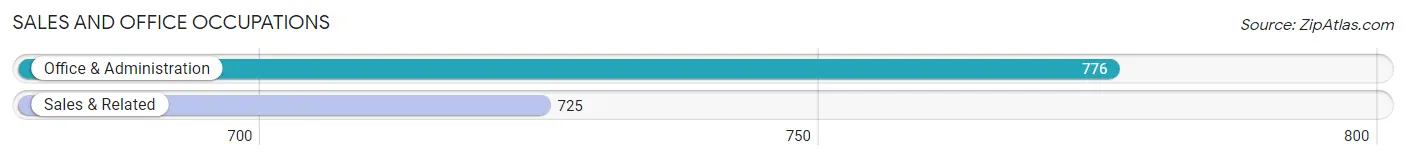
Sales and Office Occupations by Sex
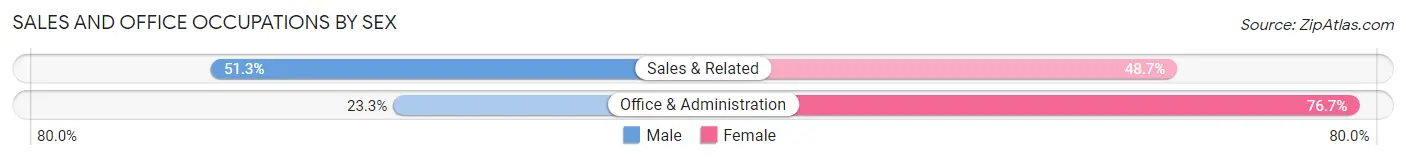
| Occupation | Male | Female |
| Sales & Related | 372 (51.3%) | 353 (48.7%) |
| Office & Administration | 181 (23.3%) | 595 (76.7%) |
| Total (Category) | 553 (36.8%) | 948 (63.2%) |
| Total (Overall) | 4,723 (52.2%) | 4,331 (47.8%) |
Natural Resources, Construction and Maintenance Occupations
The most common Natural Resources, Construction and Maintenance occupations in Albertville are Construction & Extraction (603 | 6.7%), Installation, Maintenance & Repair (383 | 4.2%), and Farming, Fishing & Forestry (35 | 0.4%).
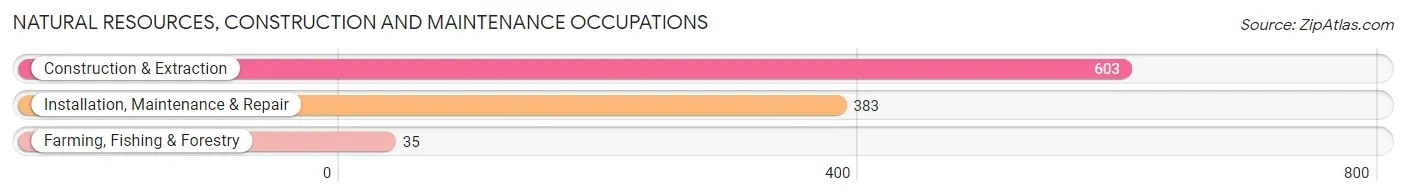
Natural Resources, Construction and Maintenance Occupations by Sex
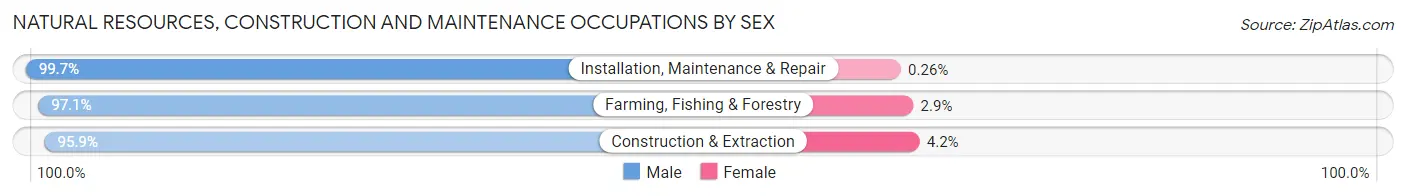
| Occupation | Male | Female |
| Farming, Fishing & Forestry | 34 (97.1%) | 1 (2.9%) |
| Construction & Extraction | 578 (95.9%) | 25 (4.2%) |
| Installation, Maintenance & Repair | 382 (99.7%) | 1 (0.3%) |
| Total (Category) | 994 (97.4%) | 27 (2.6%) |
| Total (Overall) | 4,723 (52.2%) | 4,331 (47.8%) |
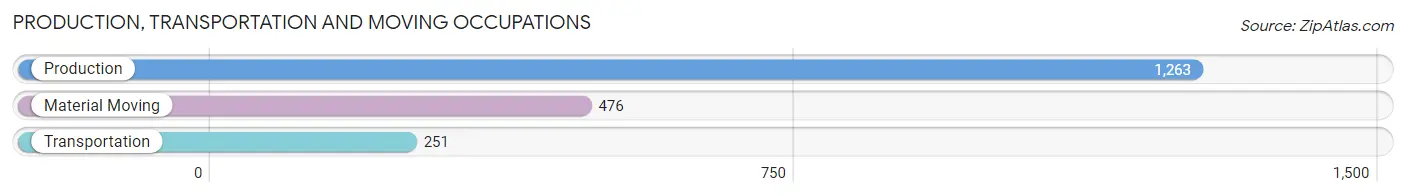
Production, Transportation and Moving Occupations
The most common Production, Transportation and Moving occupations in Albertville are Production (1,263 | 14.0%), Material Moving (476 | 5.3%), and Transportation (251 | 2.8%).
Production, Transportation and Moving Occupations by Sex
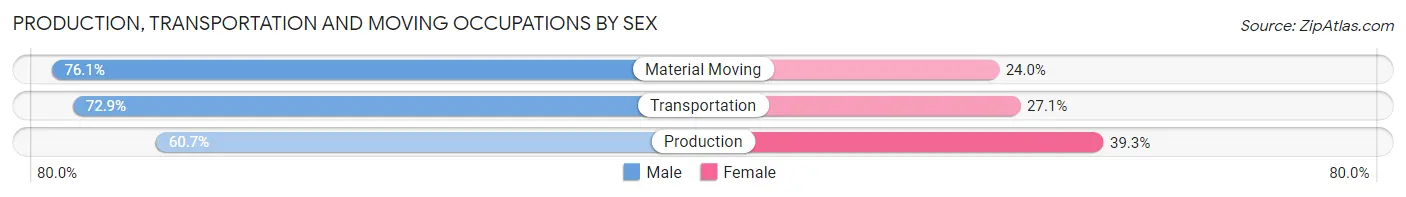
| Occupation | Male | Female |
| Production | 767 (60.7%) | 496 (39.3%) |
| Transportation | 183 (72.9%) | 68 (27.1%) |
| Material Moving | 362 (76.0%) | 114 (23.9%) |
| Total (Category) | 1,312 (65.9%) | 678 (34.1%) |
| Total (Overall) | 4,723 (52.2%) | 4,331 (47.8%) |
Employment Industries by Sex in Albertville
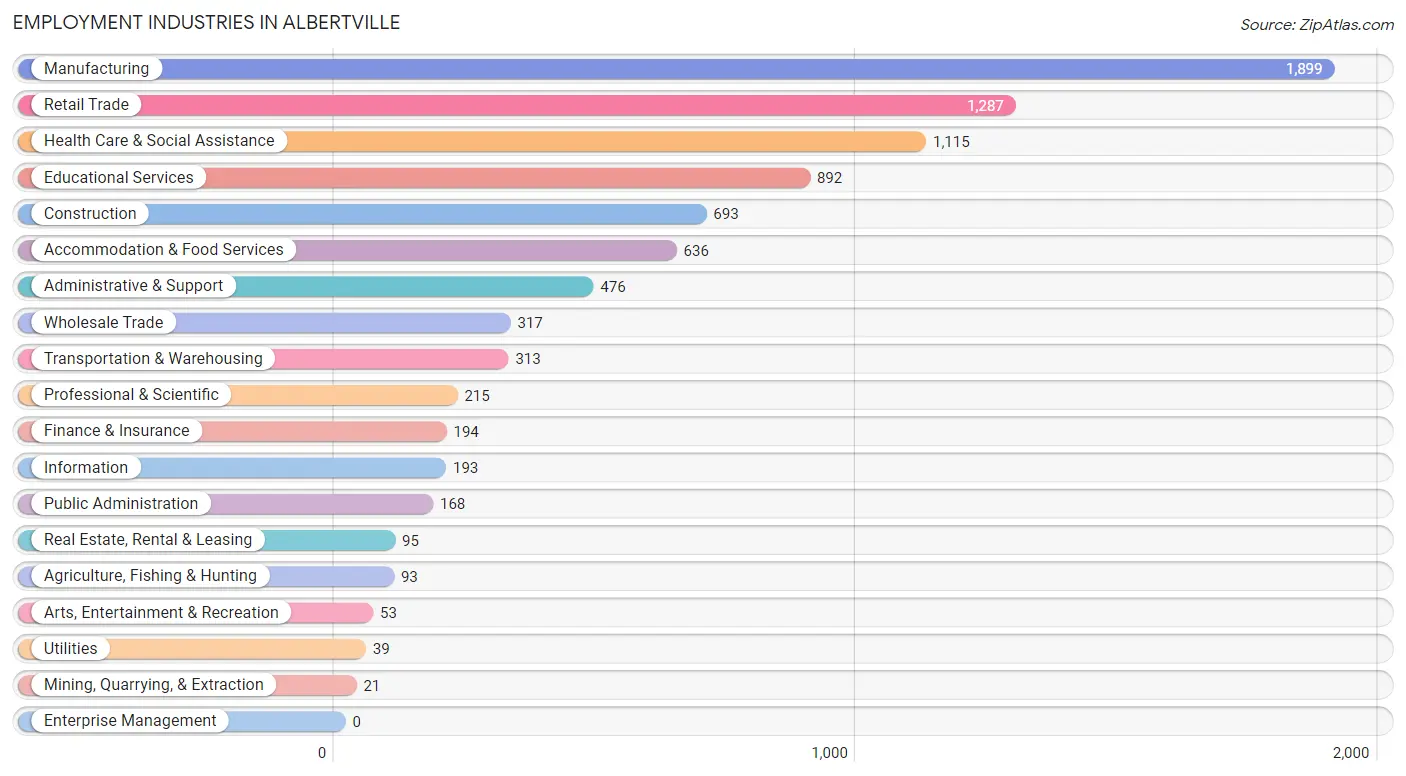
Employment Industries in Albertville
The major employment industries in Albertville include Manufacturing (1,899 | 21.0%), Retail Trade (1,287 | 14.2%), Health Care & Social Assistance (1,115 | 12.3%), Educational Services (892 | 9.9%), and Construction (693 | 7.6%).
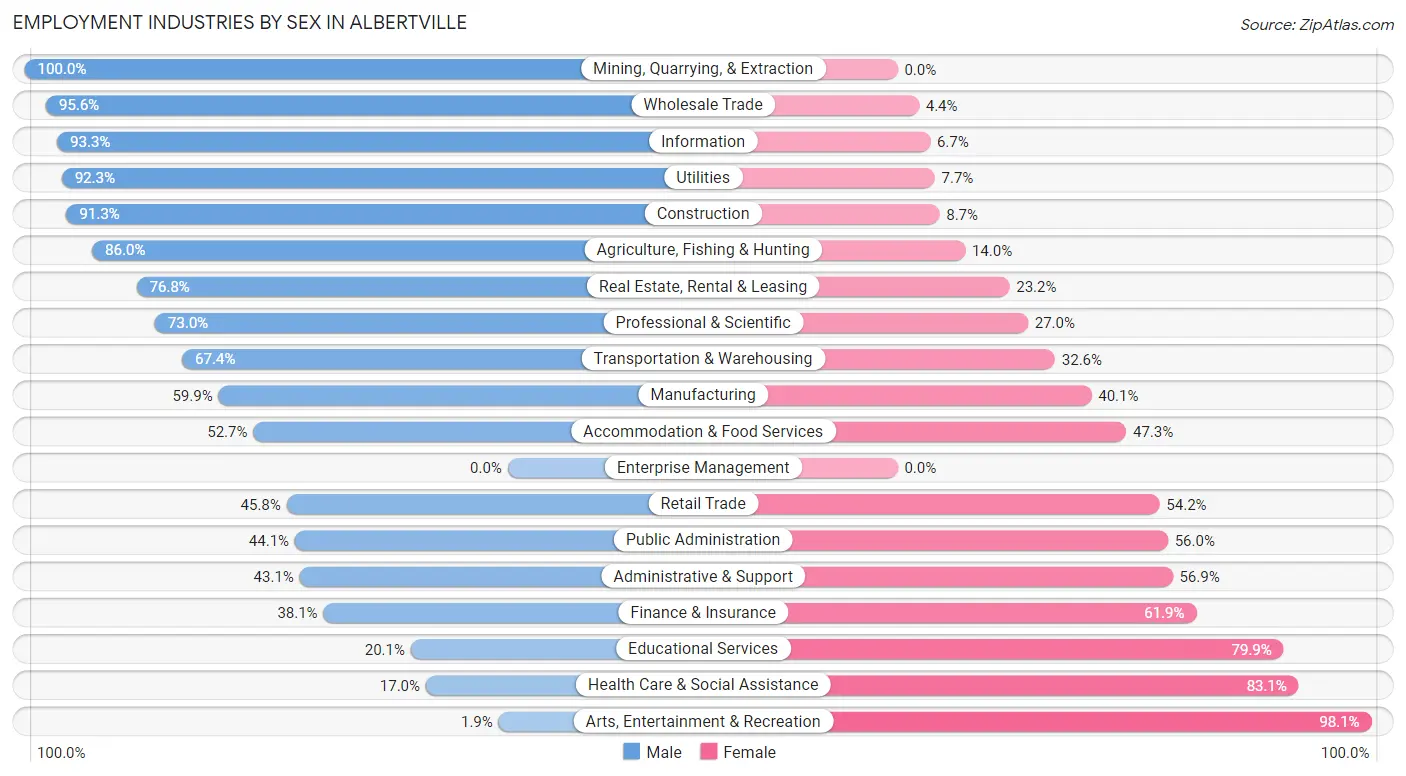
Employment Industries by Sex in Albertville
The Albertville industries that see more men than women are Mining, Quarrying, & Extraction (100.0%), Wholesale Trade (95.6%), and Information (93.3%), whereas the industries that tend to have a higher number of women are Arts, Entertainment & Recreation (98.1%), Health Care & Social Assistance (83.1%), and Educational Services (79.9%).
| Industry | Male | Female |
| Agriculture, Fishing & Hunting | 80 (86.0%) | 13 (14.0%) |
| Mining, Quarrying, & Extraction | 21 (100.0%) | 0 (0.0%) |
| Construction | 633 (91.3%) | 60 (8.7%) |
| Manufacturing | 1,137 (59.9%) | 762 (40.1%) |
| Wholesale Trade | 303 (95.6%) | 14 (4.4%) |
| Retail Trade | 589 (45.8%) | 698 (54.2%) |
| Transportation & Warehousing | 211 (67.4%) | 102 (32.6%) |
| Utilities | 36 (92.3%) | 3 (7.7%) |
| Information | 180 (93.3%) | 13 (6.7%) |
| Finance & Insurance | 74 (38.1%) | 120 (61.9%) |
| Real Estate, Rental & Leasing | 73 (76.8%) | 22 (23.2%) |
| Professional & Scientific | 157 (73.0%) | 58 (27.0%) |
| Enterprise Management | 0 (0.0%) | 0 (0.0%) |
| Administrative & Support | 205 (43.1%) | 271 (56.9%) |
| Educational Services | 179 (20.1%) | 713 (79.9%) |
| Health Care & Social Assistance | 189 (17.0%) | 926 (83.1%) |
| Arts, Entertainment & Recreation | 1 (1.9%) | 52 (98.1%) |
| Accommodation & Food Services | 335 (52.7%) | 301 (47.3%) |
| Public Administration | 74 (44.1%) | 94 (55.9%) |
| Total | 4,723 (52.2%) | 4,331 (47.8%) |
Education in Albertville
School Enrollment in Albertville
The most common levels of schooling among the 6,820 students in Albertville are middle school (1,892 | 27.7%), high school (1,563 | 22.9%), and elementary school (1,558 | 22.8%).
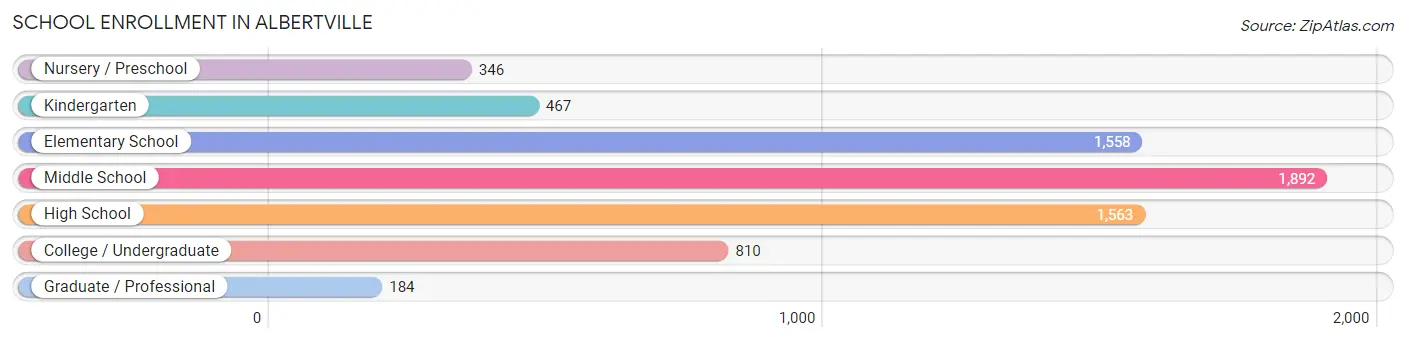
| School Level | # Students | % Students |
| Nursery / Preschool | 346 | 5.1% |
| Kindergarten | 467 | 6.9% |
| Elementary School | 1,558 | 22.8% |
| Middle School | 1,892 | 27.7% |
| High School | 1,563 | 22.9% |
| College / Undergraduate | 810 | 11.9% |
| Graduate / Professional | 184 | 2.7% |
| Total | 6,820 | 100.0% |
School Enrollment by Age by Funding Source in Albertville
Out of a total of 6,820 students who are enrolled in schools in Albertville, 396 (5.8%) attend a private institution, while the remaining 6,424 (94.2%) are enrolled in public schools. The age group of 35 years and over has the highest likelihood of being enrolled in private schools, with 72 (29.5% in the age bracket) enrolled. Conversely, the age group of 25 to 34 year olds has the lowest likelihood of being enrolled in a private school, with 256 (99.2% in the age bracket) attending a public institution.
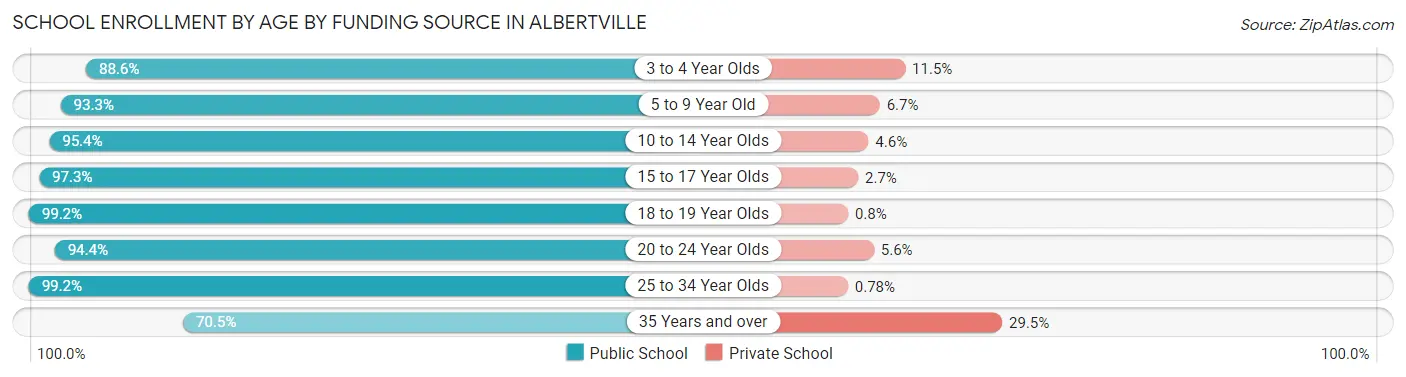
| Age Bracket | Public School | Private School |
| 3 to 4 Year Olds | 317 (88.5%) | 41 (11.5%) |
| 5 to 9 Year Old | 1,695 (93.3%) | 122 (6.7%) |
| 10 to 14 Year Olds | 2,111 (95.4%) | 102 (4.6%) |
| 15 to 17 Year Olds | 941 (97.3%) | 26 (2.7%) |
| 18 to 19 Year Olds | 496 (99.2%) | 4 (0.8%) |
| 20 to 24 Year Olds | 437 (94.4%) | 26 (5.6%) |
| 25 to 34 Year Olds | 256 (99.2%) | 2 (0.8%) |
| 35 Years and over | 172 (70.5%) | 72 (29.5%) |
| Total | 6,424 (94.2%) | 396 (5.8%) |
Educational Attainment by Field of Study in Albertville
Business (895 | 29.5%), education (730 | 24.1%), science & technology (313 | 10.3%), arts & humanities (260 | 8.6%), and bio, nature & agricultural (181 | 6.0%) are the most common fields of study among 3,033 individuals in Albertville who have obtained a bachelor's degree or higher.
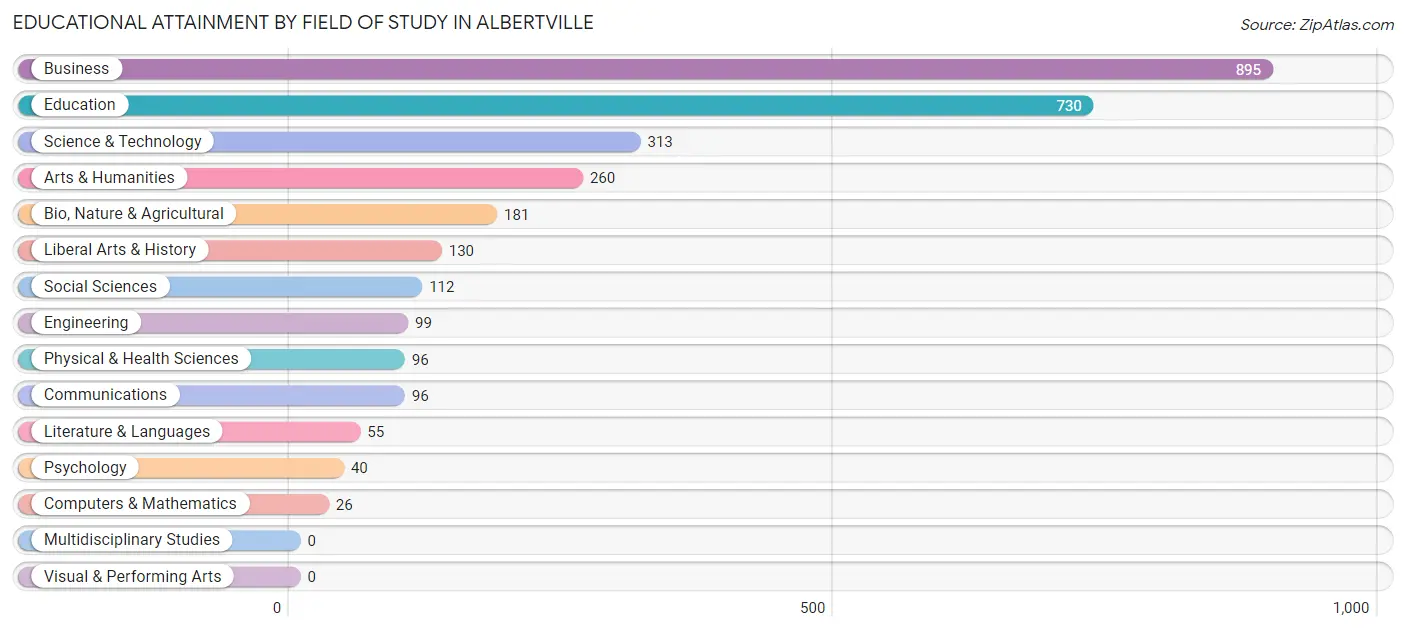
| Field of Study | # Graduates | % Graduates |
| Computers & Mathematics | 26 | 0.9% |
| Bio, Nature & Agricultural | 181 | 6.0% |
| Physical & Health Sciences | 96 | 3.2% |
| Psychology | 40 | 1.3% |
| Social Sciences | 112 | 3.7% |
| Engineering | 99 | 3.3% |
| Multidisciplinary Studies | 0 | 0.0% |
| Science & Technology | 313 | 10.3% |
| Business | 895 | 29.5% |
| Education | 730 | 24.1% |
| Literature & Languages | 55 | 1.8% |
| Liberal Arts & History | 130 | 4.3% |
| Visual & Performing Arts | 0 | 0.0% |
| Communications | 96 | 3.2% |
| Arts & Humanities | 260 | 8.6% |
| Total | 3,033 | 100.0% |
Transportation & Commute in Albertville
Vehicle Availability by Sex in Albertville
The most prevalent vehicle ownership categories in Albertville are males with 2 vehicles (2,073, accounting for 43.6%) and females with 2 vehicles (1,516, making up 48.8%).
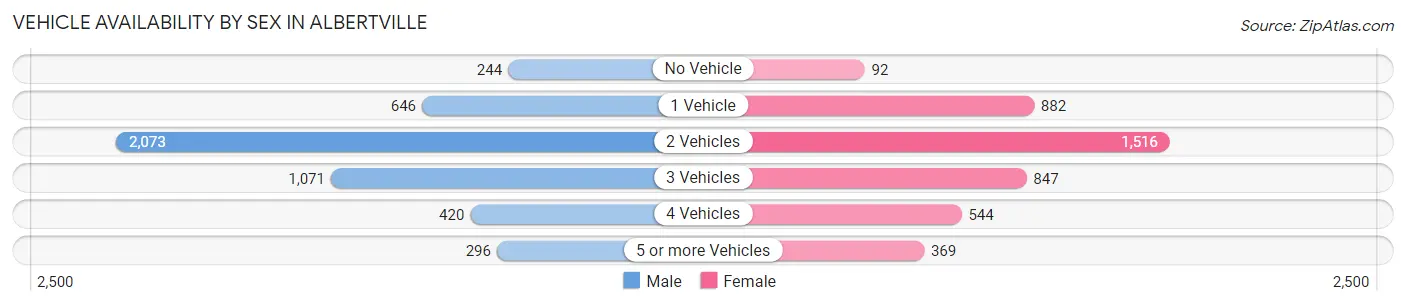
| Vehicles Available | Male | Female |
| No Vehicle | 244 (5.1%) | 92 (2.2%) |
| 1 Vehicle | 646 (13.6%) | 882 (20.7%) |
| 2 Vehicles | 2,073 (43.6%) | 1,516 (35.7%) |
| 3 Vehicles | 1,071 (22.6%) | 847 (19.9%) |
| 4 Vehicles | 420 (8.8%) | 544 (12.8%) |
| 5 or more Vehicles | 296 (6.2%) | 369 (8.7%) |
| Total | 4,750 (100.0%) | 4,250 (100.0%) |
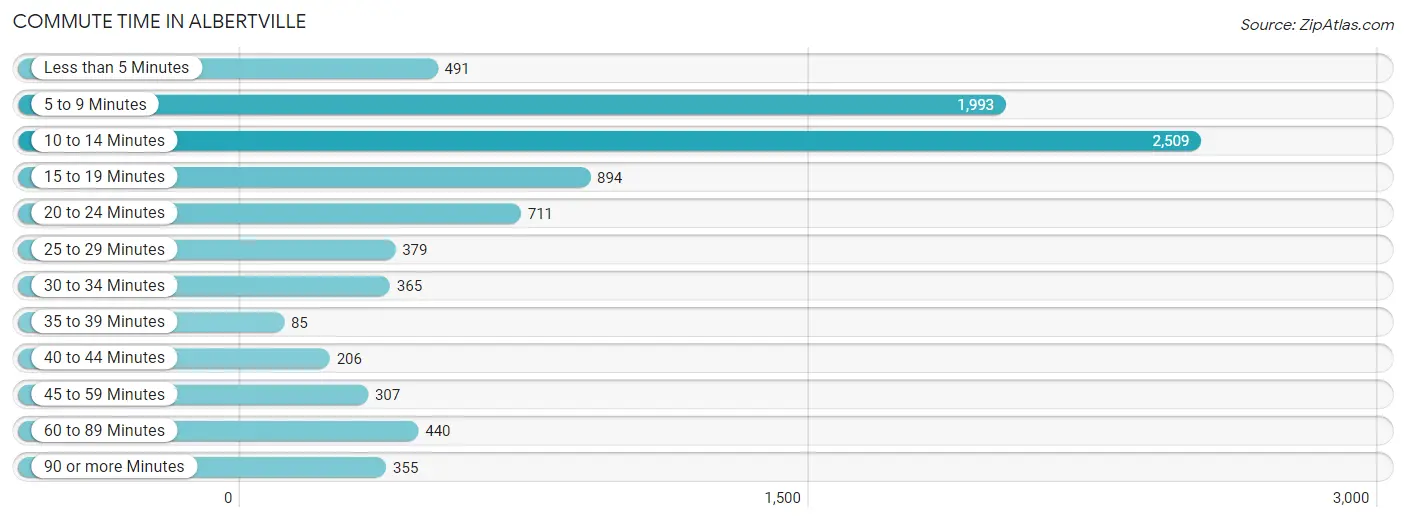
Commute Time in Albertville
The most frequently occuring commute durations in Albertville are 10 to 14 minutes (2,509 commuters, 28.7%), 5 to 9 minutes (1,993 commuters, 22.8%), and 15 to 19 minutes (894 commuters, 10.2%).
| Commute Time | # Commuters | % Commuters |
| Less than 5 Minutes | 491 | 5.6% |
| 5 to 9 Minutes | 1,993 | 22.8% |
| 10 to 14 Minutes | 2,509 | 28.7% |
| 15 to 19 Minutes | 894 | 10.2% |
| 20 to 24 Minutes | 711 | 8.1% |
| 25 to 29 Minutes | 379 | 4.3% |
| 30 to 34 Minutes | 365 | 4.2% |
| 35 to 39 Minutes | 85 | 1.0% |
| 40 to 44 Minutes | 206 | 2.4% |
| 45 to 59 Minutes | 307 | 3.5% |
| 60 to 89 Minutes | 440 | 5.0% |
| 90 or more Minutes | 355 | 4.1% |
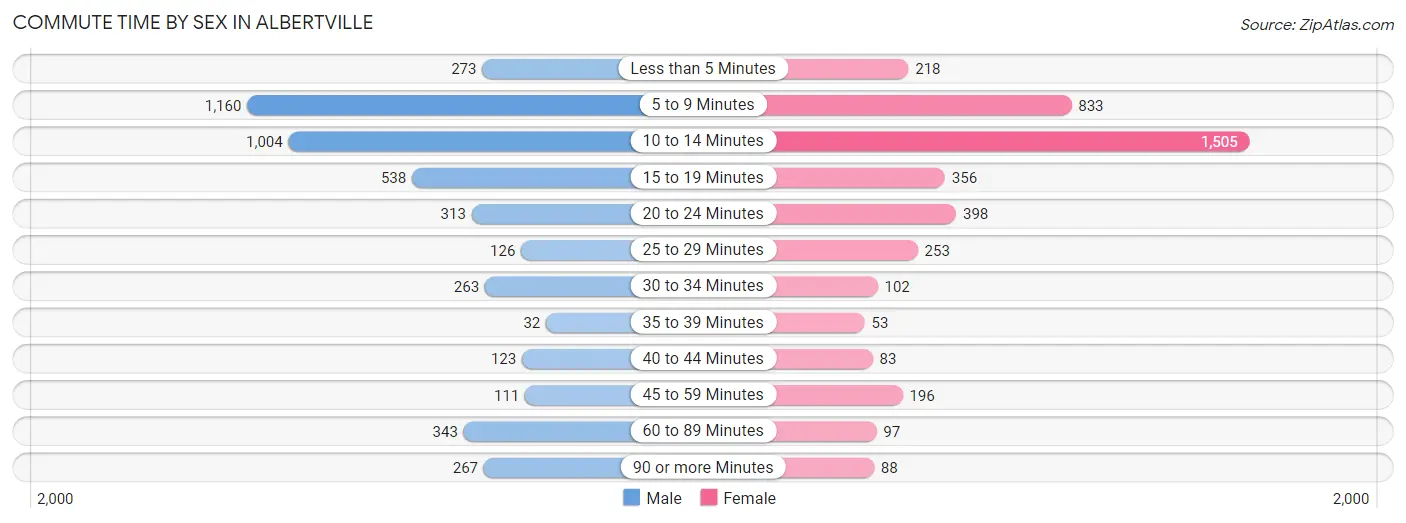
Commute Time by Sex in Albertville
The most common commute times in Albertville are 5 to 9 minutes (1,160 commuters, 25.5%) for males and 10 to 14 minutes (1,505 commuters, 36.0%) for females.
| Commute Time | Male | Female |
| Less than 5 Minutes | 273 (6.0%) | 218 (5.2%) |
| 5 to 9 Minutes | 1,160 (25.5%) | 833 (19.9%) |
| 10 to 14 Minutes | 1,004 (22.1%) | 1,505 (36.0%) |
| 15 to 19 Minutes | 538 (11.8%) | 356 (8.5%) |
| 20 to 24 Minutes | 313 (6.9%) | 398 (9.5%) |
| 25 to 29 Minutes | 126 (2.8%) | 253 (6.0%) |
| 30 to 34 Minutes | 263 (5.8%) | 102 (2.4%) |
| 35 to 39 Minutes | 32 (0.7%) | 53 (1.3%) |
| 40 to 44 Minutes | 123 (2.7%) | 83 (2.0%) |
| 45 to 59 Minutes | 111 (2.4%) | 196 (4.7%) |
| 60 to 89 Minutes | 343 (7.5%) | 97 (2.3%) |
| 90 or more Minutes | 267 (5.9%) | 88 (2.1%) |
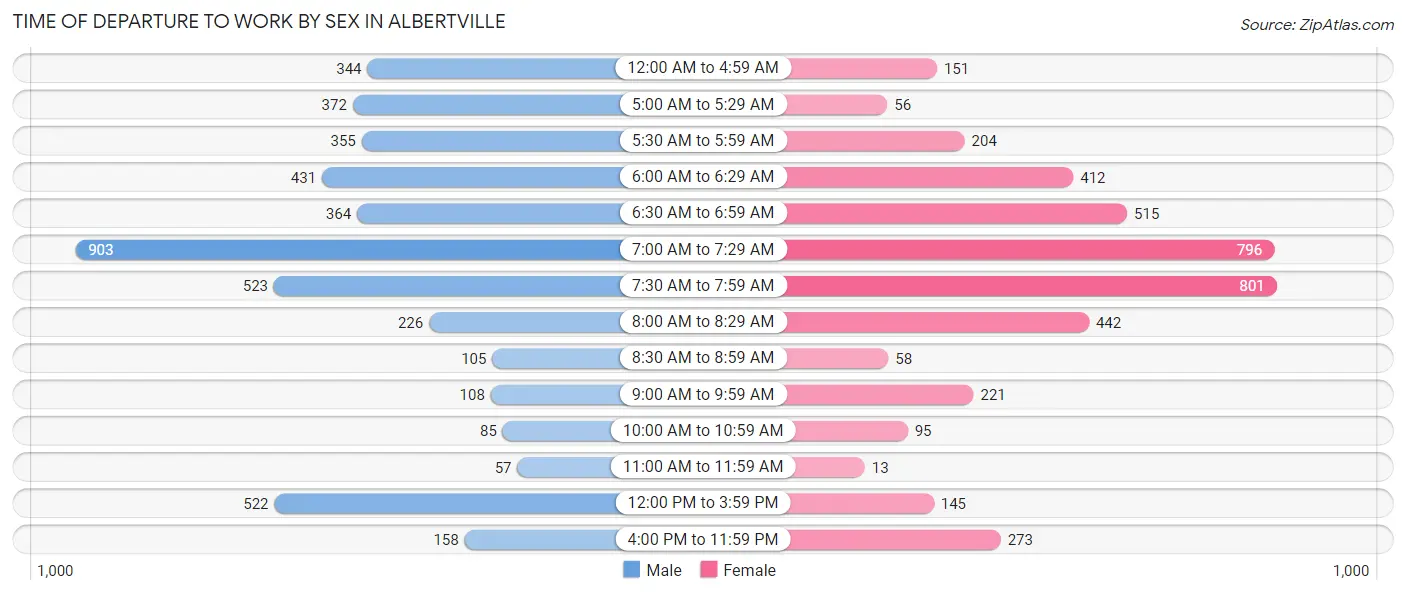
Time of Departure to Work by Sex in Albertville
The most frequent times of departure to work in Albertville are 7:00 AM to 7:29 AM (903, 19.8%) for males and 7:30 AM to 7:59 AM (801, 19.2%) for females.
| Time of Departure | Male | Female |
| 12:00 AM to 4:59 AM | 344 (7.6%) | 151 (3.6%) |
| 5:00 AM to 5:29 AM | 372 (8.2%) | 56 (1.3%) |
| 5:30 AM to 5:59 AM | 355 (7.8%) | 204 (4.9%) |
| 6:00 AM to 6:29 AM | 431 (9.5%) | 412 (9.9%) |
| 6:30 AM to 6:59 AM | 364 (8.0%) | 515 (12.3%) |
| 7:00 AM to 7:29 AM | 903 (19.8%) | 796 (19.0%) |
| 7:30 AM to 7:59 AM | 523 (11.5%) | 801 (19.2%) |
| 8:00 AM to 8:29 AM | 226 (5.0%) | 442 (10.6%) |
| 8:30 AM to 8:59 AM | 105 (2.3%) | 58 (1.4%) |
| 9:00 AM to 9:59 AM | 108 (2.4%) | 221 (5.3%) |
| 10:00 AM to 10:59 AM | 85 (1.9%) | 95 (2.3%) |
| 11:00 AM to 11:59 AM | 57 (1.3%) | 13 (0.3%) |
| 12:00 PM to 3:59 PM | 522 (11.5%) | 145 (3.5%) |
| 4:00 PM to 11:59 PM | 158 (3.5%) | 273 (6.5%) |
| Total | 4,553 (100.0%) | 4,182 (100.0%) |
Housing Occupancy in Albertville
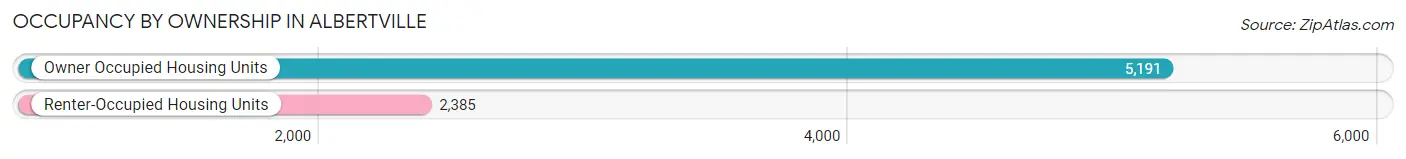
Occupancy by Ownership in Albertville
Of the total 7,576 dwellings in Albertville, owner-occupied units account for 5,191 (68.5%), while renter-occupied units make up 2,385 (31.5%).
| Occupancy | # Housing Units | % Housing Units |
| Owner Occupied Housing Units | 5,191 | 68.5% |
| Renter-Occupied Housing Units | 2,385 | 31.5% |
| Total Occupied Housing Units | 7,576 | 100.0% |
Occupancy by Household Size in Albertville
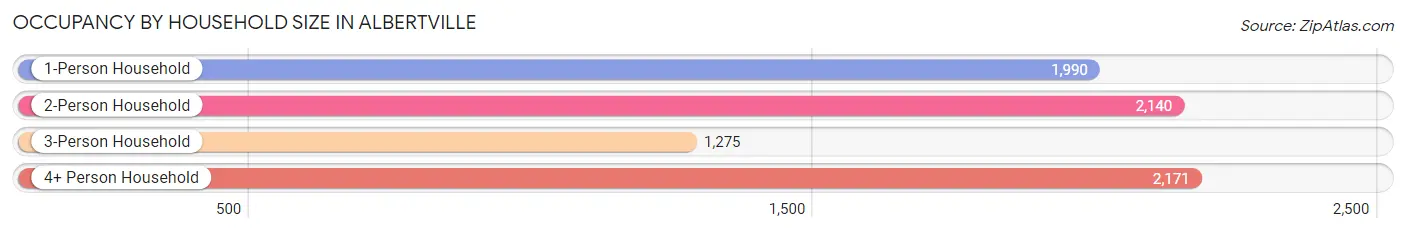
| Household Size | # Housing Units | % Housing Units |
| 1-Person Household | 1,990 | 26.3% |
| 2-Person Household | 2,140 | 28.2% |
| 3-Person Household | 1,275 | 16.8% |
| 4+ Person Household | 2,171 | 28.7% |
| Total Housing Units | 7,576 | 100.0% |
Occupancy by Ownership by Household Size in Albertville
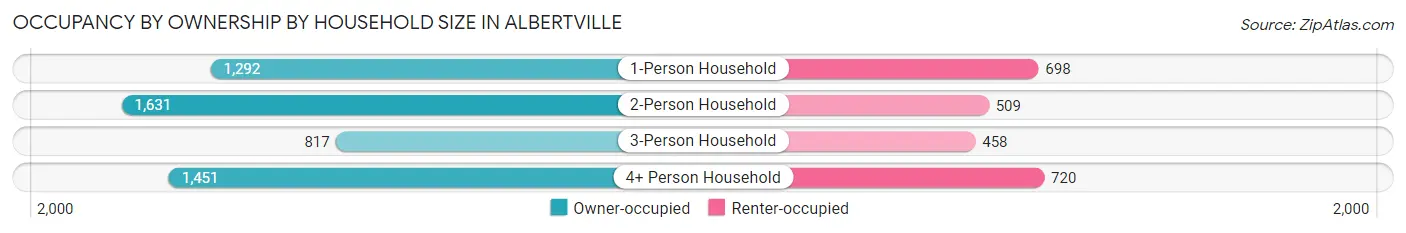
| Household Size | Owner-occupied | Renter-occupied |
| 1-Person Household | 1,292 (64.9%) | 698 (35.1%) |
| 2-Person Household | 1,631 (76.2%) | 509 (23.8%) |
| 3-Person Household | 817 (64.1%) | 458 (35.9%) |
| 4+ Person Household | 1,451 (66.8%) | 720 (33.2%) |
| Total Housing Units | 5,191 (68.5%) | 2,385 (31.5%) |
Occupancy by Educational Attainment in Albertville
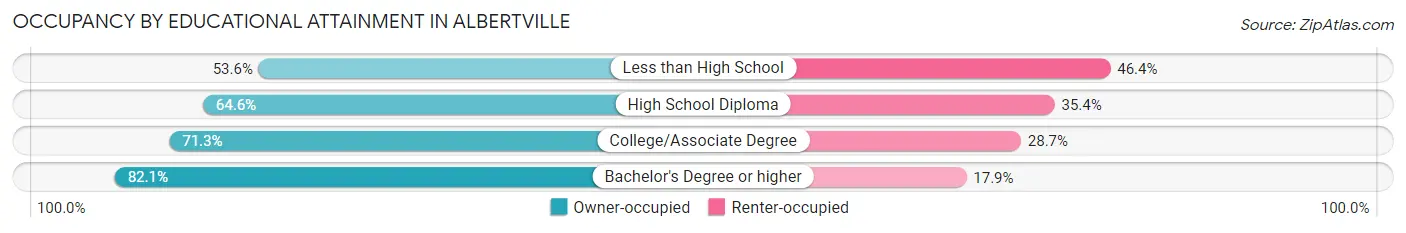
| Household Size | Owner-occupied | Renter-occupied |
| Less than High School | 793 (53.6%) | 687 (46.4%) |
| High School Diploma | 1,265 (64.6%) | 692 (35.4%) |
| College/Associate Degree | 1,755 (71.3%) | 706 (28.7%) |
| Bachelor's Degree or higher | 1,378 (82.1%) | 300 (17.9%) |
Occupancy by Age of Householder in Albertville
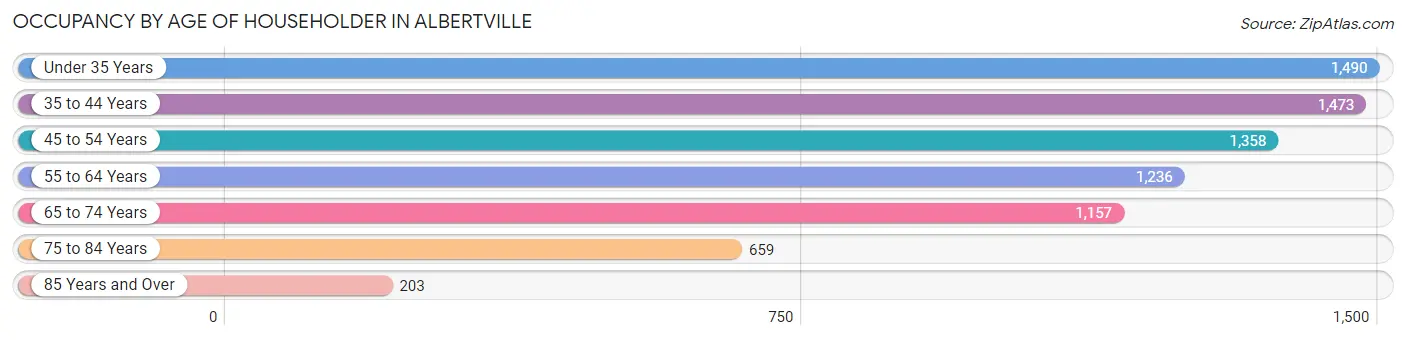
| Age Bracket | # Households | % Households |
| Under 35 Years | 1,490 | 19.7% |
| 35 to 44 Years | 1,473 | 19.4% |
| 45 to 54 Years | 1,358 | 17.9% |
| 55 to 64 Years | 1,236 | 16.3% |
| 65 to 74 Years | 1,157 | 15.3% |
| 75 to 84 Years | 659 | 8.7% |
| 85 Years and Over | 203 | 2.7% |
| Total | 7,576 | 100.0% |
Housing Finances in Albertville
Median Income by Occupancy in Albertville
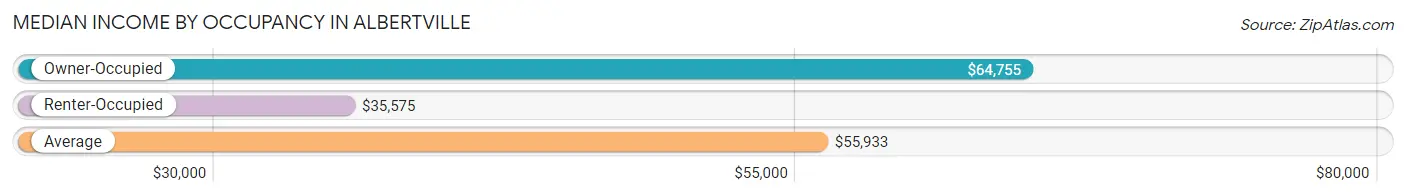
| Occupancy Type | # Households | Median Income |
| Owner-Occupied | 5,191 (68.5%) | $64,755 |
| Renter-Occupied | 2,385 (31.5%) | $35,575 |
| Average | 7,576 (100.0%) | $55,933 |
Occupancy by Householder Income Bracket in Albertville
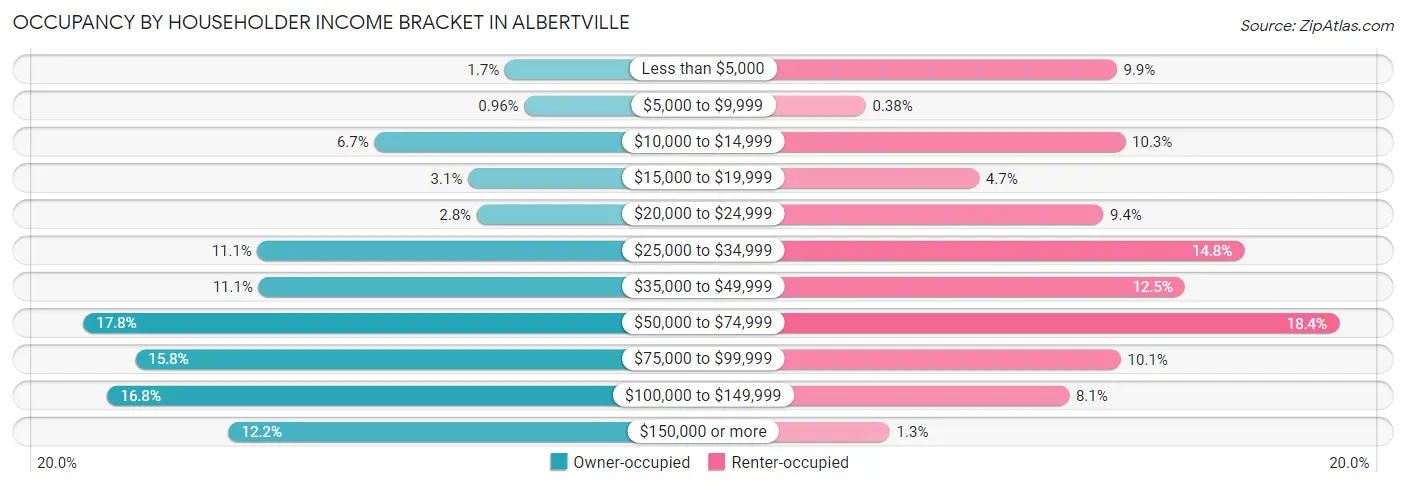
| Income Bracket | Owner-occupied | Renter-occupied |
| Less than $5,000 | 88 (1.7%) | 237 (9.9%) |
| $5,000 to $9,999 | 50 (1.0%) | 9 (0.4%) |
| $10,000 to $14,999 | 346 (6.7%) | 245 (10.3%) |
| $15,000 to $19,999 | 161 (3.1%) | 112 (4.7%) |
| $20,000 to $24,999 | 144 (2.8%) | 225 (9.4%) |
| $25,000 to $34,999 | 577 (11.1%) | 353 (14.8%) |
| $35,000 to $49,999 | 575 (11.1%) | 299 (12.5%) |
| $50,000 to $74,999 | 922 (17.8%) | 439 (18.4%) |
| $75,000 to $99,999 | 819 (15.8%) | 241 (10.1%) |
| $100,000 to $149,999 | 874 (16.8%) | 194 (8.1%) |
| $150,000 or more | 635 (12.2%) | 31 (1.3%) |
| Total | 5,191 (100.0%) | 2,385 (100.0%) |
Monthly Housing Cost Tiers in Albertville
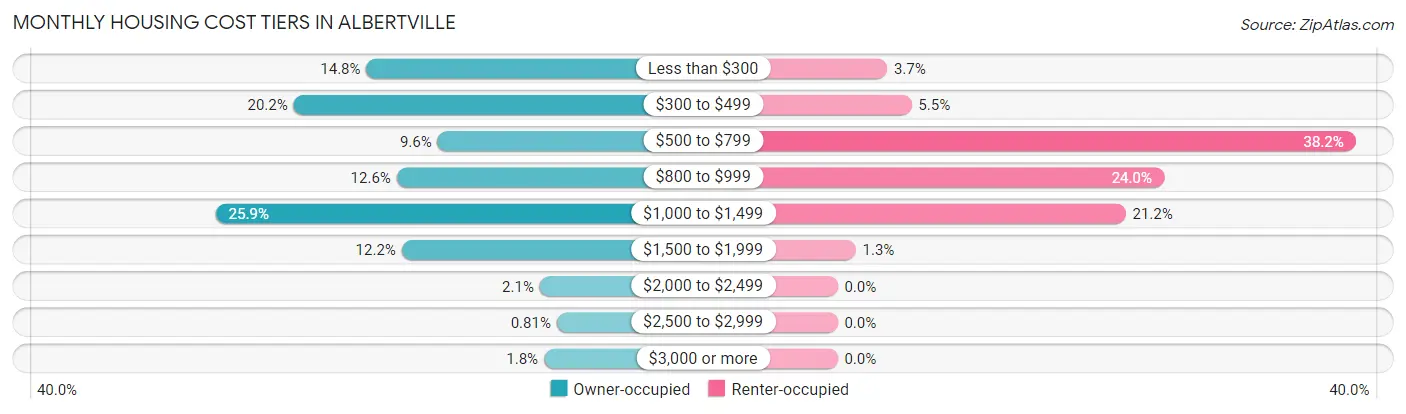
| Monthly Cost | Owner-occupied | Renter-occupied |
| Less than $300 | 770 (14.8%) | 87 (3.6%) |
| $300 to $499 | 1,048 (20.2%) | 130 (5.4%) |
| $500 to $799 | 498 (9.6%) | 910 (38.2%) |
| $800 to $999 | 654 (12.6%) | 573 (24.0%) |
| $1,000 to $1,499 | 1,346 (25.9%) | 506 (21.2%) |
| $1,500 to $1,999 | 635 (12.2%) | 32 (1.3%) |
| $2,000 to $2,499 | 107 (2.1%) | 0 (0.0%) |
| $2,500 to $2,999 | 42 (0.8%) | 0 (0.0%) |
| $3,000 or more | 91 (1.8%) | 0 (0.0%) |
| Total | 5,191 (100.0%) | 2,385 (100.0%) |
Physical Housing Characteristics in Albertville
Housing Structures in Albertville
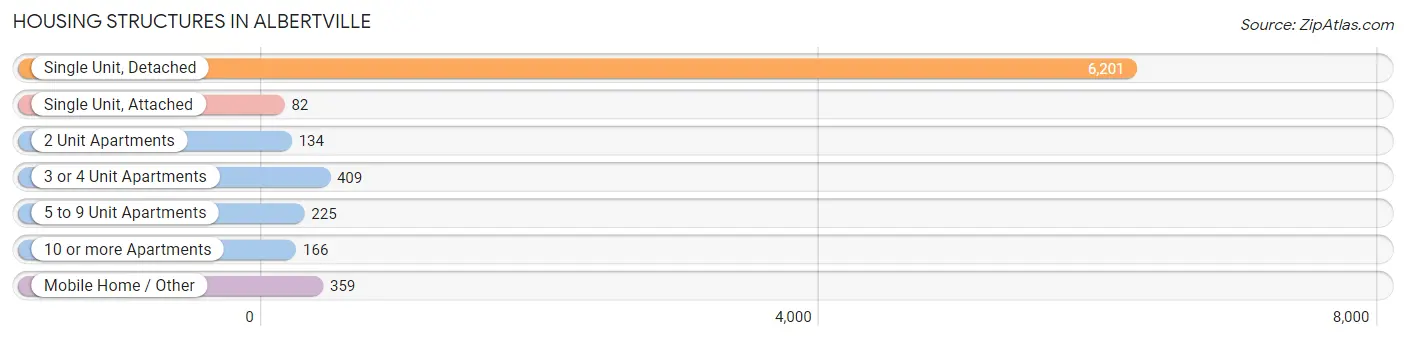
| Structure Type | # Housing Units | % Housing Units |
| Single Unit, Detached | 6,201 | 81.9% |
| Single Unit, Attached | 82 | 1.1% |
| 2 Unit Apartments | 134 | 1.8% |
| 3 or 4 Unit Apartments | 409 | 5.4% |
| 5 to 9 Unit Apartments | 225 | 3.0% |
| 10 or more Apartments | 166 | 2.2% |
| Mobile Home / Other | 359 | 4.7% |
| Total | 7,576 | 100.0% |
Housing Structures by Occupancy in Albertville
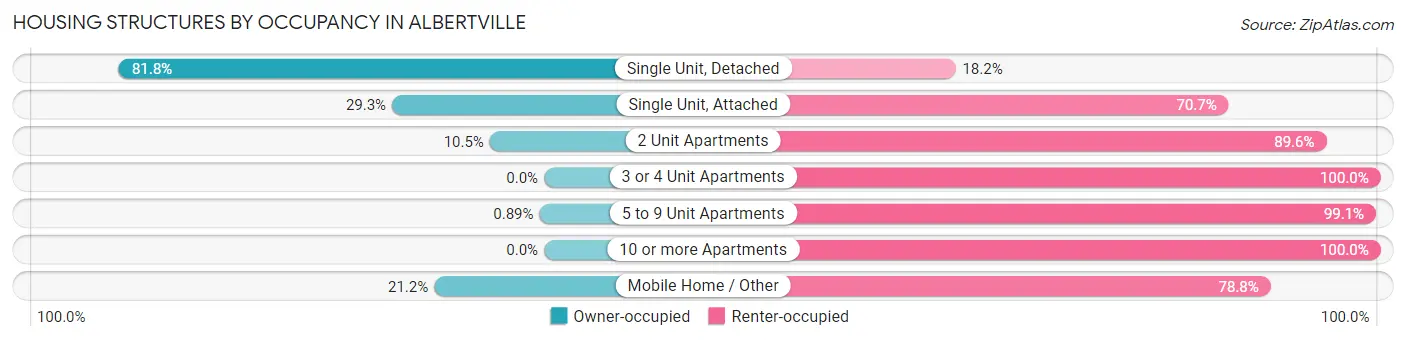
| Structure Type | Owner-occupied | Renter-occupied |
| Single Unit, Detached | 5,075 (81.8%) | 1,126 (18.2%) |
| Single Unit, Attached | 24 (29.3%) | 58 (70.7%) |
| 2 Unit Apartments | 14 (10.4%) | 120 (89.5%) |
| 3 or 4 Unit Apartments | 0 (0.0%) | 409 (100.0%) |
| 5 to 9 Unit Apartments | 2 (0.9%) | 223 (99.1%) |
| 10 or more Apartments | 0 (0.0%) | 166 (100.0%) |
| Mobile Home / Other | 76 (21.2%) | 283 (78.8%) |
| Total | 5,191 (68.5%) | 2,385 (31.5%) |
Housing Structures by Number of Rooms in Albertville
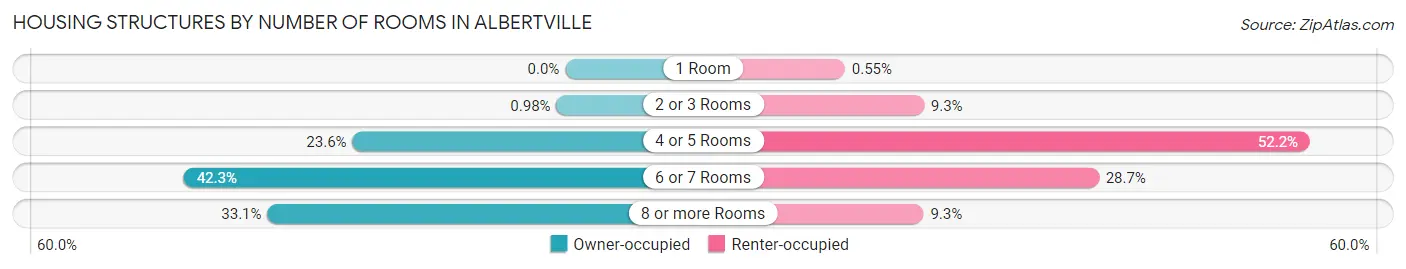
| Number of Rooms | Owner-occupied | Renter-occupied |
| 1 Room | 0 (0.0%) | 13 (0.5%) |
| 2 or 3 Rooms | 51 (1.0%) | 222 (9.3%) |
| 4 or 5 Rooms | 1,226 (23.6%) | 1,244 (52.2%) |
| 6 or 7 Rooms | 2,198 (42.3%) | 685 (28.7%) |
| 8 or more Rooms | 1,716 (33.1%) | 221 (9.3%) |
| Total | 5,191 (100.0%) | 2,385 (100.0%) |
Housing Structure by Heating Type in Albertville
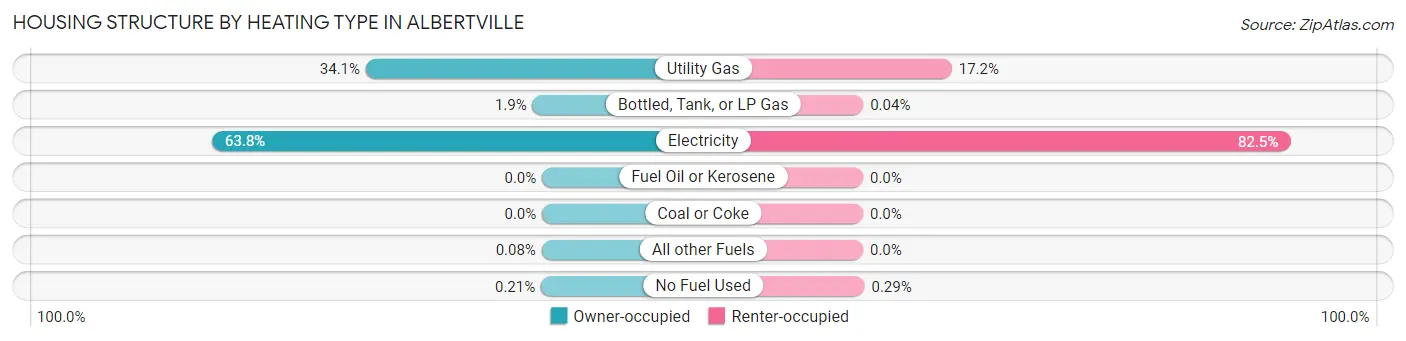
| Heating Type | Owner-occupied | Renter-occupied |
| Utility Gas | 1,768 (34.1%) | 409 (17.2%) |
| Bottled, Tank, or LP Gas | 96 (1.8%) | 1 (0.0%) |
| Electricity | 3,312 (63.8%) | 1,968 (82.5%) |
| Fuel Oil or Kerosene | 0 (0.0%) | 0 (0.0%) |
| Coal or Coke | 0 (0.0%) | 0 (0.0%) |
| All other Fuels | 4 (0.1%) | 0 (0.0%) |
| No Fuel Used | 11 (0.2%) | 7 (0.3%) |
| Total | 5,191 (100.0%) | 2,385 (100.0%) |
Household Vehicle Usage in Albertville
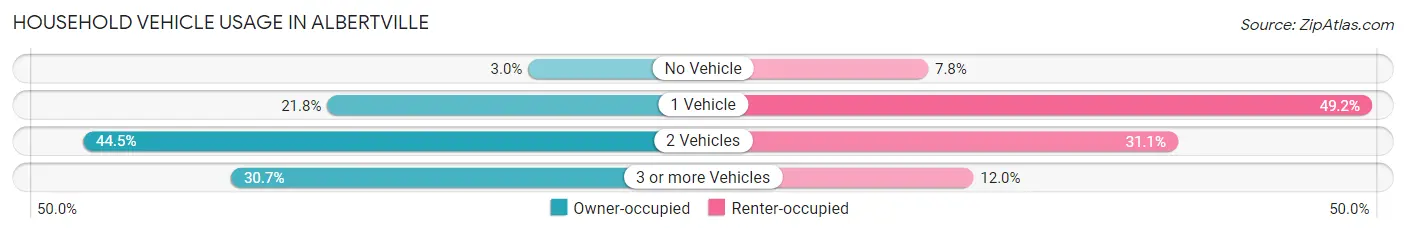
| Vehicles per Household | Owner-occupied | Renter-occupied |
| No Vehicle | 155 (3.0%) | 185 (7.8%) |
| 1 Vehicle | 1,129 (21.7%) | 1,173 (49.2%) |
| 2 Vehicles | 2,312 (44.5%) | 741 (31.1%) |
| 3 or more Vehicles | 1,595 (30.7%) | 286 (12.0%) |
| Total | 5,191 (100.0%) | 2,385 (100.0%) |
Real Estate & Mortgages in Albertville
Real Estate and Mortgage Overview in Albertville
| Characteristic | Without Mortgage | With Mortgage |
| Housing Units | 2,338 | 2,853 |
| Median Property Value | $135,700 | $161,600 |
| Median Household Income | $45,824 | $260 |
| Monthly Housing Costs | $383 | $82 |
| Real Estate Taxes | $637 | $216 |
Property Value by Mortgage Status in Albertville
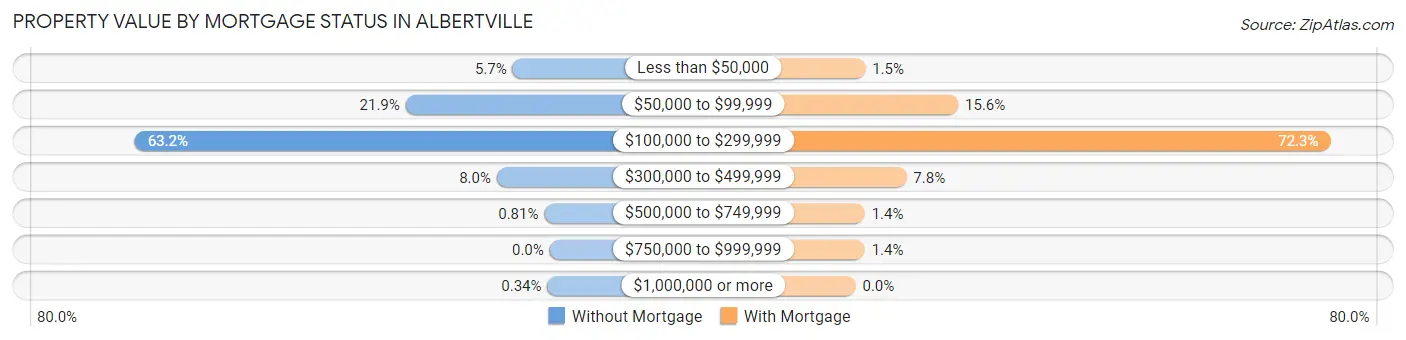
| Property Value | Without Mortgage | With Mortgage |
| Less than $50,000 | 132 (5.7%) | 42 (1.5%) |
| $50,000 to $99,999 | 513 (21.9%) | 446 (15.6%) |
| $100,000 to $299,999 | 1,478 (63.2%) | 2,064 (72.3%) |
| $300,000 to $499,999 | 188 (8.0%) | 221 (7.7%) |
| $500,000 to $749,999 | 19 (0.8%) | 40 (1.4%) |
| $750,000 to $999,999 | 0 (0.0%) | 40 (1.4%) |
| $1,000,000 or more | 8 (0.3%) | 0 (0.0%) |
| Total | 2,338 (100.0%) | 2,853 (100.0%) |
Household Income by Mortgage Status in Albertville
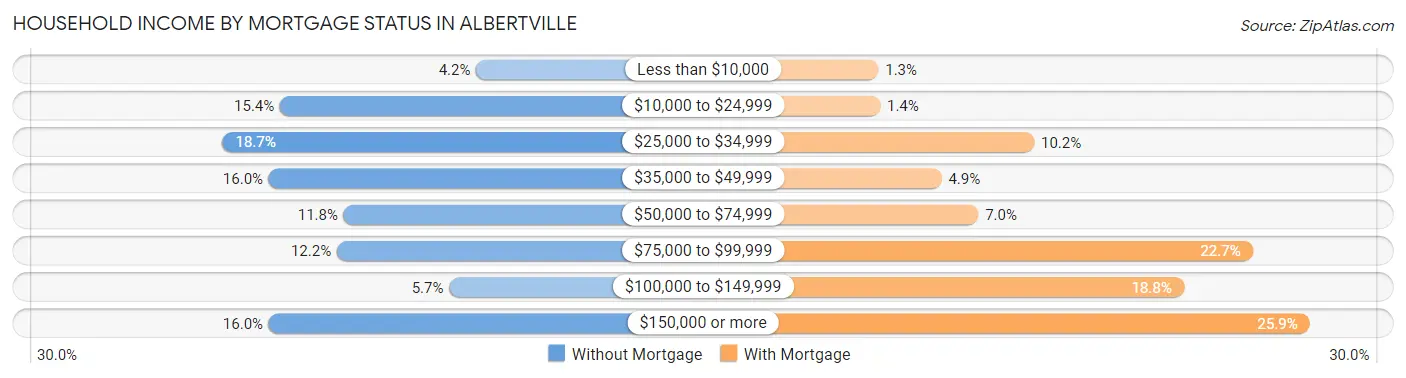
| Household Income | Without Mortgage | With Mortgage |
| Less than $10,000 | 98 (4.2%) | 37 (1.3%) |
| $10,000 to $24,999 | 360 (15.4%) | 40 (1.4%) |
| $25,000 to $34,999 | 437 (18.7%) | 291 (10.2%) |
| $35,000 to $49,999 | 375 (16.0%) | 140 (4.9%) |
| $50,000 to $74,999 | 275 (11.8%) | 200 (7.0%) |
| $75,000 to $99,999 | 284 (12.1%) | 647 (22.7%) |
| $100,000 to $149,999 | 134 (5.7%) | 535 (18.8%) |
| $150,000 or more | 375 (16.0%) | 740 (25.9%) |
| Total | 2,338 (100.0%) | 2,853 (100.0%) |
Property Value to Household Income Ratio in Albertville
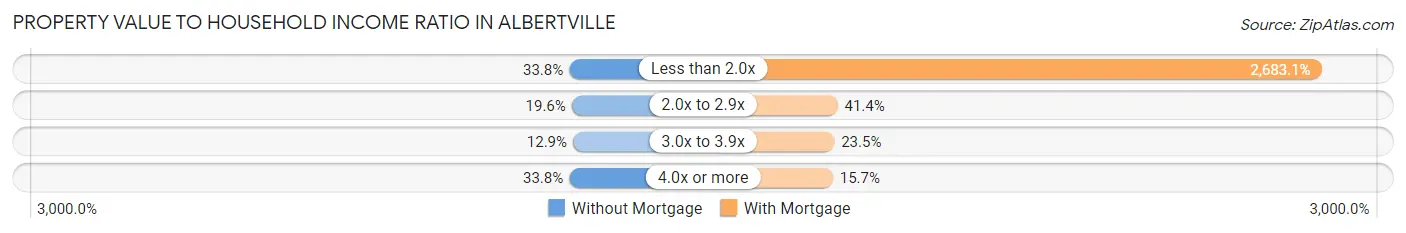
| Value-to-Income Ratio | Without Mortgage | With Mortgage |
| Less than 2.0x | 789 (33.8%) | 76,550 (2,683.1%) |
| 2.0x to 2.9x | 458 (19.6%) | 1,181 (41.4%) |
| 3.0x to 3.9x | 302 (12.9%) | 669 (23.4%) |
| 4.0x or more | 789 (33.8%) | 448 (15.7%) |
| Total | 2,338 (100.0%) | 2,853 (100.0%) |
Real Estate Taxes by Mortgage Status in Albertville
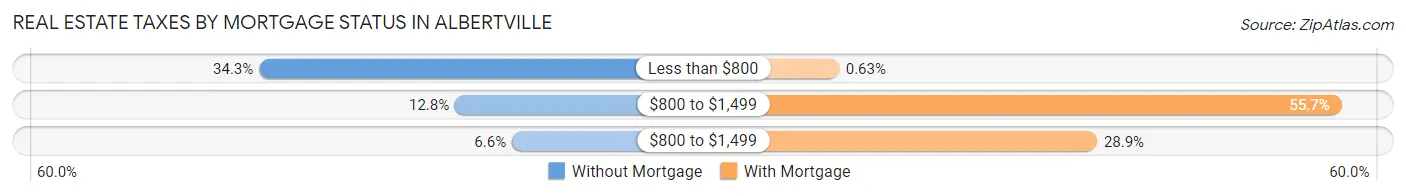
| Property Taxes | Without Mortgage | With Mortgage |
| Less than $800 | 802 (34.3%) | 18 (0.6%) |
| $800 to $1,499 | 300 (12.8%) | 1,590 (55.7%) |
| $800 to $1,499 | 154 (6.6%) | 825 (28.9%) |
| Total | 2,338 (100.0%) | 2,853 (100.0%) |
Health & Disability in Albertville
Health Insurance Coverage by Age in Albertville
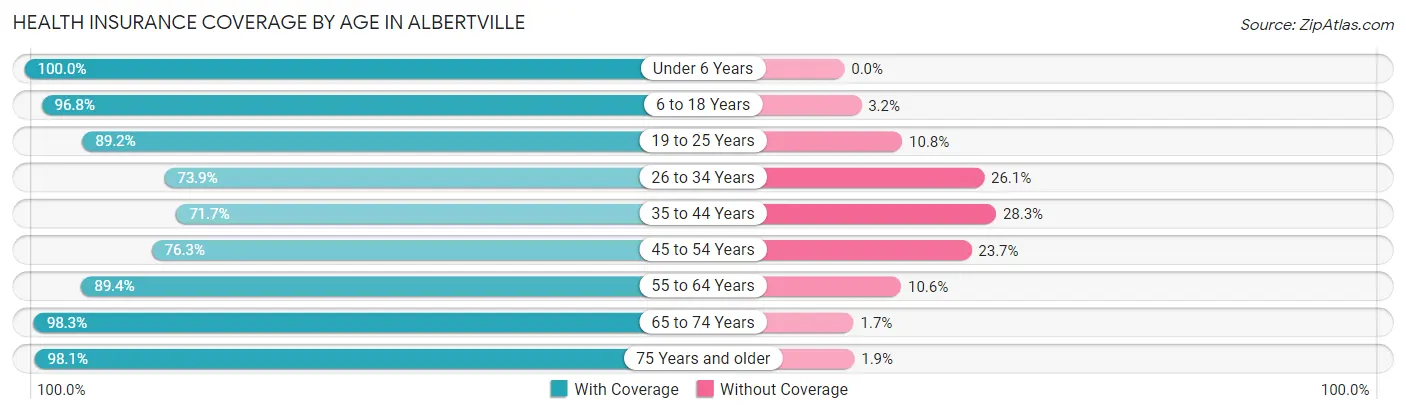
| Age Bracket | With Coverage | Without Coverage |
| Under 6 Years | 2,096 (100.0%) | 0 (0.0%) |
| 6 to 18 Years | 4,879 (96.8%) | 159 (3.2%) |
| 19 to 25 Years | 1,539 (89.2%) | 186 (10.8%) |
| 26 to 34 Years | 2,012 (73.9%) | 709 (26.1%) |
| 35 to 44 Years | 2,024 (71.7%) | 798 (28.3%) |
| 45 to 54 Years | 1,717 (76.3%) | 533 (23.7%) |
| 55 to 64 Years | 2,138 (89.4%) | 253 (10.6%) |
| 65 to 74 Years | 1,643 (98.3%) | 29 (1.7%) |
| 75 Years and older | 1,318 (98.1%) | 25 (1.9%) |
| Total | 19,366 (87.8%) | 2,692 (12.2%) |
Health Insurance Coverage by Citizenship Status in Albertville
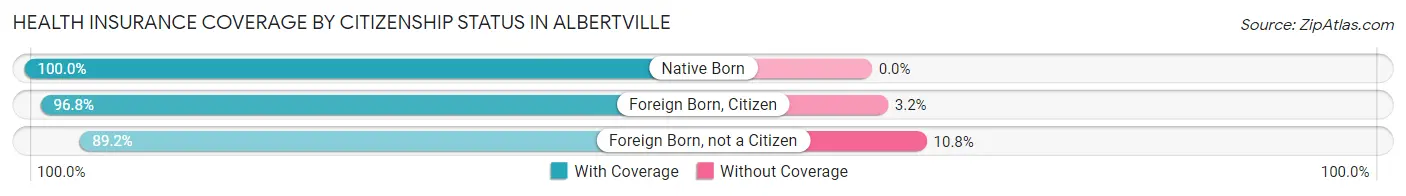
| Citizenship Status | With Coverage | Without Coverage |
| Native Born | 2,096 (100.0%) | 0 (0.0%) |
| Foreign Born, Citizen | 4,879 (96.8%) | 159 (3.2%) |
| Foreign Born, not a Citizen | 1,539 (89.2%) | 186 (10.8%) |
Health Insurance Coverage by Household Income in Albertville
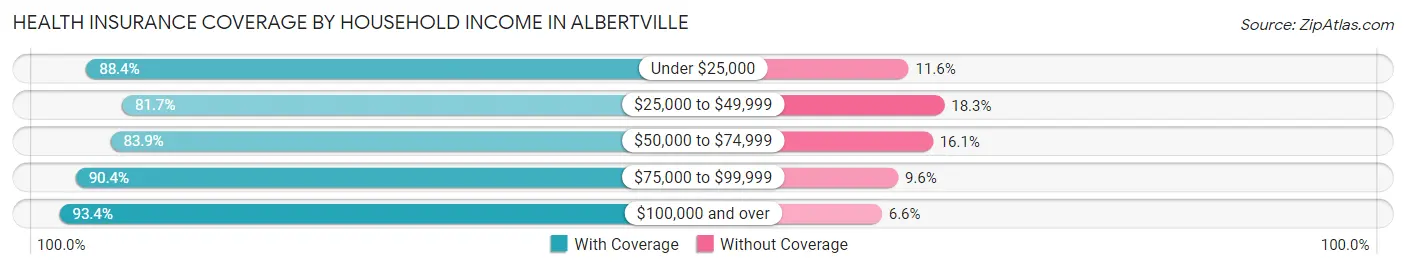
| Household Income | With Coverage | Without Coverage |
| Under $25,000 | 2,798 (88.4%) | 366 (11.6%) |
| $25,000 to $49,999 | 3,755 (81.7%) | 839 (18.3%) |
| $50,000 to $74,999 | 3,828 (83.9%) | 734 (16.1%) |
| $75,000 to $99,999 | 3,387 (90.4%) | 359 (9.6%) |
| $100,000 and over | 5,557 (93.4%) | 390 (6.6%) |
Public vs Private Health Insurance Coverage by Age in Albertville
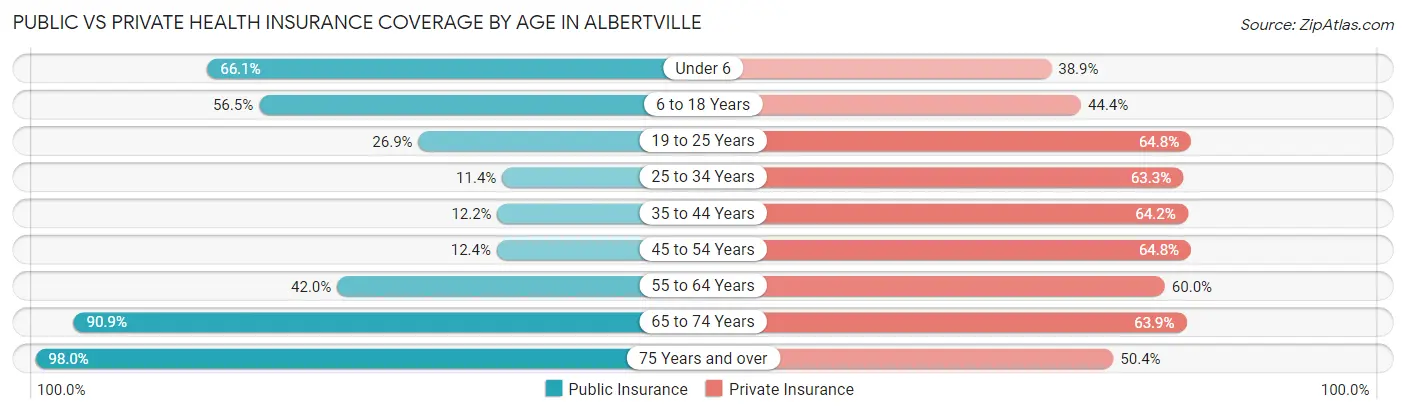
| Age Bracket | Public Insurance | Private Insurance |
| Under 6 | 1,385 (66.1%) | 815 (38.9%) |
| 6 to 18 Years | 2,846 (56.5%) | 2,238 (44.4%) |
| 19 to 25 Years | 464 (26.9%) | 1,118 (64.8%) |
| 25 to 34 Years | 309 (11.4%) | 1,723 (63.3%) |
| 35 to 44 Years | 345 (12.2%) | 1,811 (64.2%) |
| 45 to 54 Years | 278 (12.4%) | 1,458 (64.8%) |
| 55 to 64 Years | 1,004 (42.0%) | 1,434 (60.0%) |
| 65 to 74 Years | 1,520 (90.9%) | 1,069 (63.9%) |
| 75 Years and over | 1,316 (98.0%) | 677 (50.4%) |
| Total | 9,467 (42.9%) | 12,343 (56.0%) |
Disability Status by Sex by Age in Albertville
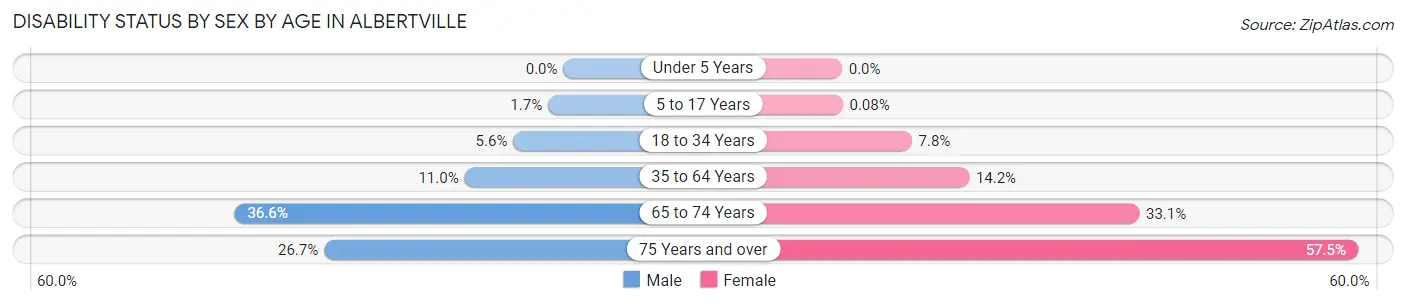
| Age Bracket | Male | Female |
| Under 5 Years | 0 (0.0%) | 0 (0.0%) |
| 5 to 17 Years | 46 (1.7%) | 2 (0.1%) |
| 18 to 34 Years | 129 (5.6%) | 187 (7.8%) |
| 35 to 64 Years | 384 (11.0%) | 563 (14.2%) |
| 65 to 74 Years | 297 (36.6%) | 285 (33.1%) |
| 75 Years and over | 133 (26.7%) | 485 (57.5%) |
Disability Class by Sex by Age in Albertville
Disability Class: Hearing Difficulty
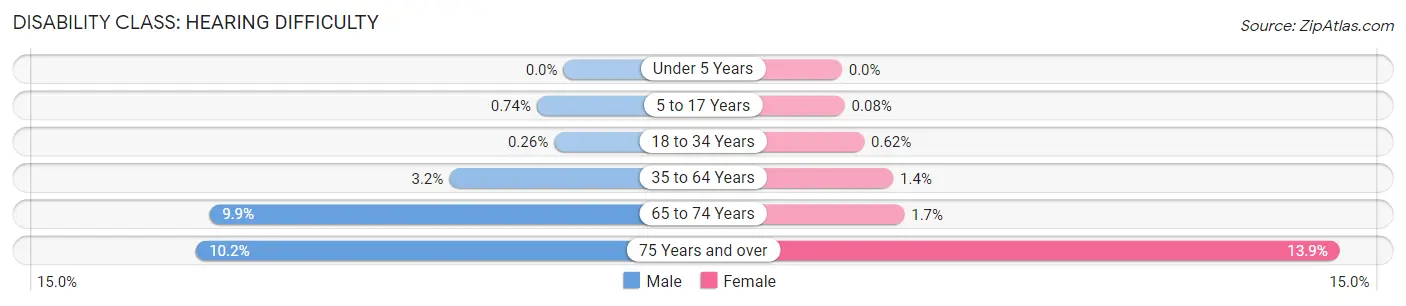
| Age Bracket | Male | Female |
| Under 5 Years | 0 (0.0%) | 0 (0.0%) |
| 5 to 17 Years | 20 (0.7%) | 2 (0.1%) |
| 18 to 34 Years | 6 (0.3%) | 15 (0.6%) |
| 35 to 64 Years | 111 (3.2%) | 57 (1.4%) |
| 65 to 74 Years | 80 (9.9%) | 15 (1.7%) |
| 75 Years and over | 51 (10.2%) | 117 (13.9%) |
Disability Class: Vision Difficulty
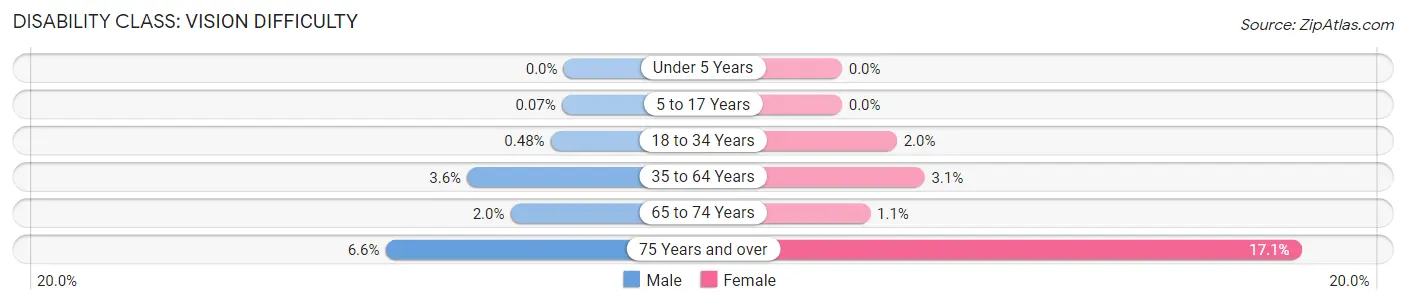
| Age Bracket | Male | Female |
| Under 5 Years | 0 (0.0%) | 0 (0.0%) |
| 5 to 17 Years | 2 (0.1%) | 0 (0.0%) |
| 18 to 34 Years | 11 (0.5%) | 49 (2.0%) |
| 35 to 64 Years | 125 (3.6%) | 122 (3.1%) |
| 65 to 74 Years | 16 (2.0%) | 9 (1.1%) |
| 75 Years and over | 33 (6.6%) | 144 (17.1%) |
Disability Class: Cognitive Difficulty
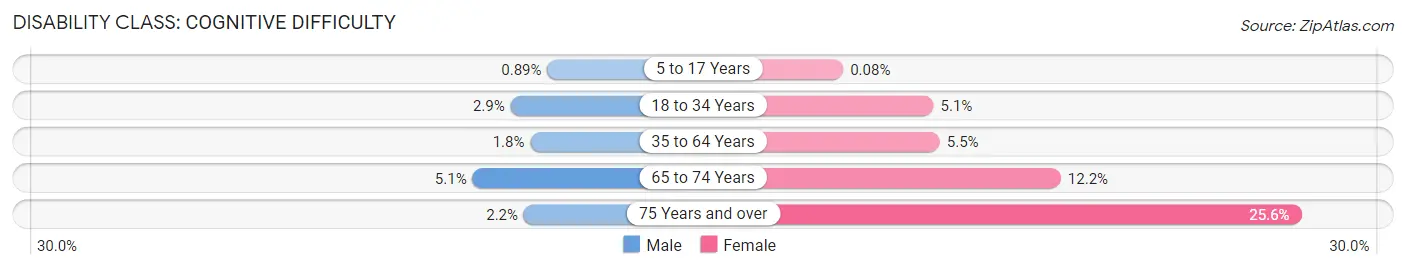
| Age Bracket | Male | Female |
| 5 to 17 Years | 24 (0.9%) | 2 (0.1%) |
| 18 to 34 Years | 68 (2.9%) | 123 (5.1%) |
| 35 to 64 Years | 64 (1.8%) | 217 (5.5%) |
| 65 to 74 Years | 41 (5.1%) | 105 (12.2%) |
| 75 Years and over | 11 (2.2%) | 216 (25.6%) |
Disability Class: Ambulatory Difficulty
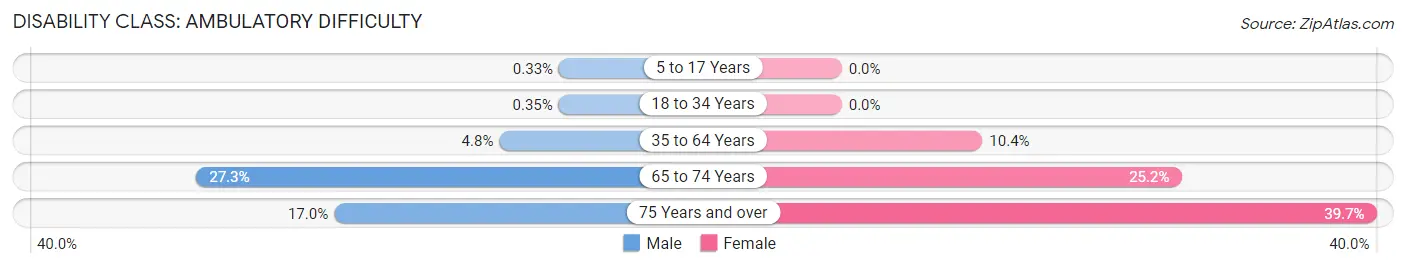
| Age Bracket | Male | Female |
| 5 to 17 Years | 9 (0.3%) | 0 (0.0%) |
| 18 to 34 Years | 8 (0.4%) | 0 (0.0%) |
| 35 to 64 Years | 166 (4.8%) | 415 (10.4%) |
| 65 to 74 Years | 221 (27.3%) | 217 (25.2%) |
| 75 Years and over | 85 (17.0%) | 335 (39.7%) |
Disability Class: Self-Care Difficulty
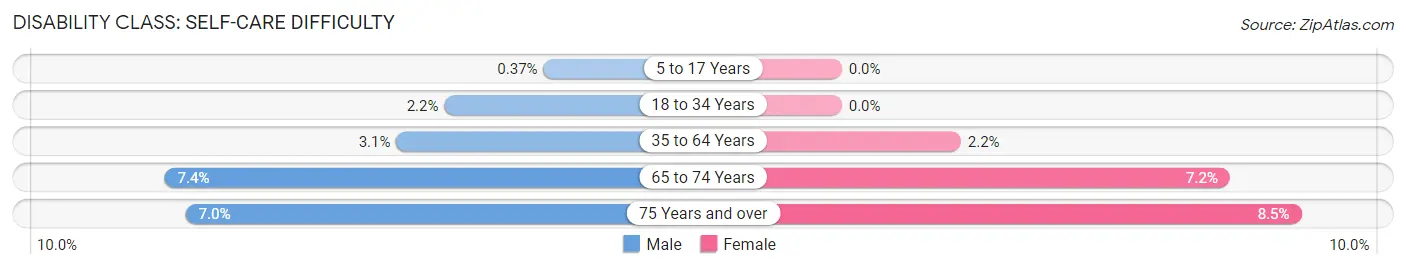
| Age Bracket | Male | Female |
| 5 to 17 Years | 10 (0.4%) | 0 (0.0%) |
| 18 to 34 Years | 51 (2.2%) | 0 (0.0%) |
| 35 to 64 Years | 108 (3.1%) | 88 (2.2%) |
| 65 to 74 Years | 60 (7.4%) | 62 (7.2%) |
| 75 Years and over | 35 (7.0%) | 72 (8.5%) |
Technology Access in Albertville
Computing Device Access in Albertville
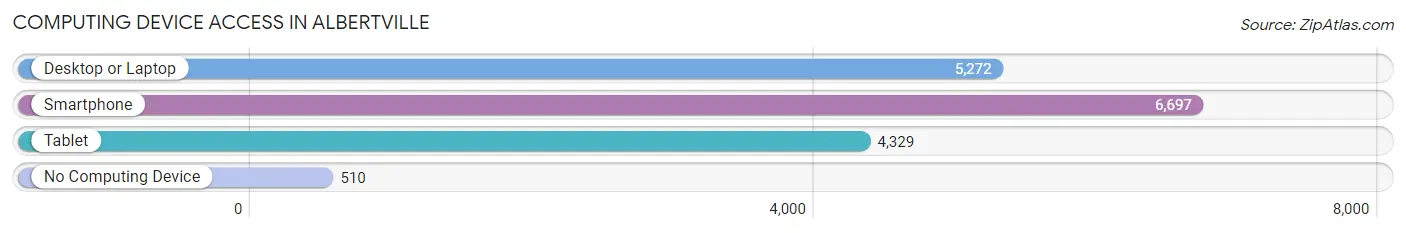
| Device Type | # Households | % Households |
| Desktop or Laptop | 5,272 | 69.6% |
| Smartphone | 6,697 | 88.4% |
| Tablet | 4,329 | 57.1% |
| No Computing Device | 510 | 6.7% |
| Total | 7,576 | 100.0% |
Internet Access in Albertville
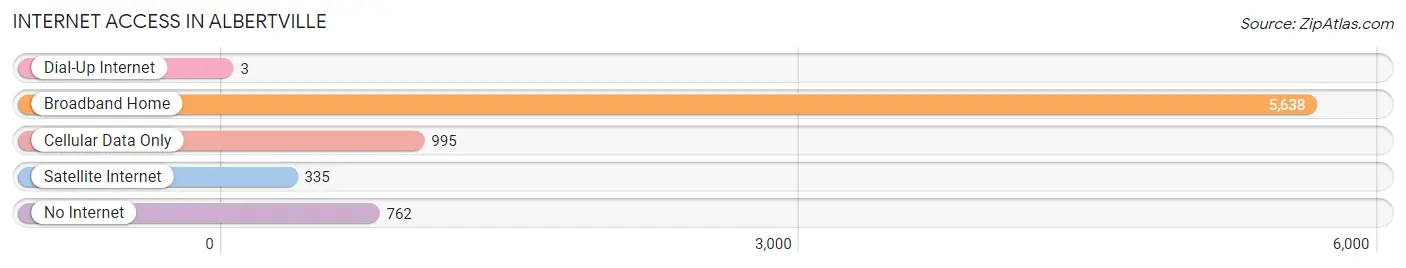
| Internet Type | # Households | % Households |
| Dial-Up Internet | 3 | 0.0% |
| Broadband Home | 5,638 | 74.4% |
| Cellular Data Only | 995 | 13.1% |
| Satellite Internet | 335 | 4.4% |
| No Internet | 762 | 10.1% |
| Total | 7,576 | 100.0% |
Albertville Summary
Albertville is a city located in Marshall County, Alabama, United States. It is the county seat of Marshall County and is located in the northeastern part of the state. As of the 2010 census, the population of Albertville was 21,160.
History
The area that is now Albertville was first settled in the early 1800s by the Cherokee Indians. The city was named after Albertville, France, which was the hometown of a French immigrant who settled in the area in the 1840s. The city was officially incorporated in 1891.
In the early 1900s, Albertville was a small farming community. The city began to grow in the 1950s when the Tennessee Valley Authority (TVA) built a dam on the nearby Tennessee River. This created Lake Guntersville, which brought in tourists and businesses to the area.
In the 1960s, Albertville began to experience a population boom as people moved to the area for jobs in the manufacturing industry. The city was also home to a large military base, which brought in more people and businesses.
Geography
Albertville is located at 34°17'N 86°14'W (34.28, -86.23). According to the U.S. Census Bureau, the city has a total area of 16.2 square miles (41.8 km2), of which 16.1 square miles (41.6 km2) is land and 0.1 square miles (0.2 km2) (0.62%) is water.
The city is located in the foothills of the Appalachian Mountains and is surrounded by several lakes, including Lake Guntersville, Lake Wheeler, and Lake Jackson.
Economy
Albertville is a major manufacturing center in the region. The city is home to several large factories, including a Tyson Foods poultry processing plant, a Goodyear Tire and Rubber Company plant, and a Honda Manufacturing of Alabama plant.
The city is also home to several retail stores including Walmart Target and Lowe s
Demographics
As of the 2010 census, there were 21,160 people, 8,072 households, and 5,541 families residing in the city. The population density was 1,310.2 people per square mile (505.3/km2). There were 8,845 housing units at an average density of 551.2 per square mile (212.7/km2). The racial makeup of the city was 79.2% White, 15.7% Black or African American, 0.4% Native American, 0.7% Asian, 0.1% Pacific Islander, 2.7% from other races, and 1.2% from two or more races. 4.7% of the population were Hispanic or Latino of any race.
There were 8,072 households, out of which 32.2% had children under the age of 18 living with them, 48.2% were married couples living together, 15.3% had a female householder with no husband present, and 32.2% were non-families. 28.2% of all households were made up of individuals, and 11.7% had someone living alone who was 65 years of age or older. The average household size was 2.50 and the average family size was 3.06.
In the city, the population was spread out, with 25.7% under the age of 18, 9.2% from 18 to 24, 28.3% from 25 to 44, 22.2% from 45 to 64, and 14.6% who were 65 years of age or older. The median age was 36 years. For every 100 females, there were 91.2 males. For every 100 females age 18 and over, there were 87.2 males.
The median income for a household in the city was $32,813, and the median income for a family was $40,813. Males had a median income of $31,919 versus $21,917 for females. The per capita income for the city was $17,845. About 11.2% of families and 14.2% of the population were below the poverty line, including 19.2% of those under age 18 and 11.7% of those age 65 or over.
Common Questions
What is Per Capita Income in Albertville?
Per Capita income in Albertville is $25,852.
What is the Median Family Income in Albertville?
Median Family Income in Albertville is $65,714.
What is the Median Household income in Albertville?
Median Household Income in Albertville is $55,933.
What is Income or Wage Gap in Albertville?
Income or Wage Gap in Albertville is 15.6%.
Women in Albertville earn 84.4 cents for every dollar earned by a man.
What is Inequality or Gini Index in Albertville?
Inequality or Gini Index in Albertville is 0.45.
What is the Total Population of Albertville?
Total Population of Albertville is 22,433.
What is the Total Male Population of Albertville?
Total Male Population of Albertville is 10,476.
What is the Total Female Population of Albertville?
Total Female Population of Albertville is 11,957.
What is the Ratio of Males per 100 Females in Albertville?
There are 87.61 Males per 100 Females in Albertville.
What is the Ratio of Females per 100 Males in Albertville?
There are 114.14 Females per 100 Males in Albertville.
What is the Median Population Age in Albertville?
Median Population Age in Albertville is 32.8 Years.
What is the Average Family Size in Albertville
Average Family Size in Albertville is 3.5 People.
What is the Average Household Size in Albertville
Average Household Size in Albertville is 2.9 People.
How Large is the Labor Force in Albertville?
There are 9,719 People in the Labor Forcein in Albertville.
What is the Percentage of People in the Labor Force in Albertville?
60.2% of People are in the Labor Force in Albertville.
What is the Unemployment Rate in Albertville?
Unemployment Rate in Albertville is 6.0%.