Addison, AL Map & Demographics
Addison Map
Addison Overview
$26,614
PER CAPITA INCOME
$52,083
AVG FAMILY INCOME
$47,188
AVG HOUSEHOLD INCOME
45.4%
WAGE / INCOME GAP [ % ]
54.6¢/ $1
WAGE / INCOME GAP [ $ ]
0.43
INEQUALITY / GINI INDEX
665
TOTAL POPULATION
320
MALE POPULATION
345
FEMALE POPULATION
92.75
MALES / 100 FEMALES
107.81
FEMALES / 100 MALES
38.4
MEDIAN AGE
2.9
AVG FAMILY SIZE
2.4
AVG HOUSEHOLD SIZE
368
LABOR FORCE [ PEOPLE ]
72.2%
PERCENT IN LABOR FORCE
0.8%
UNEMPLOYMENT RATE
Addison Zip Codes
Addison Area Codes
Income in Addison
Income Overview in Addison
Per Capita Income in Addison is $26,614, while median incomes of families and households are $52,083 and $47,188 respectively.
| Characteristic | Number | Measure |
| Per Capita Income | 665 | $26,614 |
| Median Family Income | 198 | $52,083 |
| Mean Family Income | 198 | $64,185 |
| Median Household Income | 277 | $47,188 |
| Mean Household Income | 277 | $61,129 |
| Income Deficit | 198 | $0 |
| Wage / Income Gap (%) | 665 | 45.39% |
| Wage / Income Gap ($) | 665 | 54.61¢ per $1 |
| Gini / Inequality Index | 665 | 0.43 |
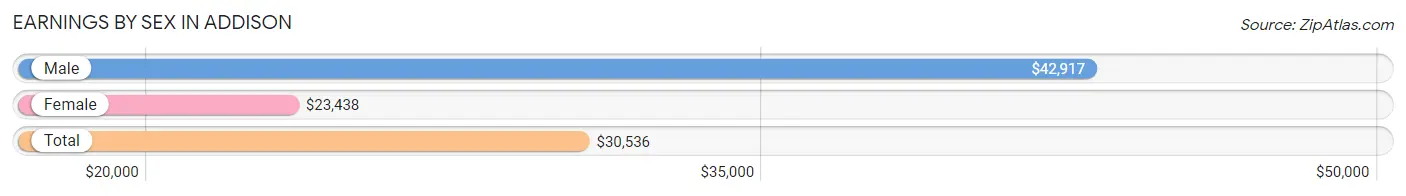
Earnings by Sex in Addison
Average Earnings in Addison are $30,536, $42,917 for men and $23,438 for women, a difference of 45.4%.
| Sex | Number | Average Earnings |
| Male | 186 (50.0%) | $42,917 |
| Female | 186 (50.0%) | $23,438 |
| Total | 372 (100.0%) | $30,536 |
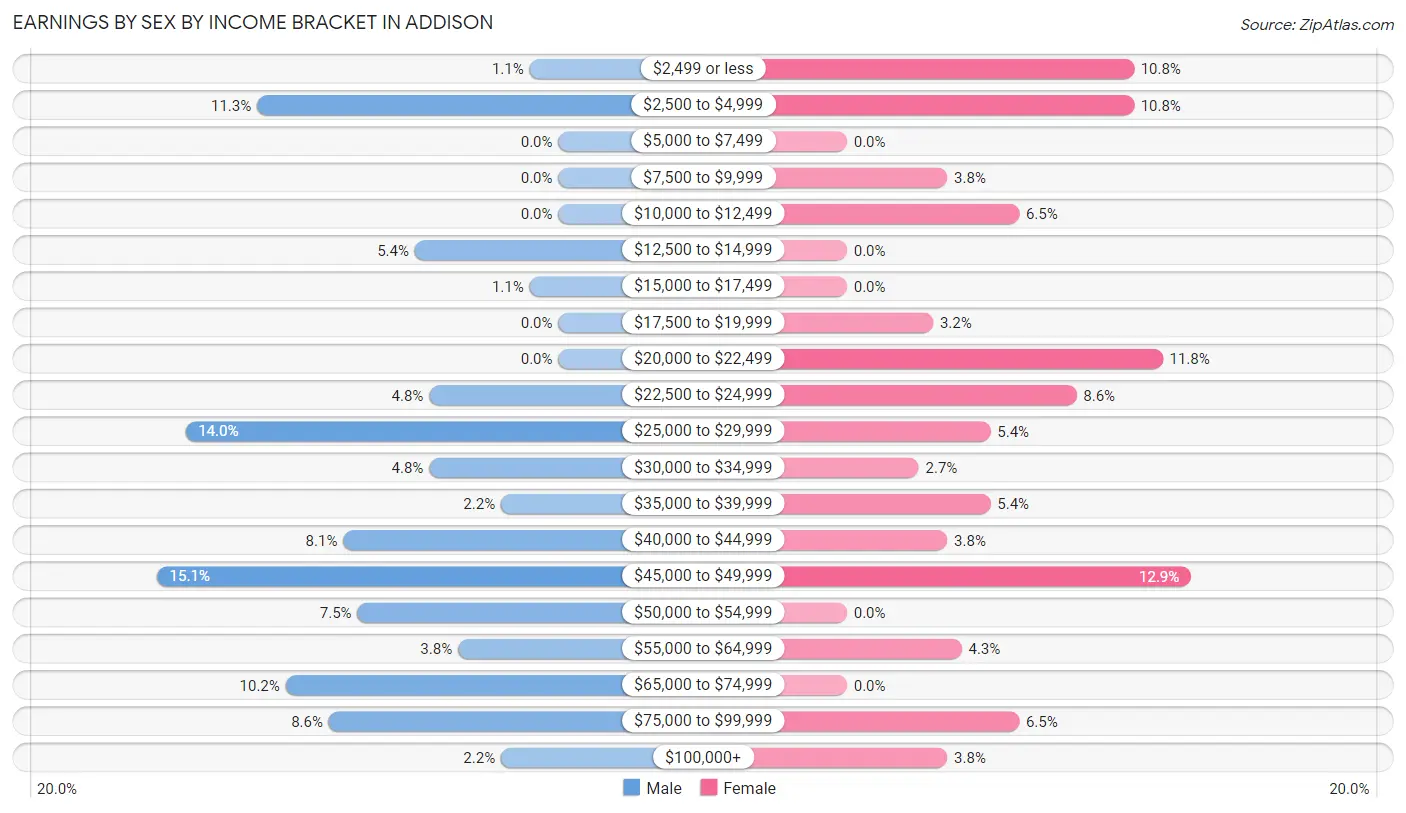
Earnings by Sex by Income Bracket in Addison
The most common earnings brackets in Addison are $45,000 to $49,999 for men (28 | 15.0%) and $45,000 to $49,999 for women (24 | 12.9%).
| Income | Male | Female |
| $2,499 or less | 2 (1.1%) | 20 (10.7%) |
| $2,500 to $4,999 | 21 (11.3%) | 20 (10.7%) |
| $5,000 to $7,499 | 0 (0.0%) | 0 (0.0%) |
| $7,500 to $9,999 | 0 (0.0%) | 7 (3.8%) |
| $10,000 to $12,499 | 0 (0.0%) | 12 (6.5%) |
| $12,500 to $14,999 | 10 (5.4%) | 0 (0.0%) |
| $15,000 to $17,499 | 2 (1.1%) | 0 (0.0%) |
| $17,500 to $19,999 | 0 (0.0%) | 6 (3.2%) |
| $20,000 to $22,499 | 0 (0.0%) | 22 (11.8%) |
| $22,500 to $24,999 | 9 (4.8%) | 16 (8.6%) |
| $25,000 to $29,999 | 26 (14.0%) | 10 (5.4%) |
| $30,000 to $34,999 | 9 (4.8%) | 5 (2.7%) |
| $35,000 to $39,999 | 4 (2.1%) | 10 (5.4%) |
| $40,000 to $44,999 | 15 (8.1%) | 7 (3.8%) |
| $45,000 to $49,999 | 28 (15.0%) | 24 (12.9%) |
| $50,000 to $54,999 | 14 (7.5%) | 0 (0.0%) |
| $55,000 to $64,999 | 7 (3.8%) | 8 (4.3%) |
| $65,000 to $74,999 | 19 (10.2%) | 0 (0.0%) |
| $75,000 to $99,999 | 16 (8.6%) | 12 (6.5%) |
| $100,000+ | 4 (2.1%) | 7 (3.8%) |
| Total | 186 (100.0%) | 186 (100.0%) |
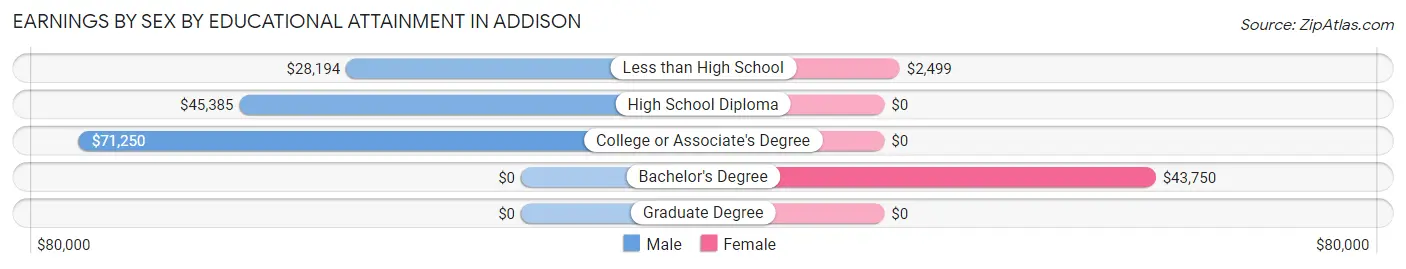
Earnings by Sex by Educational Attainment in Addison
Average earnings in Addison are $45,952 for men and $24,375 for women, a difference of 47.0%. Men with an educational attainment of college or associate's degree enjoy the highest average annual earnings of $71,250, while those with less than high school education earn the least with $28,194. Women with an educational attainment of bachelor's degree earn the most with the average annual earnings of $43,750, while those with less than high school education have the smallest earnings of $2,499.
| Educational Attainment | Male Income | Female Income |
| Less than High School | $28,194 | $2,499 |
| High School Diploma | $45,385 | $0 |
| College or Associate's Degree | $71,250 | $0 |
| Bachelor's Degree | - | - |
| Graduate Degree | - | - |
| Total | $45,952 | $24,375 |
Family Income in Addison
Family Income Brackets in Addison
According to the Addison family income data, there are 59 families falling into the $50,000 to $74,999 income range, which is the most common income bracket and makes up 29.8% of all families.
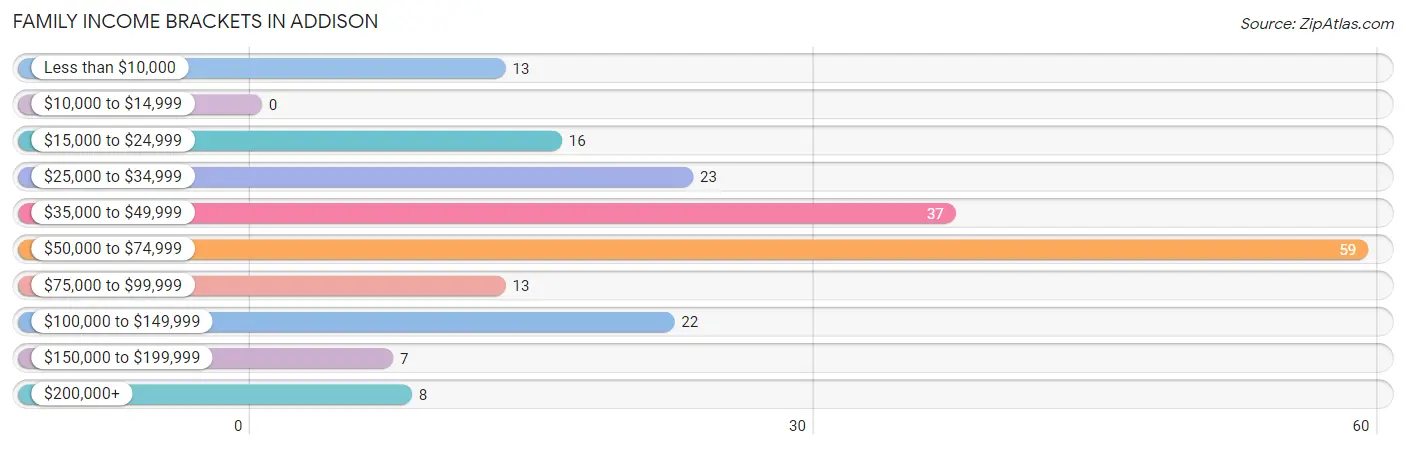
| Income Bracket | # Families | % Families |
| Less than $10,000 | 13 | 6.6% |
| $10,000 to $14,999 | 0 | 0.0% |
| $15,000 to $24,999 | 16 | 8.1% |
| $25,000 to $34,999 | 23 | 11.6% |
| $35,000 to $49,999 | 37 | 18.7% |
| $50,000 to $74,999 | 59 | 29.8% |
| $75,000 to $99,999 | 13 | 6.6% |
| $100,000 to $149,999 | 22 | 11.1% |
| $150,000 to $199,999 | 7 | 3.5% |
| $200,000+ | 8 | 4.0% |
Family Income by Famaliy Size in Addison
4-person families (39 | 19.7%) account for the highest median family income in Addison with $73,750 per family, while 2-person families (132 | 66.7%) have the highest median income of $23,077 per family member.
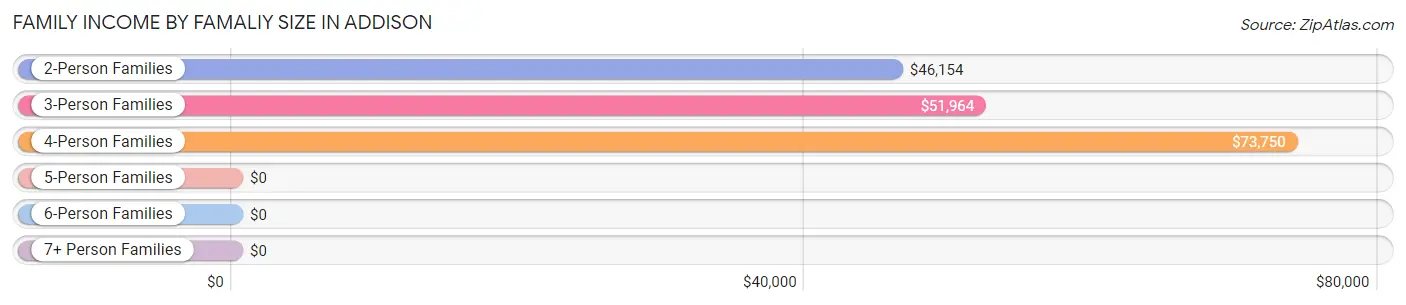
| Income Bracket | # Families | Median Income |
| 2-Person Families | 132 (66.7%) | $46,154 |
| 3-Person Families | 21 (10.6%) | $51,964 |
| 4-Person Families | 39 (19.7%) | $73,750 |
| 5-Person Families | 4 (2.0%) | $0 |
| 6-Person Families | 2 (1.0%) | $0 |
| 7+ Person Families | 0 (0.0%) | $0 |
| Total | 198 (100.0%) | $52,083 |
Family Income by Number of Earners in Addison
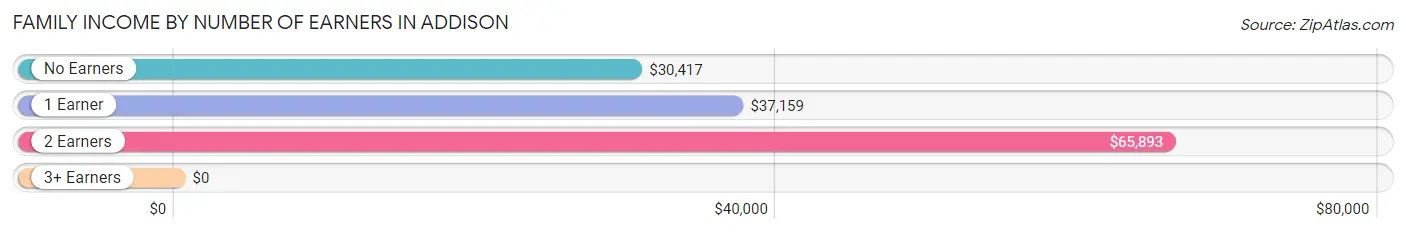
| Number of Earners | # Families | Median Income |
| No Earners | 29 (14.6%) | $30,417 |
| 1 Earner | 53 (26.8%) | $37,159 |
| 2 Earners | 101 (51.0%) | $65,893 |
| 3+ Earners | 15 (7.6%) | $0 |
| Total | 198 (100.0%) | $52,083 |
Household Income in Addison
Household Income Brackets in Addison
With 59 households falling in the category, the $50,000 to $74,999 income range is the most frequent in Addison, accounting for 21.3% of all households. In contrast, only 7 households (2.5%) fall into the $150,000 to $199,999 income bracket, making it the least populous group.
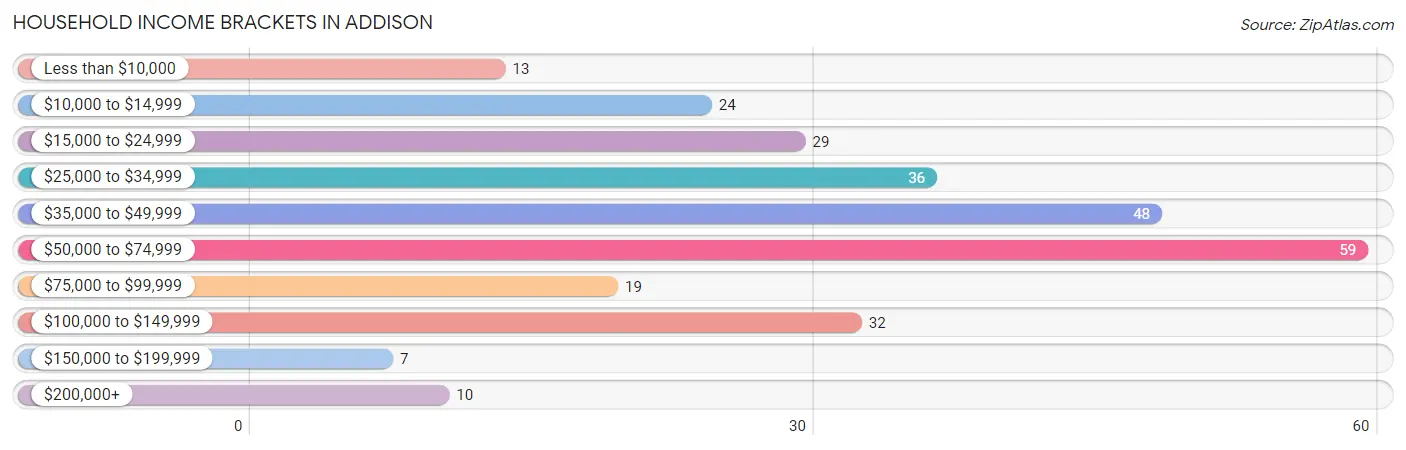
| Income Bracket | # Households | % Households |
| Less than $10,000 | 13 | 4.7% |
| $10,000 to $14,999 | 24 | 8.7% |
| $15,000 to $24,999 | 29 | 10.5% |
| $25,000 to $34,999 | 36 | 13.0% |
| $35,000 to $49,999 | 48 | 17.3% |
| $50,000 to $74,999 | 59 | 21.3% |
| $75,000 to $99,999 | 19 | 6.9% |
| $100,000 to $149,999 | 32 | 11.6% |
| $150,000 to $199,999 | 7 | 2.5% |
| $200,000+ | 10 | 3.6% |
Household Income by Householder Age in Addison
The median household income in Addison is $47,188, with the highest median household income of $71,250 found in the 25 to 44 years age bracket for the primary householder. A total of 68 households (24.5%) fall into this category. Meanwhile, the 15 to 24 years age bracket for the primary householder has the lowest median household income of $19,375, with 9 households (3.3%) in this group.
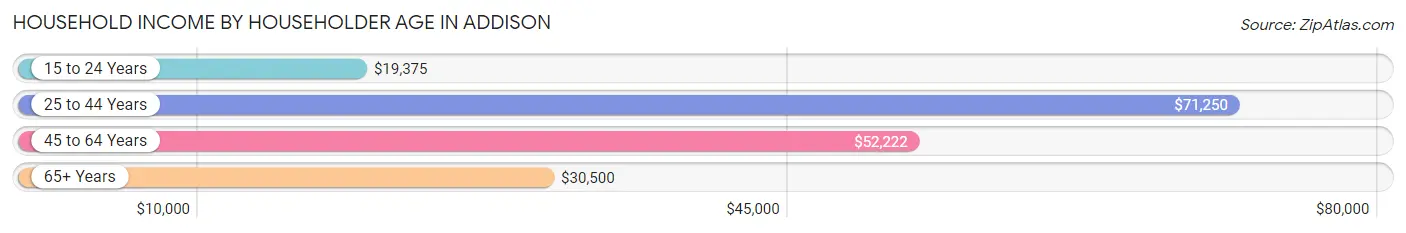
| Income Bracket | # Households | Median Income |
| 15 to 24 Years | 9 (3.3%) | $19,375 |
| 25 to 44 Years | 68 (24.5%) | $71,250 |
| 45 to 64 Years | 114 (41.2%) | $52,222 |
| 65+ Years | 86 (31.0%) | $30,500 |
| Total | 277 (100.0%) | $47,188 |
Poverty in Addison
Income Below Poverty by Sex and Age in Addison
With 9.7% poverty level for males and 13.0% for females among the residents of Addison, 75 year old and over males and 5 year old females are the most vulnerable to poverty, with 6 males (30.0%) and 6 females (100.0%) in their respective age groups living below the poverty level.
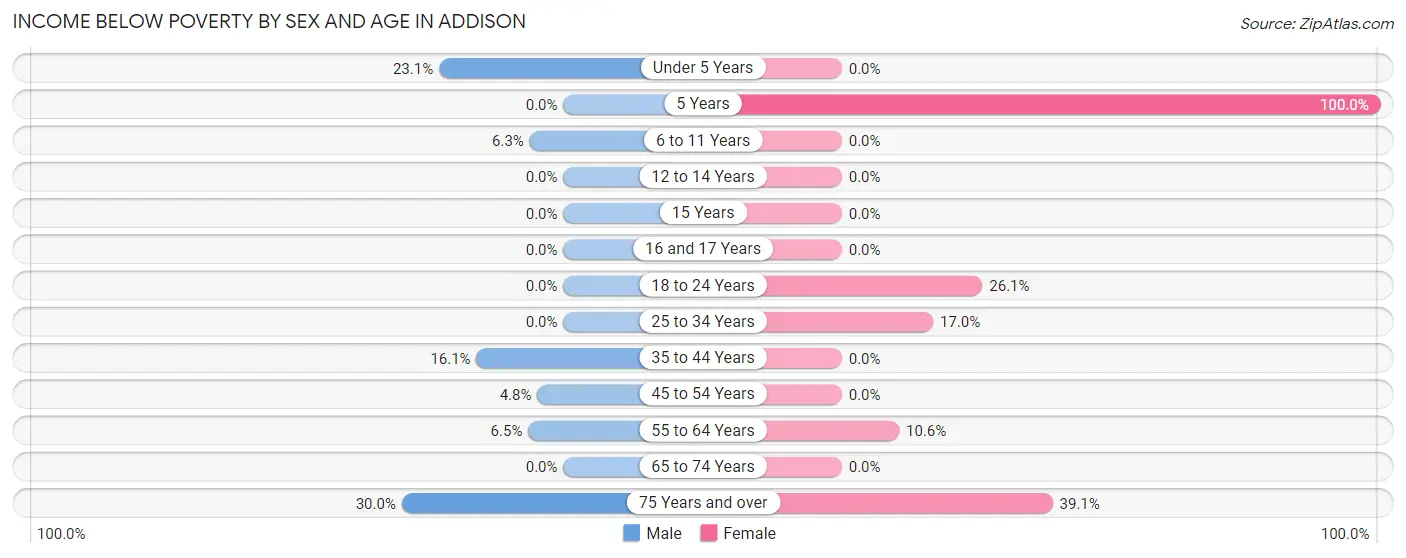
| Age Bracket | Male | Female |
| Under 5 Years | 12 (23.1%) | 0 (0.0%) |
| 5 Years | 0 (0.0%) | 6 (100.0%) |
| 6 to 11 Years | 2 (6.2%) | 0 (0.0%) |
| 12 to 14 Years | 0 (0.0%) | 0 (0.0%) |
| 15 Years | 0 (0.0%) | 0 (0.0%) |
| 16 and 17 Years | 0 (0.0%) | 0 (0.0%) |
| 18 to 24 Years | 0 (0.0%) | 6 (26.1%) |
| 25 to 34 Years | 0 (0.0%) | 10 (17.0%) |
| 35 to 44 Years | 5 (16.1%) | 0 (0.0%) |
| 45 to 54 Years | 3 (4.8%) | 0 (0.0%) |
| 55 to 64 Years | 3 (6.5%) | 5 (10.6%) |
| 65 to 74 Years | 0 (0.0%) | 0 (0.0%) |
| 75 Years and over | 6 (30.0%) | 18 (39.1%) |
| Total | 31 (9.7%) | 45 (13.0%) |
Income Above Poverty by Sex and Age in Addison
According to the poverty statistics in Addison, males aged 12 to 14 years and females aged under 5 years are the age groups that are most secure financially, with 100.0% of males and 100.0% of females in these age groups living above the poverty line.
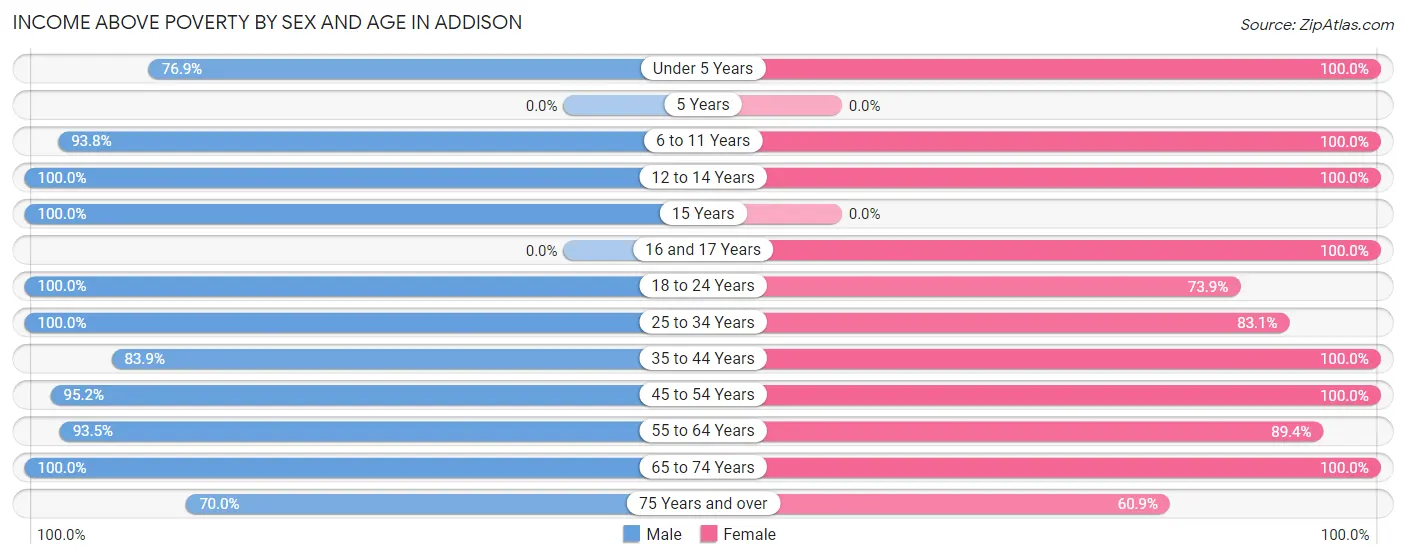
| Age Bracket | Male | Female |
| Under 5 Years | 40 (76.9%) | 22 (100.0%) |
| 5 Years | 0 (0.0%) | 0 (0.0%) |
| 6 to 11 Years | 30 (93.8%) | 24 (100.0%) |
| 12 to 14 Years | 8 (100.0%) | 5 (100.0%) |
| 15 Years | 6 (100.0%) | 0 (0.0%) |
| 16 and 17 Years | 0 (0.0%) | 11 (100.0%) |
| 18 to 24 Years | 26 (100.0%) | 17 (73.9%) |
| 25 to 34 Years | 23 (100.0%) | 49 (83.1%) |
| 35 to 44 Years | 26 (83.9%) | 32 (100.0%) |
| 45 to 54 Years | 59 (95.2%) | 42 (100.0%) |
| 55 to 64 Years | 43 (93.5%) | 42 (89.4%) |
| 65 to 74 Years | 14 (100.0%) | 28 (100.0%) |
| 75 Years and over | 14 (70.0%) | 28 (60.9%) |
| Total | 289 (90.3%) | 300 (87.0%) |
Income Below Poverty Among Married-Couple Families in Addison
The poverty statistics for married-couple families in Addison show that 2.1% or 3 of the total 140 families live below the poverty line. Families with no children have the highest poverty rate of 3.2%, comprising of 3 families. On the other hand, families with 1 or 2 children have the lowest poverty rate of 0.0%, which includes 0 families.
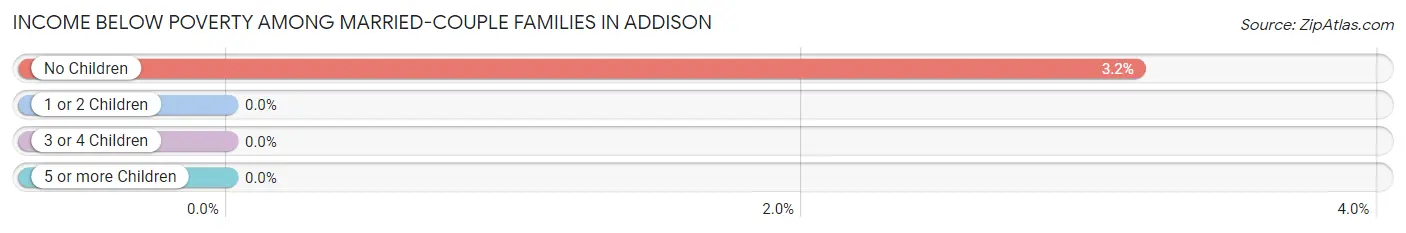
| Children | Above Poverty | Below Poverty |
| No Children | 92 (96.8%) | 3 (3.2%) |
| 1 or 2 Children | 41 (100.0%) | 0 (0.0%) |
| 3 or 4 Children | 4 (100.0%) | 0 (0.0%) |
| 5 or more Children | 0 (0.0%) | 0 (0.0%) |
| Total | 137 (97.9%) | 3 (2.1%) |
Income Below Poverty Among Single-Parent Households in Addison
According to the poverty data in Addison, 14.3% or 3 single-father households and 48.6% or 18 single-mother households are living below the poverty line. Among single-father households, those with 1 or 2 children have the highest poverty rate, with 3 households (16.7%) experiencing poverty. Likewise, among single-mother households, those with 1 or 2 children have the highest poverty rate, with 16 households (94.1%) falling below the poverty line.
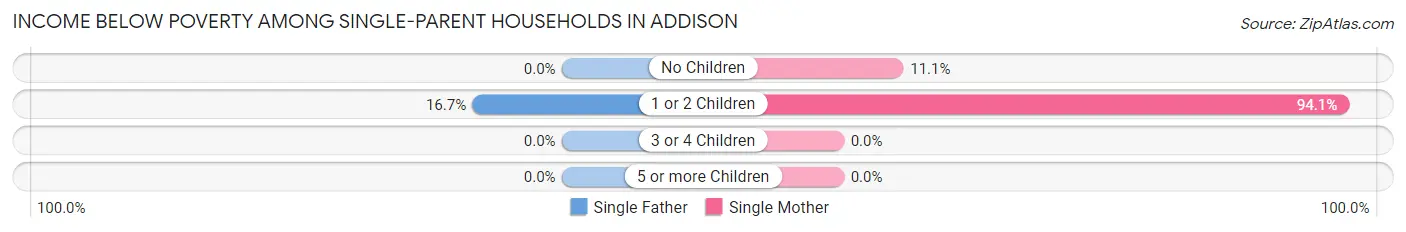
| Children | Single Father | Single Mother |
| No Children | 0 (0.0%) | 2 (11.1%) |
| 1 or 2 Children | 3 (16.7%) | 16 (94.1%) |
| 3 or 4 Children | 0 (0.0%) | 0 (0.0%) |
| 5 or more Children | 0 (0.0%) | 0 (0.0%) |
| Total | 3 (14.3%) | 18 (48.6%) |
Income Below Poverty Among Married-Couple vs Single-Parent Households in Addison
The poverty data for Addison shows that 3 of the married-couple family households (2.1%) and 21 of the single-parent households (36.2%) are living below the poverty level. Within the married-couple family households, those with no children have the highest poverty rate, with 3 households (3.2%) falling below the poverty line. Among the single-parent households, those with 1 or 2 children have the highest poverty rate, with 19 household (54.3%) living below poverty.
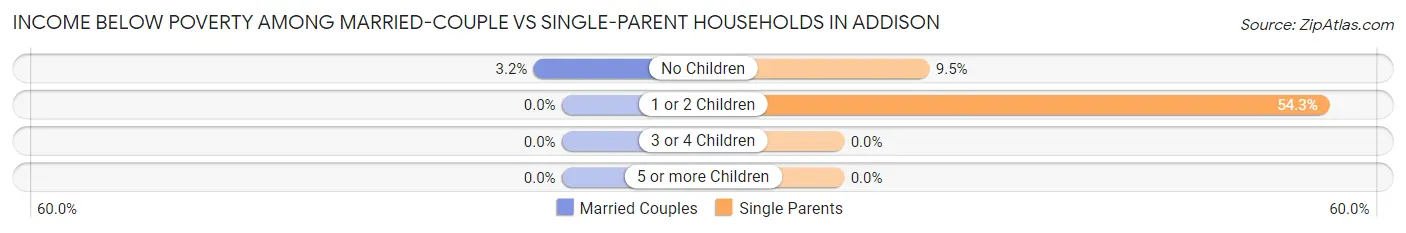
| Children | Married-Couple Families | Single-Parent Households |
| No Children | 3 (3.2%) | 2 (9.5%) |
| 1 or 2 Children | 0 (0.0%) | 19 (54.3%) |
| 3 or 4 Children | 0 (0.0%) | 0 (0.0%) |
| 5 or more Children | 0 (0.0%) | 0 (0.0%) |
| Total | 3 (2.1%) | 21 (36.2%) |
Race in Addison
The most populous races in Addison are White / Caucasian (648 | 97.4%), and Two or more Races (17 | 2.6%).
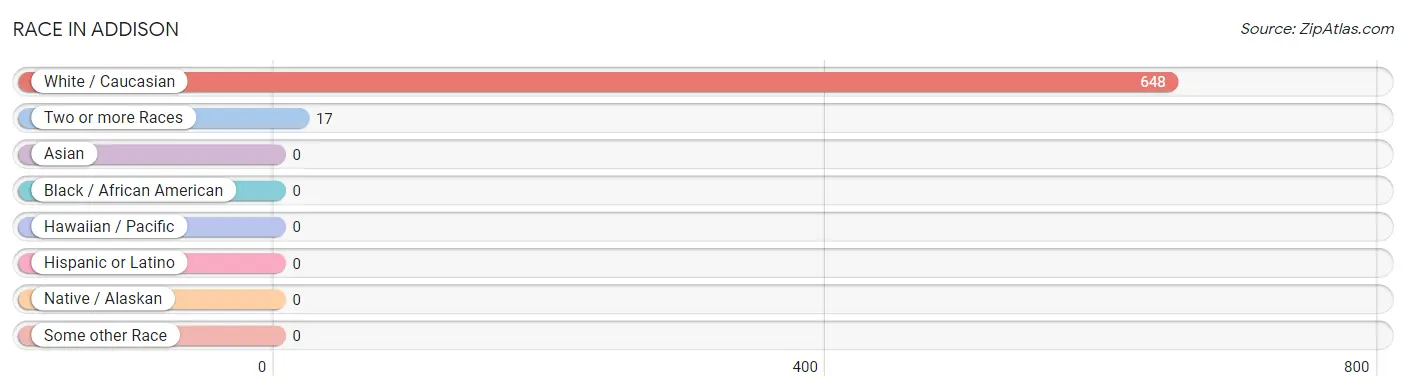
| Race | # Population | % Population |
| Asian | 0 | 0.0% |
| Black / African American | 0 | 0.0% |
| Hawaiian / Pacific | 0 | 0.0% |
| Hispanic or Latino | 0 | 0.0% |
| Native / Alaskan | 0 | 0.0% |
| White / Caucasian | 648 | 97.4% |
| Two or more Races | 17 | 2.6% |
| Some other Race | 0 | 0.0% |
| Total | 665 | 100.0% |
Ancestry in Addison
The most populous ancestries reported in Addison are American (127 | 19.1%), English (95 | 14.3%), German (92 | 13.8%), Irish (74 | 11.1%), and European (15 | 2.3%), together accounting for 60.6% of all Addison residents.
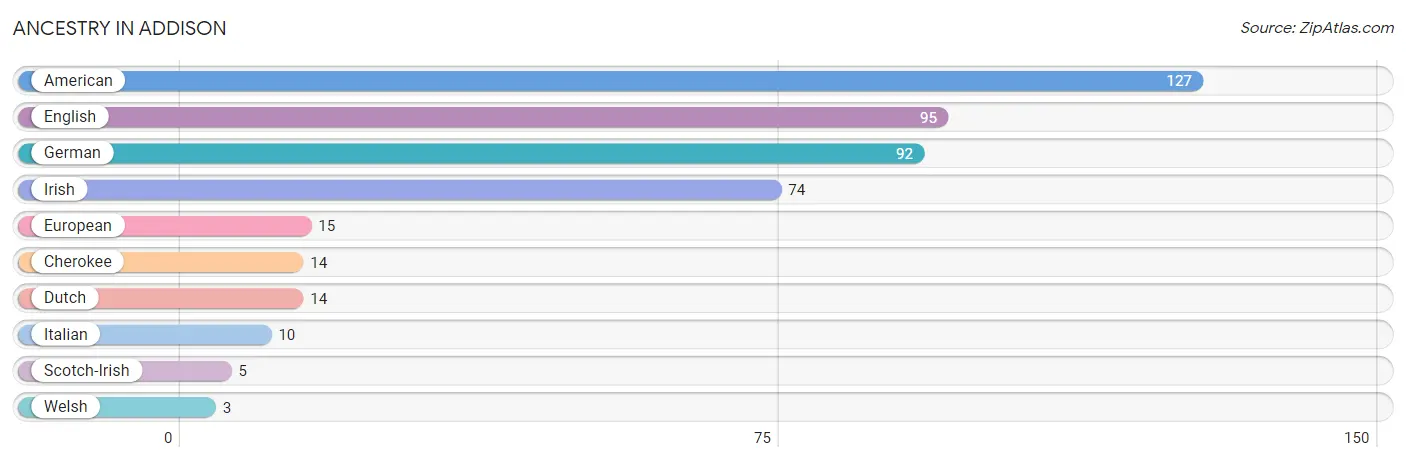
| Ancestry | # Population | % Population |
| American | 127 | 19.1% |
| Cherokee | 14 | 2.1% |
| Dutch | 14 | 2.1% |
| English | 95 | 14.3% |
| European | 15 | 2.3% |
| German | 92 | 13.8% |
| Irish | 74 | 11.1% |
| Italian | 10 | 1.5% |
| Scotch-Irish | 5 | 0.7% |
| Welsh | 3 | 0.4% | View All 10 Rows |
Immigrants in Addison

| Immigration Origin | # Population | % Population | View All 0 Rows |
Sex and Age in Addison
Sex and Age in Addison
The most populous age groups in Addison are Under 5 Years (52 | 16.3%) for men and 25 to 29 Years (43 | 12.5%) for women.
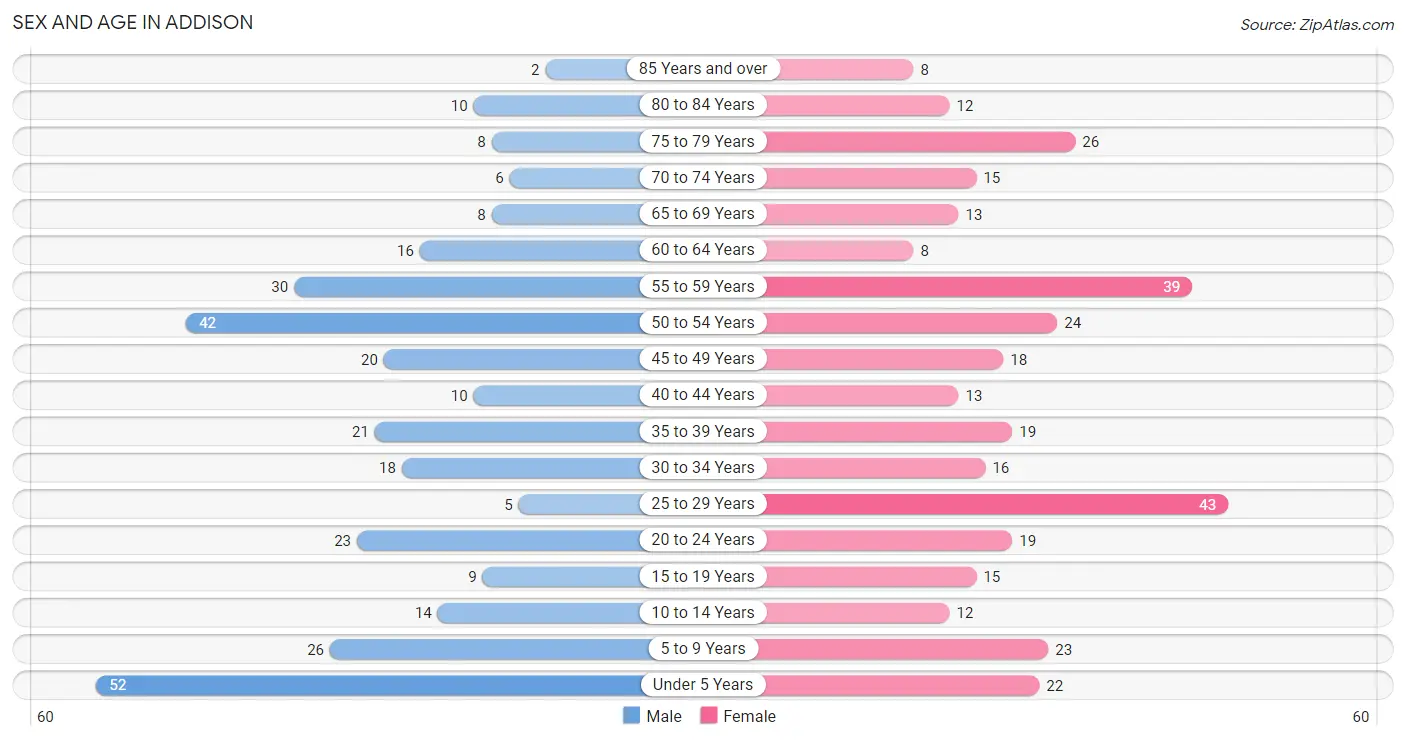
| Age Bracket | Male | Female |
| Under 5 Years | 52 (16.3%) | 22 (6.4%) |
| 5 to 9 Years | 26 (8.1%) | 23 (6.7%) |
| 10 to 14 Years | 14 (4.4%) | 12 (3.5%) |
| 15 to 19 Years | 9 (2.8%) | 15 (4.3%) |
| 20 to 24 Years | 23 (7.2%) | 19 (5.5%) |
| 25 to 29 Years | 5 (1.6%) | 43 (12.5%) |
| 30 to 34 Years | 18 (5.6%) | 16 (4.6%) |
| 35 to 39 Years | 21 (6.6%) | 19 (5.5%) |
| 40 to 44 Years | 10 (3.1%) | 13 (3.8%) |
| 45 to 49 Years | 20 (6.2%) | 18 (5.2%) |
| 50 to 54 Years | 42 (13.1%) | 24 (7.0%) |
| 55 to 59 Years | 30 (9.4%) | 39 (11.3%) |
| 60 to 64 Years | 16 (5.0%) | 8 (2.3%) |
| 65 to 69 Years | 8 (2.5%) | 13 (3.8%) |
| 70 to 74 Years | 6 (1.9%) | 15 (4.3%) |
| 75 to 79 Years | 8 (2.5%) | 26 (7.5%) |
| 80 to 84 Years | 10 (3.1%) | 12 (3.5%) |
| 85 Years and over | 2 (0.6%) | 8 (2.3%) |
| Total | 320 (100.0%) | 345 (100.0%) |
Families and Households in Addison
Median Family Size in Addison
The median family size in Addison is 2.93 persons per family, with married-couple families (140 | 70.7%) accounting for the largest median family size of 3.16 persons per family. On the other hand, single male/father families (21 | 10.6%) represent the smallest median family size with 2.24 persons per family.
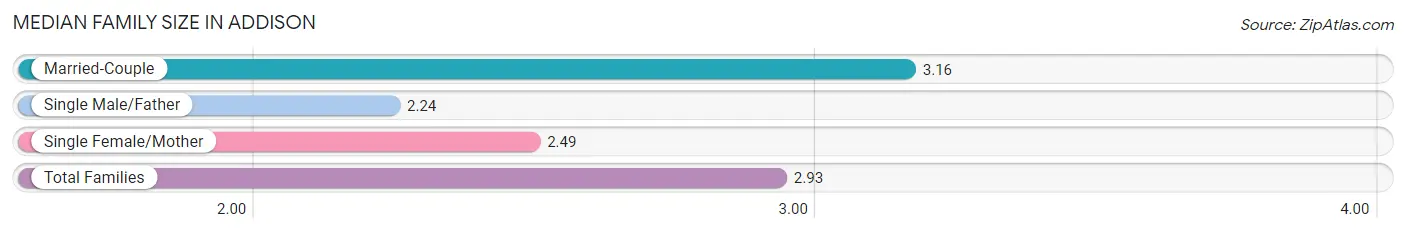
| Family Type | # Families | Family Size |
| Married-Couple | 140 (70.7%) | 3.16 |
| Single Male/Father | 21 (10.6%) | 2.24 |
| Single Female/Mother | 37 (18.7%) | 2.49 |
| Total Families | 198 (100.0%) | 2.93 |
Median Household Size in Addison
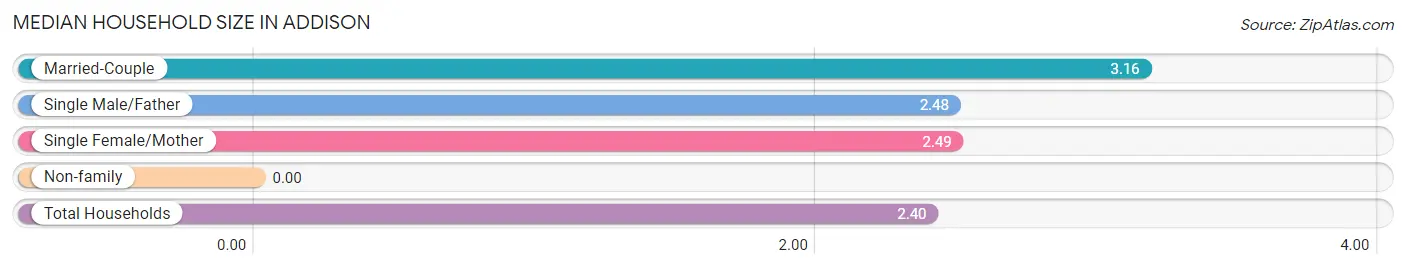
| Household Type | # Households | Household Size |
| Married-Couple | 140 (50.5%) | 3.16 |
| Single Male/Father | 21 (7.6%) | 2.48 |
| Single Female/Mother | 37 (13.4%) | 2.49 |
| Non-family | 79 (28.5%) | - |
| Total Households | 277 (100.0%) | 2.40 |
Household Size by Marriage Status in Addison
Out of a total of 277 households in Addison, 198 (71.5%) are family households, while 79 (28.5%) are nonfamily households. The most numerous type of family households are 2-person households, comprising 129, and the most common type of nonfamily households are 1-person households, comprising 79.
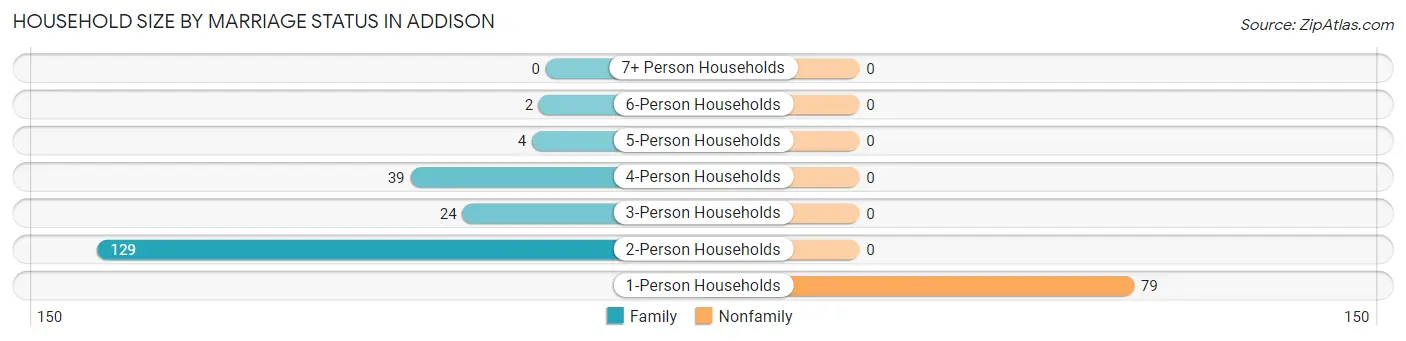
| Household Size | Family Households | Nonfamily Households |
| 1-Person Households | - | 79 (28.5%) |
| 2-Person Households | 129 (46.6%) | 0 (0.0%) |
| 3-Person Households | 24 (8.7%) | 0 (0.0%) |
| 4-Person Households | 39 (14.1%) | 0 (0.0%) |
| 5-Person Households | 4 (1.4%) | 0 (0.0%) |
| 6-Person Households | 2 (0.7%) | 0 (0.0%) |
| 7+ Person Households | 0 (0.0%) | 0 (0.0%) |
| Total | 198 (71.5%) | 79 (28.5%) |
Female Fertility in Addison
Fertility by Age in Addison
Average fertility rate in Addison is 41.0 births per 1,000 women. Women in the age bracket of 20 to 34 years have the highest fertility rate with 77.0 births per 1,000 women. Women in the age bracket of 20 to 34 years acount for 100.0% of all women with births.
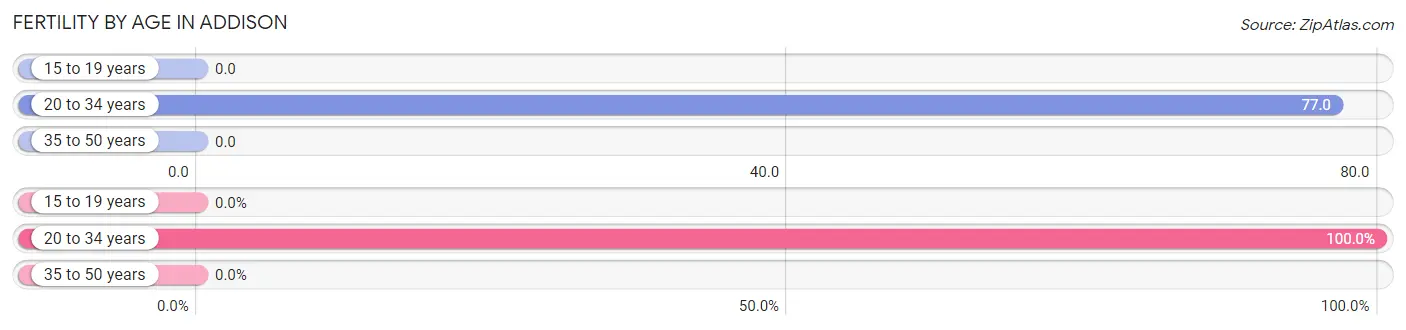
| Age Bracket | Women with Births | Births / 1,000 Women |
| 15 to 19 years | 0 (0.0%) | 0.0 |
| 20 to 34 years | 6 (100.0%) | 77.0 |
| 35 to 50 years | 0 (0.0%) | 0.0 |
| Total | 6 (100.0%) | 41.0 |
Fertility by Age by Marriage Status in Addison
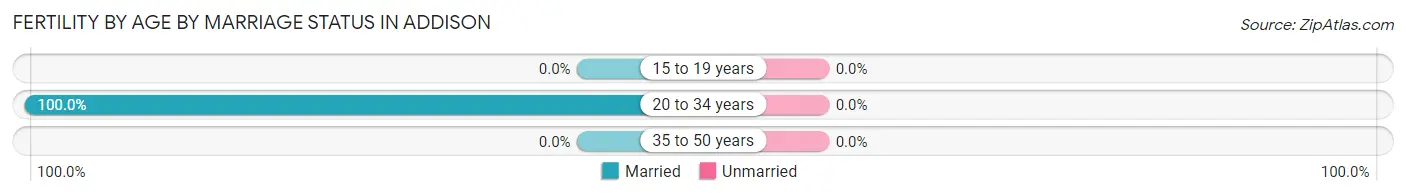
| Age Bracket | Married | Unmarried |
| 15 to 19 years | 0 (0.0%) | 0 (0.0%) |
| 20 to 34 years | 6 (100.0%) | 0 (0.0%) |
| 35 to 50 years | 0 (0.0%) | 0 (0.0%) |
| Total | 6 (100.0%) | 0 (0.0%) |
Fertility by Education in Addison
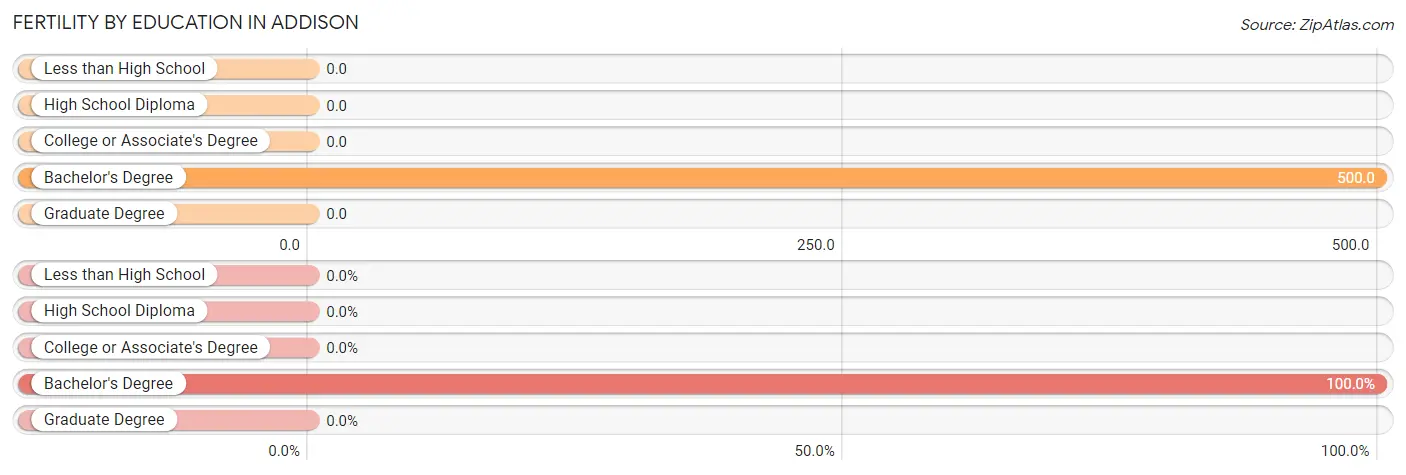
| Educational Attainment | Women with Births | Births / 1,000 Women |
| Less than High School | 0 (0.0%) | 0.0 |
| High School Diploma | 0 (0.0%) | 0.0 |
| College or Associate's Degree | 0 (0.0%) | 0.0 |
| Bachelor's Degree | 6 (100.0%) | 500.0 |
| Graduate Degree | 0 (0.0%) | 0.0 |
| Total | 6 (100.0%) | 41.0 |
Fertility by Education by Marriage Status in Addison
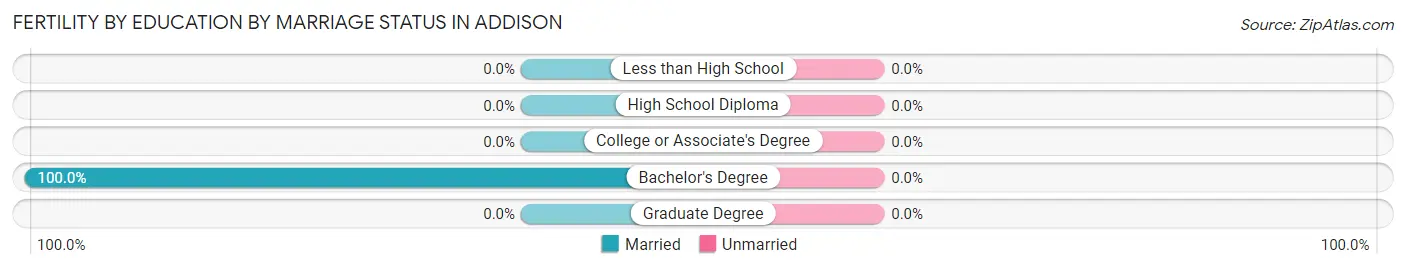
| Educational Attainment | Married | Unmarried |
| Less than High School | 0 (0.0%) | 0 (0.0%) |
| High School Diploma | 0 (0.0%) | 0 (0.0%) |
| College or Associate's Degree | 0 (0.0%) | 0 (0.0%) |
| Bachelor's Degree | 6 (100.0%) | 0 (0.0%) |
| Graduate Degree | 0 (0.0%) | 0 (0.0%) |
| Total | 6 (100.0%) | 0 (0.0%) |
Employment Characteristics in Addison
Employment by Class of Employer in Addison
Among the 365 employed individuals in Addison, private company employees (249 | 68.2%), local government employees (49 | 13.4%), and self-employed (not incorporated) (33 | 9.0%) make up the most common classes of employment.
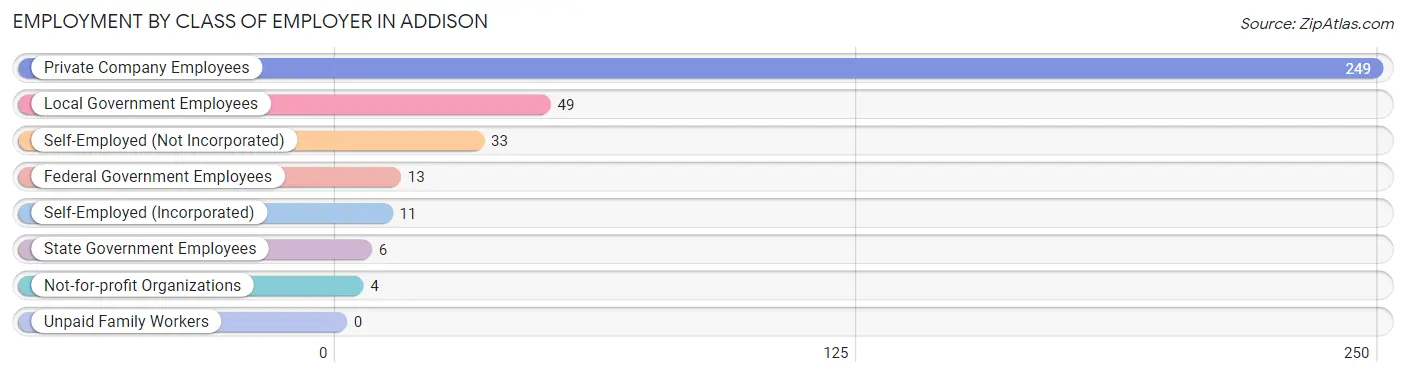
| Employer Class | # Employees | % Employees |
| Private Company Employees | 249 | 68.2% |
| Self-Employed (Incorporated) | 11 | 3.0% |
| Self-Employed (Not Incorporated) | 33 | 9.0% |
| Not-for-profit Organizations | 4 | 1.1% |
| Local Government Employees | 49 | 13.4% |
| State Government Employees | 6 | 1.6% |
| Federal Government Employees | 13 | 3.6% |
| Unpaid Family Workers | 0 | 0.0% |
| Total | 365 | 100.0% |
Employment Status by Age in Addison
According to the labor force statistics for Addison, out of the total population over 16 years of age (510), 72.2% or 368 individuals are in the labor force, with 0.8% or 3 of them unemployed. The age group with the highest labor force participation rate is 20 to 24 years, with 100.0% or 42 individuals in the labor force. Within the labor force, the 45 to 54 years age range has the highest percentage of unemployed individuals, with 3.4% or 3 of them being unemployed.
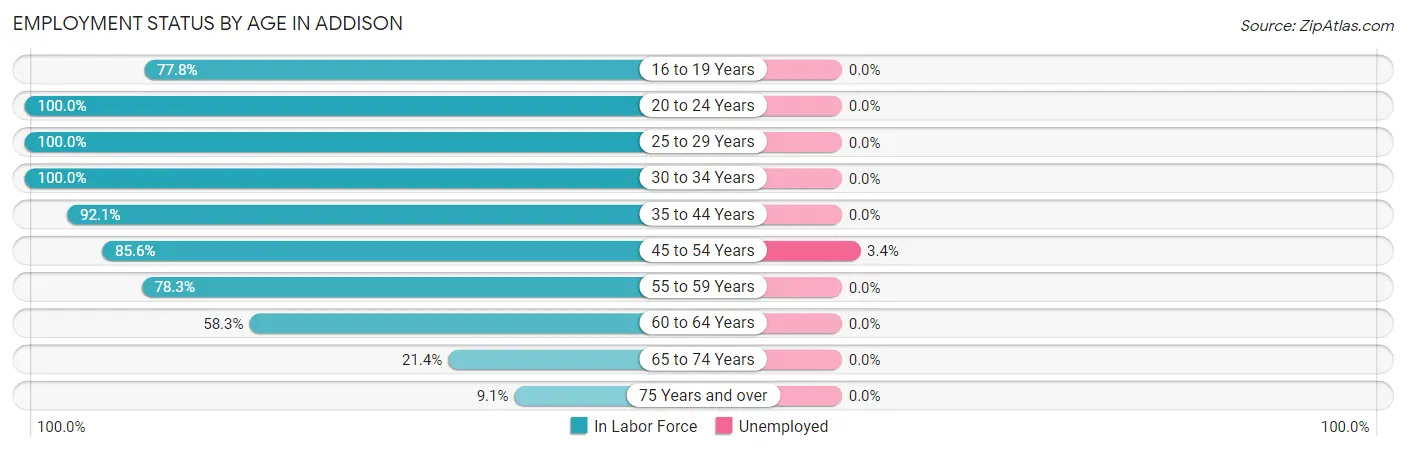
| Age Bracket | In Labor Force | Unemployed |
| 16 to 19 Years | 14 (77.8%) | 0 (0.0%) |
| 20 to 24 Years | 42 (100.0%) | 0 (0.0%) |
| 25 to 29 Years | 48 (100.0%) | 0 (0.0%) |
| 30 to 34 Years | 34 (100.0%) | 0 (0.0%) |
| 35 to 44 Years | 58 (92.1%) | 0 (0.0%) |
| 45 to 54 Years | 89 (85.6%) | 3 (3.4%) |
| 55 to 59 Years | 54 (78.3%) | 0 (0.0%) |
| 60 to 64 Years | 14 (58.3%) | 0 (0.0%) |
| 65 to 74 Years | 9 (21.4%) | 0 (0.0%) |
| 75 Years and over | 6 (9.1%) | 0 (0.0%) |
| Total | 368 (72.2%) | 3 (0.8%) |
Employment Status by Educational Attainment in Addison
According to labor force statistics for Addison, 86.8% of individuals (297) out of the total population between 25 and 64 years of age (342) are in the labor force, with 1.0% or 3 of them being unemployed. The group with the highest labor force participation rate are those with the educational attainment of bachelor's degree or higher, with 100.0% or 25 individuals in the labor force. Within the labor force, individuals with less than high school education have the highest percentage of unemployment, with 8.1% or 3 of them being unemployed.
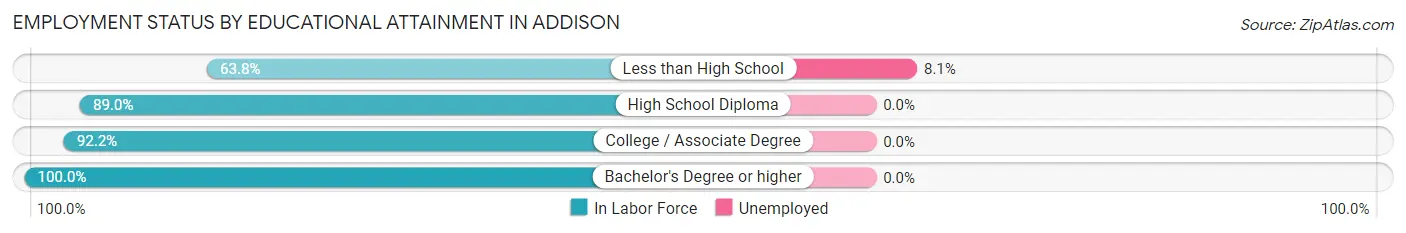
| Educational Attainment | In Labor Force | Unemployed |
| Less than High School | 37 (63.8%) | 5 (8.1%) |
| High School Diploma | 105 (89.0%) | 0 (0.0%) |
| College / Associate Degree | 130 (92.2%) | 0 (0.0%) |
| Bachelor's Degree or higher | 25 (100.0%) | 0 (0.0%) |
| Total | 297 (86.8%) | 3 (1.0%) |
Employment Occupations by Sex in Addison
Management, Business, Science and Arts Occupations
The most common Management, Business, Science and Arts occupations in Addison are Health Diagnosing & Treating (39 | 10.7%), Health Technologists (21 | 5.8%), Community & Social Service (17 | 4.7%), Education Instruction & Library (17 | 4.7%), and Management (3 | 0.8%).
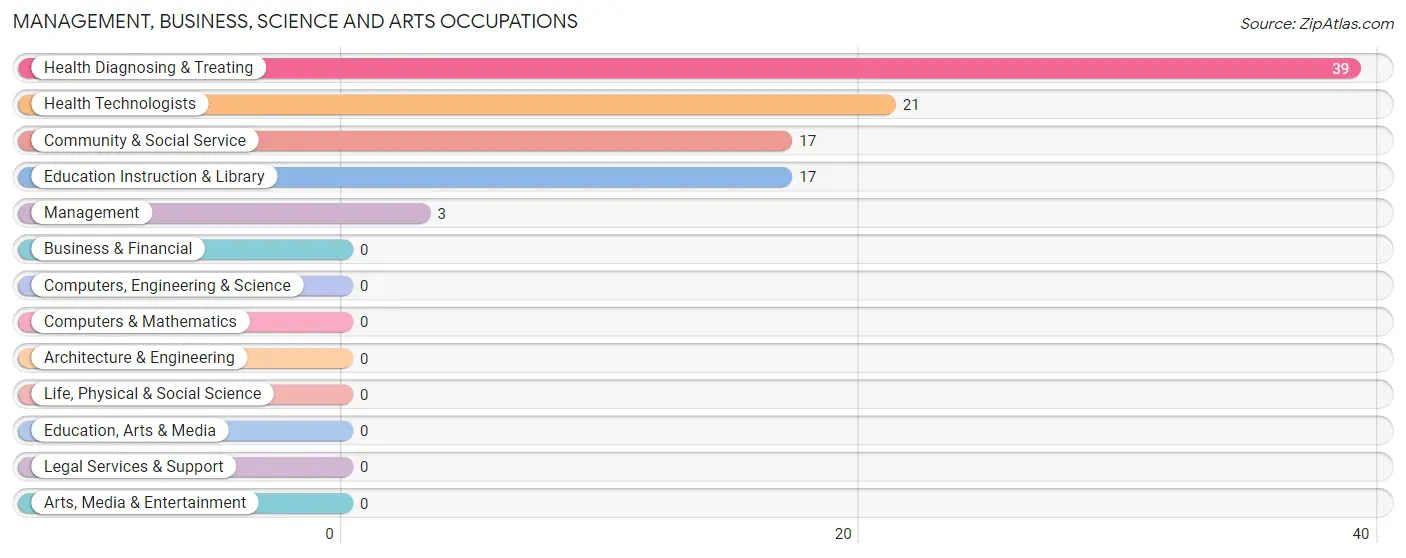
Management, Business, Science and Arts Occupations by Sex
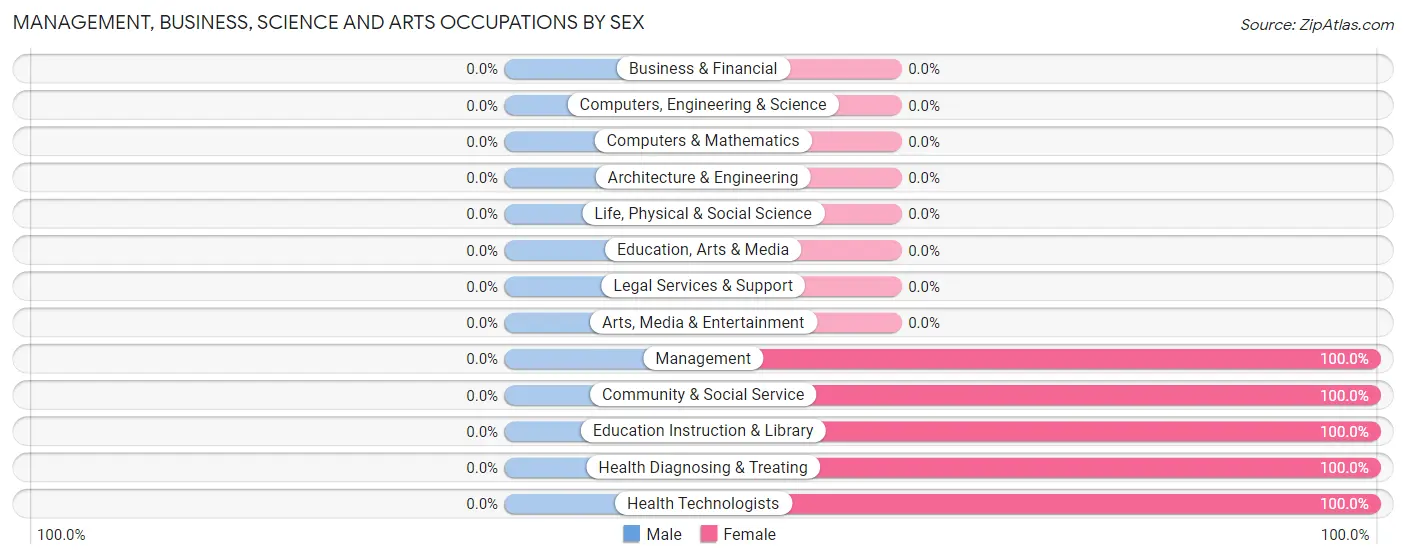
| Occupation | Male | Female |
| Management | 0 (0.0%) | 3 (100.0%) |
| Business & Financial | 0 (0.0%) | 0 (0.0%) |
| Computers, Engineering & Science | 0 (0.0%) | 0 (0.0%) |
| Computers & Mathematics | 0 (0.0%) | 0 (0.0%) |
| Architecture & Engineering | 0 (0.0%) | 0 (0.0%) |
| Life, Physical & Social Science | 0 (0.0%) | 0 (0.0%) |
| Community & Social Service | 0 (0.0%) | 17 (100.0%) |
| Education, Arts & Media | 0 (0.0%) | 0 (0.0%) |
| Legal Services & Support | 0 (0.0%) | 0 (0.0%) |
| Education Instruction & Library | 0 (0.0%) | 17 (100.0%) |
| Arts, Media & Entertainment | 0 (0.0%) | 0 (0.0%) |
| Health Diagnosing & Treating | 0 (0.0%) | 39 (100.0%) |
| Health Technologists | 0 (0.0%) | 21 (100.0%) |
| Total (Category) | 0 (0.0%) | 59 (100.0%) |
| Total (Overall) | 183 (50.1%) | 182 (49.9%) |
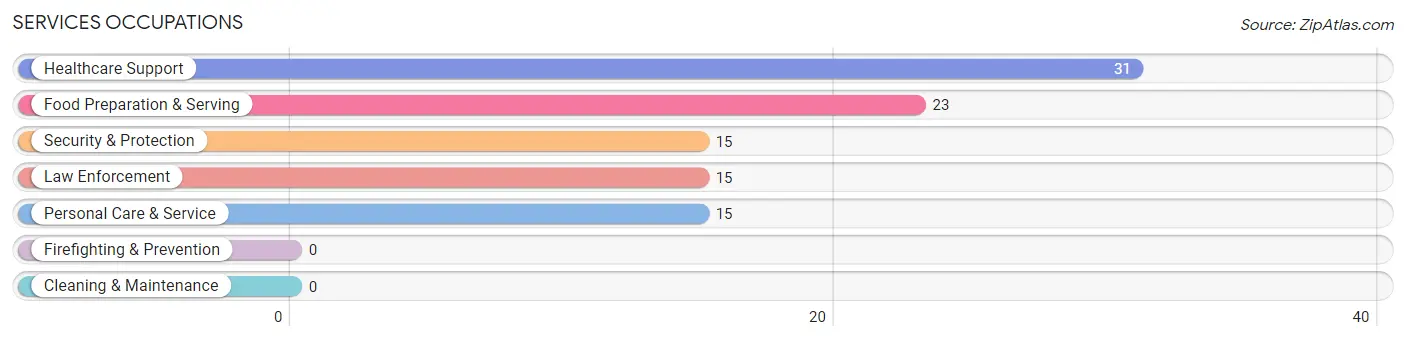
Services Occupations
The most common Services occupations in Addison are Healthcare Support (31 | 8.5%), Food Preparation & Serving (23 | 6.3%), Security & Protection (15 | 4.1%), Law Enforcement (15 | 4.1%), and Personal Care & Service (15 | 4.1%).
Services Occupations by Sex
Within the Services occupations in Addison, the most male-oriented occupations are Security & Protection (100.0%), Law Enforcement (100.0%), and Personal Care & Service (13.3%), while the most female-oriented occupations are Healthcare Support (100.0%), Food Preparation & Serving (100.0%), and Personal Care & Service (86.7%).
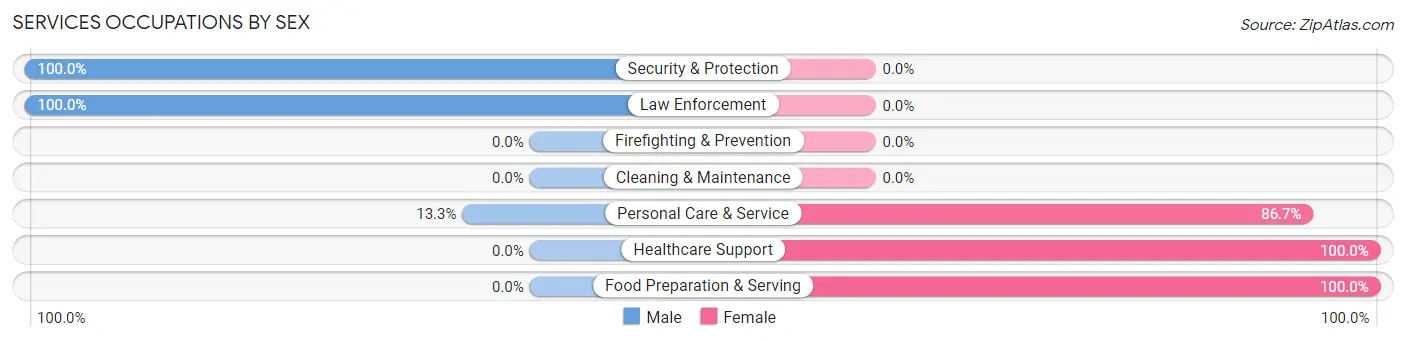
| Occupation | Male | Female |
| Healthcare Support | 0 (0.0%) | 31 (100.0%) |
| Security & Protection | 15 (100.0%) | 0 (0.0%) |
| Firefighting & Prevention | 0 (0.0%) | 0 (0.0%) |
| Law Enforcement | 15 (100.0%) | 0 (0.0%) |
| Food Preparation & Serving | 0 (0.0%) | 23 (100.0%) |
| Cleaning & Maintenance | 0 (0.0%) | 0 (0.0%) |
| Personal Care & Service | 2 (13.3%) | 13 (86.7%) |
| Total (Category) | 17 (20.2%) | 67 (79.8%) |
| Total (Overall) | 183 (50.1%) | 182 (49.9%) |
Sales and Office Occupations
The most common Sales and Office occupations in Addison are Sales & Related (41 | 11.2%), and Office & Administration (26 | 7.1%).
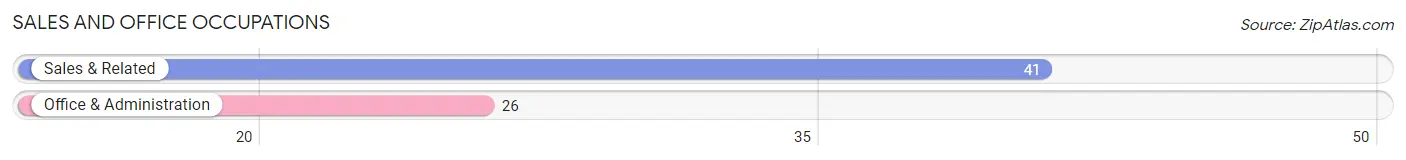
Sales and Office Occupations by Sex
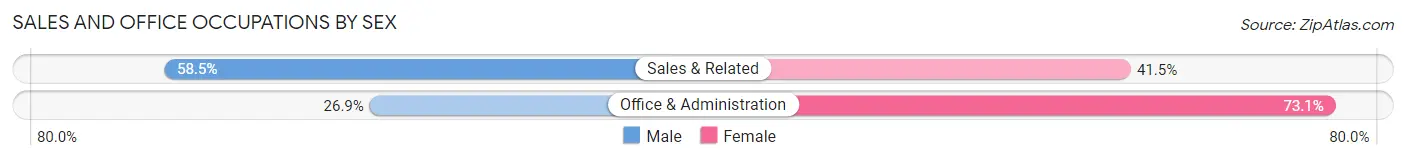
| Occupation | Male | Female |
| Sales & Related | 24 (58.5%) | 17 (41.5%) |
| Office & Administration | 7 (26.9%) | 19 (73.1%) |
| Total (Category) | 31 (46.3%) | 36 (53.7%) |
| Total (Overall) | 183 (50.1%) | 182 (49.9%) |
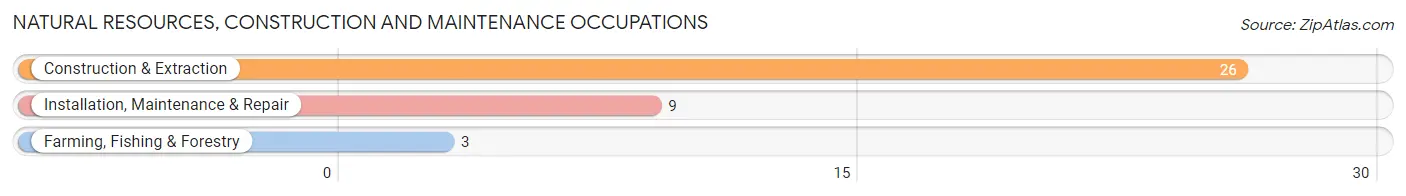
Natural Resources, Construction and Maintenance Occupations
The most common Natural Resources, Construction and Maintenance occupations in Addison are Construction & Extraction (26 | 7.1%), Installation, Maintenance & Repair (9 | 2.5%), and Farming, Fishing & Forestry (3 | 0.8%).
Natural Resources, Construction and Maintenance Occupations by Sex
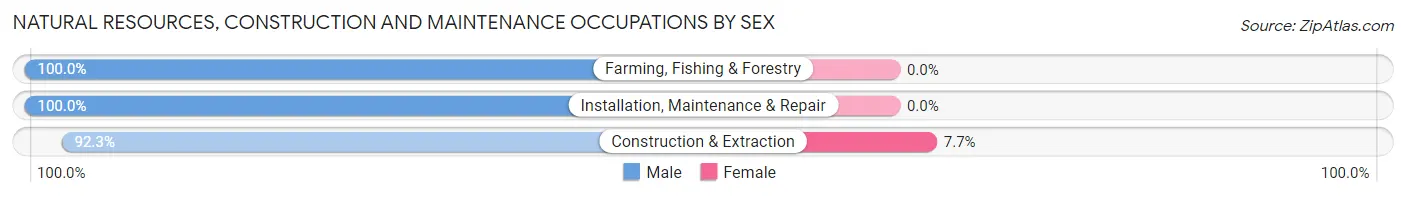
| Occupation | Male | Female |
| Farming, Fishing & Forestry | 3 (100.0%) | 0 (0.0%) |
| Construction & Extraction | 24 (92.3%) | 2 (7.7%) |
| Installation, Maintenance & Repair | 9 (100.0%) | 0 (0.0%) |
| Total (Category) | 36 (94.7%) | 2 (5.3%) |
| Total (Overall) | 183 (50.1%) | 182 (49.9%) |
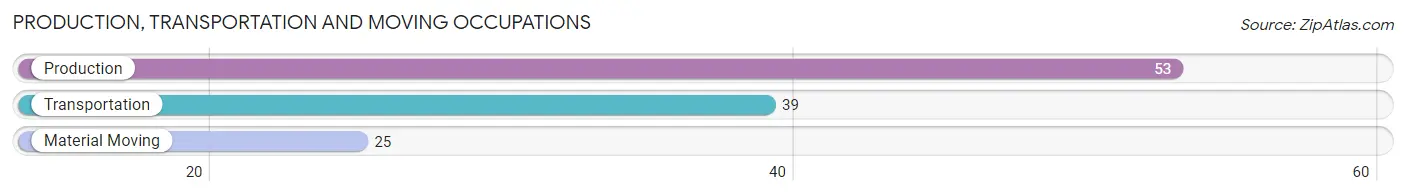
Production, Transportation and Moving Occupations
The most common Production, Transportation and Moving occupations in Addison are Production (53 | 14.5%), Transportation (39 | 10.7%), and Material Moving (25 | 6.9%).
Production, Transportation and Moving Occupations by Sex
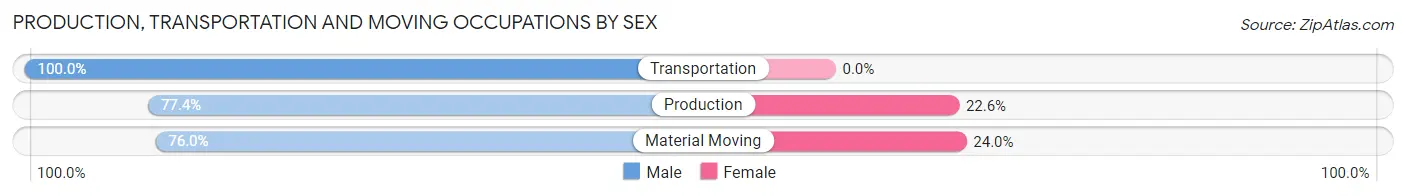
| Occupation | Male | Female |
| Production | 41 (77.4%) | 12 (22.6%) |
| Transportation | 39 (100.0%) | 0 (0.0%) |
| Material Moving | 19 (76.0%) | 6 (24.0%) |
| Total (Category) | 99 (84.6%) | 18 (15.4%) |
| Total (Overall) | 183 (50.1%) | 182 (49.9%) |
Employment Industries by Sex in Addison
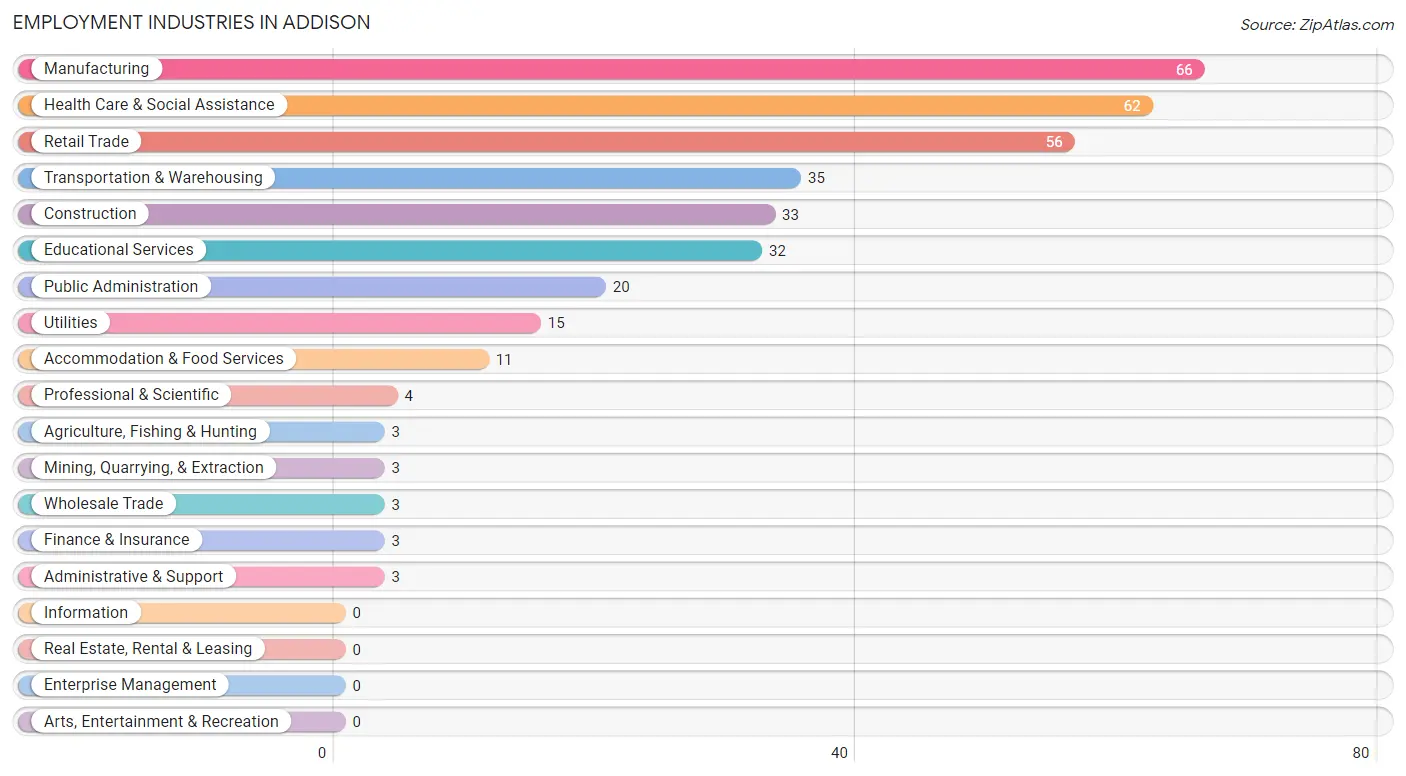
Employment Industries in Addison
The major employment industries in Addison include Manufacturing (66 | 18.1%), Health Care & Social Assistance (62 | 17.0%), Retail Trade (56 | 15.3%), Transportation & Warehousing (35 | 9.6%), and Construction (33 | 9.0%).
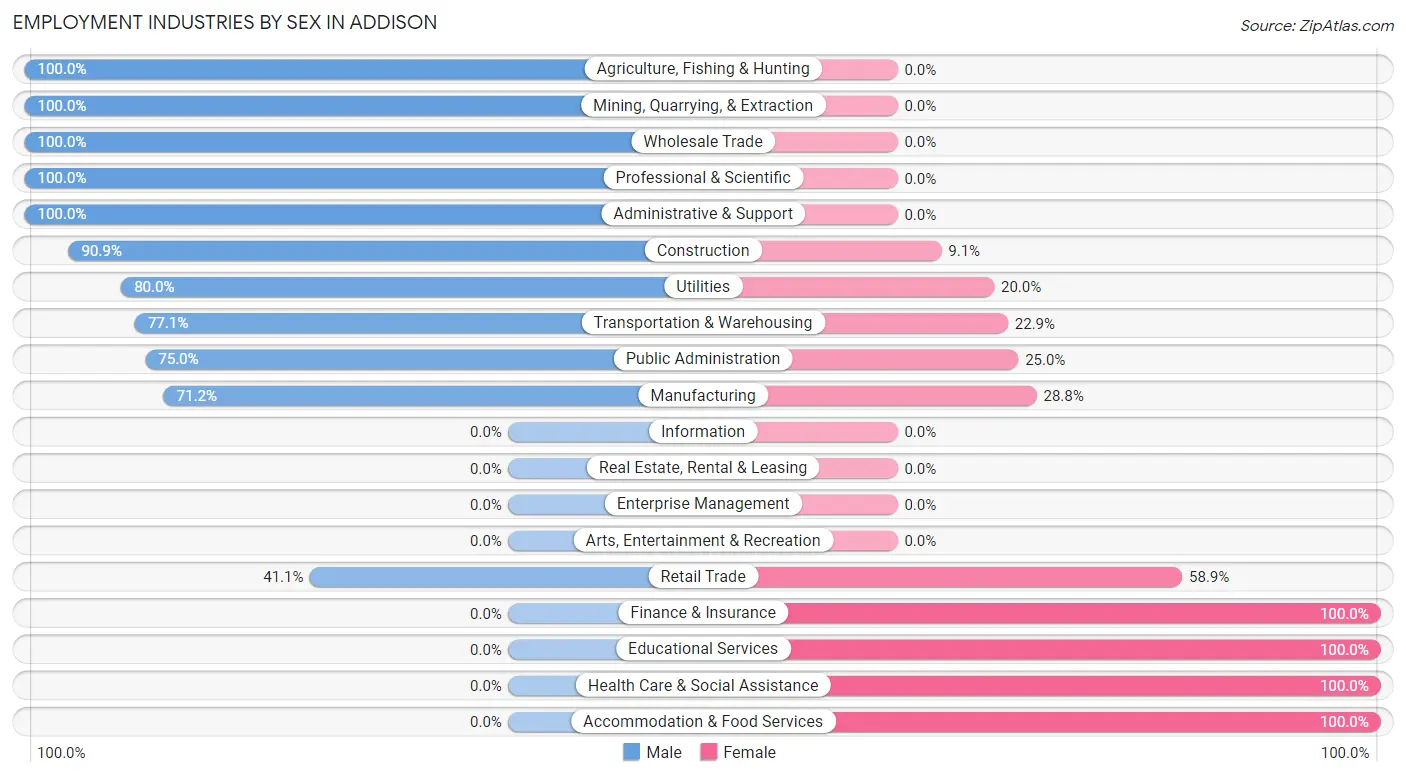
Employment Industries by Sex in Addison
The Addison industries that see more men than women are Agriculture, Fishing & Hunting (100.0%), Mining, Quarrying, & Extraction (100.0%), and Wholesale Trade (100.0%), whereas the industries that tend to have a higher number of women are Finance & Insurance (100.0%), Educational Services (100.0%), and Health Care & Social Assistance (100.0%).
| Industry | Male | Female |
| Agriculture, Fishing & Hunting | 3 (100.0%) | 0 (0.0%) |
| Mining, Quarrying, & Extraction | 3 (100.0%) | 0 (0.0%) |
| Construction | 30 (90.9%) | 3 (9.1%) |
| Manufacturing | 47 (71.2%) | 19 (28.8%) |
| Wholesale Trade | 3 (100.0%) | 0 (0.0%) |
| Retail Trade | 23 (41.1%) | 33 (58.9%) |
| Transportation & Warehousing | 27 (77.1%) | 8 (22.9%) |
| Utilities | 12 (80.0%) | 3 (20.0%) |
| Information | 0 (0.0%) | 0 (0.0%) |
| Finance & Insurance | 0 (0.0%) | 3 (100.0%) |
| Real Estate, Rental & Leasing | 0 (0.0%) | 0 (0.0%) |
| Professional & Scientific | 4 (100.0%) | 0 (0.0%) |
| Enterprise Management | 0 (0.0%) | 0 (0.0%) |
| Administrative & Support | 3 (100.0%) | 0 (0.0%) |
| Educational Services | 0 (0.0%) | 32 (100.0%) |
| Health Care & Social Assistance | 0 (0.0%) | 62 (100.0%) |
| Arts, Entertainment & Recreation | 0 (0.0%) | 0 (0.0%) |
| Accommodation & Food Services | 0 (0.0%) | 11 (100.0%) |
| Public Administration | 15 (75.0%) | 5 (25.0%) |
| Total | 183 (50.1%) | 182 (49.9%) |
Education in Addison
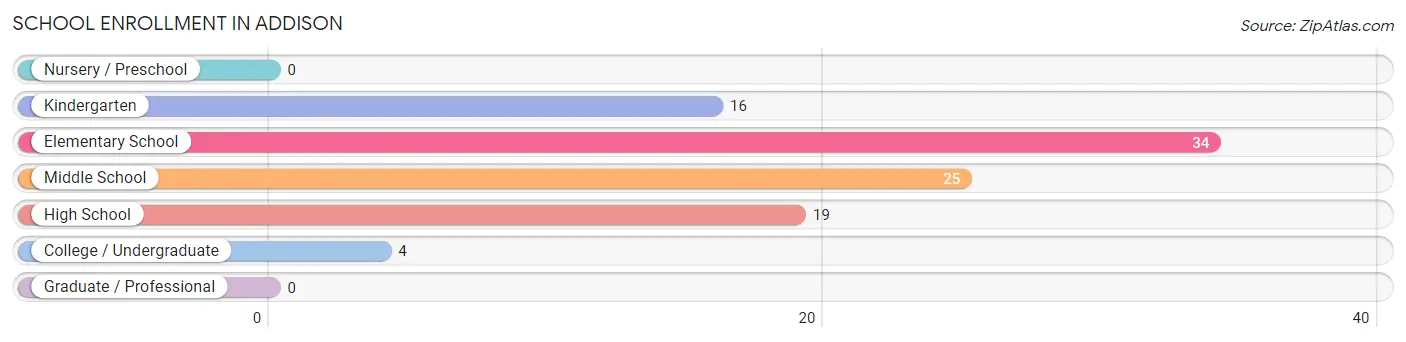
School Enrollment in Addison
The most common levels of schooling among the 98 students in Addison are elementary school (34 | 34.7%), middle school (25 | 25.5%), and high school (19 | 19.4%).
| School Level | # Students | % Students |
| Nursery / Preschool | 0 | 0.0% |
| Kindergarten | 16 | 16.3% |
| Elementary School | 34 | 34.7% |
| Middle School | 25 | 25.5% |
| High School | 19 | 19.4% |
| College / Undergraduate | 4 | 4.1% |
| Graduate / Professional | 0 | 0.0% |
| Total | 98 | 100.0% |
School Enrollment by Age by Funding Source in Addison
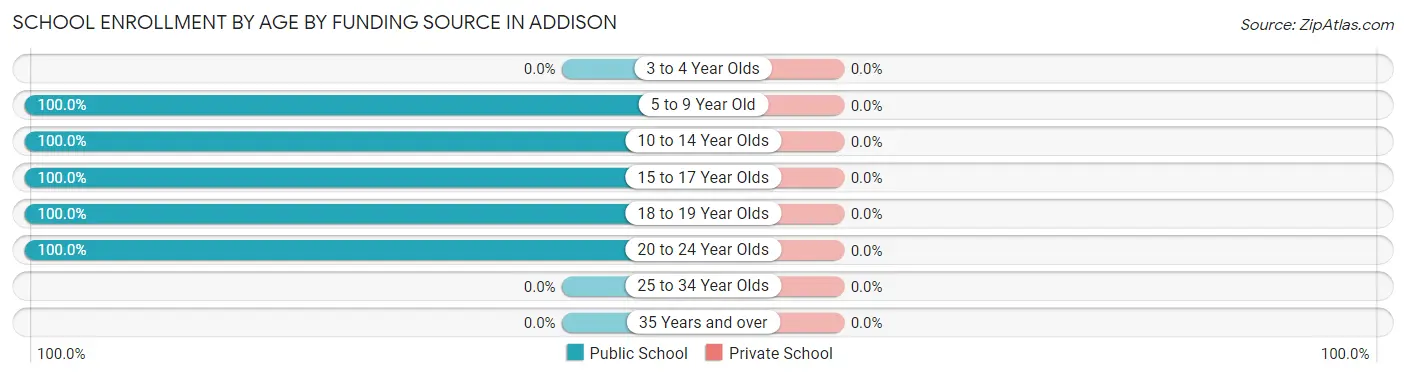
| Age Bracket | Public School | Private School |
| 3 to 4 Year Olds | 0 (0.0%) | 0 (0.0%) |
| 5 to 9 Year Old | 49 (100.0%) | 0 (0.0%) |
| 10 to 14 Year Olds | 26 (100.0%) | 0 (0.0%) |
| 15 to 17 Year Olds | 17 (100.0%) | 0 (0.0%) |
| 18 to 19 Year Olds | 2 (100.0%) | 0 (0.0%) |
| 20 to 24 Year Olds | 4 (100.0%) | 0 (0.0%) |
| 25 to 34 Year Olds | 0 (0.0%) | 0 (0.0%) |
| 35 Years and over | 0 (0.0%) | 0 (0.0%) |
| Total | 98 (100.0%) | 0 (0.0%) |
Educational Attainment by Field of Study in Addison
Education (21 | 56.8%), business (9 | 24.3%), bio, nature & agricultural (4 | 10.8%), and psychology (3 | 8.1%) are the most common fields of study among 37 individuals in Addison who have obtained a bachelor's degree or higher.
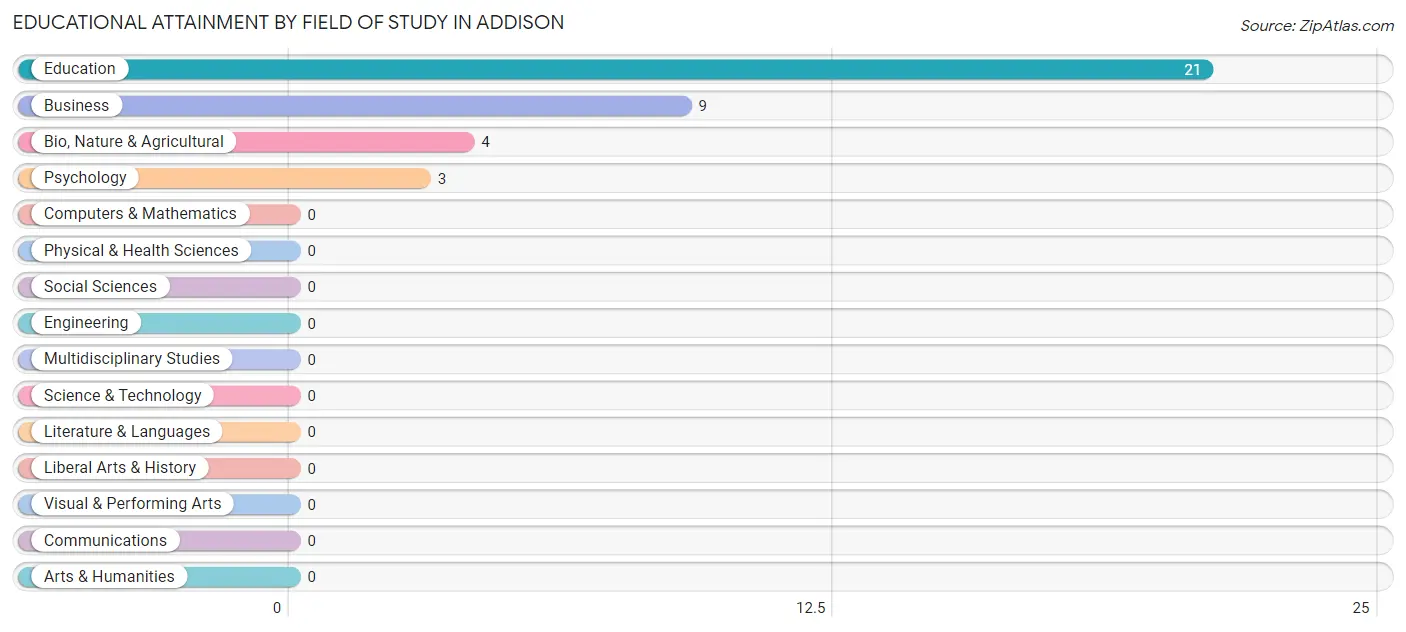
| Field of Study | # Graduates | % Graduates |
| Computers & Mathematics | 0 | 0.0% |
| Bio, Nature & Agricultural | 4 | 10.8% |
| Physical & Health Sciences | 0 | 0.0% |
| Psychology | 3 | 8.1% |
| Social Sciences | 0 | 0.0% |
| Engineering | 0 | 0.0% |
| Multidisciplinary Studies | 0 | 0.0% |
| Science & Technology | 0 | 0.0% |
| Business | 9 | 24.3% |
| Education | 21 | 56.8% |
| Literature & Languages | 0 | 0.0% |
| Liberal Arts & History | 0 | 0.0% |
| Visual & Performing Arts | 0 | 0.0% |
| Communications | 0 | 0.0% |
| Arts & Humanities | 0 | 0.0% |
| Total | 37 | 100.0% |
Transportation & Commute in Addison
Vehicle Availability by Sex in Addison
The most prevalent vehicle ownership categories in Addison are males with 2 vehicles (95, accounting for 51.9%) and females with 2 vehicles (76, making up 52.2%).
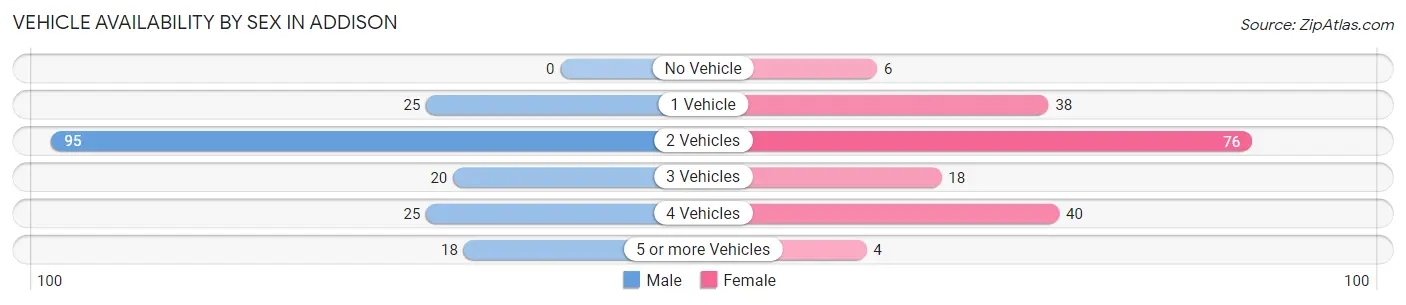
| Vehicles Available | Male | Female |
| No Vehicle | 0 (0.0%) | 6 (3.3%) |
| 1 Vehicle | 25 (13.7%) | 38 (20.9%) |
| 2 Vehicles | 95 (51.9%) | 76 (41.8%) |
| 3 Vehicles | 20 (10.9%) | 18 (9.9%) |
| 4 Vehicles | 25 (13.7%) | 40 (22.0%) |
| 5 or more Vehicles | 18 (9.8%) | 4 (2.2%) |
| Total | 183 (100.0%) | 182 (100.0%) |
Commute Time in Addison
The most frequently occuring commute durations in Addison are 90 or more minutes (51 commuters, 15.2%), 5 to 9 minutes (46 commuters, 13.7%), and 10 to 14 minutes (44 commuters, 13.1%).
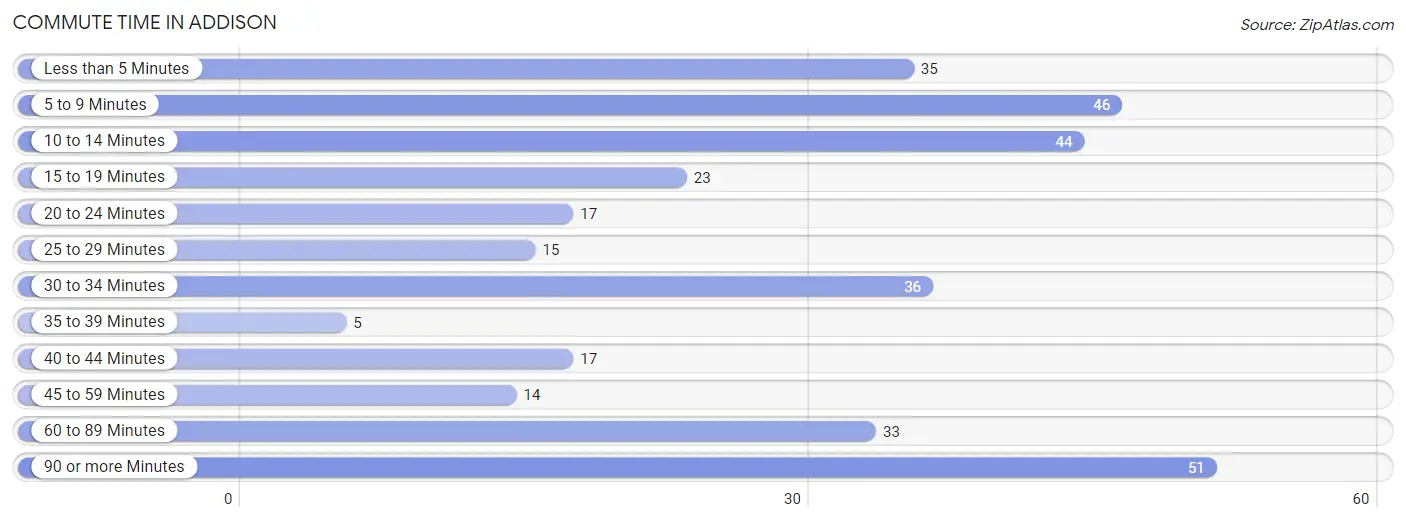
| Commute Time | # Commuters | % Commuters |
| Less than 5 Minutes | 35 | 10.4% |
| 5 to 9 Minutes | 46 | 13.7% |
| 10 to 14 Minutes | 44 | 13.1% |
| 15 to 19 Minutes | 23 | 6.9% |
| 20 to 24 Minutes | 17 | 5.1% |
| 25 to 29 Minutes | 15 | 4.5% |
| 30 to 34 Minutes | 36 | 10.7% |
| 35 to 39 Minutes | 5 | 1.5% |
| 40 to 44 Minutes | 17 | 5.1% |
| 45 to 59 Minutes | 14 | 4.2% |
| 60 to 89 Minutes | 33 | 9.8% |
| 90 or more Minutes | 51 | 15.2% |
Commute Time by Sex in Addison
The most common commute times in Addison are 90 or more minutes (25 commuters, 14.7%) for males and 5 to 9 minutes (26 commuters, 15.7%) for females.
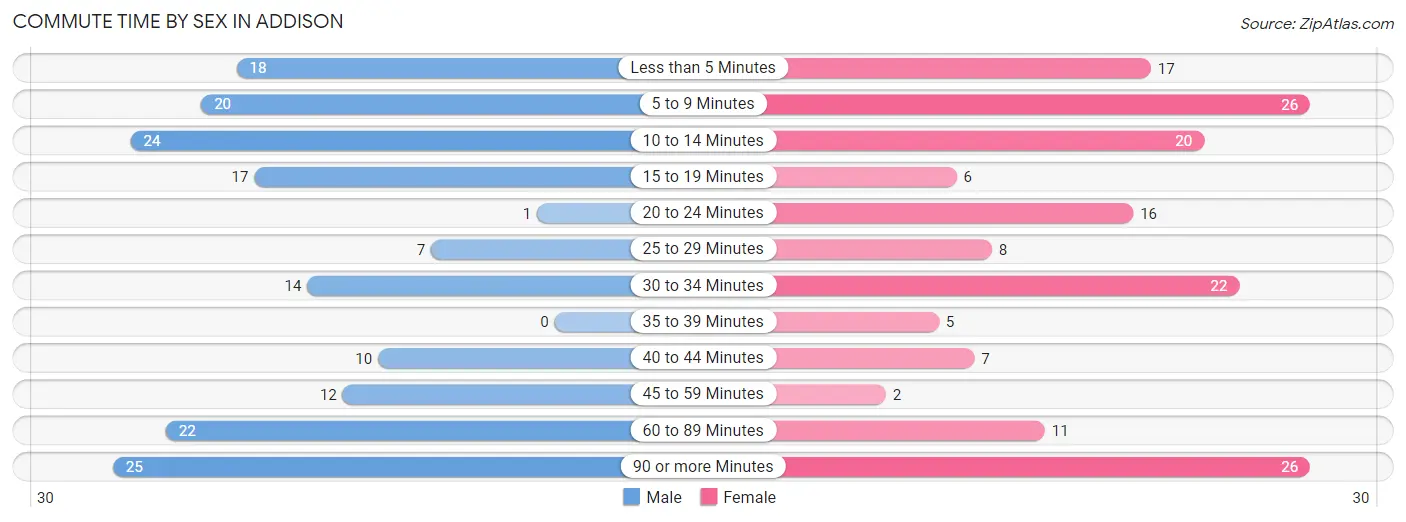
| Commute Time | Male | Female |
| Less than 5 Minutes | 18 (10.6%) | 17 (10.2%) |
| 5 to 9 Minutes | 20 (11.8%) | 26 (15.7%) |
| 10 to 14 Minutes | 24 (14.1%) | 20 (12.0%) |
| 15 to 19 Minutes | 17 (10.0%) | 6 (3.6%) |
| 20 to 24 Minutes | 1 (0.6%) | 16 (9.6%) |
| 25 to 29 Minutes | 7 (4.1%) | 8 (4.8%) |
| 30 to 34 Minutes | 14 (8.2%) | 22 (13.3%) |
| 35 to 39 Minutes | 0 (0.0%) | 5 (3.0%) |
| 40 to 44 Minutes | 10 (5.9%) | 7 (4.2%) |
| 45 to 59 Minutes | 12 (7.1%) | 2 (1.2%) |
| 60 to 89 Minutes | 22 (12.9%) | 11 (6.6%) |
| 90 or more Minutes | 25 (14.7%) | 26 (15.7%) |
Time of Departure to Work by Sex in Addison
The most frequent times of departure to work in Addison are 6:30 AM to 6:59 AM (54, 31.8%) for males and 7:00 AM to 7:29 AM (50, 30.1%) for females.
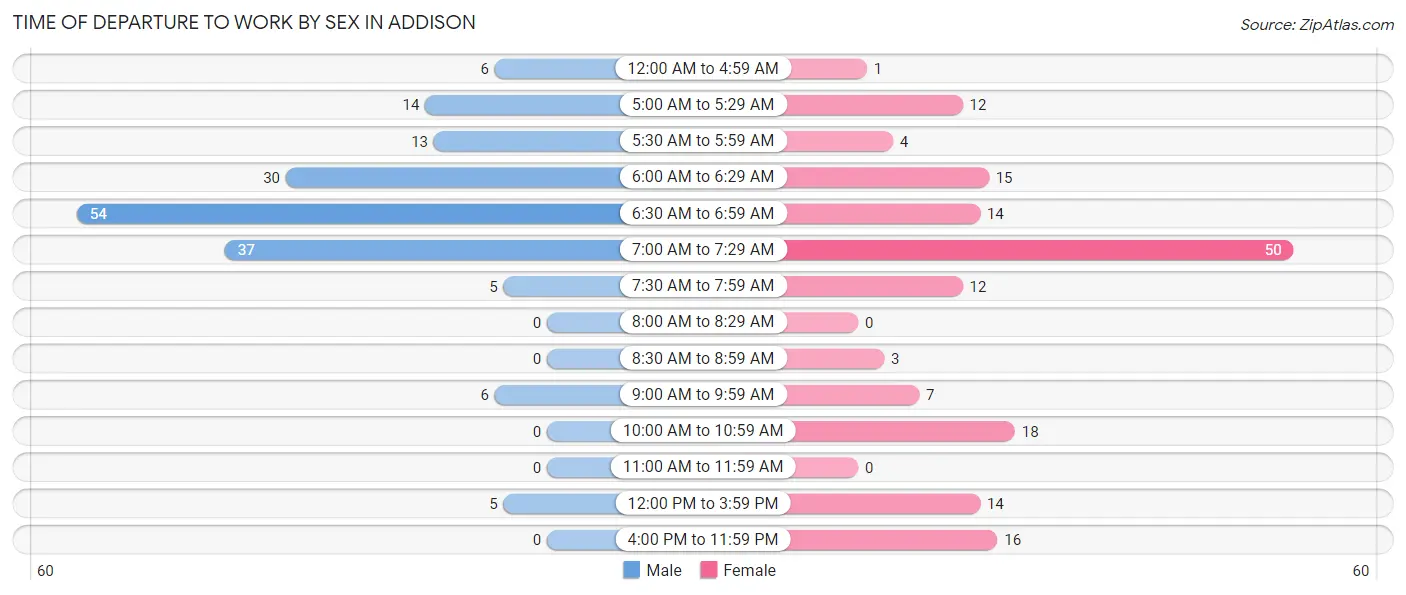
| Time of Departure | Male | Female |
| 12:00 AM to 4:59 AM | 6 (3.5%) | 1 (0.6%) |
| 5:00 AM to 5:29 AM | 14 (8.2%) | 12 (7.2%) |
| 5:30 AM to 5:59 AM | 13 (7.6%) | 4 (2.4%) |
| 6:00 AM to 6:29 AM | 30 (17.6%) | 15 (9.0%) |
| 6:30 AM to 6:59 AM | 54 (31.8%) | 14 (8.4%) |
| 7:00 AM to 7:29 AM | 37 (21.8%) | 50 (30.1%) |
| 7:30 AM to 7:59 AM | 5 (2.9%) | 12 (7.2%) |
| 8:00 AM to 8:29 AM | 0 (0.0%) | 0 (0.0%) |
| 8:30 AM to 8:59 AM | 0 (0.0%) | 3 (1.8%) |
| 9:00 AM to 9:59 AM | 6 (3.5%) | 7 (4.2%) |
| 10:00 AM to 10:59 AM | 0 (0.0%) | 18 (10.8%) |
| 11:00 AM to 11:59 AM | 0 (0.0%) | 0 (0.0%) |
| 12:00 PM to 3:59 PM | 5 (2.9%) | 14 (8.4%) |
| 4:00 PM to 11:59 PM | 0 (0.0%) | 16 (9.6%) |
| Total | 170 (100.0%) | 166 (100.0%) |
Housing Occupancy in Addison
Occupancy by Ownership in Addison
Of the total 277 dwellings in Addison, owner-occupied units account for 190 (68.6%), while renter-occupied units make up 87 (31.4%).
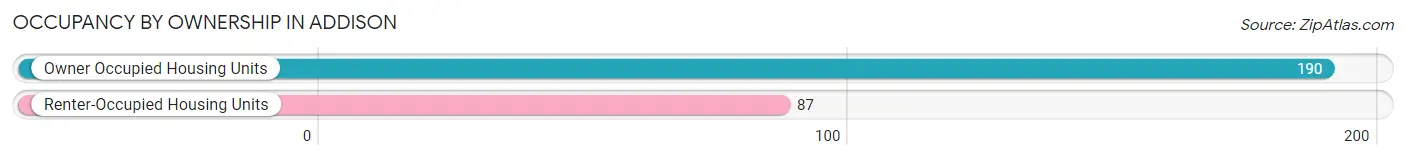
| Occupancy | # Housing Units | % Housing Units |
| Owner Occupied Housing Units | 190 | 68.6% |
| Renter-Occupied Housing Units | 87 | 31.4% |
| Total Occupied Housing Units | 277 | 100.0% |
Occupancy by Household Size in Addison
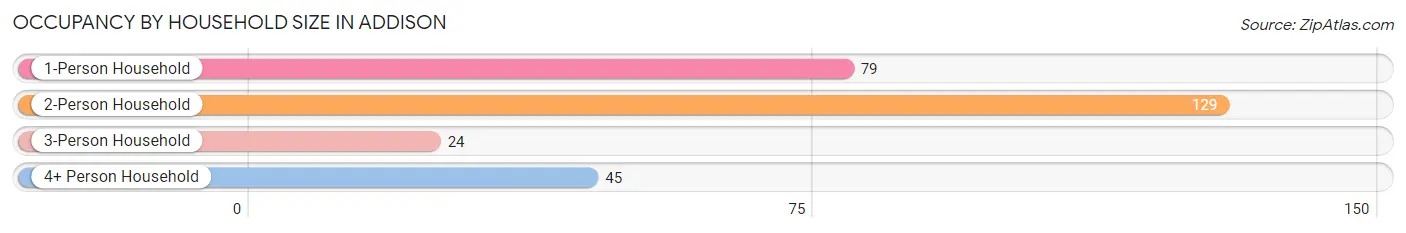
| Household Size | # Housing Units | % Housing Units |
| 1-Person Household | 79 | 28.5% |
| 2-Person Household | 129 | 46.6% |
| 3-Person Household | 24 | 8.7% |
| 4+ Person Household | 45 | 16.3% |
| Total Housing Units | 277 | 100.0% |
Occupancy by Ownership by Household Size in Addison
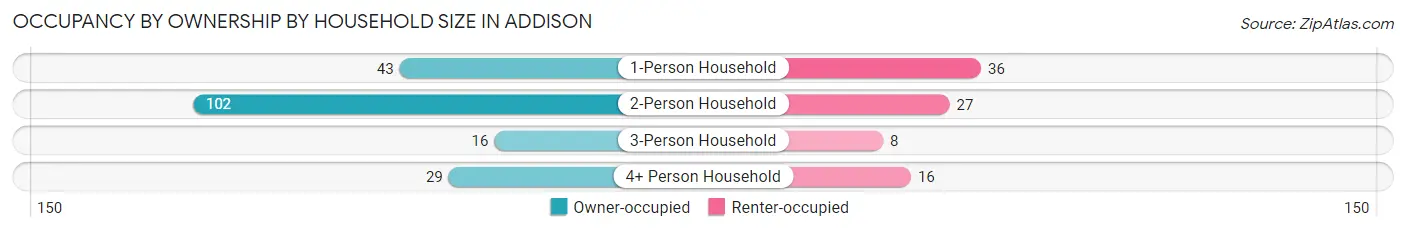
| Household Size | Owner-occupied | Renter-occupied |
| 1-Person Household | 43 (54.4%) | 36 (45.6%) |
| 2-Person Household | 102 (79.1%) | 27 (20.9%) |
| 3-Person Household | 16 (66.7%) | 8 (33.3%) |
| 4+ Person Household | 29 (64.4%) | 16 (35.6%) |
| Total Housing Units | 190 (68.6%) | 87 (31.4%) |
Occupancy by Educational Attainment in Addison
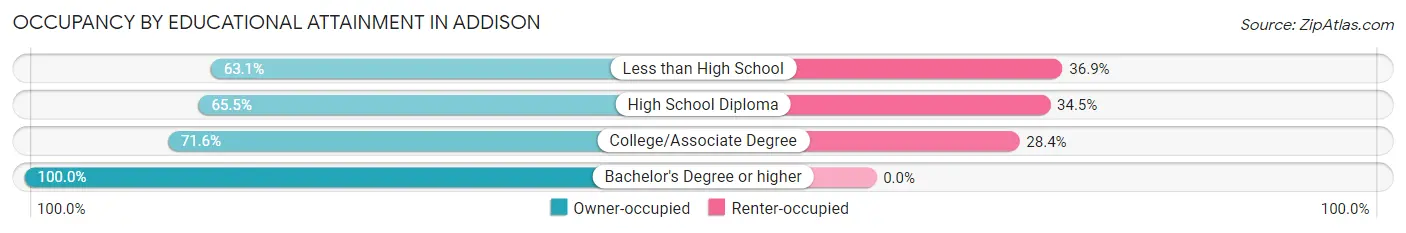
| Household Size | Owner-occupied | Renter-occupied |
| Less than High School | 41 (63.1%) | 24 (36.9%) |
| High School Diploma | 76 (65.5%) | 40 (34.5%) |
| College/Associate Degree | 58 (71.6%) | 23 (28.4%) |
| Bachelor's Degree or higher | 15 (100.0%) | 0 (0.0%) |
Occupancy by Age of Householder in Addison
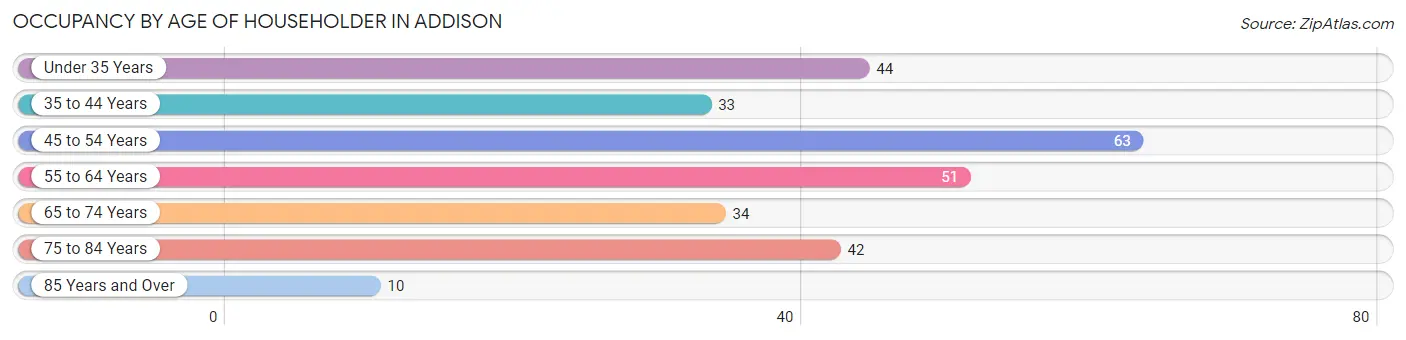
| Age Bracket | # Households | % Households |
| Under 35 Years | 44 | 15.9% |
| 35 to 44 Years | 33 | 11.9% |
| 45 to 54 Years | 63 | 22.7% |
| 55 to 64 Years | 51 | 18.4% |
| 65 to 74 Years | 34 | 12.3% |
| 75 to 84 Years | 42 | 15.2% |
| 85 Years and Over | 10 | 3.6% |
| Total | 277 | 100.0% |
Housing Finances in Addison
Median Income by Occupancy in Addison
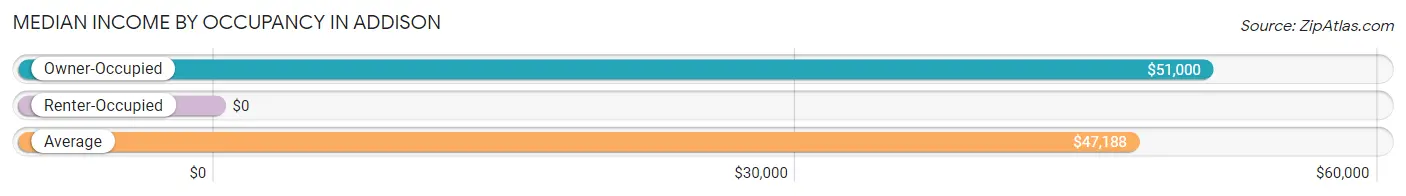
| Occupancy Type | # Households | Median Income |
| Owner-Occupied | 190 (68.6%) | $51,000 |
| Renter-Occupied | 87 (31.4%) | $0 |
| Average | 277 (100.0%) | $47,188 |
Occupancy by Householder Income Bracket in Addison
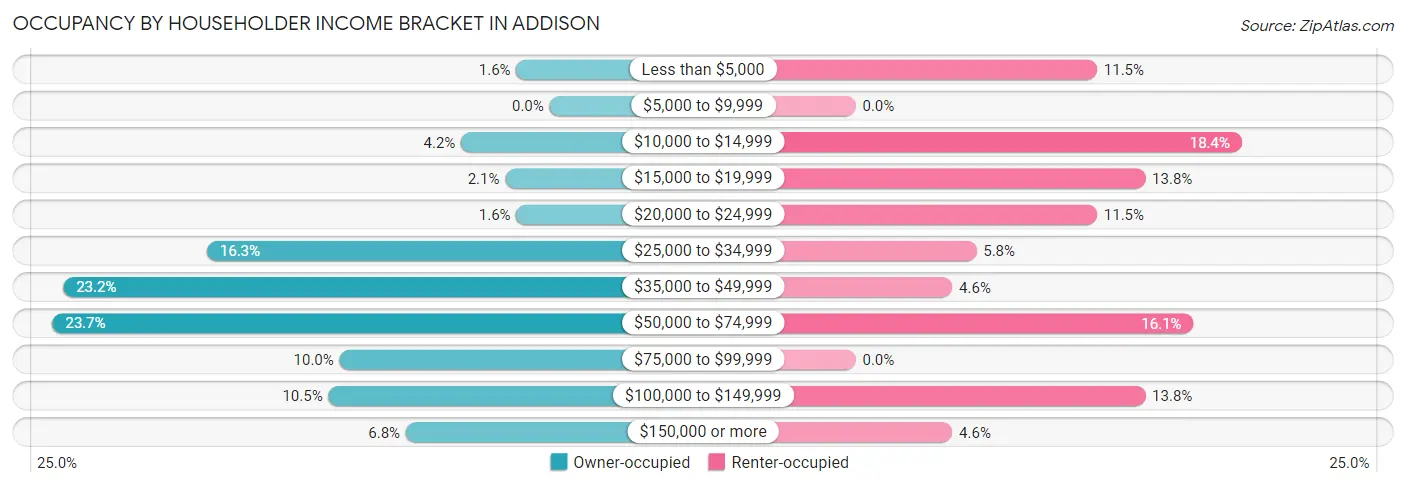
| Income Bracket | Owner-occupied | Renter-occupied |
| Less than $5,000 | 3 (1.6%) | 10 (11.5%) |
| $5,000 to $9,999 | 0 (0.0%) | 0 (0.0%) |
| $10,000 to $14,999 | 8 (4.2%) | 16 (18.4%) |
| $15,000 to $19,999 | 4 (2.1%) | 12 (13.8%) |
| $20,000 to $24,999 | 3 (1.6%) | 10 (11.5%) |
| $25,000 to $34,999 | 31 (16.3%) | 5 (5.8%) |
| $35,000 to $49,999 | 44 (23.2%) | 4 (4.6%) |
| $50,000 to $74,999 | 45 (23.7%) | 14 (16.1%) |
| $75,000 to $99,999 | 19 (10.0%) | 0 (0.0%) |
| $100,000 to $149,999 | 20 (10.5%) | 12 (13.8%) |
| $150,000 or more | 13 (6.8%) | 4 (4.6%) |
| Total | 190 (100.0%) | 87 (100.0%) |
Monthly Housing Cost Tiers in Addison
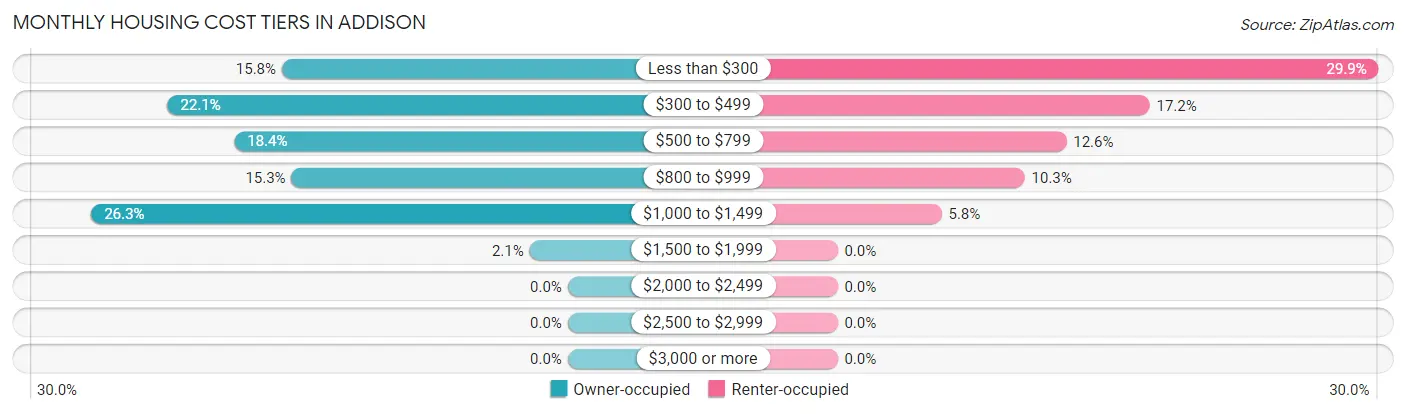
| Monthly Cost | Owner-occupied | Renter-occupied |
| Less than $300 | 30 (15.8%) | 26 (29.9%) |
| $300 to $499 | 42 (22.1%) | 15 (17.2%) |
| $500 to $799 | 35 (18.4%) | 11 (12.6%) |
| $800 to $999 | 29 (15.3%) | 9 (10.3%) |
| $1,000 to $1,499 | 50 (26.3%) | 5 (5.8%) |
| $1,500 to $1,999 | 4 (2.1%) | 0 (0.0%) |
| $2,000 to $2,499 | 0 (0.0%) | 0 (0.0%) |
| $2,500 to $2,999 | 0 (0.0%) | 0 (0.0%) |
| $3,000 or more | 0 (0.0%) | 0 (0.0%) |
| Total | 190 (100.0%) | 87 (100.0%) |
Physical Housing Characteristics in Addison
Housing Structures in Addison
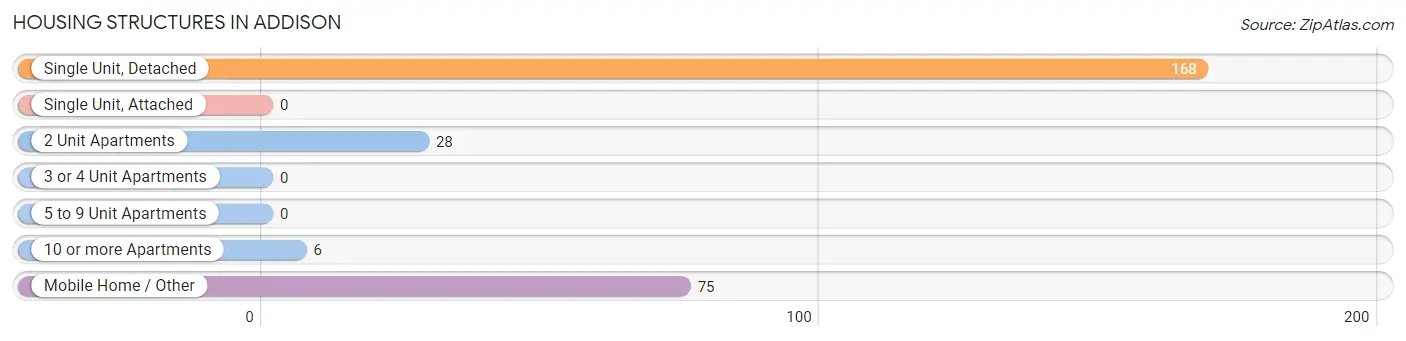
| Structure Type | # Housing Units | % Housing Units |
| Single Unit, Detached | 168 | 60.7% |
| Single Unit, Attached | 0 | 0.0% |
| 2 Unit Apartments | 28 | 10.1% |
| 3 or 4 Unit Apartments | 0 | 0.0% |
| 5 to 9 Unit Apartments | 0 | 0.0% |
| 10 or more Apartments | 6 | 2.2% |
| Mobile Home / Other | 75 | 27.1% |
| Total | 277 | 100.0% |
Housing Structures by Occupancy in Addison
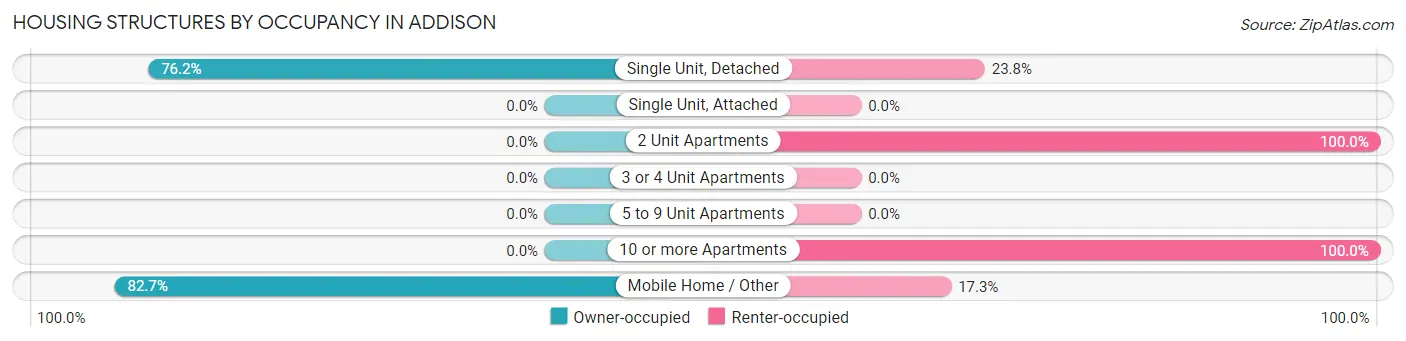
| Structure Type | Owner-occupied | Renter-occupied |
| Single Unit, Detached | 128 (76.2%) | 40 (23.8%) |
| Single Unit, Attached | 0 (0.0%) | 0 (0.0%) |
| 2 Unit Apartments | 0 (0.0%) | 28 (100.0%) |
| 3 or 4 Unit Apartments | 0 (0.0%) | 0 (0.0%) |
| 5 to 9 Unit Apartments | 0 (0.0%) | 0 (0.0%) |
| 10 or more Apartments | 0 (0.0%) | 6 (100.0%) |
| Mobile Home / Other | 62 (82.7%) | 13 (17.3%) |
| Total | 190 (68.6%) | 87 (31.4%) |
Housing Structures by Number of Rooms in Addison
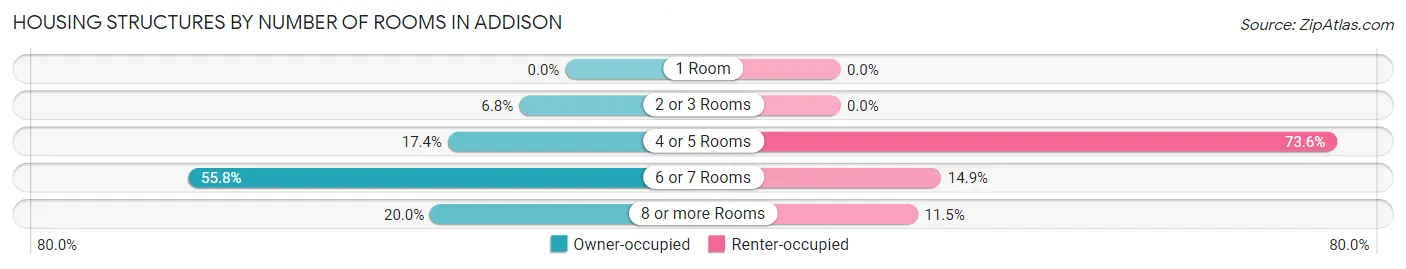
| Number of Rooms | Owner-occupied | Renter-occupied |
| 1 Room | 0 (0.0%) | 0 (0.0%) |
| 2 or 3 Rooms | 13 (6.8%) | 0 (0.0%) |
| 4 or 5 Rooms | 33 (17.4%) | 64 (73.6%) |
| 6 or 7 Rooms | 106 (55.8%) | 13 (14.9%) |
| 8 or more Rooms | 38 (20.0%) | 10 (11.5%) |
| Total | 190 (100.0%) | 87 (100.0%) |
Housing Structure by Heating Type in Addison
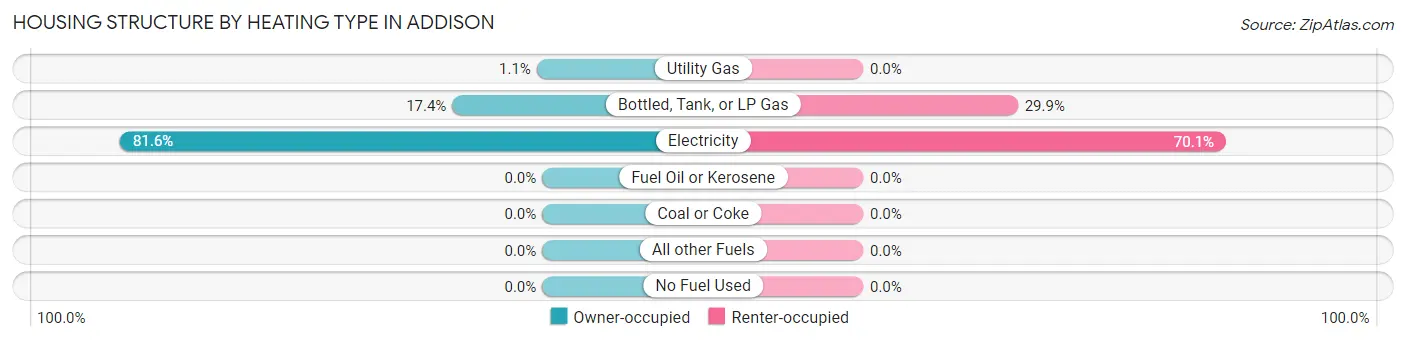
| Heating Type | Owner-occupied | Renter-occupied |
| Utility Gas | 2 (1.1%) | 0 (0.0%) |
| Bottled, Tank, or LP Gas | 33 (17.4%) | 26 (29.9%) |
| Electricity | 155 (81.6%) | 61 (70.1%) |
| Fuel Oil or Kerosene | 0 (0.0%) | 0 (0.0%) |
| Coal or Coke | 0 (0.0%) | 0 (0.0%) |
| All other Fuels | 0 (0.0%) | 0 (0.0%) |
| No Fuel Used | 0 (0.0%) | 0 (0.0%) |
| Total | 190 (100.0%) | 87 (100.0%) |
Household Vehicle Usage in Addison
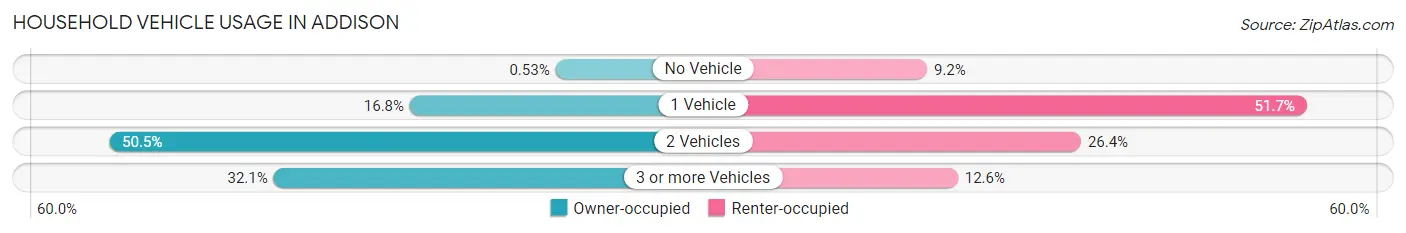
| Vehicles per Household | Owner-occupied | Renter-occupied |
| No Vehicle | 1 (0.5%) | 8 (9.2%) |
| 1 Vehicle | 32 (16.8%) | 45 (51.7%) |
| 2 Vehicles | 96 (50.5%) | 23 (26.4%) |
| 3 or more Vehicles | 61 (32.1%) | 11 (12.6%) |
| Total | 190 (100.0%) | 87 (100.0%) |
Real Estate & Mortgages in Addison
Real Estate and Mortgage Overview in Addison
| Characteristic | Without Mortgage | With Mortgage |
| Housing Units | 94 | 96 |
| Median Property Value | $83,300 | $100,000 |
| Median Household Income | $57,500 | $11 |
| Monthly Housing Costs | $382 | $0 |
| Real Estate Taxes | $241 | $20 |
Property Value by Mortgage Status in Addison
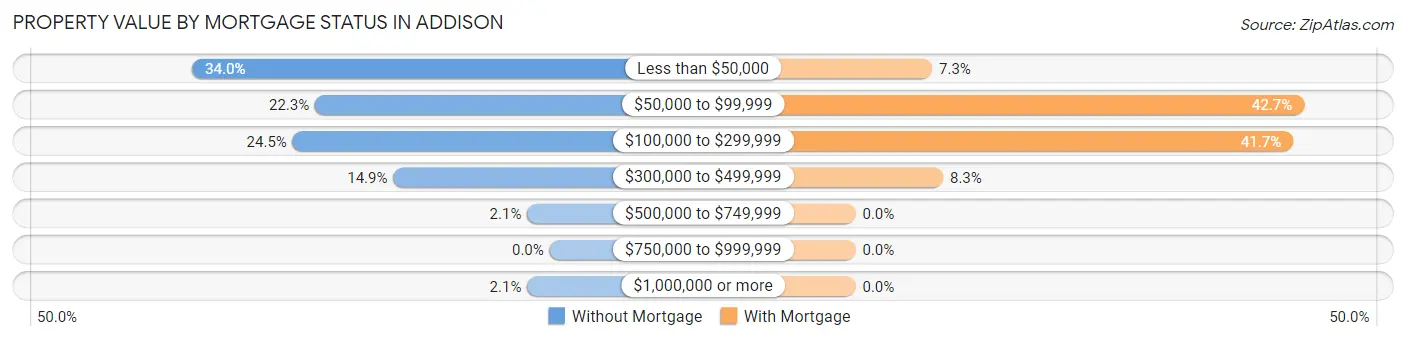
| Property Value | Without Mortgage | With Mortgage |
| Less than $50,000 | 32 (34.0%) | 7 (7.3%) |
| $50,000 to $99,999 | 21 (22.3%) | 41 (42.7%) |
| $100,000 to $299,999 | 23 (24.5%) | 40 (41.7%) |
| $300,000 to $499,999 | 14 (14.9%) | 8 (8.3%) |
| $500,000 to $749,999 | 2 (2.1%) | 0 (0.0%) |
| $750,000 to $999,999 | 0 (0.0%) | 0 (0.0%) |
| $1,000,000 or more | 2 (2.1%) | 0 (0.0%) |
| Total | 94 (100.0%) | 96 (100.0%) |
Household Income by Mortgage Status in Addison
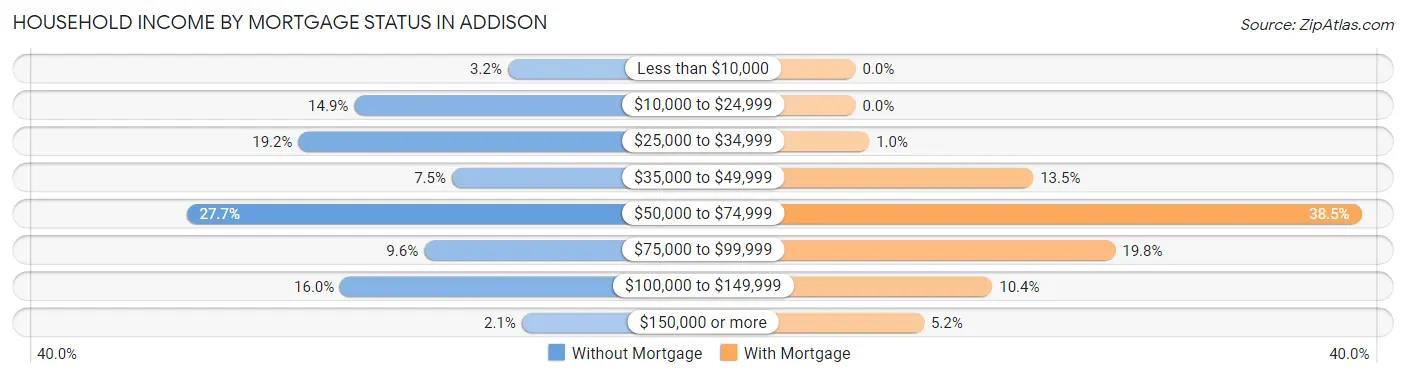
| Household Income | Without Mortgage | With Mortgage |
| Less than $10,000 | 3 (3.2%) | 0 (0.0%) |
| $10,000 to $24,999 | 14 (14.9%) | 0 (0.0%) |
| $25,000 to $34,999 | 18 (19.2%) | 1 (1.0%) |
| $35,000 to $49,999 | 7 (7.4%) | 13 (13.5%) |
| $50,000 to $74,999 | 26 (27.7%) | 37 (38.5%) |
| $75,000 to $99,999 | 9 (9.6%) | 19 (19.8%) |
| $100,000 to $149,999 | 15 (16.0%) | 10 (10.4%) |
| $150,000 or more | 2 (2.1%) | 5 (5.2%) |
| Total | 94 (100.0%) | 96 (100.0%) |
Property Value to Household Income Ratio in Addison
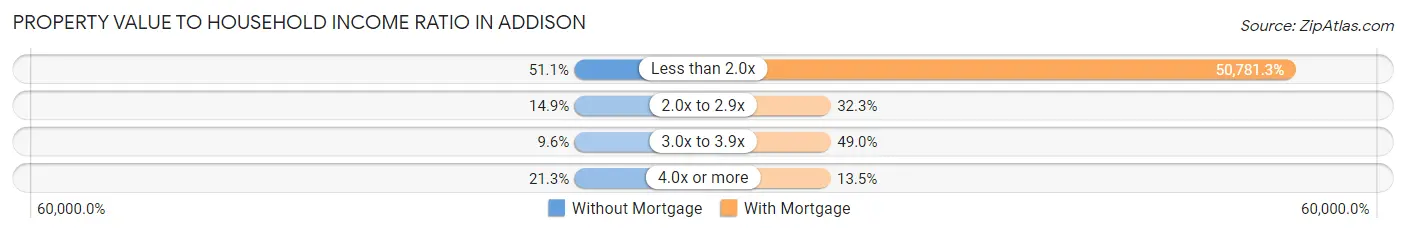
| Value-to-Income Ratio | Without Mortgage | With Mortgage |
| Less than 2.0x | 48 (51.1%) | 48,750 (50,781.2%) |
| 2.0x to 2.9x | 14 (14.9%) | 31 (32.3%) |
| 3.0x to 3.9x | 9 (9.6%) | 47 (49.0%) |
| 4.0x or more | 20 (21.3%) | 13 (13.5%) |
| Total | 94 (100.0%) | 96 (100.0%) |
Real Estate Taxes by Mortgage Status in Addison
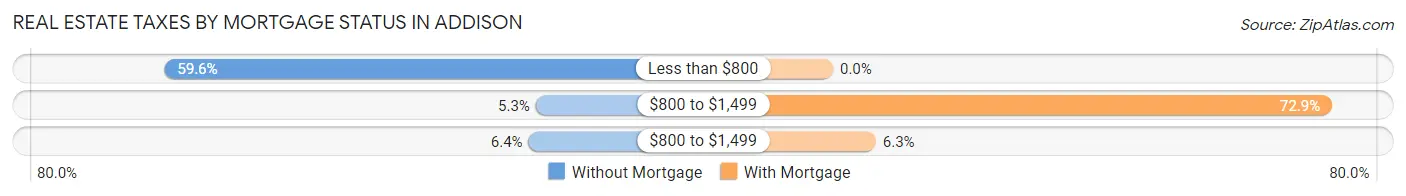
| Property Taxes | Without Mortgage | With Mortgage |
| Less than $800 | 56 (59.6%) | 0 (0.0%) |
| $800 to $1,499 | 5 (5.3%) | 70 (72.9%) |
| $800 to $1,499 | 6 (6.4%) | 6 (6.2%) |
| Total | 94 (100.0%) | 96 (100.0%) |
Health & Disability in Addison
Health Insurance Coverage by Age in Addison
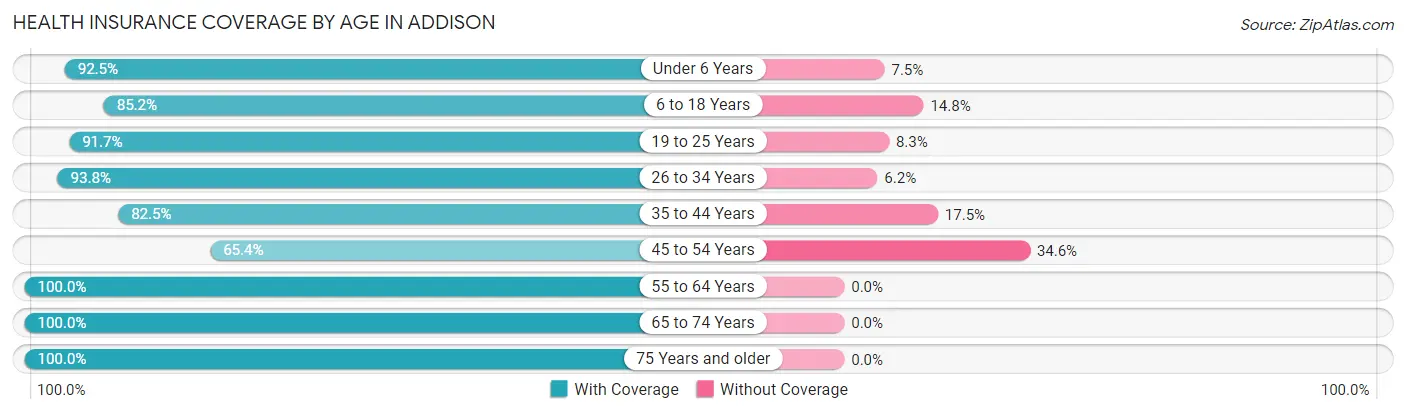
| Age Bracket | With Coverage | Without Coverage |
| Under 6 Years | 74 (92.5%) | 6 (7.5%) |
| 6 to 18 Years | 75 (85.2%) | 13 (14.8%) |
| 19 to 25 Years | 44 (91.7%) | 4 (8.3%) |
| 26 to 34 Years | 76 (93.8%) | 5 (6.2%) |
| 35 to 44 Years | 52 (82.5%) | 11 (17.5%) |
| 45 to 54 Years | 68 (65.4%) | 36 (34.6%) |
| 55 to 64 Years | 93 (100.0%) | 0 (0.0%) |
| 65 to 74 Years | 42 (100.0%) | 0 (0.0%) |
| 75 Years and older | 66 (100.0%) | 0 (0.0%) |
| Total | 590 (88.7%) | 75 (11.3%) |
Health Insurance Coverage by Citizenship Status in Addison
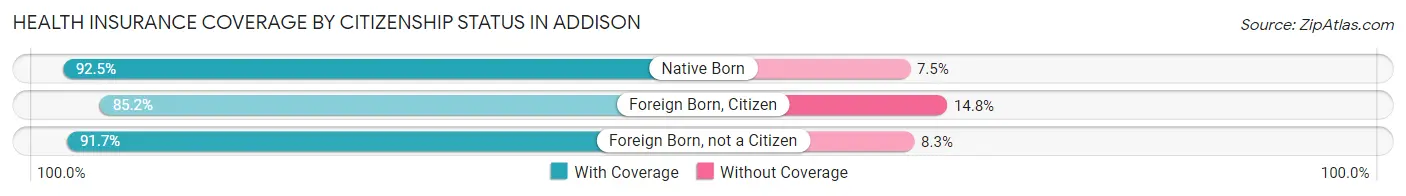
| Citizenship Status | With Coverage | Without Coverage |
| Native Born | 74 (92.5%) | 6 (7.5%) |
| Foreign Born, Citizen | 75 (85.2%) | 13 (14.8%) |
| Foreign Born, not a Citizen | 44 (91.7%) | 4 (8.3%) |
Health Insurance Coverage by Household Income in Addison
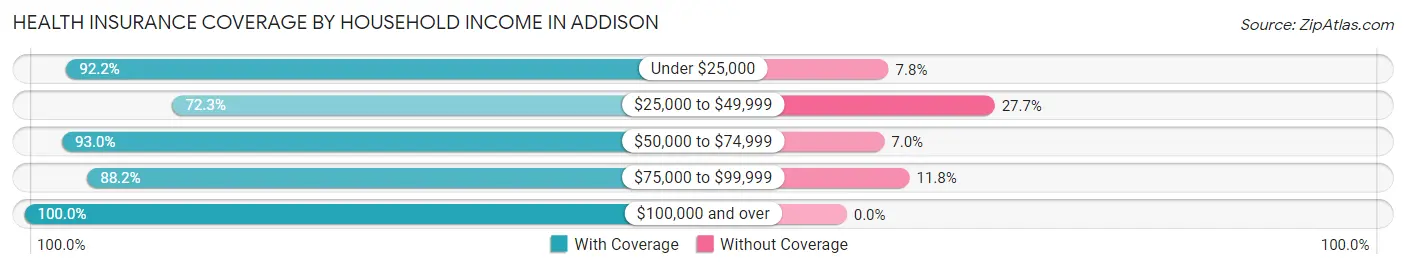
| Household Income | With Coverage | Without Coverage |
| Under $25,000 | 94 (92.2%) | 8 (7.8%) |
| $25,000 to $49,999 | 120 (72.3%) | 46 (27.7%) |
| $50,000 to $74,999 | 198 (93.0%) | 15 (7.0%) |
| $75,000 to $99,999 | 45 (88.2%) | 6 (11.8%) |
| $100,000 and over | 133 (100.0%) | 0 (0.0%) |
Public vs Private Health Insurance Coverage by Age in Addison
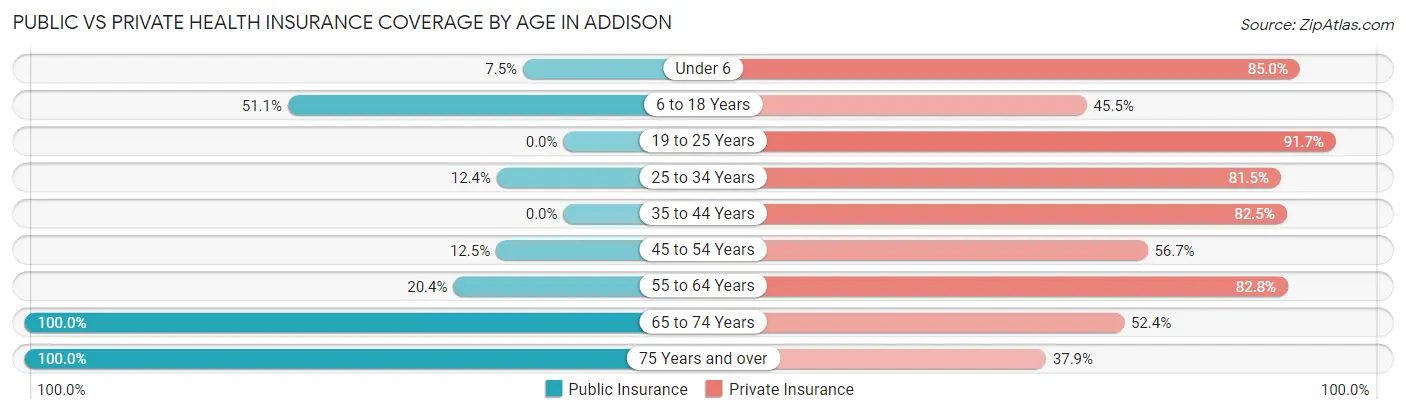
| Age Bracket | Public Insurance | Private Insurance |
| Under 6 | 6 (7.5%) | 68 (85.0%) |
| 6 to 18 Years | 45 (51.1%) | 40 (45.5%) |
| 19 to 25 Years | 0 (0.0%) | 44 (91.7%) |
| 25 to 34 Years | 10 (12.3%) | 66 (81.5%) |
| 35 to 44 Years | 0 (0.0%) | 52 (82.5%) |
| 45 to 54 Years | 13 (12.5%) | 59 (56.7%) |
| 55 to 64 Years | 19 (20.4%) | 77 (82.8%) |
| 65 to 74 Years | 42 (100.0%) | 22 (52.4%) |
| 75 Years and over | 66 (100.0%) | 25 (37.9%) |
| Total | 201 (30.2%) | 453 (68.1%) |
Disability Status by Sex by Age in Addison
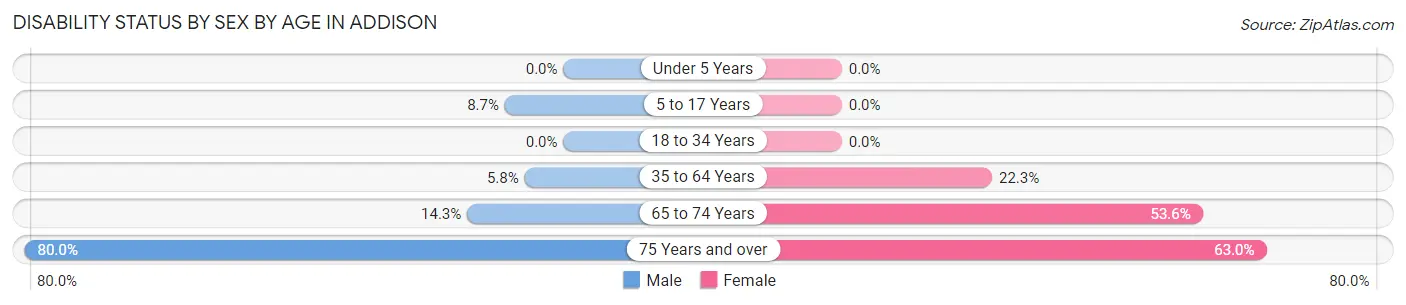
| Age Bracket | Male | Female |
| Under 5 Years | 0 (0.0%) | 0 (0.0%) |
| 5 to 17 Years | 4 (8.7%) | 0 (0.0%) |
| 18 to 34 Years | 0 (0.0%) | 0 (0.0%) |
| 35 to 64 Years | 8 (5.8%) | 27 (22.3%) |
| 65 to 74 Years | 2 (14.3%) | 15 (53.6%) |
| 75 Years and over | 16 (80.0%) | 29 (63.0%) |
Disability Class by Sex by Age in Addison
Disability Class: Hearing Difficulty
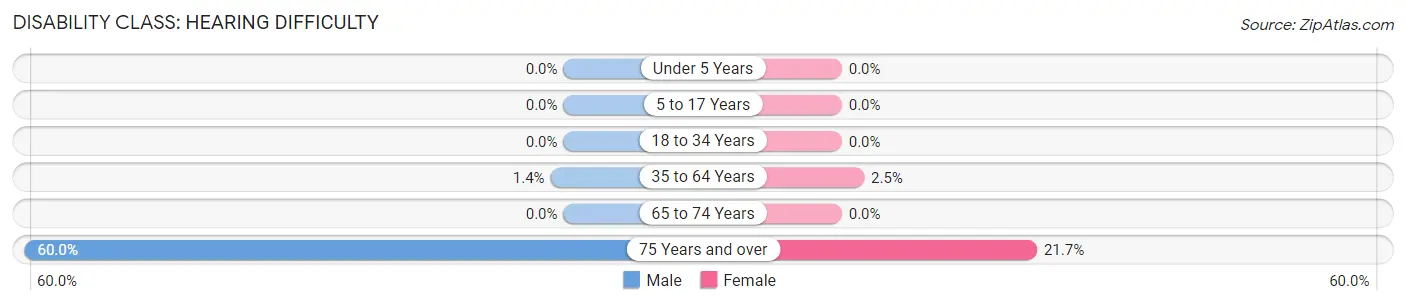
| Age Bracket | Male | Female |
| Under 5 Years | 0 (0.0%) | 0 (0.0%) |
| 5 to 17 Years | 0 (0.0%) | 0 (0.0%) |
| 18 to 34 Years | 0 (0.0%) | 0 (0.0%) |
| 35 to 64 Years | 2 (1.4%) | 3 (2.5%) |
| 65 to 74 Years | 0 (0.0%) | 0 (0.0%) |
| 75 Years and over | 12 (60.0%) | 10 (21.7%) |
Disability Class: Vision Difficulty
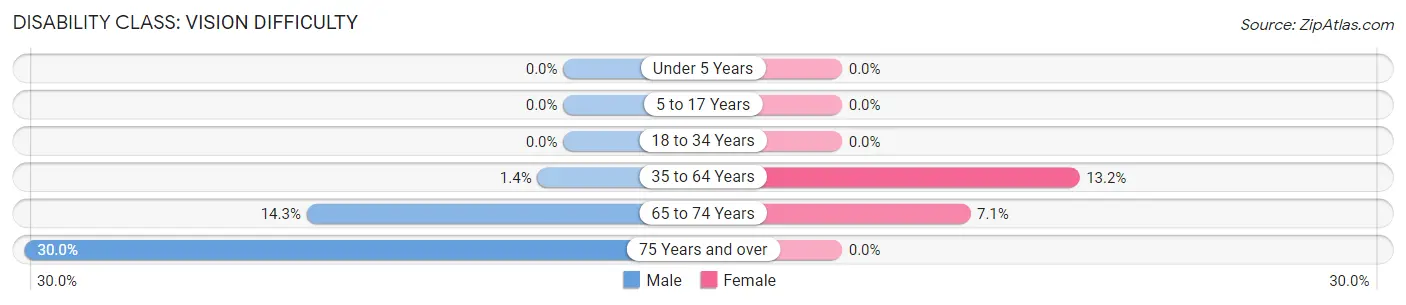
| Age Bracket | Male | Female |
| Under 5 Years | 0 (0.0%) | 0 (0.0%) |
| 5 to 17 Years | 0 (0.0%) | 0 (0.0%) |
| 18 to 34 Years | 0 (0.0%) | 0 (0.0%) |
| 35 to 64 Years | 2 (1.4%) | 16 (13.2%) |
| 65 to 74 Years | 2 (14.3%) | 2 (7.1%) |
| 75 Years and over | 6 (30.0%) | 0 (0.0%) |
Disability Class: Cognitive Difficulty
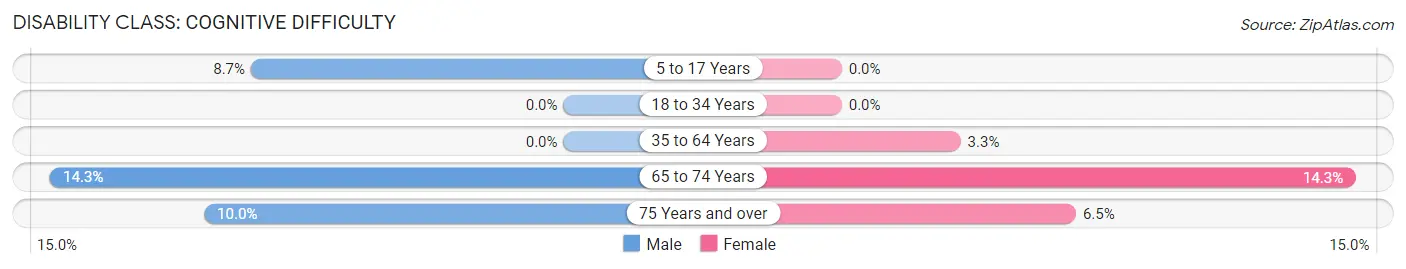
| Age Bracket | Male | Female |
| 5 to 17 Years | 4 (8.7%) | 0 (0.0%) |
| 18 to 34 Years | 0 (0.0%) | 0 (0.0%) |
| 35 to 64 Years | 0 (0.0%) | 4 (3.3%) |
| 65 to 74 Years | 2 (14.3%) | 4 (14.3%) |
| 75 Years and over | 2 (10.0%) | 3 (6.5%) |
Disability Class: Ambulatory Difficulty
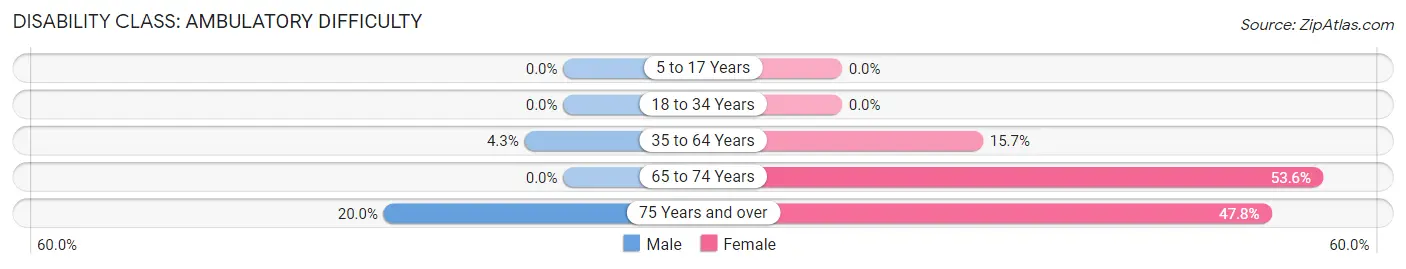
| Age Bracket | Male | Female |
| 5 to 17 Years | 0 (0.0%) | 0 (0.0%) |
| 18 to 34 Years | 0 (0.0%) | 0 (0.0%) |
| 35 to 64 Years | 6 (4.3%) | 19 (15.7%) |
| 65 to 74 Years | 0 (0.0%) | 15 (53.6%) |
| 75 Years and over | 4 (20.0%) | 22 (47.8%) |
Disability Class: Self-Care Difficulty
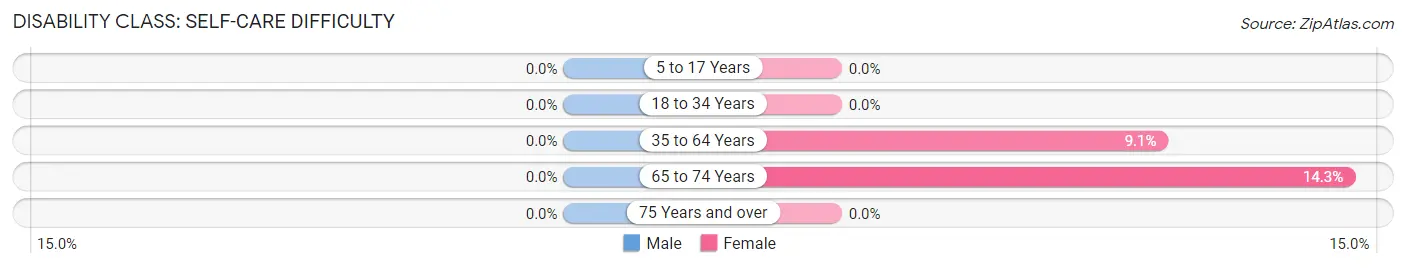
| Age Bracket | Male | Female |
| 5 to 17 Years | 0 (0.0%) | 0 (0.0%) |
| 18 to 34 Years | 0 (0.0%) | 0 (0.0%) |
| 35 to 64 Years | 0 (0.0%) | 11 (9.1%) |
| 65 to 74 Years | 0 (0.0%) | 4 (14.3%) |
| 75 Years and over | 0 (0.0%) | 0 (0.0%) |
Technology Access in Addison
Computing Device Access in Addison
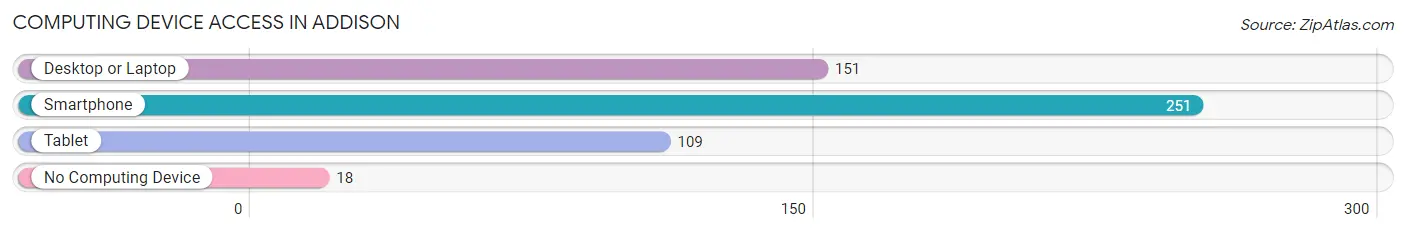
| Device Type | # Households | % Households |
| Desktop or Laptop | 151 | 54.5% |
| Smartphone | 251 | 90.6% |
| Tablet | 109 | 39.4% |
| No Computing Device | 18 | 6.5% |
| Total | 277 | 100.0% |
Internet Access in Addison
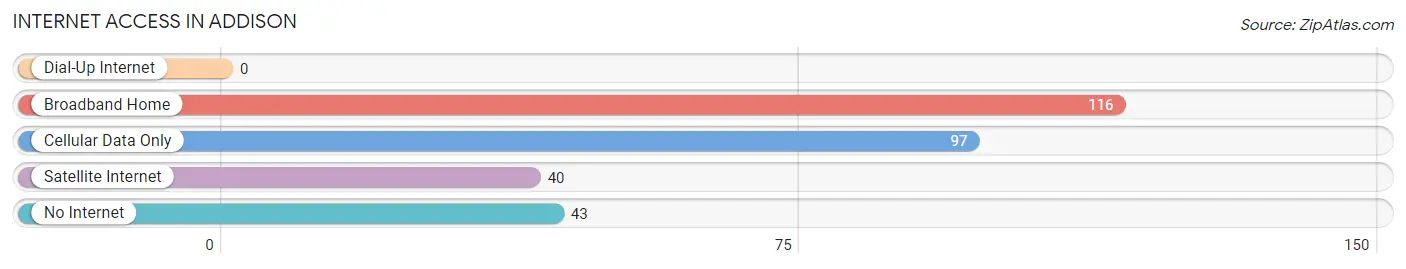
| Internet Type | # Households | % Households |
| Dial-Up Internet | 0 | 0.0% |
| Broadband Home | 116 | 41.9% |
| Cellular Data Only | 97 | 35.0% |
| Satellite Internet | 40 | 14.4% |
| No Internet | 43 | 15.5% |
| Total | 277 | 100.0% |
Addison Summary
Addison, Alabama is a small town located in Winston County, Alabama. It is situated in the foothills of the Appalachian Mountains and is part of the Birmingham-Hoover Metropolitan Statistical Area. The town has a population of 1,845 people, according to the 2010 census.
Geography
Addison is located in the northwest corner of Winston County, Alabama, at the intersection of U.S. Highway 278 and Alabama State Route 129. The town is situated in the foothills of the Appalachian Mountains and is surrounded by the Bankhead National Forest. The town is located approximately 30 miles west of Birmingham and is part of the Birmingham-Hoover Metropolitan Statistical Area.
The terrain of Addison is mostly hilly and forested, with some flat areas. The town is located at an elevation of 890 feet above sea level. The climate of Addison is humid subtropical, with hot, humid summers and mild winters. The average annual temperature is 64°F, and the average annual precipitation is 52 inches.
History
Addison was founded in 1883 by a group of settlers from Georgia. The town was named after Addison Smith, one of the original settlers. The town was incorporated in 1887 and was the county seat of Winston County until the county seat was moved to Double Springs in 1895.
Addison was a small farming community until the early 20th century, when the town began to grow due to the timber industry. The town was also home to several coal mines, which provided employment for many of the town’s residents.
In the 1950s, the town began to decline due to the decline of the timber and coal industries. The town’s population decreased from 2,000 in 1950 to 1,845 in 2010.
Economy
The economy of Addison is largely based on agriculture and tourism. The town is home to several farms, which produce a variety of crops, including corn, soybeans, cotton, and hay. The town is also home to several tourist attractions, including the Bankhead National Forest, the Winston County Historical Museum, and the Winston County Fairgrounds.
Demographics
According to the 2010 census, Addison has a population of 1,845 people. The racial makeup of the town is 95.3% White, 2.2% African American, 0.2% Native American, 0.2% Asian, 0.1% Pacific Islander, 0.7% from other races, and 1.3% from two or more races. The median household income is $30,938, and the median family income is $37,813. The per capita income is $17,845.
Conclusion
Addison, Alabama is a small town located in Winston County, Alabama. It is situated in the foothills of the Appalachian Mountains and is part of the Birmingham-Hoover Metropolitan Statistical Area. The town has a population of 1,845 people, according to the 2010 census. The economy of Addison is largely based on agriculture and tourism, and the town is home to several farms and tourist attractions. The racial makeup of the town is 95.3% White, 2.2% African American, 0.2% Native American, 0.2% Asian, 0.1% Pacific Islander, 0.7% from other races, and 1.3% from two or more races. The median household income is $30,938, and the median family income is $37,813.
Common Questions
What is Per Capita Income in Addison?
Per Capita income in Addison is $26,614.
What is the Median Family Income in Addison?
Median Family Income in Addison is $52,083.
What is the Median Household income in Addison?
Median Household Income in Addison is $47,188.
What is Income or Wage Gap in Addison?
Income or Wage Gap in Addison is 45.4%.
Women in Addison earn 54.6 cents for every dollar earned by a man.
What is Inequality or Gini Index in Addison?
Inequality or Gini Index in Addison is 0.43.
What is the Total Population of Addison?
Total Population of Addison is 665.
What is the Total Male Population of Addison?
Total Male Population of Addison is 320.
What is the Total Female Population of Addison?
Total Female Population of Addison is 345.
What is the Ratio of Males per 100 Females in Addison?
There are 92.75 Males per 100 Females in Addison.
What is the Ratio of Females per 100 Males in Addison?
There are 107.81 Females per 100 Males in Addison.
What is the Median Population Age in Addison?
Median Population Age in Addison is 38.4 Years.
What is the Average Family Size in Addison
Average Family Size in Addison is 2.9 People.
What is the Average Household Size in Addison
Average Household Size in Addison is 2.4 People.
How Large is the Labor Force in Addison?
There are 368 People in the Labor Forcein in Addison.
What is the Percentage of People in the Labor Force in Addison?
72.2% of People are in the Labor Force in Addison.
What is the Unemployment Rate in Addison?
Unemployment Rate in Addison is 0.8%.