Zip Codes with the Highest Percentage of Population Employed in Accommodation & Food Services in Laramie, WY
RELATED REPORTS & OPTIONS
Accommodation & Food Services
Laramie
Compare Zip Codes
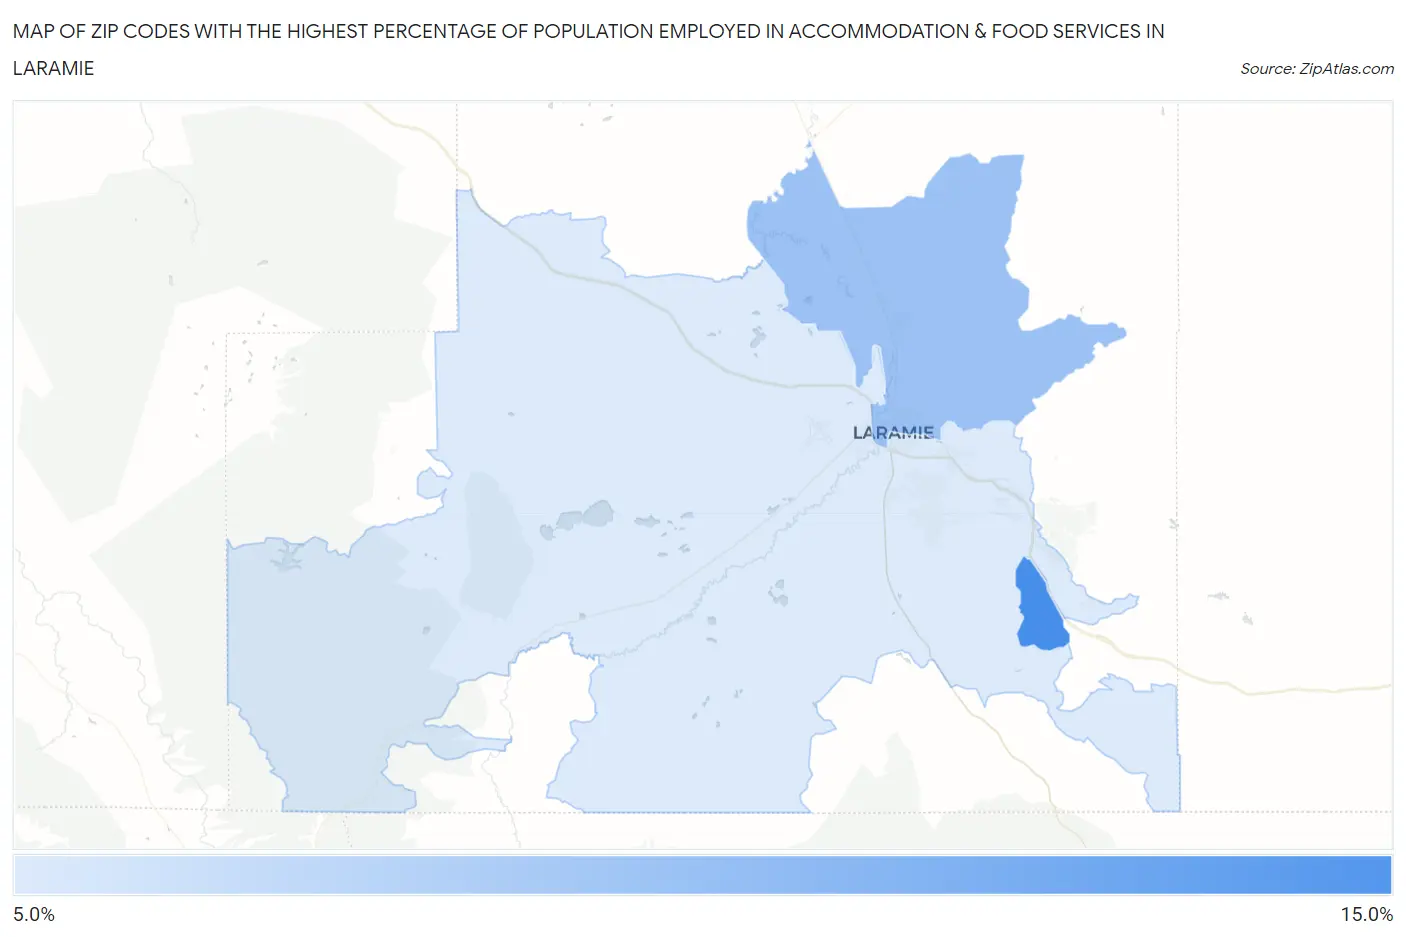
Map of Zip Codes with the Highest Percentage of Population Employed in Accommodation & Food Services in Laramie
6.7%
12.8%
Zip Codes with the Highest Percentage of Population Employed in Accommodation & Food Services in Laramie, WY
| Zip Code | % Employed | vs State | vs National | |
| 1. | 82073 | 12.8% | 7.8%(+4.99)#24 | 6.9%(+5.94)#2,425 |
| 2. | 82072 | 9.3% | 7.8%(+1.45)#36 | 6.9%(+2.40)#5,530 |
| 3. | 82070 | 6.7% | 7.8%(-1.17)#56 | 6.9%(-0.227)#11,342 |
1
Common Questions
What are the Top Zip Codes with the Highest Percentage of Population Employed in Accommodation & Food Services in Laramie, WY?
Top Zip Codes with the Highest Percentage of Population Employed in Accommodation & Food Services in Laramie, WY are:
What zip code has the Highest Percentage of Population Employed in Accommodation & Food Services in Laramie, WY?
82073 has the Highest Percentage of Population Employed in Accommodation & Food Services in Laramie, WY with 12.8%.
What is the Percentage of Population Employed in Accommodation & Food Services in Laramie, WY?
Percentage of Population Employed in Accommodation & Food Services in Laramie is 8.5%.
What is the Percentage of Population Employed in Accommodation & Food Services in Wyoming?
Percentage of Population Employed in Accommodation & Food Services in Wyoming is 7.8%.
What is the Percentage of Population Employed in Accommodation & Food Services in the United States?
Percentage of Population Employed in Accommodation & Food Services in the United States is 6.9%.